When does the onset of multiple stellar populations in star clusters occur-III: No evidence of significant chemical variations in main-sequence stars of NGC 419
Abstract
Recent studies have revealed that the onset age for the presence of multiple stellar populations (MPs) in star clusters seems to correspond to the disappearance of the extended main-sequence turnoff (eMSTO) in young clusters, a pattern associated with stellar rotations. A speculative suggestion is that MPs might be caused by the magnetic brake, a stellar evolutionary effect linked to the rotation. In this work, we use the young massive cluster NGC 419 as a testbed. We examined if its magnetically baked MS stars would exhibit MPs. Using the deep ultraviolet and visible images observed through the Hubble Space Telescope, combined with a specific color index that is sensitive to the nitrogen (N) abundance, we examined if its late G- and K-type MS stars are affected by N variation. Our analysis reports that the morphology of its GK-type MS is most likely an SSP, and only a negligible probability that indicates a N variation up to 0.4 dex is present. We conclude that there is no significant N variation among its GK-type MS stars. The absence of a significant chemical variation among the late-type MS stars indicates that MPs might not be a specific pattern of magnetically braked stars.
1 Introduction
Almost all old globular clusters (GCs, older than 10 Gyr) are composed of multiple stellar populations (MPs). One signature of MPs is stars in GCs are not chemically homogeneous: they exhibit star-to-star variations in different elemental abundances, such as He, C, N, O, Na, Mg, Al, etc (Piotto et al., 2007; Yong et al., 2008; Carretta et al., 2009; di Criscienzo et al., 2010; Lardo et al., 2012; Wang et al., 2017; Pancino et al., 2017; Milone et al., 2019). The number of chemically enriched stars is comparable to, or greater than normal stars (Carretta et al., 2009; Milone et al., 2012b; Tang et al., 2017). However, such a chemical anomaly is rarely detected in field stars. Only a small number of stars with similar chemical anomalies are found in the Galactic field, and they are proved kinetically related to GCs (e.g., Tang et al., 2019). MPs seems an exclusive product of GCs.
MPs are detected in extragalactic clusters as well, including clusters in the Large Magellanic Cloud, Small Magellanic Cloud (LMC and SMC, Mucciarelli et al., 2009; Niederhofer et al., 2017), as well as the Fornax dwarf spheroidal galaxy (Larsen et al., 2014). For GCs in the Milky Way, no significant difference in their MPs was detected between clusters associated with different progenitors (Milone et al., 2020).
About one decade ago, clusters with ages between 1 and 2 Gyr were found to harbor an extended main-sequence turnoff (eMSTO) region (Mackey et al., 2008). The eMSTO was soon proved an ordinary feature for almost all clusters younger than 2 Gyr in the Milky Way and the LMC/SMC (Milone et al., 2009; Li et al., 2017; Cordoni et al., 2018). The most straightforward explanation to the eMSTO is their host clusters could have multiple stellar generations with different ages. However, observations focus on other properties of these clusters and their progenitors are inconsistent with this hypothesis (Bastian, & Strader, 2014; Li et al., 2014). An alternative explanation, stellar fast rotation scenario, which suggests that the complex of the turnoff (TO) region is caused by different rotations of TO stars (Bastian, & de Mink, 2009; Brandt, & Huang, 2015; D’Antona et al., 2017), was proposed and proved a promising explanation which accounts for the eMSTO (Marino et al., 2018; Sun et al., 2019a, b).
Although the complexity of MPs is strongly correlated with their host cluster mass (Milone et al., 2017; Chantereau et al., 2019; Lagioia et al., 2019), there seems an onset age for the presence of MPs. Almost all GCs older than 10 Gyr, and most clusters with ages between 2 and 10 Gyr, exhibit MPs, while all their younger counterparts (younger than 2 Gyr) do not (Martocchia et al., 2018; Li, & de Grijs, 2019a; Li et al., 2019b). Intriguingly enough, the onset age for the presence of MPs also determines the beginning of the disappearance of the eMSTO. The star-to-star chemical variations has only been detected among stars that were magnetically braked, at which stage their host clusters would not exhibit eMSTOs. A straightforward question is whether the MPs and the magnetic brake are related (Bastian, & Lardo, 2018).
Although how does the magnetic brake could cause the MPs remains unclear, if it does produce the chemical variations among magnetically braked stars, MPs should be present in low-mass MS stars, even in young clusters. The mass boundary at which a strong magnetic brake works is determined 1.4 (Goudfrooij et al., 2018), indicating that all MS stars later than (or equal to) G-type should be braked by their strong surface magnetic field. Martocchia et al. (2017) have confirmed that there is no significant chemical variations among RGB stars of NGC 419. However, NGC 419 exhibits an obvious eMSTO region, which implies that both its TO and RGB stars are not magnetically braked. Because of this, it is deserve to examine whether the chemical inhomogeneous is present among its low-mass MS stars. In this work, we aim to examine if one of the most ordinary features of MPs, the star-to-star N variation, is present in the late-G to K-type MS stars in the SMC cluster NGC 419. Using the frames that are deeply exposed in ultraviolet and visible passbands observed through the Hubble Space Telescope (HST), we have studied their distributions of a specific color index which is sensitive to the N abundance. We have compared the observed GK-type MS population stars with a simulated simple stellar population (SSP) and a branch of synthetic MPs with different degrees of N variation. Our analysis reports that there is no significant star-to-star variation in N abundance among the GK-type stars in NGC 419.
The article is organized as follows: in Section 2 we introduce the data reduction. We present the method designation and main results in Section 3. The scientific discussions about our results and conclusions are present in Section 4.
2 Data Reduction
The datasets used in this work were observed through the HST’s Ultraviolet andVisual Channel of the Wide Field Camera 3 (UVIS/WFC3), and the Advanced Camera for Surveys/Wide Field Channel (ACS/WFC). The UVIS/WFC3 frames were observed in both the F343N and F438W passbands (program ID: GO-15061, PI: N. Bastian). The ACS/WFC frames were observed through the F814W passband (program ID: GO-10369, PI: J. Gallagher). Our datasets were derived from the photometry of nine frames of the UVIS/WFC3 and six frames of ACS/WFC. The detail information of the observational frames in each passband is present in Table 1.
| Rootname | Camera | Exposure time | Filter | Program ID | PI name | |
|---|---|---|---|---|---|---|
| idio01laq | UVIS/WFC3 | 1450.5 s | F343N | GO-15061 | N. Bastian | |
| idio01lbq | UVIS/WFC3 | 1450.5 s | F343N | |||
| idio01ldq | UVIS/WFC3 | 1450.5 s | F343N | |||
| idio01leq | UVIS/WFC3 | 1450.5 s | F343N | |||
| idio01l9q | UVIS/WFC3 | 2924.3 s | F343N | |||
| idio01lgq | UVIS/WFC3 | 3035.5 s | F343N | |||
| idio01lhq | UVIS/WFC3 | 3036.0 s | F343N | |||
| idio02daq | UVIS/WFC3 | 1454.0 s | F438W | |||
| idio02dbq | UVIS/WFC3 | 1454.0 s | F438W | |||
| j96123bxq | ACS/WFC | 10.0 s | F814W | GO-10396 | J. Gallagher | |
| j96123bzq | ACS/WFC | 10.0 s | F814W | |||
| j96123c0q | ACS/WFC | 474.0 s | F814W | |||
| j96123c2q | ACS/WFC | 474.0 s | F814W | |||
| j96123c4q | ACS/WFC | 474.0 s | F814W | |||
| j96123c6q | ACS/WFC | 474.0 s | F814W |
The photometry was performed through the package Dolphot2.0 (Dolphin., 2011a, b, 2013), a specific photometric package designed for HST observations. Dolphot2.0 also contains corresponding WFC3 and ACS modules to deal with frames taken from these observational channels. We have used the standard photometry routines suggested by the manual. The point-spread-function (PSF) photometry was performed to flat frames with poor charge transfer efficiency corrected (‘_flc’), combined with processes of bad pixel masking, splitting frames into different chips, as well as background calculation. For each observational channel, our photometry has provided us with a raw stellar catalog with parameters including (for each detected object) the positions on the chip, (which describes the goodness of the PSF fitting), signal-to-noise (SNR), sharpness, roundness, object type, and blocks of photometry in each passband (counts, background, count rate, count rate uncertainty, magnitude, magnitude uncertainty etc.). We filtered the raw stellar catalog by the following criteria: (1) The object is detected in all passbands (otherwise the Dolphot2.0 will report a magnitude of 99.99); (2) The object type is a ‘bright star’ and is not flagged as centrally saturated; (3) Its sharpness is between 0.3 and 0.3; (4) Its crowding parameter is less than 0.1 mag. (5) The SNR is higher than 5.
The sharpness describes how sharp a detected source is. A perfectly-fit star should have a zero sharpness. A large, positive sharpness means a star is too sharp (perhaps a cosmic ray), and a large negative sharpness means the object is too broad (perhaps a blend, cluster, or galaxy). In an uncrowded field, good stars should have sharpness values between 0.3 or 0.3. In a crowded field like a star cluster, blending would affect the sharpness of detected stars, making a wider sharpness distribution than field stars. In order to improve the reliability of the analysis, we have adopted a strict sharpness range for our detections.
The crowding parameter is in magnitudes, and tells how much brighter the star would have been measured had nearby stars not been fit simultaneously. For an isolated star, the value is zero. High crowding values are also generally a sign of poorly-measured stars. Crowding has a significant effect on our analysis: for a crowded cluster, low-mass stars are usually severely affected by crowding, in particular for the cluster’s central region. Because of this, we have adopted a very strong limitation on crowding for detected stars (not exceed 0.1 mag). The average crowding of all GK-type stars analyzed in this work is only 0.02 mag. As a result, a significant fraction (50%) of GK-type stars within the central region (with a size of 300 pixels on the CCD) are removed due to the high crowding.
Thanks to the ultra-deep exposures, in particular for frames observed in the F343N filter (the total exposure time is 14,797.8 s). We confirm that in each passband, we can obtain reliable detections down to late-K type stars (F438W27 mag) at the distance of the SMC, which is sufficient for searching for small N variation ( dex., see Section 3).
Finally, we combine two stellar catalogs of both the UVIS/WFC3 and ACS/WFC channels through cross-matching their spatial coordinates. The combined stellar catalog contains totally 23,756 good stars. We have corrected the possible effect of differential reddening using the method designed in Milone et al. (2012a). We find that for low-mass MS stars, the effect of differential reddening is negligible, which will contribute an additional signature of MPs of only 1% or less (see below).
3 Main Results
3.1 Adopted Models
The color index used for detecting N variation among GK-type stars is identical to our previous works (e.g., Li et al., 2019b). Which is: {widetext}
| (1) |
The reason why this color index is sensitive to the N abundance has been illustrated in (Li et al., 2019b, See their Fig.1).
The first thing we did is to find the best fitting isochrone to the observed vs. F438W diagram. We have used the MESA Isochrone and Stellar Tracks (MIST; Paxton et al., 2011, 2013, 2015; Choi et al., 2016; Dotter, 2016). The best fitting isochrone is determined by visual inspection, with the best fitting parameters of [Fe/H]=0.700.05 dex, =0.150.01 mag, =9.150.02 (1.4 Gyr), =19.00.05 mag, respectively. The adopted rotational velocity for the best fitting isochrone is zero, as low-mass stars are not fast rotators. The uncertainty associated with each parameter is determined by the generated grid when we check the fitting. By inspecting its color-magnitude diagram in optical passbands (F555W and F814W), we find that NGC 419 exhibits a very tight RGB, which can constrain the overall metallicity spread. We confirm that with a fixed age and distance modulus, the internal spread of [Fe/H] would not exceed 0.1 dex. This is well consistent with our fitting uncertainty. To avoid any uncertainty introduced by the fitting, the best fitting isochrone is only used for generating N-enriched models, and is not used as the ridge-line of the observed low-mass MS stars.
We then generate a series of model spectra using the stellar line analysis program MOOG (2017 version, Sneden, 1973) and spherical MARCS model atmospheres (Gustafsson et al., 2008). Based on the best-fitting isochrone combined with the synthetic model spectra, we calculated the corresponding loci with different degrees of N enrichment (MPs). In principle, different CNO abundances will affect stellar evolution as well, because they will change the stellar central mean molecular weight as well as the atmospheric opacity. We have examined this effect for late-type MS stars of different initial masses through MESA. We find that the differences of and between normal and CNO enhanced stars are negligible, which are smaller than 0.8‰ and 1.5‰, respectively.
All points at the loci have the same global parameters (, , ) to the corresponding points at the standard isochrone. We calculate the relative deviation between loci with [N/Fe]=0.2, 0.4, 0.6, 0.8, 1.0 and 1.2 dex to the standard isochrone. An ordinary feature for the N-enriched stars in GCs is they are also depleted in C and O, with their total abundance unchanged (Pietrinferni et al., 2009). To simplify our calculation, we have considered a ‘toy’ model with [C/Fe]+[N/Fe]+[O/Fe]0.0, and [C/Fe]=[O/Fe]=0.5[N/Fe]. These depletions of C and O abundances were taken into account in our synthesis spectrum. We confirmed that small variations on [C/Fe] and [O/Fe] would not strongly affect our results. For late-type stars, the strongly dependents on [N/Fe] because they will exhibit a strong NH absorption band centered at 3370111For early-type stars, the NH molecules are destroyed because of their high temperature. As a result, the deviation to the standard isochrone for loci with N-enrichments becomes obvious in particular for the bottom of the MS. For N-enriched stars, we calculated their flux ratios compared with normal stars with the same global parameters in each passband. We then convert these flux ratios into magnitude differences. In figure 1 we present the observed vs. F438W diagram for NGC 419, the best fitting isochrone (the blue curve) as well as the loci with different [N/Fe]. We only present the part of MS for loci with different [N/Fe], because the same property for stellar populations of RGB stars of NGC 419 has been well studied by Martocchia et al. (2017) (no evidence of MPs was detected among its RGB stars).
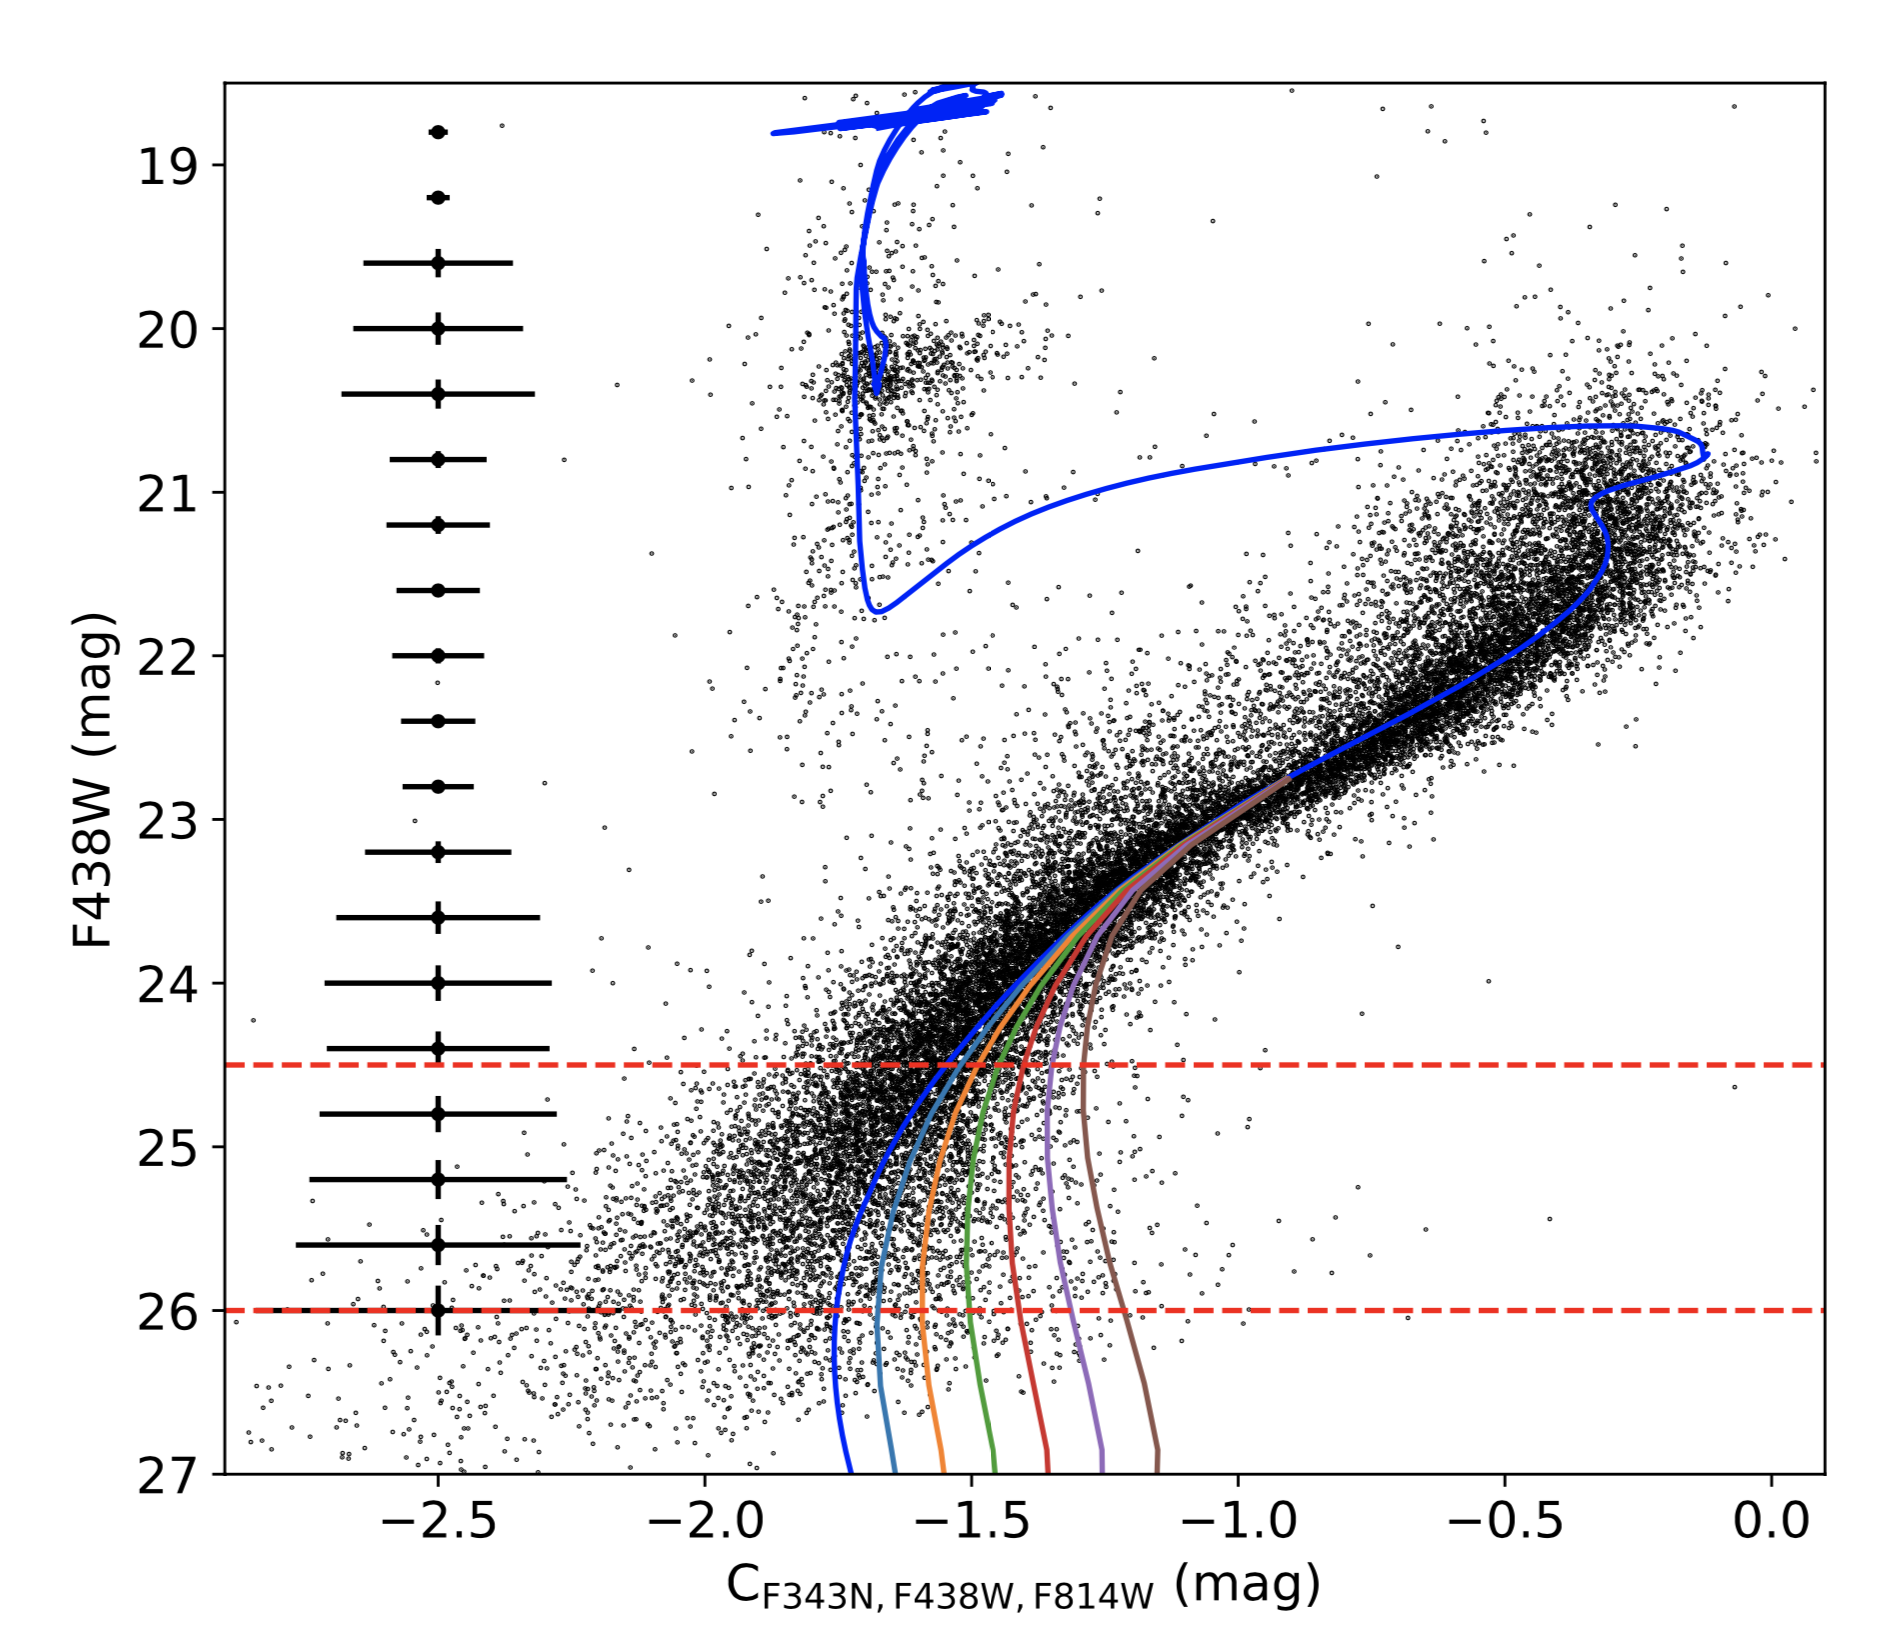
At first glance, we find that for MS stars fainter than F438W=24.5 mag, the deviations to the standard isochrone for different N-enriched loci become obvious. We thus only selected stars below this magnitude. We have also removed all stars fainter than F438W=26 mag to increase the average SNR of the stellar sample. This adoption finally yields a stellar catalog with 90% stars have their SNR18 (in F343N passband). Based on the best fitting isochrone, stars with 24.5 magF438W26 mag would have their surface effective temperatures range from 5500 K to 6200 K, corresponding to stellar types from K-type to late G-type. The total number of stars in this magnitude range is 3,070.
To mimic a real observation, we have generated a sample of artificial stars (ASs) located at the standard isochrone and different N-enriched loci, following a Kroupa stellar mass function. The total number of stars in each artificial population is 327,500, more than 100 times the real observation. For each AS population, a 20% unresolved binary fraction with a flat mass-ratio distribution is adopted (Rubele et al., 2010). We note that binary fraction would have a very limited effect on our results, because for the bottom of the MS, the photometric uncertainty is the dominant factor which affects the MS morphology.
For each artificial population, we divided 3,275 sub-samples containing only 100 stars in each. We added these sub-samples of ASs into the raw images by using the same PSF model that applied to real stars. That means we have repeated this procedure for 3,275 times for each population. As a result, we obtained seven synthetic SSPs with different N-enrichment (from [N/Fe]=0.0 to 1.2 dex). Each synthetic SSP have suffered the same effects of real stars, including the photometric uncertainty, the contamination of cosmic ray, the blending effect, etc. We have also reduced the ASs using the same criteria as for real stars. The resulting AS catalogs have the same distribution of crowding, sharpness, and SNR to the real observation. Because of the strong limitation of crowding, our artificial stars also have a similar spatial distribution like the real observation in each CCD chip. The average crowding for ASs is also 0.02 mag in each passband.
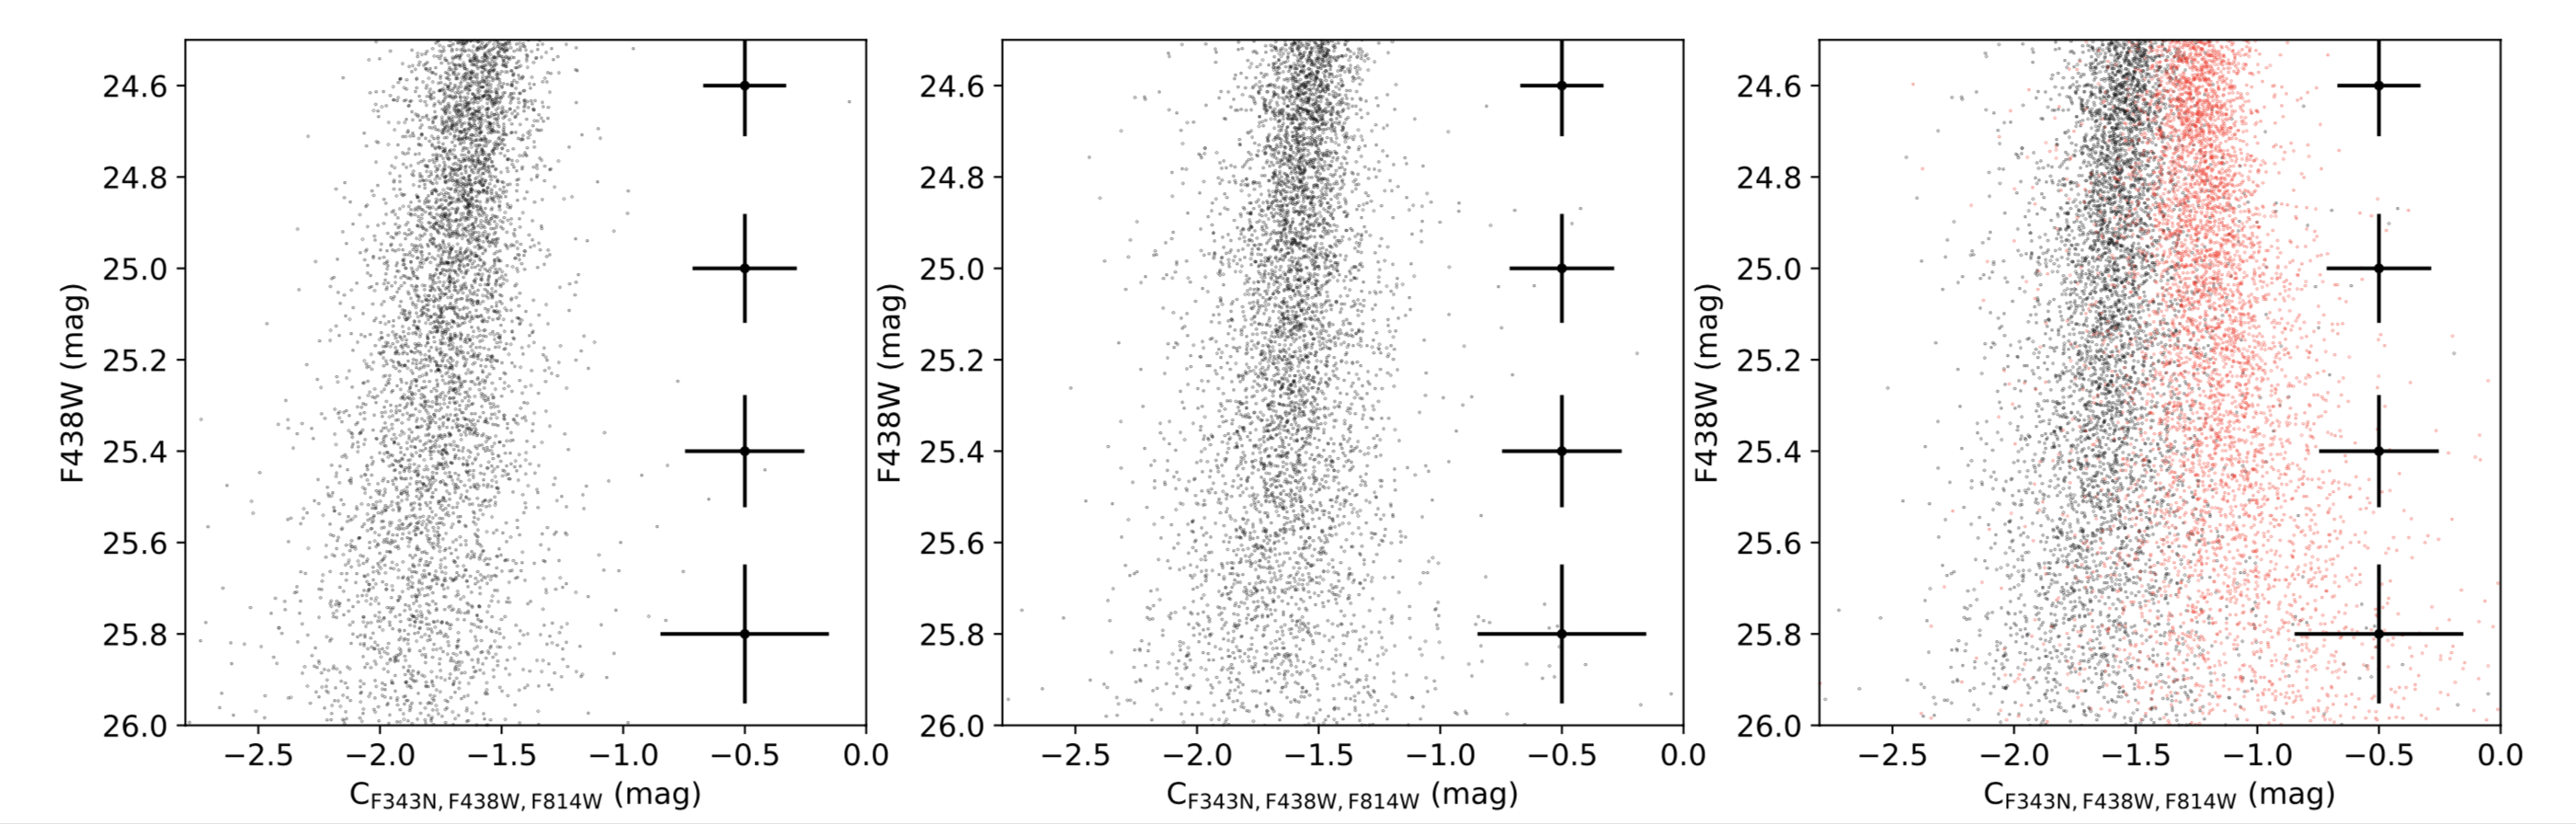
The photometry of ASs has reported that the average completeness for our stars of interest is only 48%. The incompleteness is mainly contributed by crowding and small SNR. The small completeness would not affect our analysis because both the observation and the synthetic populations used as comparisons have the same completeness, as they are measured through the same PSF photometry and reduced through the same criteria. For each population, we randomly selected a represent sample with the same number of ASs to the observation based on the observed luminosity function. In figure 2 we present the vs. F438W diagrams for the observed GK-type MS stars (left), the synthetic SSP of GK-type MS stars ([N/Fe]=0.0 dex,middle), as well as two synthetic SSPs with [N/Fe]=0.0 and 1.2 dex, respectively (black and red dots, right). As shown in figure 2, even considering the measurement uncertainties, GK-type MS populations with [N/Fe]=0.0 and 1.2 dex are distinct in .
3.2 Statistical Analysis
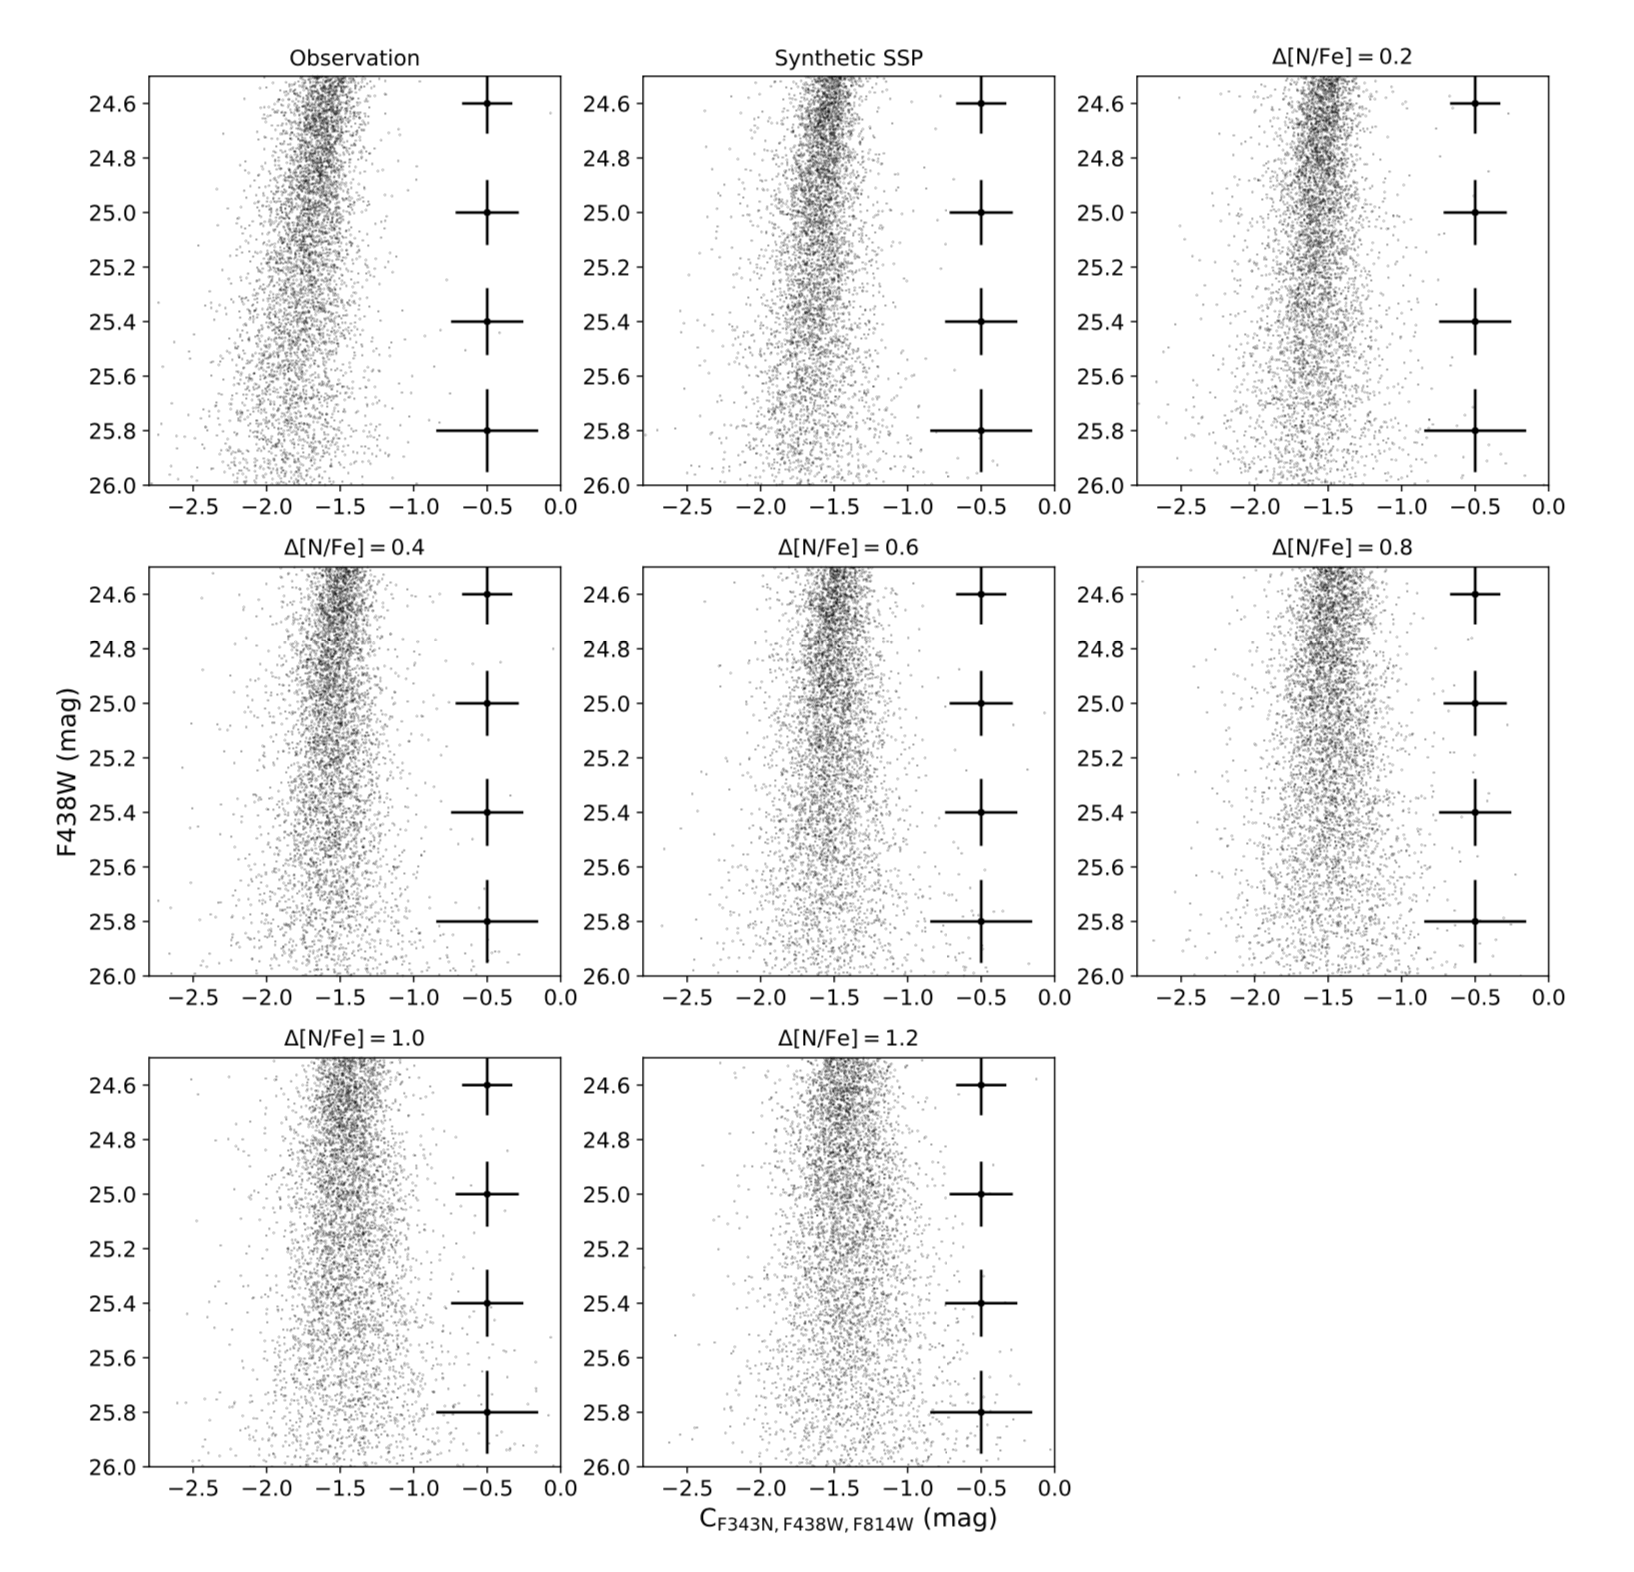
We generate a sample of synthetic MPs through uniformly mixing different SSPs. For example, the MP with [N/Fe]=0.0 to 0.4 dex would have each population ([N/Fe]=0.0,0.2 and 0.4 dex) occupies one third in number. In figure 3 we exhibit the vs. F438W diagrams for the observation, the synthetic SSP, and synthetic MPs with different N-enrichments. Simply from visual inspection, we can hardly tell the difference between the observation and MPs with small N variation ( dex), but a clear difference appears between the observed GK-type MS and MPs with dex.
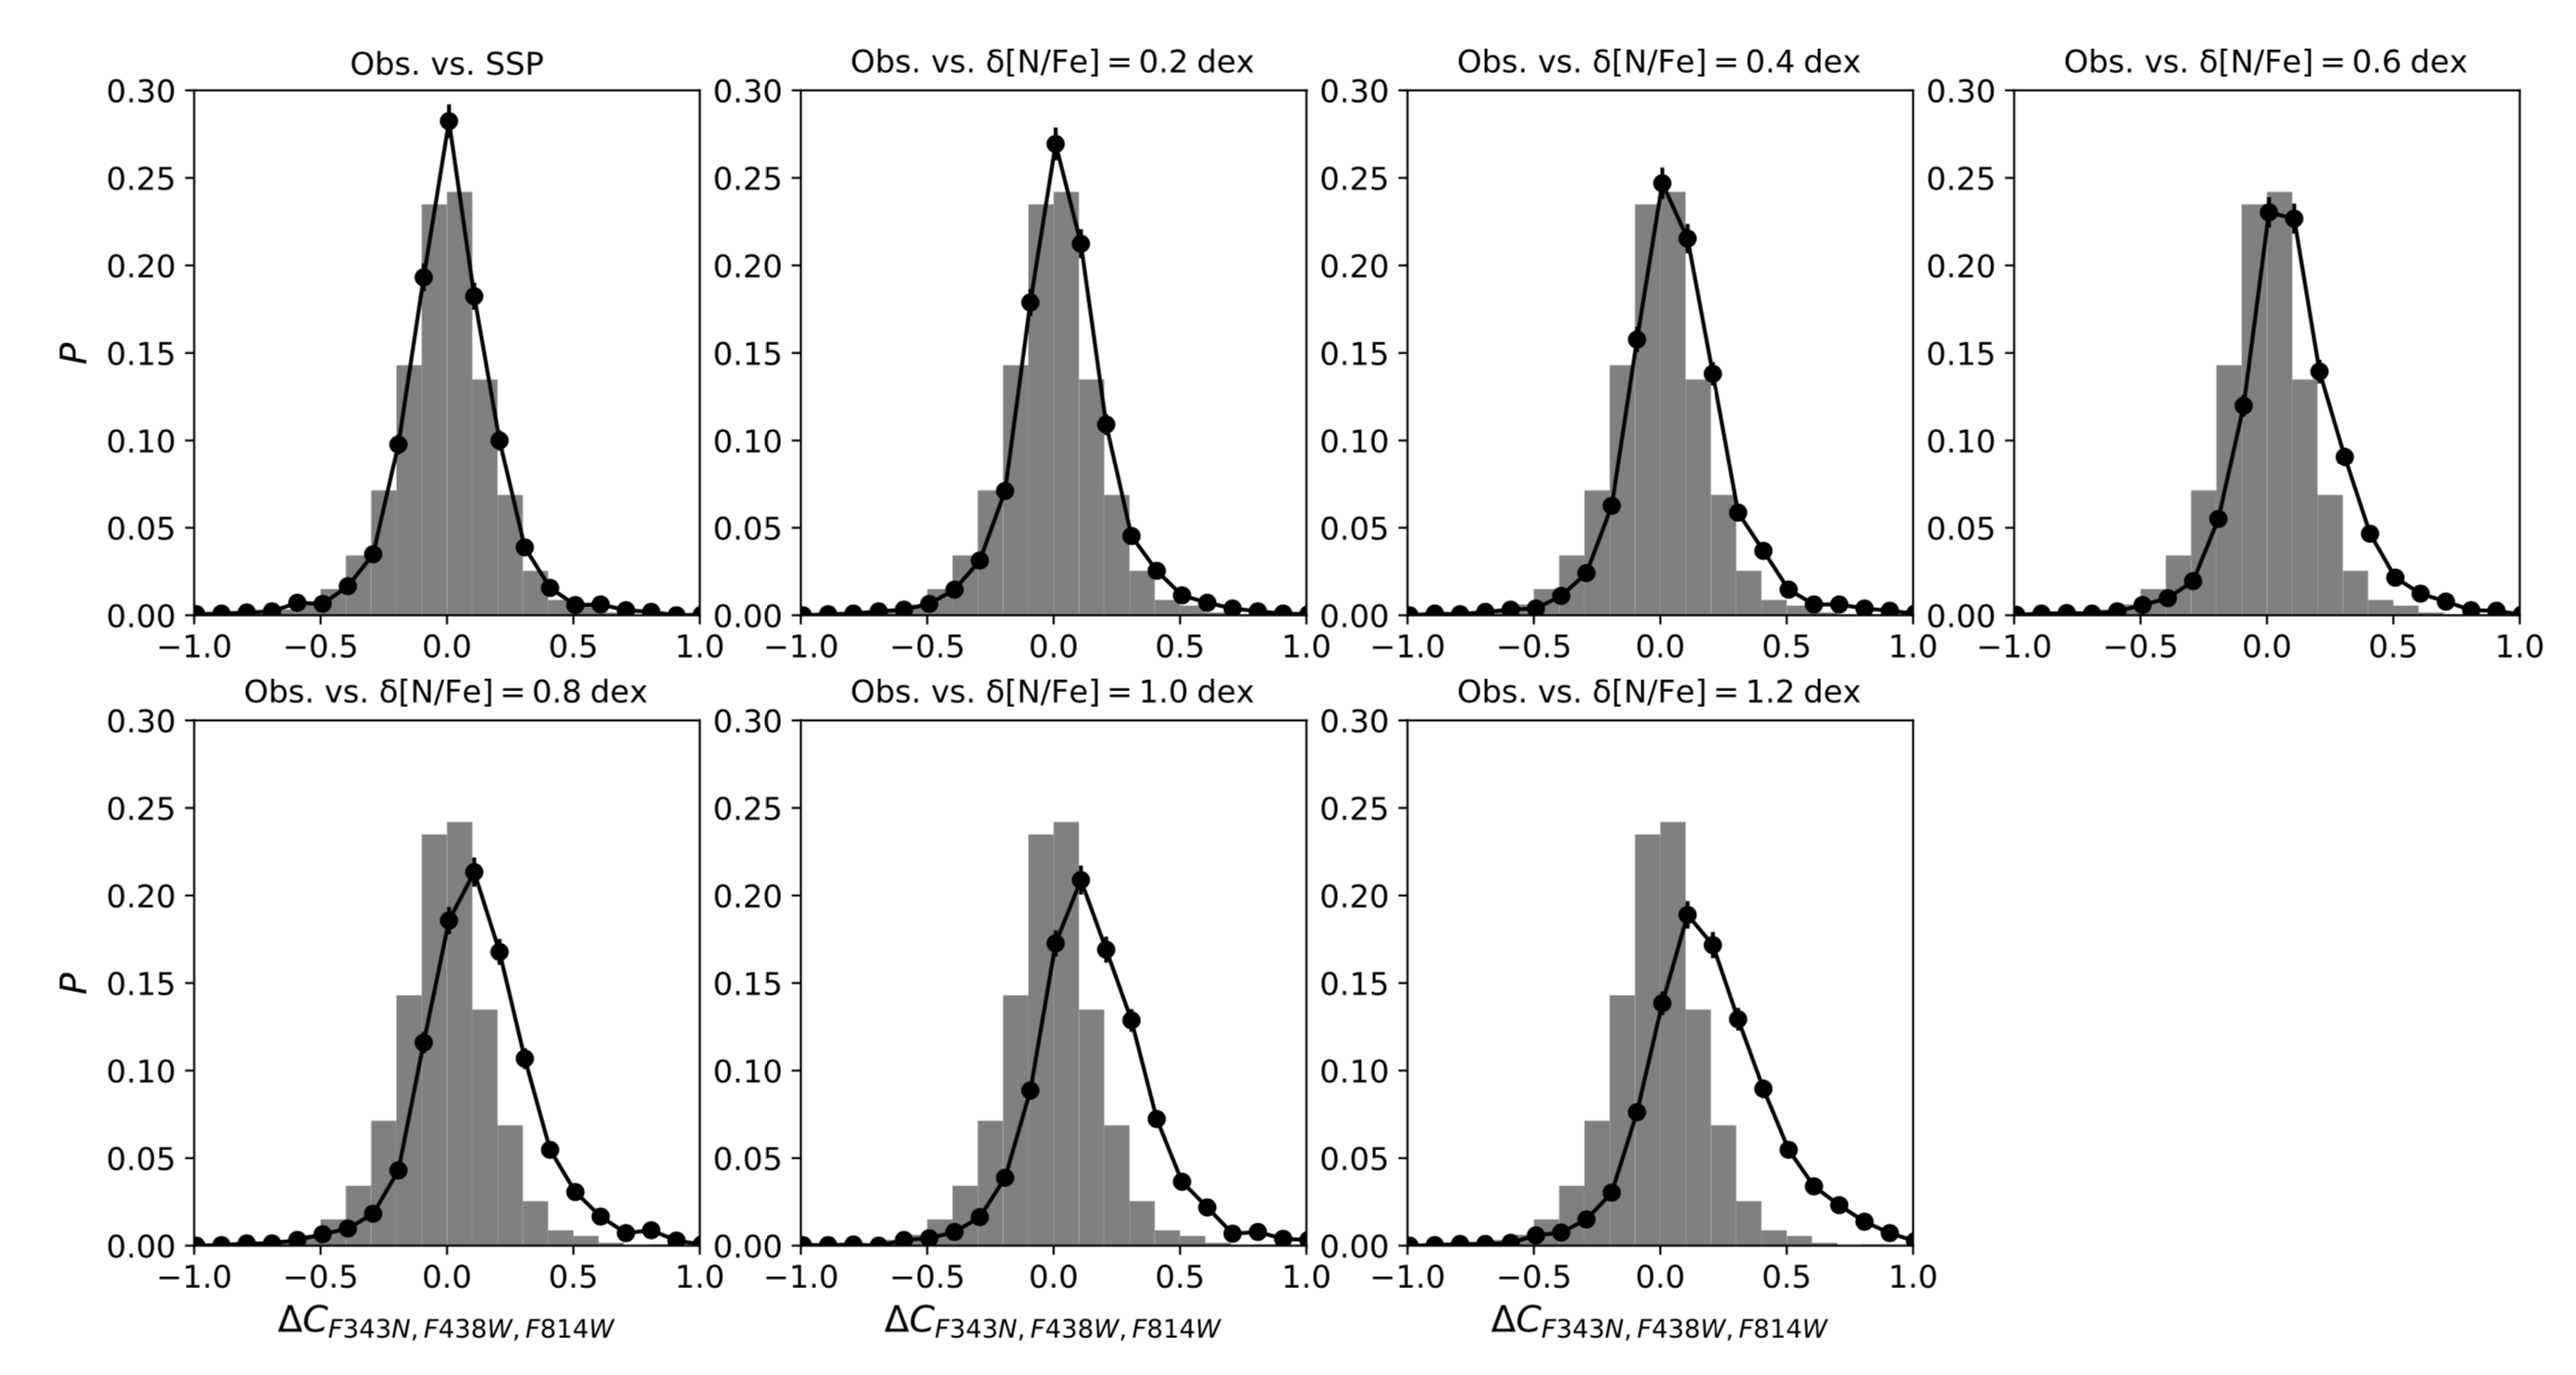
To quantify the differences between the observation and different synthetic populations, we have calculated the distribution of for both the observed stars and the synthetic ASs. Here is the deviation of the detected to the MS ridge-line. For the observation, the MS ridge-line is determined through connecting the median value at different F438W magnitude range with a length of 0.1 mag. For the synthetic SSP and MPs, their ridge-lines are the best fitting isochrone. We then compare the observed distribution with different synthetic stellar populations. Our result is present in figure 4. We find that the best fitting model to the observation is the SSP. For MPs with , a clear displacement to the positive side of the appears. This is under expected, because N-enrichment increases the of stars due to the strong NH- absorption band covered by the F343N passband.
Finally, we calculate the standard deviation, , of the distributions for both the observation and the synthetic population stars. Considering that the synthetic population stars (3,070 stars) were randomly selected from their parent samples (327,500 stars), for the synthetic population stars, we have repeated this procedure100 times. We adopt the average as the typical value of . The uncertainty of is determined by the range of of 100 runs. For each model, if runs have produced a smaller than or equal to the observation, the probability of that the observation can be reproduced by the model is =%. The for the observation as well as the synthetic population stars are summarized in Table 2 (second to third columns).
| Stellar samples | (mag) | (mag) | ||
|---|---|---|---|---|
| Observation | 0.200 | – | – | – |
| Synthetic SSP | 47% | 47% | ||
| Synthetic MPs | ||||
| [N/Fe]=0.2 dex | 9% | 10% | ||
| [N/Fe]=0.4 dex | 0% | 3% | ||
| [N/Fe]=0.6 dex | 0% | 0% | ||
| [N/Fe]=0.8 dex | 0% | 0% | ||
| [N/Fe]=1.0 dex | 0% | 0% | ||
| [N/Fe]=1.2 dex | 0% | 0% |
From Table 2 we can see that the observed distribution for GK-type MS stars is most likely the result of an SSP. Among the 100 runs of the simulated SSPs, totally 47 runs have reproduced a narrower distribution of than the observation (=47%). For the MPs with [N/Fe]=0.2 dex, this probability decreases to 9%. For other synthetic MPs with [N/Fe]0.4 dex, none of them can reproduce the observed distribution.
Some other uncertainties such as the processes of de-reddening, isochrone fitting and the adopted binary fraction, would also affect the synthetic population stars. If we do not correct the possible differential reddening effect, the observed would slightly change, from 0.200 to 0.201 mag. If we assume that the late-type MS stars would have a lower binary fraction, the synthetic MS population would become slightly narrower. But all these effects would not change the fact that the synthetic SSP could have the highest probability of reproducing the observation.
Although we have assumed that the total abundance of the CNO does not change. Some other choices of the C and O abundances would affect our results as well, but these effects are not significant. This is because for a single star, its F343N magnitude strongly depends on the N abundance due to the molecular absorption band of NH (3370Å). The F438W magnitude is only weakly affected by the CH absorption band at 4300Å222Because at this wavelength range, the F438W magnitude is more sensitive to the continua of the stellar spectral energy distribution.
One disadvantage of our analysis is we cannot exclude the effect of field contamination. Because the field of view of the combined stellar catalog is not large enough for us to obtain a referenced field sample. But this should not affect our result, because field stars with different ages and metallicities should increase rather than reduce the width of the observed MS. The fact that the observed MS is consistent with an SSP should indicate that the effect of the field contamination is negligible.
For all the synthetic MPs in our previous analysis, the number of second population stars (stars with [N/Fe]0.2 dex) is comparable to, or greater than the primordial population stars (stars with no N-enhancement). The fraction of the second population stars in our models ranges from 50% (for MPs with [N/Fe]=0.2 dex) to 86% (6/7, for MPs with [N/Fe]=1.2 dex), which is somehow extreme compare to real cases of MPs. According to Milone et al. (2020), Magellanic Clouds clusters with MPs could host a smaller fraction of second population stars down to 30% than Galactic GCs with equivalent masses. Because of this, we repeat our previous analysis by adopting some ‘moderate’ models of MPs. In this analysis, the number fraction of the primordial population stars is fixed as 70%, and the total number fraction of other population stars with different N-enrichment is 30%. For example, for the model with [N/Fe]=1.2 dex, the number fractions for the enriched population stars with [N/Fe]=0.2, 0.4, 0.6, 0.8, 1.0 and 1.2 dex are both 5% (totally 30%). Based on this adoption, the same comparisons between the distributions of observation and synthetic populations (SSP and MPs with different [N/Fe]) are present in figure 5.
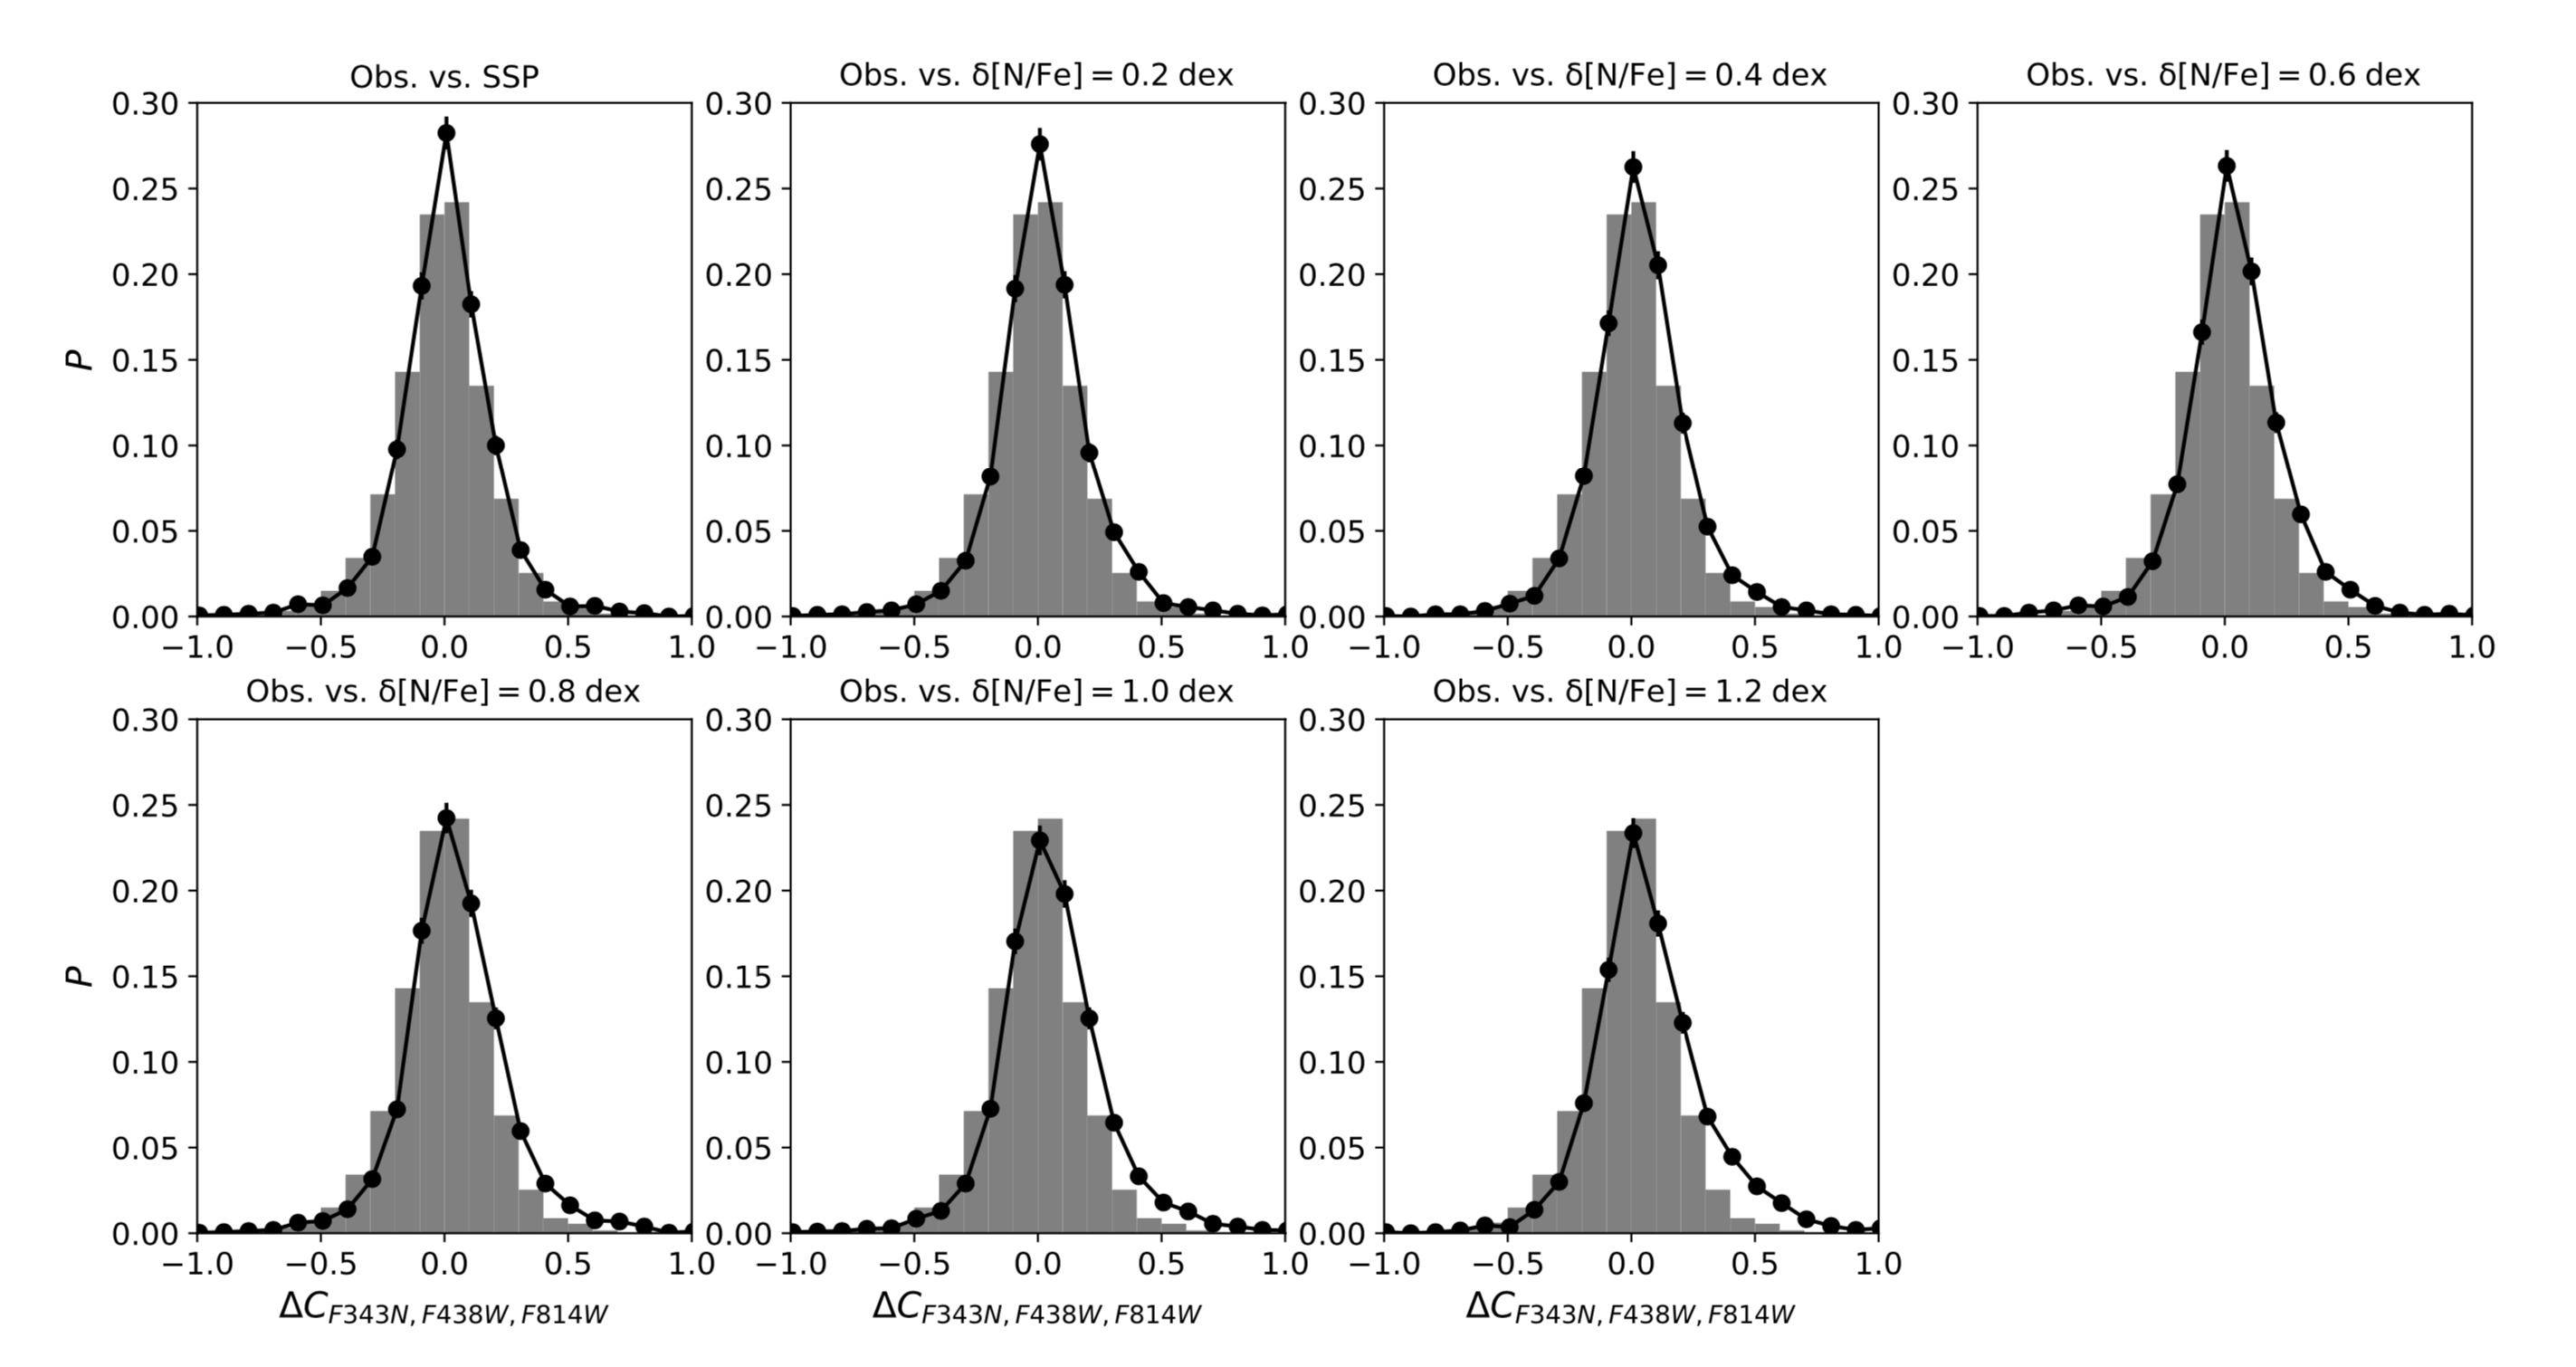
In figure 5 we find that for all synthetic MPs, their fittings to the real observation are better than previous ‘extreme’ cases, but a clear discrepancy at the positive side of the still exist for MPs with [N/Fe]0.4 dex. Indeed, our statistical analysis reports that the probability that the observation could have an internal variation of [N/Fe]=0.4 dex is only 3%. For MPs with [N/Fe]0.6 dex, none of them can reproduce the observation. For the model of [N/Fe]=0.2 dex, this probability slightly increases from 9% to 10% compared to previous case. Therefore, the observation is still likely an SSP rather than a ‘moderate’ case of MPs. For all these ‘moderate’ models of MPs, we summarize their standard deviations of distributions, and the corresponding probabilities of reproducing the observation in Table 2 (the forth and fifth columns).
In summary, the observed GK-type MS population is most likely an SSP. Their internal chemical variation in N abundance, if present, would not exceed [N/Fe]0.2 dex.
4 Discussion and Conclusion
Lagioia et al. (2019) have compared the properties of MPs between Magellanic Clouds clusters and Galactic GCs. They find that Magellanic Clouds GCs with MPs have smaller RGB width than Galactic GCs with similar masses, indicating that the typical chemical spread among RGB stars in Magellanic Clouds clusters is smaller than Galactic GCs. According to Marino et al. (2019), for Galactic GCs with MPs, the minimum difference in N abundance between the primordial and secondary population stars reaches 0.3 dex (NGC 6121). In Table 2, our analysis has reported a possibility of 10% that 30% second population stars with [N/Fe]0.2 dex could exist in low-mass MS stars of NGC 419, this probability cannot be ignored. Therefore, the presence of a weaker signature of MPs (a fraction of 30% stars with [N/Fe]0.2 dex) among the GK-type MS stars in NGC 419, cannot be excluded by our analysis. In this work, we conclude that a significant chemical variation ([N/Fe]0.4 dex) among low-mass MS stars in NGC 419 does not exist.
In our model MPs, we did not consider the possible effect of helium spread. MS stars with enhanced helium abundance would have a higher temperature than normal stars with the same masses due to the increased average molecular weight in the central burning region. As a result, the helium-enhanced population would exhibit a bluer color compare to the normal MS. If assuming a typical helium variation of dex (e.g., Chantereau et al., 2019), a larger color spread of F438WF814W is expected, producing a wider distribution of . This makes the fact that low-mass MS stars of NGC 419 are composed of MPs more unlikely. The overall spread of metallicity ([Fe/H]) may affect the observed MS as well. This effect, if present, would indicate that NGC 419 has been polluted by Type II supernova. However, the observed tight RGB observed in its optical color-magnitude diagram has excluded this possibility.
Our result favors the conclusion of Martocchia et al. (2017), in which they claimed that there is no evidence of MPs among the RGB stars in NGC 419. Since NGC 419 is a massive cluster with a total mass ( ) comparable to most GCs, the absence of MPs in NGC 419 indicates the importance of cluster age to the onset of MPs. However, age should not be the only factor that determines the presence of MPs. Since recently both Li et al. (2019b) and Milone et al. (2020) have confirmed that a 4 Gyr-old cluster, Lindsay 113, does not exhibit MPs.
Lagioia et al. (2019) have derived a clear correlation between the clusters mass and their RGB width (thus the significance of MPs) for Magellanic Clouds GCs, which is similar to Galactic GCs. However, it is unlikely that NGC 419 is not sufficiently massive to harbor MPs, even consider the mass loss due to the internal two-body relaxation and external tidal effect. Because at least two older counterparts, NGC 1978 and NGC 2121, which have comparable masses (1–2 ), and are only slightly older (2 Gyr) than NGC 419, exhibit signature of MPs (Martocchia et al., 2017; Li, & de Grijs, 2019a). Does this indicate that clusters age determines the onset of MPs while their mass defines the significance of MPs? More investigations on clusters of various ages and masses are required to shed light on this question.
Although speculative, Bastian, & Lardo (2018) suggests that MPs may somehow relate to the magnetic brake effect. Because all clusters with eMSTO do not exhibit MPs, it seems that only for magnetically braked stars could be able to produce star-to-star chemical variations. However, our result has excluded this probability since the GK-type stars studied in this work should be all magnetically braked, but they do not exhibit any signature of MPs. Our result cannot exclude the possibility that stellar chemical anomalies are produced among low mass stars and were present only at their later stages. However, this is contrary to some ancient GCs, in which non-evolved MS stars were found to have abundance anomalies (e.g., Briley et al., 2004). Therefore, we conclude that the apparent coincidence of the lack of eMSTOs and the beginning of MPs is likely just a coincidence. But to make a definite conclusion, more studies on clusters at the age limit around magnetic brake are required.
References
- Bastian, & de Mink (2009) Bastian, N., & de Mink, S. E. 2009, MNRAS, 398, L11
- Bastian, & Strader (2014) Bastian, N., & Strader, J. 2014, MNRAS, 443, 3594
- Bastian, & Lardo (2018) Bastian, N., & Lardo, C. 2018, ARA&A, 56, 83
- Brandt, & Huang (2015) Brandt, T. D., & Huang, C. X. 2015, ApJ, 807, 24
- Briley et al. (2004) Briley, M. M., Harbeck, D., Smith, G. H., et al. 2004, AJ, 127, 1588
- Carretta et al. (2009) Carretta, E., Bragaglia, A., Gratton, R. G., et al. 2009, A&A, 505, 117
- Chantereau et al. (2019) Chantereau, W., Salaris, M., Bastian, N., et al. 2019, MNRAS, 484, 5236
- Choi et al. (2016) Choi, J., Dotter, A., Conroy, C., et al. 2016, ApJ, 823, 102
- Cordoni et al. (2018) Cordoni, G., Milone, A. P., Marino, A. F., et al. 2018, ApJ, 869, 139
- D’Antona et al. (2017) D’Antona, F., Milone, A. P., Tailo, M., et al. 2017, Nature Astronomy, 1, 0186
- di Criscienzo et al. (2010) di Criscienzo, M., Ventura, P., D’Antona, F., et al. 2010, MNRAS, 408, 999
- Dolphin. (2011a) Dolphin A., DOLPHOT/WFC3 user’s guide, version 2.0. http://americano.dolphinsim.com/dolphin/dolphotWFC3.pdf
- Dolphin. (2011b) Dolphin A., DOLPHOT/WFPC2 user’s guide, version 2.0. http://americano.dolphinsim.com/dolphot/dolphotWFPC2.pdf
- Dolphin. (2013) Dolphin A., DOLPHOT user’s guide, version 2.0. http://americano.dolphinsim.com/dolphot/dolphot.pdf
- Dotter (2016) Dotter, A. 2016, ApJS, 222, 8
- Goudfrooij et al. (2018) Goudfrooij, P., Girardi, L., Bellini, A., et al. 2018, ApJ, 864, L3
- Gustafsson et al. (2008) Gustafsson, B., Edvardsson, B., Eriksson, K., et al. 2008, A&A, 486, 951
- Lagioia et al. (2019) Lagioia, E. P., Milone, A. P., Marino, A. F., et al. 2019, AJ, 158, 202
- Lardo et al. (2012) Lardo, C., Milone, A. P., Marino, A. F., et al. 2012, A&A, 541, A141
- Larsen et al. (2014) Larsen, S. S., Brodie, J. P., Grundahl, F., & Strader, J. 2014, ApJ, 797, 15
- Li et al. (2014) Li, C., de Grijs, R., & Deng, L. 2014, Nature, 516, 367
- Li et al. (2017) Li, C., de Grijs, R., Deng, L., et al. 2017, ApJ, 844, 119
- Li, & de Grijs (2019a) Li, C., & de Grijs, R. 2019, ApJ, 876, 94
- Li et al. (2019b) Li, C., Wang, Y., & Milone, A. P. 2019, ApJ, 884, 17
- Mackey et al. (2008) Mackey, A. D., Broby Nielsen, P., Ferguson, A. M. N., et al. 2008, ApJ, 681, L17
- Marino et al. (2018) Marino, A. F., Przybilla, N., Milone, A. P., et al. 2018, AJ, 156, 116
- Marino et al. (2019) Marino, A. F., Milone, A. P., Renzini, A., et al. 2019, MNRAS, 487, 3815
- Martocchia et al. (2017) Martocchia, S., Bastian, N., Usher, C., et al. 2017, MNRAS, 468, 3150
- Martocchia et al. (2018) Martocchia, S., Cabrera-Ziri, I., Lardo, C., et al. 2018, MNRAS, 473, 2688
- Milone et al. (2009) Milone, A. P., Bedin, L. R., Piotto, G., et al. 2009, A&A, 497, 755
- Milone et al. (2012a) Milone, A. P., Piotto, G., Bedin, L. R., et al. 2012, A&A, 540, A16
- Milone et al. (2012b) Milone, A. P., Piotto, G., Bedin, L. R., et al. 2012, ApJ, 744, 58
- Milone et al. (2017) Milone, A. P., Piotto, G., Renzini, A., et al. 2017, MNRAS, 464, 3636
- Milone et al. (2019) Milone, A. P., Marino, A. F., Bedin, L. R., et al. 2019, MNRAS, 484, 4046
- Milone et al. (2020) Milone, A. P., Marino, A. F., Da Costa, G. S., et al. 2020, MNRAS, 491, 515
- Mucciarelli et al. (2009) Mucciarelli, A., Origlia, L., Ferraro, F. R., & Pancino, E. 2009, ApJ, 695, L134
- Niederhofer et al. (2017) Niederhofer, F., Bastian, N., Kozhurina-Platais, V., et al. 2017, MNRAS, 464, 94
- Pancino et al. (2017) Pancino, E., Romano, D., Tang, B., et al. 2017, A&A, 601, A112
- Paxton et al. (2011) Paxton, B., Bildsten, L., Dotter, A., et al. 2011, ApJS, 192, 3
- Paxton et al. (2013) Paxton, B., Cantiello, M., Arras, P., et al. 2013, ApJS, 208, 4
- Paxton et al. (2015) Paxton, B., Marchant, P., Schwab, J., et al. 2015, ApJS, 220, 15
- Pietrinferni et al. (2009) Pietrinferni, A., Cassisi, S., Salaris, M., et al. 2009, ApJ, 697, 275
- Piotto et al. (2007) Piotto, G., Bedin, L. R., Anderson, J., et al. 2007, ApJ, 661, L53
- Rubele et al. (2010) Rubele, S., Kerber, L., & Girardi, L. 2010, MNRAS, 403, 1156
- Sneden (1973) Sneden, C. A. 1973, Ph.D. Thesis
- Sun et al. (2019a) Sun, W., de Grijs, R., Deng, L., et al. 2019, ApJ, 876, 113
- Sun et al. (2019b) Sun, W., Li, C., Deng, L., et al. 2019, ApJ, 883, 182
- Tang et al. (2017) Tang, B., Cohen, R. E., Geisler, D., et al. 2017, MNRAS, 465, 19
- Tang et al. (2019) Tang, B., Liu, C., Fernández-Trincado, J. G., et al. 2019, ApJ, 871, 58
- Wang et al. (2017) Wang, Y., Primas, F., Charbonnel, C., et al. 2017, A&A, 607, A135
- Yong et al. (2008) Yong, D., Grundahl, F., Johnson, J. A., et al. 2008, ApJ, 684, 1159