Tuning magnetic confinement of spin-triplet superconductivity
Abstract
Electrical magnetoresistance and tunnel diode oscillator measurements were performed under external magnetic fields up to 41 T applied along the crystallographic -axis (hard axis) of UTe2 as a function of temperature and applied pressures up to 18.8 kbar. In this work, we track the field-induced first-order transition between superconducting and magnetic field-polarized phases as a function of applied pressure, showing a suppression of the transition with increasing pressure until the demise of superconductivity near 16 kbar and the appearance of a pressure-induced ferromagnetic-like ground state that is distinct from the field-polarized phase and stable at zero field. Together with evidence for the evolution of a second superconducting phase and its upper critical field with pressure, we examine the confinement of superconductivity by two orthogonal magnetic phases and the implications for understanding the boundaries of triplet superconductivity.
Previous work on uranium-based compounds such as UGe2, URhGe and UCoGe has unearthed a rich interplay between superconductivity and ferromagnetism in this family of materials Aoki et al. (2019a), with suggestions that ferromagnetic spin fluctuations can act to enhance pairing Mineev (2015). The recent discovery of superconductivity in UTe2 has drawn strong attention owing to a fascinating list of properties – including absence of magnetic order at ambient pressure Sundar et al. (2019), Kondo correlations and extremely high upper critical fields Ran et al. (2019a) – that have led to proposals of spin-triplet pairing Ran et al. (2019a); Aoki et al. (2019b); Metz et al. (2019); Nakamine et al. (2019), and a chiral order parameter Bae et al. (2019); Jiao et al. (2019). In addition, at least two forms of re-entrant superconductivity have been observed in high magnetic fields, including one that extends the low-field superconducting phase upon precise field alignment along the crystallographic -axis Knebel et al. (2019), and an extreme high-field phase that onsets in pulsed magnetic fields above the paramagnetic normal state at angles tilted away from the -axis Ran et al. (2019b).
Applied pressure has also been shown to greatly increase the superconducting critical temperature in UTe2 Ran et al. (2019c); Braithwaite et al. (2019), from 1.6 K to nearly double that value near 10 kbar, and to induce a second superconducting phase above a few kbar Braithwaite et al. (2019). Upon further pressure increase, evidence of a suppression of the Kondo energy scale leads to an abrupt disappearance of superconductivity and a transition to a ferromagnetic phase Ran et al. (2019c). Together with the ambient pressure magnetic field-induced phenomena Ran et al. (2019b); Knafo et al. (2019); Knebel et al. (2019); Miyake et al. (2019), the axes of magnetic field, temperature and pressure provide for a very rich and interesting phase space in this system. One of the key questions is in regard to the field-polarized (FP) phase that appears to truncate superconductivity at 34.5 T under proper -axis field alignment Ran et al. (2019b); Knebel et al. (2019), in particular regarding the nature of the coupling of the two phases and whether superconductivity could persist to even higher fields in the absence of the competing FP phase. The relation between the FP phase and the pressure-induced magnetic phase, which also competes with superconductivity Ran et al. (2019b), is similarly not yet fully understood.
In this work, we perform magnetoresistance (MR) and tunnel diode oscillator (TDO) measurements under both high hydrostatic pressures and high magnetic fields along the crystallographic -axis to explore the () phase diagram. We find that the FP phase that interrupts superconductivity at ambient pressure is strengthened with increasing pressure, so as to suppress the transition field until there is no trace of superconductivity down to 0.4 K above 16 kbar. At higher pressures, we find evidence of a distinct magnetic phase that appears to be ferromagnetic in nature and is also bordered by the FP phase at finite fields. Together with previous observations at ambient pressure, these results suggest a spectrum of magnetic interactions in UTe2 and a multi-faceted ground state sensitive to several physical tuning parameters.
Single crystals of UTe2 were synthesized by the chemical vapor transport method as described previously Ran et al. (2019a). The crystal structure of UTe2 is orthorhombic and centrosymmetric, and the magnetic easy axis is the a-axis. Experimental measurements were conducted at the DC Field Facility of the National High Magnetic Field Laboratory (NHMFL) in Tallahassee, Florida, using a 41 T resistive magnet with a helium-3 cryostat. Resistance and magnetic susceptibility measurements were performed simultaneously on two individual samples from the same batch positioned in a non-magnetic piston-cylinder pressure cell. The pressure medium was Daphne 7575 oil, and pressure was calibrated at low temperatures by measuring the fluorescence wavelength of ruby, which has a known temperature and pressure dependence Piermarini et al. (1975); Ragan et al. (1992). The TDO technique uses an LC oscillator circuit biased by a tunnel diode whose resonant frequency is determined by the values of LC components, with the inductance L given by a coil that contains the sample under study; the change of its magnetic properties results in a change in resonant frequency proportional to the magnetic susceptibility of the sample. Although not quantitative, the TDO measurement is indeed sensitive to the sample’s magnetic response within the superconducting state where the sample resistance is zero Kim et al. (2013); Cho et al. (2011); Prommapan et al. (2011). Both the current direction for the standard four-wire resistance measurements and the probing field generated by the TDO coil are along crystallographic a-axis (easy axis). The applied dc magnetic field was applied along the -axis (hard axis) for both samples.
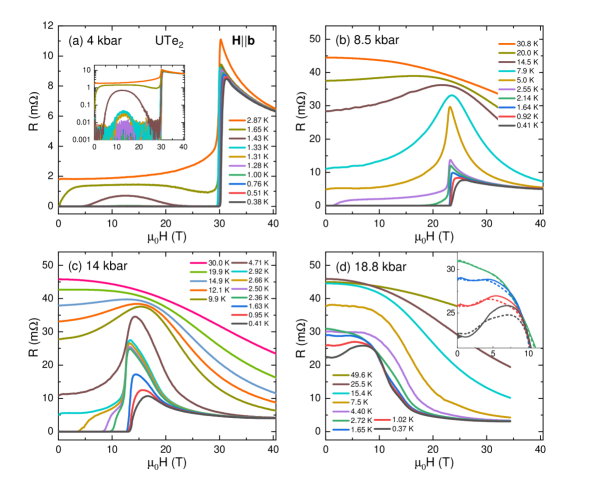
The magnetic field response of electrical resistance R at low pressures is similar to previous results at ambient pressure, which showed that the superconducting state persists up to nearly 35 T for , and re-entrant behavior can be observed near for slight misalignment of the field Knebel et al. (2019). As shown in Fig. 1(a), application of 4 kbar of pressure reduces the cutoff field to 30 T at 0.38 K ( 1.7 K without applied field), but retains the very sharp transition to the FP state above which a negative MR ensues. Upon temperature increase, a re-entrant feature emerges below similar to previous reports Knebel et al. (2019) but only above about 1.3 K, indicating either nearly perfect alignment along the -axis or a reduced sensitivity to field angle at finite pressures.
Upon further pressure increase, increases as previously shown Ran et al. (2019c); Braithwaite et al. (2019), up to 2.6 K and 2.8 K at 8.5 kbar and 14 kbar, respectively. However, is continuously reduced through this range and changes in character. As shown in Fig. 1(b) and (c), at higher pressures and dissociate, beginning as a single sudden rise with a broadened peak (denoted ) in resistance at 0.4 K that becomes better-defined upon increasing from lowest temperature, before separating into two distinct transitions at higher temperatures. Interestingly, the transition is the sharpest when the transition separates from and moves down in field. Further, the coupled transitions slightly decrease in field until about 2 K, above which the resistive continues to decrease while stalls (e.g. at about 12 T for 14 kbar) until washing out above approximately 20 K. This indicates a strong coupling between the two transitions that is weakened both on pressure increase and temperature increase, despite the first-order nature of the FP phase. At 18.8 kbar, shown in Fig. 1(d), where no superconducting phase is observed down to 0.37 K, the sharp feature associated with is gone, and only a broad maximum in remains near 8 T.
Figure 2 presents the frequency variation in the TDO signal, which is due to the changes in magnetic susceptibility of the sample and therefore sensitive to anomalies in the zero-resistance regime. In addition to a sharp rise at , which corresponds to a diamagnetic to paramagnetic transition, and changes in slope consistent with the re-entrant behavior mentioned above [Fig. S3 in SI], there is another feature in the 4 kbar data within the superconducting state observable at lower fields. At temperatures below 1 K, initially increases with field before abruptly transitioning to a constant above a characteristic field , and finally jumping at the transition. As temperature is increased, decreases in field value until it vanishes above , tracing out an apparent phase boundary within the superconducting state. As shown in Fig. 3, the path of merges with the zero-field critical temperature of the second superconducting phase “SC2” discovered by ac calorimetry measurements Braithwaite et al. (2019). As shown in Fig. 3(a), these data identify SC2 as having a distinct phase boundary from the higher- “SC1” phase, with a zero-temperature upper critical field of approximately 11 T at 4 kbar. Upon further pressure increase, the transition is suppressed in field, tracing out a reduced SC2 phase boundary [TDO data for 8.5 kbar in SI] that is absent by 14 kbar. In essence, it appears that the SC2 phase is suppressed more rapidly than the SC1 phase, which will provide insight into the distinction between each phase Hayes et al. (2020).
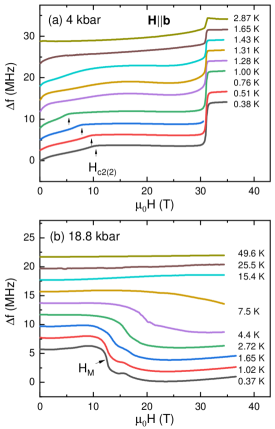
In contrast to the abrupt increase of upon crossing into the FP phase at lower pressures, the TDO signal exhibits a qualitatively different response in the high pressure regime where superconductivity is completely suppressed. As shown in Fig. 2(b), at 18.8 kbar decreases at a characteristic field (= 12.5 T at 0.37 K), indicating a decrease of magnetic susceptibility upon entering the FP phase that is opposite to the increase observed in at lower pressures (e.g. from the normal state above to the FP state, in Fig. 2a). The drop at increases in field value and gradually flattens out as temperature increases, consistent with a ferromagnetic-like phase transition that gets washed out with magnetic field. Based on observations of hysteresis in transport (Fig. 1(d) inset) that are consistent with this picture, as well as evidence from previous pressure experiments identifying similar hysteretic behavior Ran et al. (2019c), we label this phase as a ferromagnetic (FM) ground state that evolves from zero temperature and zero magnetic field, and, similar to superconductivity at lower pressures, is truncated by the FP phase and therefore distinct from that ground state.
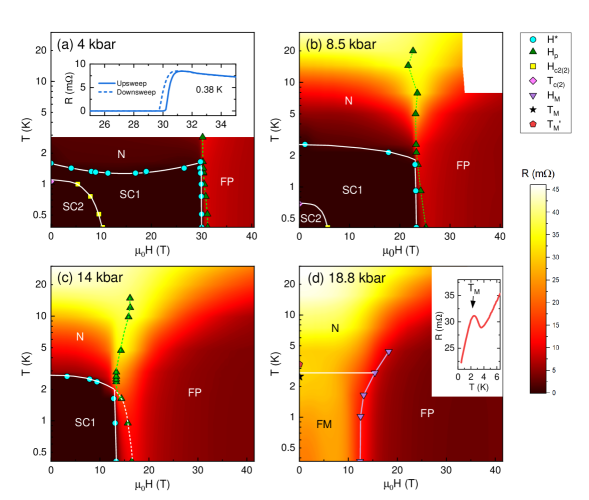
Compiling this data, we summarize the observed features and phase boundaries in both resistance and TDO measurements in Fig. 3. We identify five phases: two superconducting phases (labeled SC1 and SC2), the normal phase (labeled N), the FP phase and the FM phase, which is only observed at 18.8 kbar. The first three phase diagrams (4, 8.5 and 14 kbar) show a smooth growth of the FP phase with pressure and the emergence of a more conventional (i.e. rounded) - boundary of the SC1 superconducting phase. In fact, the observable evolution of at 8.5 and 14 kbar indicates a putative critical point that would end within the FP phase were it not cut off by . We estimate these fields to be at least 72 T and 55 T for 8.5 kbar and 14 kbar, respectively [see SI]. In this pressure range, where the putative scale becomes comparable to the FP scale , there are clear indications of an influence on the shape of the FP transition as noted above, despite its first-order nature (c.f. hysteresis observed at base temperature shown in Fig. 3(a) inset). Tracking the resistance peak to fields above traces a non-monotonic curve that, when below , mimics the extension of of the SC1 phase, again suggesting an intimate correlation between the two phases. This is corroborated by the fact that at 18.8 kbar, when superconductivity is completely suppressed, the onset of the FP phase show a more conventional monotonic evolution with increasing field and temperature.
In an effort to explain the qualitative features of the phase diagram, we consider the phenomenological Ginzburg–Landau (GL) theory describing the superconducting order parameter . For simplicity we shall consider to be single-component, relegating to the Supplementary Materials the consideration of a multi-component order parameter proposed theoretically for UTe2 Nevidomskyy (2020); Agterberg . The free energy consists of three parts: , with the first term describing the superconducting order parameter in the applied field Mineev and Samokhin (1999):
| (1) |
with denoting the covariant derivative in terms of the vector potential and the quantum of the magnetic flux, where is the effective mass tensor in the orthorhombic crystal. The simplest way in which the superconducting order parameter couples to the field-induced microscopic magnetization , is via the biquadratic interaction , where the internal magnetic field . The metamagnetic transition is described by the Landau theory of magnetization with a negative quartic term ():
| (2) |
Taking the field , and hence , we minimize the GL free energy to obtain the linearized gap equation of the form
| (3) |
from which one determines the as the lowest eignevalue of the differential operator in a standard way, similar to the problem of Landau levels for a particle in magnetic field Tinkham (2004):
| (4) |
where is related to the slope of at in the absence of magnetization and is expressed in terms of the correlation length. The upshot of Eq. (4) is that the upper critical field is reduced from its bare value by the presence of the magnetization . The latter is a function of magnetic field, , to be determined from Eq. (2), and while its value depends on the phenomenological coefficients of the Landau theory, qualitatively the metamagnetic transition results in a sudden increase of at (by at T at ambient pressure Knebel et al. (2019)). This then drives down according to Eq. (4) not and pins the upper critical field at the metamagnetic transition, explaining the sudden disappearance of superconductivity at the the field that marks the onset of the FP phase in Fig. 4(c).
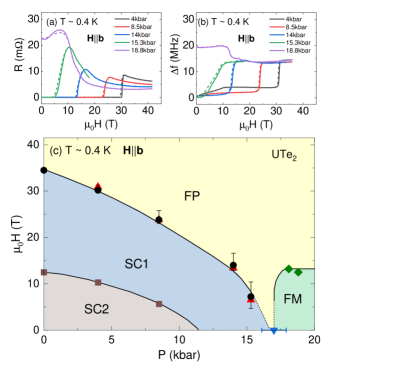
Focusing on the evolution of the ground state of UTe2 with field and pressure (i.e., at our base temperature of 0.4 K), we present summary plots of the resistance and TDO data as well as the ground state field-pressure phase diagram in Fig. 4. As shown, the field boundaries of both SC1 and SC2 superconducting phases decrease monotonically with increasing pressure. However, we point out that, while the boundary of SC2 appears to be an uninterrupted upper critical field, that of SC1 is in fact the cutoff field . It follows from Eq. (4) that this cutoff field is reduced compared to the putative , which would lie at higher fields if it were derived from an orbital-limited model without taking metamagnetic transition into account.
While the of SC1 increases with pressure, the cutoff imposed by introduces difficulty in determining whether its putative would also first increase with pressure. On the contrary, the unobstructed view of for SC2 shows a decrease with increasing pressure that is indeed consistent with the suggested decrease of the lower transition observed in zero-field specific heat measurements Braithwaite et al. (2019).
Between 15.3 and 18.8 kbar, the cutoff is completely suppressed and the FM phase onsets. While it is difficult to obtain a continuous measure of the pressure evolution through that transition, the step-like increase in the TDO frequency at a field near 12.5 T (c.f. Fig. 4(b)) measured at kbar suggests that the low-field FM phase is the true magnetic ground state of the system, separate from the FP phase. Upon closer inspection, we note that the step-like change in the TDO frequency in Figs. 2(b) and 4(b) is in fact an inflection point, suggesting that the FM and FP phases are in fact separated by a crossover, rather than a true phase transition. This is entirely natural from the Landau theory perspective, since the external magnetic field is conjugate to the FM order parameter in Eq. (2), and the metamagnetic crossover at field leads to a step-like increase in the magnetization, reflected in our TDO measurement.
This crossover boundary between the FM and FP phases appears much less sensitive to pressure for , as evidenced by the minimal change in field value between 18.1 and 18.8 kbar. Because the experimental pressure cannot be tuned continuously, it is difficult to extract the behaviour of the crossover boundary at . However, the previously observed discontinuity between the FM and SC1 phases as a function of pressure Ran et al. (2019c) suggests that the FP phase should extend down to zero field at a critical point of kbar, exactly where previous zero-field work has shown an abrupt cutoff of and the onset of a non-superconducting phase Braithwaite et al. (2019).
In summary, we have explored the pressure evolution of multiple superconducting and multiple magnetic phases of UTe2 as a function of applied pressures and magnetic fields applied along the crystallographic -axis, where superconductivity is known to extend to the highest fields. The field-induced metamagnetic transition results in a field-polarized phase which cuts off superconductivity prematurely, as explained by a phenomenological Ginzburg–Landau theory. Under increasing pressure, the superconducting phase eventually becomes completely suppressed, at the critical pressure where we observe an onset of a distinct ferromagnetic-like ground state.
I acknowledgments
We thank H.-K. Wu and Y.-T. Hsu for useful discussions. This work was performed at the National High Magnetic Field Laboratory, which is supported by the National Science Foundation Cooperative Agreement No. DMR-1644779 and the State of Florida. Research at the University of Maryland was supported by AFOSR grant no. FA9550-14-1-0332, NSF grant no. DMR-1905891, the Gordon and Betty Moore Foundation’s EPiQS Initiative through grant no. GBMF9071, NIST, and the Maryland Quantum Materials Center. A.H.N. acknowledges support from the Robert A. Welch Foundation grant C-1818.
References
- Aoki et al. (2019a) D. Aoki, K. Ishida, and J. Flouquet, Journal of the Physical Society of Japan 88, 022001 (2019a).
- Mineev (2015) V. P. Mineev, Phys. Rev. B 91, 014506 (2015).
- Sundar et al. (2019) S. Sundar, S. Gheidi, K. Akintola, A. Côté, S. Dunsiger, S. Ran, N. Butch, S. Saha, J. Paglione, and J. Sonier, Physical Review B 100, 140502 (2019).
- Ran et al. (2019a) S. Ran, C. Eckberg, Q.-P. Ding, Y. Furukawa, T. Metz, S. R. Saha, I.-L. Liu, M. Zic, H. Kim, J. Paglione, et al., Science 365, 684 (2019a).
- Aoki et al. (2019b) D. Aoki, A. Nakamura, F. Honda, D. Li, Y. Homma, Y. Shimizu, Y. J. Sato, G. Knebel, J.-P. Brison, A. Pourret, et al., Journal of the Physical Society of Japan 88, 043702 (2019b).
- Metz et al. (2019) T. Metz, S. Bae, S. Ran, I.-L. Liu, Y. S. Eo, W. T. Fuhrman, D. F. Agterberg, S. M. Anlage, N. P. Butch, and J. Paglione, Phys. Rev. B 100, 220504 (2019).
- Nakamine et al. (2019) G. Nakamine, S. Kitagawa, K. Ishida, Y. Tokunaga, H. Sakai, S. Kambe, A. Nakamura, Y. Shimizu, Y. Homma, D. Li, F. Honda, and D. Aoki, Journal of the Physical Society of Japan 88, 113703 (2019), https://doi.org/10.7566/JPSJ.88.113703 .
- Bae et al. (2019) S. Bae, H. Kim, S. Ran, Y. S. Eo, I.-L. Liu, W. Fuhrman, J. Paglione, N. P. Butch, and S. Anlage, “Anomalous normal fluid response in a chiral superconductor,” (2019), arXiv:1909.09032 [cond-mat.supr-con] .
- Jiao et al. (2019) L. Jiao, Z. Wang, S. Ran, J. O. Rodriguez, M. Sigrist, Z. Wang, N. Butch, and V. Madhavan, “Microscopic evidence for a chiral superconducting order parameter in the heavy fermion superconductor ute2,” (2019), arXiv:1908.02846 [cond-mat.mtrl-sci] .
- Knebel et al. (2019) G. Knebel, W. Knafo, A. Pourret, Q. Niu, M. Vališka, D. Braithwaite, G. Lapertot, M. Nardone, A. Zitouni, S. Mishra, I. Sheikin, G. Seyfarth, J.-P. Brison, D. Aoki, and J. Flouquet, Journal of the Physical Society of Japan 88, 063707 (2019), https://doi.org/10.7566/JPSJ.88.063707 .
- Ran et al. (2019b) S. Ran, I.-L. Liu, Y. S. Eo, D. J. Campbell, P. M. Neves, W. T. Fuhrman, S. R. Saha, C. Eckberg, H. Kim, D. Graf, et al., Nature Physics , 1 (2019b).
- Ran et al. (2019c) S. Ran, H. Kim, I.-L. Liu, S. Saha, I. Hayes, T. Metz, Y. S. Eo, J. Paglione, and N. P. Butch, “Enhanced spin triplet superconductivity due to kondo destabilization,” (2019c), arXiv:1909.06932 [cond-mat.supr-con] .
- Braithwaite et al. (2019) D. Braithwaite, M. Valiska, G. Knebel, G. Lapertot, J.-P. Brison, A. Pourret, M. E. Zhitomirsky, J. Flouquet, F. Honda, and D. Aoki, Communications Physics 2, 147 (2019).
- Knafo et al. (2019) W. Knafo, M. Vališka, D. Braithwaite, G. Lapertot, G. Knebel, A. Pourret, J.-P. Brison, J. Flouquet, and D. Aoki, Journal of the Physical Society of Japan 88, 063705 (2019).
- Miyake et al. (2019) A. Miyake, Y. Shimizu, Y. J. Sato, D. Li, A. Nakamura, Y. Homma, F. Honda, J. Flouquet, M. Tokunaga, and D. Aoki, Journal of the Physical Society of Japan 88, 063706 (2019), https://doi.org/10.7566/JPSJ.88.063706 .
- Piermarini et al. (1975) G. J. Piermarini, S. Block, J. Barnett, and R. Forman, Journal of Applied Physics 46, 2774 (1975).
- Ragan et al. (1992) D. D. Ragan, R. Gustavsen, and D. Schiferl, Journal of applied physics 72, 5539 (1992).
- Kim et al. (2013) H. Kim, N. H. Sung, B. K. Cho, M. A. Tanatar, and R. Prozorov, Phys. Rev. B 87, 094515 (2013).
- Cho et al. (2011) K. Cho, H. Kim, M. A. Tanatar, Y. J. Song, Y. S. Kwon, W. A. Coniglio, C. C. Agosta, A. Gurevich, and R. Prozorov, Phys. Rev. B 83, 060502 (2011).
- Prommapan et al. (2011) P. Prommapan, M. A. Tanatar, B. Lee, S. Khim, K. H. Kim, and R. Prozorov, Physical Review B 84, 060509 (2011).
- Hayes et al. (2020) I. M. Hayes, D. S. Wei, T. Metz, J. Zhang, Y. S. Eo, S. Ran, S. R. Saha, J. Collini, N. P. Butch, D. F. Agterberg, A. Kapitulnik, and J. Paglione, “Weyl superconductivity in ute2,” (2020), arXiv:2002.02539 [cond-mat.str-el] .
- Nevidomskyy (2020) A. H. Nevidomskyy, “Stability of a nonunitary triplet pairing on the border of magnetism in UTe2,” (2020), arXiv:2001.02699 [cond-mat.supr-con] .
- (23) D. F. Agterberg, Private communication.
- Mineev and Samokhin (1999) V. P. Mineev and K. V. Samokhin, Introduction to Unconventional Superconductivity (CRC Press, 1999).
- Tinkham (2004) M. Tinkham, Introduction to Superconductivity (Dover publications, 2004).
- (26) It should be noted that while the analysis of the linearized gap equation in Eq. (4) is rather standard, it only applies in the vicinity of and cannot, strictly speaking, be used to infer the value of at low temperatures; at the same time, the celebrated Werthamer–Helfand–Hohenberg theory Werthamer et al. (1966) establishes a proportionality between the value of and the slope of and , thus lending credibility to the extrapolation of Eq. (4) to lower temperatures.
- Werthamer et al. (1966) N. R. Werthamer, E. Helfand, and P. C. Hohenberg, Physical Review 147, 295 (1966).