A major optical & X-ray outburst from the Magellanic Bridge source RX J0209.6-7427
Abstract
RX J0209.6-7427 is an X-ray source in the Magellanic Bridge that was first detected in 1993, but not seen again till 2019. It has been identified as a member of the Be/X-ray binary class, a category of objects that are well established as bright, often-unpredictable transients. Such systems are rarely known in the Bridge, possibly because they lie outside the area most commonly studied by X-ray telescopes. Whatever the reason for the sparse number of such systems in the Bridge, they can provide useful tools for trying to understand the result of the tidal dynamics of the two Magellanic Clouds. In this paper the nature of the object is explored with the help of new data obtained during the latest outburst. In particular, the first optical spectrum of the counterpart is presented to help classify the star, plus measurements of the Balmer emission lines over several years are used to investigate changes in the size and structure of the circumstellar disk.
keywords:
stars: emission line, Be X-rays: binaries1 Introduction
The Magellanic Bridge is the name given to the region linking the two Magellanic Clouds. It is clearly visible in HI radio mapping (Putman, 2000) and in young stellar population (Skowron et al., 2014; Jacyszyn-Dobrzeniecka et al., 2020), and is thought to represent material torn out of the Small Magellanic Cloud (SMC) as a result of severe tidal interactions between the two galaxies. The age and content of this material is not well understood and identifying the stellar population is a valuable tool. In particular, the study of High Mass X-ray Binaries (HMXBs) provides a valuable insight in star formation and evolution because of their relatively short life times (Grimm et al., 2003). To date there are only 4 confirmed HMXBs in the Bridge in contrast to the 80 in the nearby SMC (Coe & Kirk, 2015). This small number may, in part, be due to the limited X-ray mapping of this region, but it may also be providing some important insight into the physical nature of the Bridge. In this paper we report on a relatively rare event - a super-Eddington outburst from one of the 4 known HMXB systems.
RX J0209.6-7427 was originally reported by Kahabka & Hilker (2005) using two observations from 1993 with the ROSAT observatory. The peak X-ray luminosity in the 0.1 - 2.4 keV range was reported in 1993 as ergs s-1 assuming an SMC distance of 60 kpc (Kahabka & Hilker, 2005). Those authors re-analysed the original data and located the source to 12" and then carried out an optical study of the region, suggesting that a previously-unclassified OB star with a type B0 - B1V was the counterpart. They measured the red spectrum of this star and determined it exhibited H emission with an Equivalent Width value of -10.80.2Å.
In addition Kahabka & Hilker (2005) carried out a timing analysis of the X-ray flux and suggested that the strong period they saw at 39d might be the binary period of the system. But they also warned that the separation of the two observations (200d) might be influencing the result.
Subsequently the source remained undetected at X-ray wavelengths until it was picked up by the Monitor of All-sky X-ray Image telescope (MAXI) on 20 November 2019 at the start of a new outburst (Negoro et al., 2019). They initially named the source MAXI J0206-749 as the large uncertainty in the position determined from MAXI did not immediately link it to RX J0209.6-7427. That link was made by observations from the Swift observatory (Kennea et al., 2019) which scanned the area around the MAXI position and only detected one new outbursting object - RX J0209.6-7427.
Follow-up X-ray observations by the Neutron Star Interior Composition Explorer (NICER) quickly revealed the detection of a previously unknown pulse period of 9.29s (Iwakiri et al., 2019). The combination of the MAXI and NICER data suggests that the peak luminosity from this outburst in the photon energy range 0.2 - 10 keV reached in excess of ergs s-1.
In this paper we report on optical spectroscopy and photometry of the counterpart to RX J0209.6-7427 contemporaneous with the 2019 X-ray outburst, including the first blue spectrum of the optical counterpart. In addition we report on historical optical data (photometric and spectroscopic) showing the behaviour of the counterpart over the last 15 years.
2 Observations
2.1 MAXI
The new outburst from this source was first reported by Negoro et al. (2019) using observations made from the MAXI instrument on the ISS (Matsuoka et al., 2009). The instrument continued to monitor the source throughout the outburst and the resulting public 2-10 keV X-ray lightcurve is shown in the lower panel of Fig 1.

2.2 OGLE
The OGLE project (Udalski et al., 1997) provides long term I-band photometry with a cadence of 1-3 days. Once the optical counterpart of the source had been identified through the accurate Swift XRT position (Kennea et al., 2019) with a previously known Be star (Kahabka & Hilker, 2005), it was possible to retrieve many years of photometric monitoring from OGLE IV in the I-band, plus sparser coverage in the V band. The source is identified as MBR109.10.389D in the I band and MBR109.10.V.1488 in the V band.
The subset of the OGLE I-band data that coincide with the current X-ray outburst are shown in the top panel of Fig 1. All the OGLE I-band data are presented in Fig 2.
The OGLE data were searched for any evidence of a periodicity that might be associated with a binary period. The Corbet diagram for sources of this nature would suggest that the binary period lies in the range 20 - 30d. So, the data with, and without, the current outburst were searched using Lomb-Scargle routines, but revealed no significant periods in the search range of 2 - 100d.

2.3 SAAO 1.9m telescope
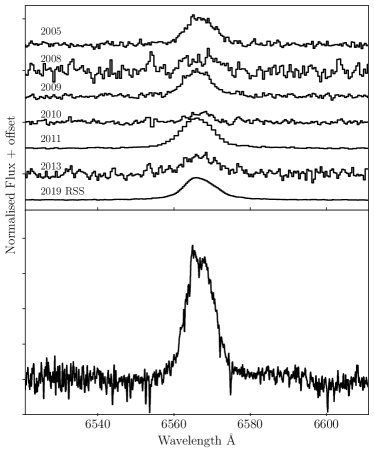
Optical spectra of optical counterpart to RX J0209.6-7427 were obtained over several years with the South Africa Astronomical Observatory (SAAO) 1.9-m telescope, Sutherland Observatory, South Africa. The spectrograph was used with the SITe detector and a 1200 l/mm grating over the range 6300-6900Å. The dispersion was 1.0Å/pixel and the resulting SNR approximately 10. The spectra are shown in Fig 3 and the determined Equivalent Width measurements for the H emission line are presented in Table 1.
2.4 SALT
We observed the optical counterpart of RX J0209.6-7427 with the Southern African Large Telescope (SALT; Buckley
et al. 2006) using the Robert Stobie Spectrograph (RSS; Burgh
et al. 2003; Kobulnicky
et al. 2003) and the High Resolution Spectrograph (HRS; Bramall
et al. 2010; Crause
et al. 2014). The observation performed with the RSS was obtained on 21 November 2019 with grating PG1800 (resolution 2.6 Å) and covers a wavelength range Å. An exposure time of 1600 s was used for the observation. The primary steps of data reduction were performed with the SALT pipeline (Crawford
et al., 2012), which include overscan correction, bias subtraction, gain correction and amplifier cross-talk correction. The remaining steps were carried out in a standard way using iraf111Image Reduction and Analysis Facility: iraf.noao.edu (arc line identification, background subtraction and extraction of the 1D spectrum).
The two observations obtained with the HRS were performed on 30 November 2019 and 6 December 2019 using the low resolution () and medium resolution () modes, respectively. We used exposure times of 1800 s and 2200 s for the low resolution and medium resolution mode observations, respectively. The HRS observations cover a wavelength range of Å. The SALT pipeline (Crawford, 2015) was used for the primary reductions, while the remainder of the reductions were done using the midas feros (Stahl
et al., 1999) and echelle (Ballester, 1992) packages (which include background subtraction, identification of arc lines, blaze function removal and order merging). See Kniazev et al. (2016) for a full description of the reduction procedure. The resulting spectra are shown in Fig 3.
2.5 NTT/EFOSC2 data
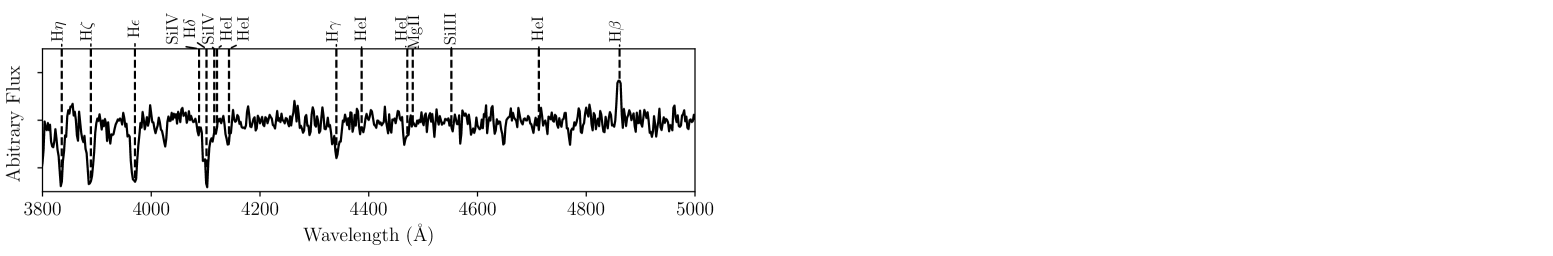
RX J0209.6-7427 has also been observed with the ESO Faint Object Spectrograph and Camera v2. (EFOSC2 Buzzoni et al., 1984), mounted at the Nasmyth B focus of the 3.6m New Technology Telescope (NTT) at La Silla Observatory, Chile, on the night of 2011 December 11. At that time the OGLE data showed the source to be at I=14.7 compared to the SALT observations mentioned above when the source was somewhat brighter at I=14.4.The instrument was in longslit mode with a slit width of 1.5 arcsec and instrument binning 22. Grisms 14 and 20 were used to obtain spectra at both blue (3500 - 5000 Å) and red (6000 - 7000Å) wavelengths i.e. covering all the Balmer transitions. For Grism 14, this lead to a dispersion of Å/pix and a resolution of Å/fwhm. For Grism 20, this lead to a dispersion of 1Å/pix and a resolution of 6Å/fwhm. Both spectra have a SNR of . The spectra were reduced, extracted and calibrated using the standard iraf packages.
Shown in Fig 4 is the blue spectrum obtained from EFOSC2. The spectrum has had a radial velocity correction applied corresponding to -150 km s-1, derived from a Voigt profile fit to the H profile, taken immediately after. The H Balmer line (4861Å) is in emission like H, but the rest of the Balmer series show absorption profiles.
| Date | Julian Date | Telescope | SNR | EW | Comments |
|---|---|---|---|---|---|
| 26 July 2004 | 2453213.45 | ESO/VLT | – 10.8 0.2 | Kahabka & Hilker (2005) | |
| 30 Oct 2005 | 2453673.62 | SAAO 1.9m | 13.5 | –10.1.4 | Good strong spectrum, possibly a flat top |
| 5 Dec 2008 | 2454805.58 | SAAO1.9m | 5.0 | –10.9 | Weak SNR, shape unclear if there at all |
| 11 Dec 2009 | 2455177.46 | SAAO1.9m | 16.5 | –9.71.2 | Strong signal, single peak |
| 21 Dec 2010 | 2455551.58 | SAAO1.9m | 20.1 | –3.01.5 | Weak |
| 11 Dec 2011 | 2455907.45 | ESO/NTT | 70.5 | –12.5 | strong single peak |
| 3 Nov 2013 | 2456599.62 | SAAO1.9m | 8.5 | –8.12.6 | Good SNR, single peak |
| 21 Nov 2019 | 2458809.35 | SALT | 197.5 | –9.30.1 | Strong single peak |
| 30 Nov 2019 | 2458818.33 | SALT | 16.2 | –8.90.1 | Strong single peak |
| 6 Dec 2019 | 2458824.29 | SALT | 16.8 | –8.21.3 | Evidence for a flat top or double peak |
3 Discussion
3.1 Circumstellar disk size
If the Keplerian velocity distribution of matter in the disk can be assumed then Huang (1972) demonstrated that the size of the H region of the circumstellar disk can be estimated by using the peak separation, V, of the double peaked H emission lines.
From the spectrum shown in the lower panel of Fig 3 the measured peak separation is 2.40.1 Å, or, in velocity space, 1105 km/s. The inclination angle of the disk to the line of sight, i, is unknown and clearly affects the interpretation of any rotational velocities. So it is assumed that sin i = 0.5 for what follows. We also assume that the stellar classification lies in the range B0IV - B2V i.e. with a stellar radius size range of 12.1 - 5.6, and stellar masses of 23 - 11 respectively. Inputting those numbers for sin i and the stellar radii into Eq 1 of Monageng et al. (2017), the measured peak separation suggests an H emitting disk of radius 130-280 or m.
There is a well-established relationship between the H EW and the predicted peak separation - see Zamanov et al. (2001) for applications to a sample of typical Be stars found in X-ray binaries. Taking the H typical value during the recent outburst as -9Å this predicts a peak separation of 96 km/s - very similar to the value of 1105 km/s directly measured above.
This value for the H disc size is at the top end of the range seen for other similar systems in X-ray active states - see Monageng et al. (2017) for a sample of such objects. But we note that this outburst is an extreme one and hence the disk size is also probably unusually large.
3.2 Circumstellar disk variability
From Fig 1 it can be seen that the X-ray brightening correlates remarkably well with that of the optical I-band data. This is clearly a rare event as we can see from Fig 2 that the optical emission has not been this bright for more than a decade. Presumably this brightening is triggered by an exceptional mass ejection from the B-type star. Had the disk grown gradually then the X-ray emission would have started to appear at a low level around periastron passage of the neutron star - the so-called Type I outbursts. But in this case the inferred extreme mass outflow has clearly filled the entire orbital space triggering a large and extensive X-ray outburst. This is typical of a Type II outburst.
Though the OGLE project primarily collects data in the I-band, it occasionally also takes V-band measurements. This makes it possible to construct a colour-magnitude diagram (CMD) over time. In the past such diagrams have been very helpful in displaying the disk colour changes during growth and decline by revealing a looping pattern on the CMD - see Rajoelimanana et al. (2011) for several examples of such behaviour. The extent of the looping is believed to be related to the inclination of the disk to our line of sight.
If no loop is evident, then there is normally a strong correlation between the disk colour and the I band magnitude. In general, disks reveal increasing red colours the larger they get. This is because the outer sections of the disk are always cooler than the stellar temperature - see Monageng et al. (2019) for an excellent example of such behaviour in SXP 91.1.
However in this case the behaviour pattern is more complex - see Figure 5. What can be said is that the most recent, brightest points show up in the upper right quadrant of this colour-magnitude change. Prior to that there have been significant smaller colour changes, but with little change in brightness. It could be a system that normally goes through erratic variability, where the disc does not completely dissipate before renewed disc-growth episodes occur. Certainly the detection of the H line always in emission seems to support this idea.
The range in colour in Fig. 5 is on the order of 0.1 mag, which is typically seen during disc-growth in other BeXBs (see Rajoelimanana et al. 2011). In the case of RX J0209.6-7427, however, the change in brightness from the Be disc is relatively small. From the H-alpha profiles in Figs. 3 we can infer a low viewing angle of the disc (i.e. close to face-on) (Horne & Marsh, 1986), which would in turn result in a strong correlation between the colour and magnitude (Harmanec, 1983; Rajoelimanana et al., 2011). The historic relatively small change in magnitude during disc growth is possibly an indicator of an optically thin disc which does not contribute too much to the continuum emission for the brightness to change significantly.
Finally, we note that the current outburst reveals two strong optical peaks separated by 50d - see Fig 1. This could be indicative of a binary period, with the already enlarged circumstellar disk being further extended at the time of periastron by interaction with the companion neutron star. Alternatively it could simply be evidence for a system showing multiple mass ejections during this very active period.

3.3 Spectral type of the optical counterpart
Classifying B-type stars in low metallicity environments, such as the SMC, is not straight forward; the metal lines that are primarily used as a diagnostic are noticeably weaker (see Lennon, 1997, for a detailed discussion). This is compounded when looking at low luminosity stars, as the strengths of these lines also correlate with luminosity (see e.g. Evans et al., 2004). As such it is difficult to determine whether a metal line is not present due to temperature, or just not visible above the noise. High resolution, high signal to noise spectra are required to provide an accurate spectral classification. Nevertheless, Evans et al. (2004) provide a classification criteria for B-type stars in the SMC which we adopt here in a rough attempt at a classification. There appears to be evidence for Si ii which would point to a classification B1 or later. There is no evidence for Mg ii and a possible feature at which, if real, would correspond to Si iii. This would constrain the spectral type to B2 or earlier. It is not possible to say whether Si ii is absent or just not visible above the noise, which would further constrain the spectral type.
Therefore we conclude that the spectral range proposed by Kahabka & Hilker (2005) - based upon their photometry - of B0.5 to B1.5 is consistent with our own conclusions of B1 - B2. Higher quality spectroscopic data are required to narrow down the range more precisely.Nonetheless a counterpart with a spectral class in the B1-B2 range would be completely consistent with the spectral types seen in many other Be/X-ray binary systems in the SMC region (McBride et al., 2008).
3.4 Comparing 1993 outbursts to that of 2019
In Figure 6 the historical X-ray outburst profiles from 1993 (Kahabka & Hilker, 2005) are compared to the X-ray profile from the outburst being discussed in this work. All three outbursts are shown in this figure on the same timescale. The two 1993 outbursts were detected for 50d whereas the 2019 outburst is closer to 100d. The main differences seem to be longer rise time in 2019 plus a much longer decay time after the peak. The exponential rise time of the second 1993 outburst was 10d, whereas it is more like 15d in 2019. The longer decay time in 2019 may be, at least, partially attributable to the second optical outburst seen in the OGLE data which could have rejuvenated the circumstellar disk as it was beginning to decline. Or it could be due to some binary interaction. All of this provides valuable constraints for any future modelling of the mass injection rates into the disk and its consequential growth and decay. Previous Smooth Particle Hydrodynamic modelling of super-Eddington X-ray outbursts in a Be/X-ray system has shown that this can be quite a complex process with many changes in mass injection rates during the outburst (Brown et al., 2019).
The peak X-ray luminosity reported in 1993 was ergs s-1 assuming an SMC distance of 60 kpc (Kahabka & Hilker, 2005). NICER reported a flux of ergs cm-2 s-1 on 21 November 2019 (TJD 58808 Iwakiri et al., 2019). This corresponds to a luminosity of ergs s-1. At that time the MAXI flux was 0.008 ct/s, which subsequently increased to a peak of 0.14 ct/s. Scaling the NICER flux by this increase (a factor of 17.5) suggests that the peak luminosity from this outburst reached in excess of ergs s-1 for a source in the SMC - clearly super-Eddington in nature.
Outbursts of such a magnitude are certainly not common in the Small Magellanic Cloud, with only one previous example being documented in the last decade or so - that of SMC X-3 (Townsend et al., 2017). That source peaked at ergs s-1, very similar to what is reported here for RX J0209.6-7427. It also exhibited a rare high I-band brightness. Clearly such exceptional X-ray outbursts are driven by extreme behaviour in the mass donor, Be star, and the X-ray channel provides an excellent monitoring process for helping understand how frequent such unusual activity occurs.

4 Conclusions
Reported in this work are multiple optical photometric & spectroscopic observations of a Be/X-ray binary system in the Magellanic Bridge undergoing a major (super-Eddington) X-ray outburst. The new data, combined with previously unpublished historical data, reveal a system that seems constantly to have a significant circumstellar disk. As a result it must always be very close to triggering an X-ray outburst. This is perhaps surprising given that the previous X-ray detection of this system was in 1993 - some 26 years ago. However, X-ray coverage of this part of the sky has been relatively sparse and future more comprehensive mapping might reveal X-ray behaviour more consistent with its optical variability, and possibly clear evidence for the binary period of this system.
Acknowledgements
This research has made use of public MAXI data provided by RIKEN, JAXA and the MAXI team. The OGLE project has received funding from the National Science Centre, Poland, grant MAESTRO 2014/14/A/ST9/00121 to AU. IMM and DAHB are supported by the South African NRF. Some of the observations reported in this paper were obtained with the Southern African Large Telescope (SALT), as part of the Large Science Programme on transients 2018-2-LSP-001 (PI: Buckley). Based on observations collected at the European Organisation for Astronomical Research in the Southern Hemisphere under ESO programme 088.D-0352(A). ESB acknowledges support from the Marie Curie Actions of the European Commission (FP7-COFUND). Polish participation in SALT is funded by grant no. MNiSW DIR/WK/2016/07. This work is based on the research supported by the National Research Foundation of South Africa (Grant numbers 98969 and 93405).
References
- Ballester (1992) Ballester P., 1992, in Grosbøl P. J., de Ruijsscher R. C. E., eds, European Southern Observatory Conference and Workshop Proceedings Vol. 41, European Southern Observatory Conference and Workshop Proceedings. p. 177
- Bramall et al. (2010) Bramall D. G., et al., 2010, in Ground-based and Airborne Instrumentation for Astronomy III. p. 77354F, doi:10.1117/12.856382
- Brown et al. (2019) Brown R. O., Coe M. J., Ho W. C. G., Okazaki A. T., 2019, MNRAS, 486, 3078
- Buckley et al. (2006) Buckley D. A. H., Swart G. P., Meiring J. G., 2006, in Society of Photo-Optical Instrumentation Engineers (SPIE) Conference Series. p. 0, doi:10.1117/12.673750
- Burgh et al. (2003) Burgh E. B., Nordsieck K. H., Kobulnicky H. A., Williams T. B., O’Donoghue D., Smith M. P., Percival J. W., 2003, in Iye M., Moorwood A. F. M., eds, Society of Photo-Optical Instrumentation Engineers (SPIE) Conference Series Vol. 4841, Proc. SPIE. pp 1463–1471, doi:10.1117/12.460312
- Buzzoni et al. (1984) Buzzoni B., et al., 1984, The Messenger, 38, 9
- Coe & Kirk (2015) Coe M. J., Kirk J., 2015, MNRAS, 452, 969
- Crause et al. (2014) Crause L. A., et al., 2014, in Ground-based and Airborne Instrumentation for Astronomy V. p. 91476T, doi:10.1117/12.2055635
- Crawford (2015) Crawford S. M., 2015, pyhrs: Spectroscopic data reduction package for SALT, Astrophysics Source Code Library (ascl:1511.005)
- Crawford et al. (2012) Crawford S. M., et al., 2012, PySALT: SALT science pipeline, Astrophysics Source Code Library (ascl:1207.010)
- Evans et al. (2004) Evans C. J., Howarth I. D., Irwin M. J., Burnley A. W., Harries T. J., 2004, MNRAS, 353, 601
- Grimm et al. (2003) Grimm H. J., Gilfanov M., Sunyaev R., 2003, MNRAS, 339, 793
- Harmanec (1983) Harmanec P., 1983, Hvar Observatory Bulletin, 7, 55
- Horne & Marsh (1986) Horne K., Marsh T. R., 1986, MNRAS, 218, 761
- Huang (1972) Huang S.-S., 1972, ApJ, 171, 549
- Iwakiri et al. (2019) Iwakiri W., et al., 2019, The Astronomer’s Telegram, 13309, 1
- Jacyszyn-Dobrzeniecka et al. (2020) Jacyszyn-Dobrzeniecka A. M., et al., 2020, ApJ, 889, 25
- Kahabka & Hilker (2005) Kahabka P., Hilker M., 2005, A&A, 435, 9
- Kennea et al. (2019) Kennea J. A., et al., 2019, The Astronomer’s Telegram, 13303, 1
- Kniazev et al. (2016) Kniazev A. Y., Gvaramadze V. V., Berdnikov L. N., 2016, MNRAS, 459, 3068
- Kobulnicky et al. (2003) Kobulnicky H. A., Nordsieck K. H., Burgh E. B., Smith M. P., Percival J. W., Williams T. B., O’Donoghue D., 2003, in Iye M., Moorwood A. F. M., eds, Proc. SPIEVol. 4841, Instrument Design and Performance for Optical/Infrared Ground-based Telescopes. pp 1634–1644, doi:10.1117/12.460315
- Lennon (1997) Lennon D. J., 1997, A&A, 317, 871
- Matsuoka et al. (2009) Matsuoka M., et al., 2009, PASJ, 61, 999
- McBride et al. (2008) McBride V. A., Coe M. J., Negueruela I., Schurch M. P. E., McGowan K. E., 2008, MNRAS, 388, 1198
- Monageng et al. (2017) Monageng I. M., McBride V. A., Coe M. J., Steele I. A., Reig P., 2017, MNRAS, 464, 572
- Monageng et al. (2019) Monageng I. M., et al., 2019, MNRAS, 485, 4617
- Negoro et al. (2019) Negoro H., et al., 2019, The Astronomer’s Telegram, 13300, 1
- Putman (2000) Putman M. E., 2000, Publ. Astron. Soc. Australia, 17, 1
- Rajoelimanana et al. (2011) Rajoelimanana A. F., Charles P. A., Udalski A., 2011, MNRAS, 413, 1600
- Skowron et al. (2014) Skowron D. M., et al., 2014, ApJ, 795, 108
- Stahl et al. (1999) Stahl O., Kaufer A., Tubbesing S., 1999, in Guenther E., Stecklum B., Klose S., eds, Astronomical Society of the Pacific Conference Series Vol. 188, Optical and Infrared Spectroscopy of Circumstellar Matter. p. 331
- Townsend et al. (2017) Townsend L. J., Kennea J. A., Coe M. J., McBride V. A., Buckley D. A. H., Evans P. A., Udalski A., 2017, MNRAS, 471, 3878
- Udalski et al. (1997) Udalski A., Kubiak M., Szymanski M., 1997, Acta Astron., 47, 319
- Vollmann & Eversberg (2006) Vollmann K., Eversberg T., 2006, Astronomische Nachrichten, 327, 862
- Zamanov et al. (2001) Zamanov R. K., Reig P., Martí J., Coe M. J., Fabregat J., Tomov N. A., Valchev T., 2001, A&A, 367, 884