ASASSN-16oh: A nova outburst with no mass ejection – A new type of supersoft X-ray source in old populations
Abstract
ASASSN-16oh is a peculiar transient supersoft X-ray source without a mass ejection signature in the field of the Small Magellanic Cloud. Maccarone et al. (2019) concluded that ASASSN-16oh is the first dwarf nova with supersoft X-ray that originated from an equatorial accretion belt on a white dwarf (WD). Hillman et al. (2019) proposed a thermonuclear runaway model that both the X-rays and / photons are emitted from the hot WD. We calculated the same parameter models as Hillman et al.’s and found that they manipulated on/off the mass-accretion, and their best fit light curves are 6 mag fainter, and decay about 10 times slower, than that of ASASSN-16oh. We propose a nova model induced by a high rate of mass-accretion during a dwarf nova outburst, i.e., the X-rays originate from the surface of the hydrogen-burning WD whereas the photons are from the irradiated disk. Our model explains the main observational properties of ASASSN-16oh. We also obtained thermonuclear runaway models with no mass ejection for a wide range of parameters of the WD mass and mass-accretion rates including both natural and forced novae in low-metal environments of and . They are a new type of periodic supersoft X-ray sources with no mass ejection, and also a bright transient in / bands if they have a large disk. We suggest that such objects are candidates of Type Ia supernova progenitors because its mass is increasing at a very high efficiency .
1 Introduction
A nova is a thermonuclear runaway event on a mass-accreting white dwarf (WD). Novae usually brighten up by mag or more in a few or tens days and decline in a few months or years. After hydrogen ignites on the WD, the hydrogen-rich envelope expands to giant size and emits strong winds (e.g. Kato & Hachisu, 1994). The nova brightness is dominated by free-free emission from optically thin ejecta outside the photosphere. Thus, the peak optical brightness depends on the maximum wind mass-loss rate (e.g., Hachisu & Kato, 2006, 2015). Due to strong mass loss, the envelope loses its mass and the photosphere gradually shrinks and the photospheric temperature increases. Eventually the nova enters a supersoft X-ray source (SSS) phase. The envelope mass decreases further due to nuclear burning after the winds stop. Hydrogen burning ends when the envelope mass reaches a critical value. As a definition, a nova accompanies strong winds (mass-ejection) in the optical bright phase.
On the other hand, a dwarf nova is an accretion event on a compact object, in which the mass accretion is enhanced by a thermal instability of an accretion disk. Dwarf novae usually brighten up by mag in a day or so and stays at the brightness from a few days to a few weeks. However, no SSS phase has ever been observed in dwarf nova outbursts.
ASASSN-16oh is a peculiar transient SSS in the field of the Small Magellanic Cloud (SMC), which was discovered by the All Sky Automated Survey for Supernovae (ASASSN) on UT 2.15 December 2016 (JD 2,457,724.65) at (Jha et al., 2016). The brightness reaches an absolute magnitude of on JD 2,457,744.6, where we assume that the distance modulus is and the absorption in the band is toward ASASSN-16oh (Jha et al., 2016; Mroz et al., 2016). The Optical Gravitational Lensing Experiment IV (OGLE-IV) (Udalski et al., 2015) data show that the object is an irregular variable for several years with the quiescent luminosity of and (Maccarone et al., 2019).
The and light curves of ASASSN-16oh show a resemblance with those of long orbital-period dwarf novae such as V1017 Sgr in the peak brightness, outburst amplitude, and timescales (see Section 2 for detail). The orbital period of V1017 Sgr is days (Salazar et al., 2017). Therefore, Maccarone et al. (2019) expected the orbital period of ASASSN-16oh to be several days.
Maccarone et al. (2019) concluded that ASASSN-16oh is not a classical nova (thermonuclear runaway event) but an accretion event like a dwarf nova, mainly because (1) the optical spectra show a very narrow width of He II emission with no signature of mass-ejection, (2) very slow rise ( days) to the optical maximum compared with those of classical novae (a few days), (3) rather dark peak magnitude of compared with those of recurrent novae (e.g., the 1 year recurrence period nova M31N 2008-12a of , Darnley et al., 2015; Henze et al., 2018).
Only the concern is the origin of supersoft X-rays because no SSS phase has been detected in dwarf nova outbursts. Maccarone et al. (2019) interpreted the supersoft X-rays could originate from a spreading layer around the equatorial accretion belt. This model requires a very high mass accretion rate of yr-1 ( g s-1) on a very massive WD of to support high temperatures and fluxes for supersoft X-ray.
The hot spreading layer of the accretion belt has not yet been studied in detail. If a disk around a massive WD with high accretion rates always accompany a hot spreading layer, such supersoft X-rays could be observed in recurrent novae in their quiescent phase in U Sco ( with yr-1, Hachisu et al., 2000) and RS Oph ( with yr-1, Hachisu et al., 2008), but not yet detected (see Section 6.4) This gives us the idea that the supersoft X-rays could originate from thermonuclear flashes on the WD.
It should be noted that the high instantaneous mass accretion rate ( yr-1) (Maccarone et al., 2019) is close to the critical value to maintain a steady hydrogen shell-burning, otherwise very weak shell flashes (see, e.g., Figure 6 of Kato et al., 2014). With such a high rate mass-accretion, nova outbursts are so weak that wind mass-loss is also weak. Moreover, a low-metallicity (low-) environment in SMC suggests weak mass ejection during nova outbursts. These condition led us to search nova (thermonuclear runaway event) solutions for no-mass-ejection (e.g. Kato, 1985; Kato & Hachisu, 2009). They are periodically variable supersoft X-ray sources (e.g., Hachisu et al., 2016). Such an object has not been observationally detected yet.
Hillman et al. (2019) proposed another interpretation of ASASSN-16oh, a thermonuclear runaway event, and calculated several shell flash models. They claimed that X-rays and photons are emitted from a WD that undergoes hydrogen burning. However, it is unlikely that a hot WD with a surface temperature K emits many low energy photons as well as X-rays. This concern led us to start the present work. We have calculated a nova model with the same parameters as Hillman et al.’s model, and obtained different results. This will be presented in Section 5.
It is reasonable that X-rays and optical photons come from different places in the binary system as interpreted by Maccarone et al. (2019). We regard that the photons originated from a large accretion disk irradiated by the hot WD. We propose a recurrent nova (thermonuclear runaway) model for the supersoft X-rays and search parameter region for no-mass-ejection novae. The main differences from Hillman et al.’s model are: (1) The photons originate from the accretion disk and companion star because the WD is too hot to emit many photons. (2) To explain the observed X-ray light curve, the WD mass is much higher () than that of Hillman et al.’s model (). (3) We suggest that the hydrogen shell flash could be triggered by a massive mass-inflow during a dwarf nova outburst.
Both models of dwarf nova (Maccarone et al., 2019) and thermonuclear shell flash (present work) are based on the presence of a mass-accreting massive WD () in ASASSN-16oh. In the latter model, the WD mass increases steadily because of no mass-ejection during the flash. Such a massive mass-increasing WD in a low environment is very interesting in binary evolution scenarios because it could be a new kind of candidates for Type Ia supernova progenitors.
The aim of this work is to present a theoretical model of ASASSN-16oh as well as to search for the possible region of novae with no mass ejection in low metallicity environments. We organize the present paper as follows. First, we summarize the observational properties of ASASSN-16oh in Section 2. Then, we briefly introduce possible parameter region for nova outbursts without mass-ejection including both forced and natural novae in Section 3. Our results are presented in Sections 4. We examine Hillman et al.’s (2019) nova model in Section 5, and compare our model with Maccarone et al.’s model in Section 6. Discussion and conclusions follow in Sections 7 and 8, respectively.
2 Observational properties of ASASSN-16oh
In this section we summarize the characteristic properties of ASASSN-16oh.
2.1 Light Curves
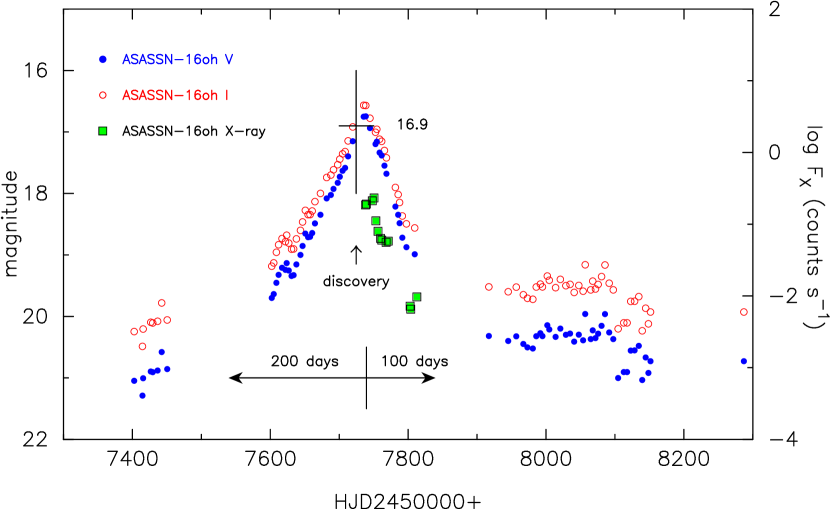
We plot the magnitudes of ASASSN-16oh in Figure 1 (unfilled red circles), taken from the OGLE-IV website (Mroz et al., 2016; Maccarone et al., 2019).
For later use, we have estimated the light curve from the data and several colors listed in Maccarone et al. (2019); in quiescent phase, on JD 2457657.7, on JD 2457681.78, and on JD 2457744.6. With a linear interpolation of these data and assumed (start, end) of the outburst to be (200 days before, 100 days after) the peak (JD 2457737.1), we recover the magnitudes (filled blue circles) as shown in Figure 1. We assumed that the brightness reaches maximum on JD 2457737.1 from an interpolation of the other data.
The characteristic property of the light curve is a slow rise, sharp peak followed by a rapid decay. The brightness rises slowly in days and decline fast in days. This properties are unlike to typical nova outbursts but rather similar to long orbital-period dwarf novae. For example, the dwarf nova outbursts of V1017 Sgr show a 90 days rise and 90 days decline with almost symmetric light curve shape. In contrast, a typical nova rises within a few days and decays much slowly in a timescale of years (see, e.g., Figure 1 of Hachisu & Kato, 2015).
There are other common properties between ASASSN-16oh and the dwarf nova V1017 Sgr. The peak brightness is in ASASSN-16oh, similar to in V1017 Sgr (Schaefer, 2018). The quiescent brightnesses of the both objects are also similar, that is, for ASASSN-16oh and for V1017 Sgr (Schaefer, 2018). Thus, the light curve shape of ASASSN-16oh may be explained as a long orbital-period dwarf nova.
2.2 Optical Spectrum
Maccarone et al. (2019) presented the Southern African Large Telescope (SALT) optical spectrum of ASASSN-16oh taken on UT 2016 December 16–24 (JD 2457738.5–245746.5), just after the peak (JD 2457737.1). This spectrum shows no indication of mass loss, such as many broad emission lines or P-Cygni profiles usually seen in classical novae. Thus, if this is a classical nova phenomenon, it is a rare case in which no wind mass-loss occurs.
2.3 X-ray Light Curve and Spectrum
A distinct difference between ASASSN-16oh and dwarf novae is the supersoft X-ray detection. No SSS phase has ever been detected in dwarf novae while a SSS phase is frequently observed in classical novae (Schwarz et al., 2011). If ASASSN-16oh is a dwarf nova, this is the first case of supersoft X-ray detection (Maccarone et al., 2019).
Figure 1 also shows the X-ray count rates observed with Swift ( keV: filled green squares outlined with black line). It seems that the X-ray count rate reaches maximum slightly later than the peak and decays with the light curve.
The X-ray spectra are dominated with soft components. Maccarone et al. (2019) deduced a blackbody temperature of 900,000 K and a flux of erg s-1 from the Swift/XRT spectrum on UT 15 December 2016 (JD 2,457,737.5) at the distance of the SMC. From the Chandra/LETG spectrum taken on UT 28 December 2016 (JD 2,457,750.5), Maccarone et al. (2019) derived a blackbody temperature of 905,000 K, a luminosity of erg s-1, and the hydrogen column density of cm-2, and, for an atmosphere model of solar abundance, 750,000 K and cm-2. Hillman et al. (2019) re-analyzed the same Chandra spectrum obtained by Maccarone et al. (2019) with a metal-poor atmosphere model and obtained the effective temperature of 750,000 K, the bolometric luminosity of erg s-1, and the hydrogen column density of cm-2.
2.4 Column Density and Unabsorbed X-ray Flux
Both Maccarone et al. (2019) and Hillman et al. (2019) obtained a similar column density of cm-2 that can be converted to (Bohlin et al., 1978), (Güver & Özel, 2009), or (Liszt, 2014). In the present paper, we adopt , , and .
Maccarone et al. (2019) obtained the unabsorbed X-ray luminosity to be erg s-1 from the Swift/XRT spectrum and to be erg s-1 from the Chandra/LETG spectrum. Hillman et al. (2019) obtained the unabsorbed X-ray flux to be erg s-1.
These luminosities are much lower than the Eddington luminosity erg s-1 for a WD. If it is a classical nova outburst, the X-ray luminosity from the naked WD is close to the Eddington limit. Hillman et al. (2019) suggested that the low brightness is owing to occultation by the accretion disk rim like in the recurrent nova U Sco, although they did not include effects of the accretion disk in their light curve model. Orio et al. (2013) estimated the unabsorbed X-ray luminosity of U Sco in the SSS phase to be erg s-1 from the Chandra/HRC-S and LETG spectra. The surface of the WD is occulted by the disk rim and the X-rays come from Thomson scattering by expanded plasma around the WD. This X-ray luminosity is similar to that of ASASSN-16oh.
2.5 Color: Evidence 1 of an Irradiated Accretion Disk
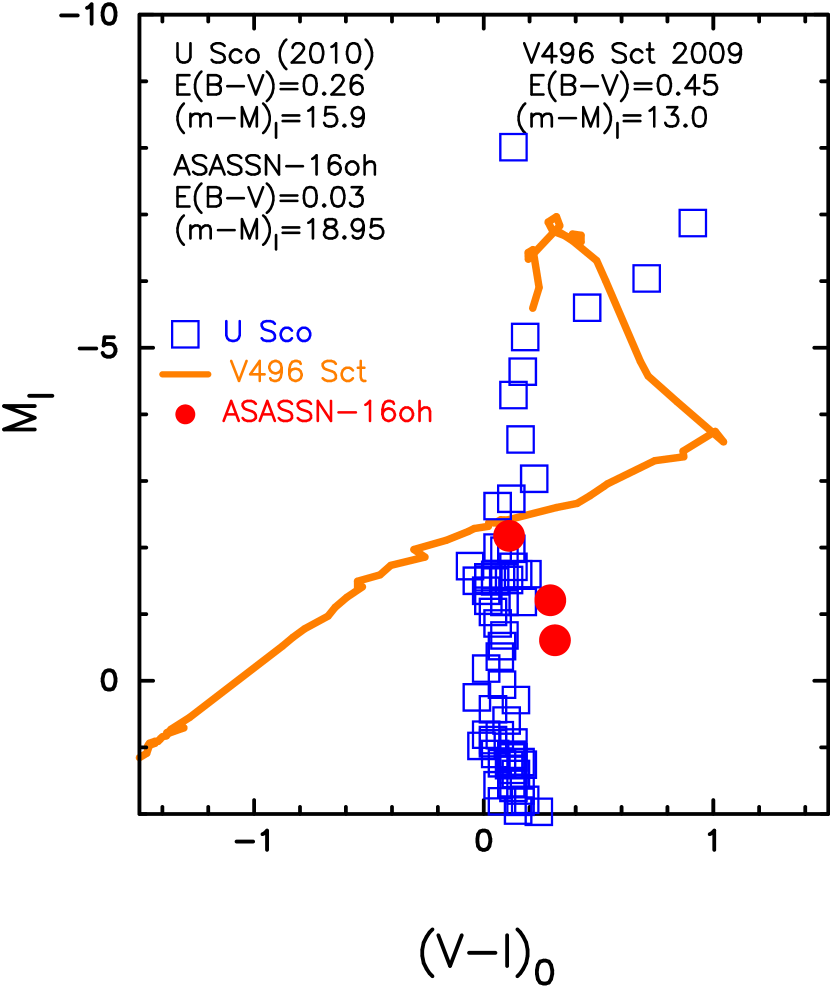
Figure 2 shows the color-magnitude diagram, -, of ASASSN-16oh, around the peak of the outburst (, , and days after the peak). Here, is the intrinsic color, which is calculated from the relation of (Rieke & Lebofsky, 1985), and is the absolute magnitude.
Figure 2 also shows the color-magnitude track of the recurrent nova U Sco in the 2010 outburst. We assume the distance modulus in the band to be and the reddening to be after Hachisu & Kato (2018b). The data of U Sco are taken from Pagnotta et al. (2015). Except for the short period after the peak (), the color of U Sco is almost constant, i.e., . U Sco has an irradiated accretion disk with the radius of (Hachisu et al., 2000). U Sco entered a plateau phase in the light curves when , that is, when as shown in Figure 2 of Pagnotta et al. (2015). This is because the and brightnesses are dominated by the irradiated accretion disk (Hachisu et al., 2000). This plateau phase corresponds almost to the SSS phase. The colors of ASASSN-16oh well overlap those of U Sco in its SSS phase (when ).
For comparison, we further add the track of a typical classical nova, V496 Sct. We assume the distance modulus in the band to be and the reddening to be after Hachisu & Kato (2019a). The data of V496 Sct are taken from the archives of the Variable Star Observers League of Japan (VSOLJ), the American Association of Variable Star Observers (AAVSO), the Small and Medium Aperture Telescope System (SMARTS, Walter et al., 2012), and Raj et al. (2012). The and light curves are plotted in Figure 52 of Hachisu & Kato (2019a) and the - color-magnitude diagram is presented in Hachisu & Kato (2019b). In usual classical novae, their optical spectra are dominated by free-free emission from optically thin ejecta. After the optical peak, the optical brightness monotonically decreases with time and its color goes toward the red due mainly to the emission line effect in the band such as O I and Ca II triplet. In the later phase (), the nova enters the nebular phase, and strong emission lines such as [O III] contribute to the band. Then, the color turns to the blue. No X-ray data of V496 Sct are available, but the nova should enter the SSS phase when it declined to as shown in Figures 50 and 52 of Hachisu & Kato (2019a).
In general, classical novae are short orbital period binaries of a few hours. They have an accretion disk with the radius of , the brightness of which is rather faint in the SSS phase. Even if the accretion disk survives after the nova outburst, it is deeply embedded in the ejecta. In the nebular phase, the accretion disk appears because the ejecta becomes optically thin but it is too small to contribute to the luminosity and color.
In contrast, U Sco has a large accretion disk with the radius of because the orbital period is days and its binary size (separation) is (Hachisu et al., 2000). Therefore, the irradiated disk substantially contributes to the and bands in the SSS phase (Hachisu et al., 2000). This is partly because the ejecta mass of U Sco is very small and the nebular emission line effect is relatively small. These physical properties give rise to the color-evolution difference between U Sco and V496 Sct.
Because the color in the SSS phase is similar between ASASSN-16oh and U Sco, we expect that the and brightnesses of ASASSN-16oh originate from the irradiated accretion disk like U Sco.
2.6 Light Curve: Evidence 2 of an Irradiated Accretion Disk
To further confirm the presence of an irradiated large accretion disk in ASASSN-16oh, we compare the absolute magnitude with two other binaries that have a prominent irradiated accretion disk. One is the galactic recurrent nova U Sco, and the other is the Large Magellanic Cloud (LMC) supersoft X-ray source RX J0513.96951.
2.6.1 U Sco
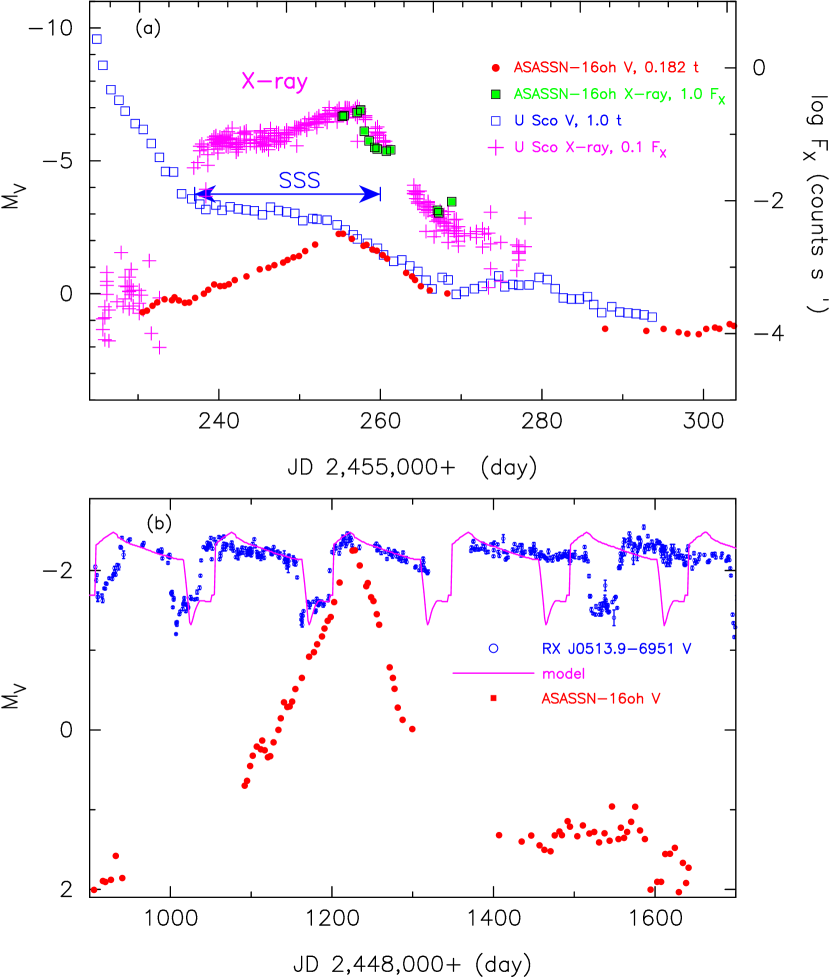
Figure 3(a) shows the light curve of U Sco in the 2010 outburst. We adopt the distance modulus in the band to be (Hachisu & Kato, 2018b). Around the optical peak, the brightness is dominated by the emission from the ejecta. As time goes on the ejecta becomes optically thin and the continuum emission from the irradiated disk becomes dominant. In the SSS phase, the light curve shows a plateau because its brightness is dominated by the irradiated accretion disk. The disk keeps a constant brightness until the nuclear burning turned off around JD 2,445,260.
We add the absolute magnitude, , light curve of ASASSN-16oh to compare with that of U Sco. Here, the timescale of ASASSN-16oh is squeezed by 5.5 times and the origin of time is shifted to match their supersoft X-ray peaks.
This figure demonstrates that the peak absolute magnitude of ASASSN-16oh is roughly the same as that of U Sco in the SSS phase. We expect that a larger irradiated disk is brighter. Thus, a rough agreement of the absolute brightness indicates that the sizes of the accretion disks are comparable. The orbital period of U Sco is days (Schaefer & Ringwald, 1995), and the disk size is (Hachisu et al., 2000). This is broadly consistent with the orbital period (several days) of ASASSN-16oh suggested by Maccarone et al. (2019).
2.6.2 RX J0513.96951
We also compare ASASSN-16oh with RX J0513.96951. This object shows a periodic variation in the magnitude as shown in Figure 3(b). Here we adopt the distance modulus in the band of RX J0513.96951 to be . We have (Pietrzyński et al., 2013) and (Imara & Blitz, 2007) toward the LMC. The supersoft X-ray flux is observed in the optical low state.
Hachisu & Kato (2003a) modeled this object with a binary consisting of an accreting WD, large accretion disk, and lobe-filling companion star. The mass accretion rate yr-1 is above the stability line so that hydrogen is stably burning. Thus, the WD is always as bright as the Eddington luminosity. At the beginning, the mass-transfer rate is larger than the critical rate of wind (, see, e.g., Figure 6 of Kato et al., 2014). The WD envelope expands to emit strong winds. The winds hit the surface of the companion star and strip off the very surface layer. This effect works to reduce or stop the mass transfer. The WD envelope shrinks and the winds stop. The temperature of the WD photosphere increases and the main emitting wavelength region moves to supersoft X-ray. The very surface layer of the companion star recovers its original radius in a thermal timescale and the mass transfer restarts. The high rate mass accretion onto the WD is further delayed by a viscous timescale of the accretion disk. After a total time of recovery (thermal timescale) and diffusion (viscous timescale), the high rate of mass accretion recovers. This is the mechanism of periodic variation of mass-transfer.
In the wind phase, the surface of the accretion disk is blown in the wind and the optically thick region of the accretion disk is enlarged to beyond the size of the binary. Because the irradiated surface area becomes large, it brightens up. This is the optical high state. When the winds stop, the size of the accretion disk comes back to the original size. Its brightness declines. This is the optical low state in the band. Thus, the optical high state corresponds to the wind phase and expanded accretion disk. In a model of Hachisu & Kato (2003a), the optically thick region of accretion disk expands comparable to the binary separation, for their binary model of and . The orbital period is days (Pakull et al., 1993).
We add the ASASSN-16oh data to Figure 3(b) in the same timescale. The peak of ASASSN-16oh is almost the same as the optical high state of RX J0513.96951. This is also an indication that ASASSN-16oh has a large irradiated disk comparable to that in RX J0513.96951.
2.7 UV/Optical SED: Evidence 3 of an Irradiated Accretion Disk
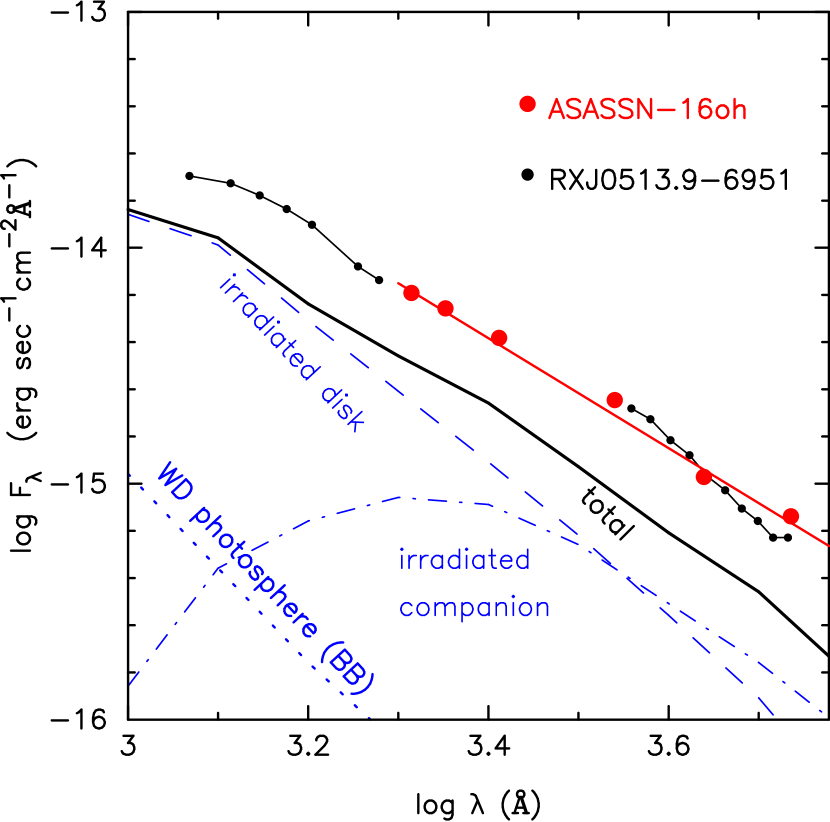
Maccarone et al. (2019) obtained the spectral energy distribution (SED) of ASASSN-16oh from 2000Å to 6000 Å that is well approximated by a power law of as in Figure 4. Here, is the energy flux at the wavelength . For comparison, we added the continuum flux of the LMC supersoft X-ray source RX J0513.9-6951, which is taken from the spectrum observed with the International Ultraviolet Explore (IUE)/SWP and 2.2 m Max-Planck ESO telescope (Pakull et al., 1993). This spectrum shows a resemblance to ASASSN-16oh, suggesting that the binary is consisting with a nuclear burning WD, irradiated accretion disk, and lobe-filling companion star like RX J0513.9-6951. We also add a model spectrum calculated by Popham & Di Stefano (1996) for LMC supersoft X-ray sources (thick solid black line). This model consists of a steady burning WD, irradiated accretion disk, and lobe-filling companion star. The total flux, which is the summation of these three components, well reproduces the law. The irradiated accretion disk dominantly contributes to the total flux, whereas the irradiated secondary star contributes only to the optical region. The contribution from the WD photosphere is negligible. The agreement in the SED between RX J0513.9-6951 and ASASSN-16oh also suggests the presence of an irradiated accretion disk in ASASSN-16oh. We will discuss this point in more detail in Section 6.2.
3 Numerical Calculation of Hydrogen Shell Flashes with no-mass-ejection
Based on the observational properties of ASASSN-16oh, it is natural to assume that X-rays and optical / emission originate from different places in the binary. We regard that the / band emission comes from an irradiated accretion disk and companion star, and the X-rays from a hot WD surface. Here, we focus our thought on shell flash models that show no-mass-ejection.
3.1 Novae without Mass-Ejection
As a definition, novae accompany a strong and fast mass ejection (or strong and fast wind mass-loss) (see, e.g., Warner, 1995). The optically thick winds are accelerated when the photospheric luminosity approaches the Eddington luminosity. Because the OPAL opacity has a prominent peak at (K) owing to iron ionization (Iglesias & Rogers, 1996), the optically thick winds are accelerated around this temperature region, i.e., deep inside the photosphere. The occurrence condition of winds was examined first by Kato (1985) for the old opacities, and then by Kato & Hachisu (2009) and Kato et al. (2013) for the OPAL opacities (Iglesias & Rogers, 1996). These works clarified that WDs do not emit optically-thick winds in the following cases.
-
1.
In low mass WDs, the wind acceleration is insufficient so that the wind velocity at the photosphere does not exceed the escape velocity there. The envelope simply expands and then shrinks without mass-ejection. This occurs in low mass WDs of for the metallicity of (Kato & Hachisu, 2009). The galactic slow nova PU Vul corresponds to this case (Kato et al., 2011, 2012).
-
2.
When the mass accretion rate is high and the ignition mass is very small, the envelope does not expand to reach (K) at the photosphere. Winds are not accelerated (Kato & Hachisu, 2009).
-
3.
In old population novae, the metallicity is very low so that the iron peak in the OPAL opacity is not high enough to accelerate winds (Kato et al., 2013).
-
4.
When the mass accretion rate is higher than the stability line of steady hydrogen burning , we can make a forced nova with no mass ejection by manipulating stop/restart of mass accretion. This will be explained in Section 3.3.
Among a huge number of galactic novae ( only one (PU Vul) is known to be the object without optically thick winds. ASASSN-16oh is an SMC object and could be in a low environment. With a lower , the wind acceleration is weaker because the lower iron abundance results in a smaller peak in the OPAL opacity. Kato et al. (2013) studied starts/ends of winds in various populations based on their steady-state approach. This approximation may not be good in the rising phase of strong nova outbursts. In this work, we study occurrence of winds using a stellar evolution code (Kato et al., 2017a).
3.2 Method and Model Parameters
Our numerical code is the same as that described in Kato et al. (2017a). When the hydrogen-rich envelope of the WD expands after hydrogen ignites, the wind mass-loss often occurs. Henyey-type codes, widely used in stellar evolution calculation, have difficulties in calculation of extended stages of nova outbursts. This led many authors assume some mass-loss in their numerical codes to continue calculation, but these mass-loss rates are not based on reliable acceleration mechanism of nova winds (Kato et al., 2017c). Kato et al. (2017a) introduced how to obtain the mass-loss rate consistent with optically thick winds (Kato & Hachisu, 1994). This method is to connect an interior structure with an outer wind solution, and needs many iterations and human time until we obtain the final value of mass-loss rate. In the present paper, we focus our calculation on no-mass-ejection novae. Therefore, without such an iteration process, we simply assume, if needed, a tentative mass-loss rate described by Equation (1) of Kato et al. (2017a).
We assume Population II composition for accreted matter, i.e., , , and , where is the hydrogen, is the helium, and is the heavy element content in mass weight. This corresponds to a typical metallicity of the SMC ([Fe/H]=) (Cioni, 2009).
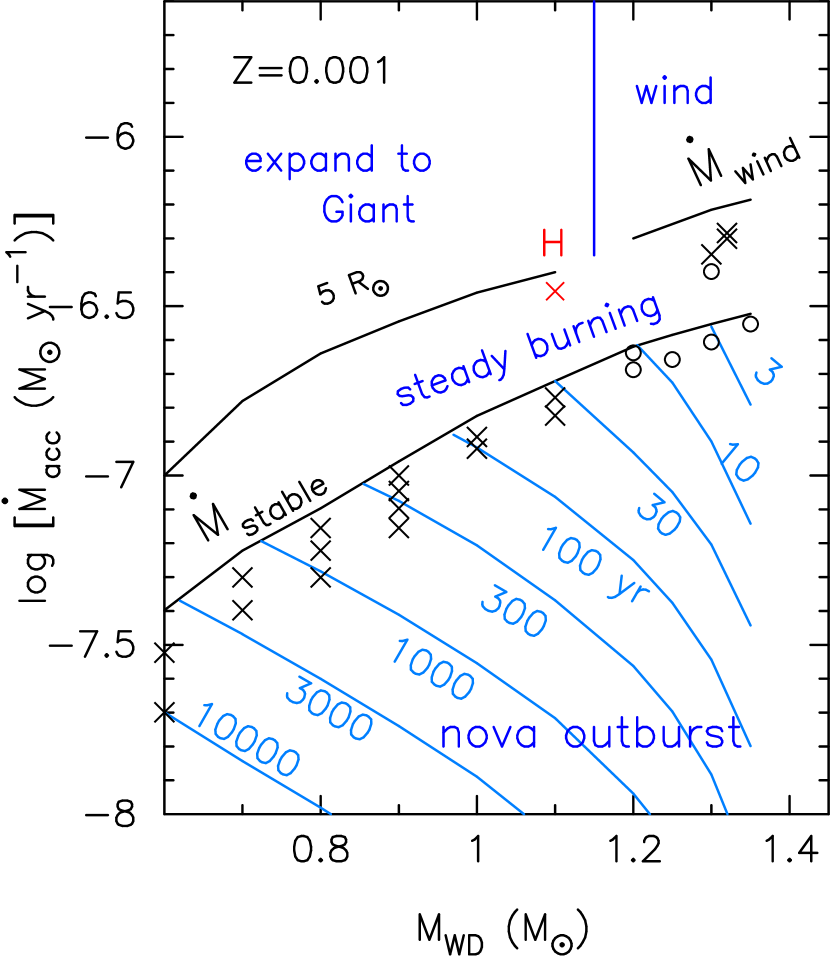
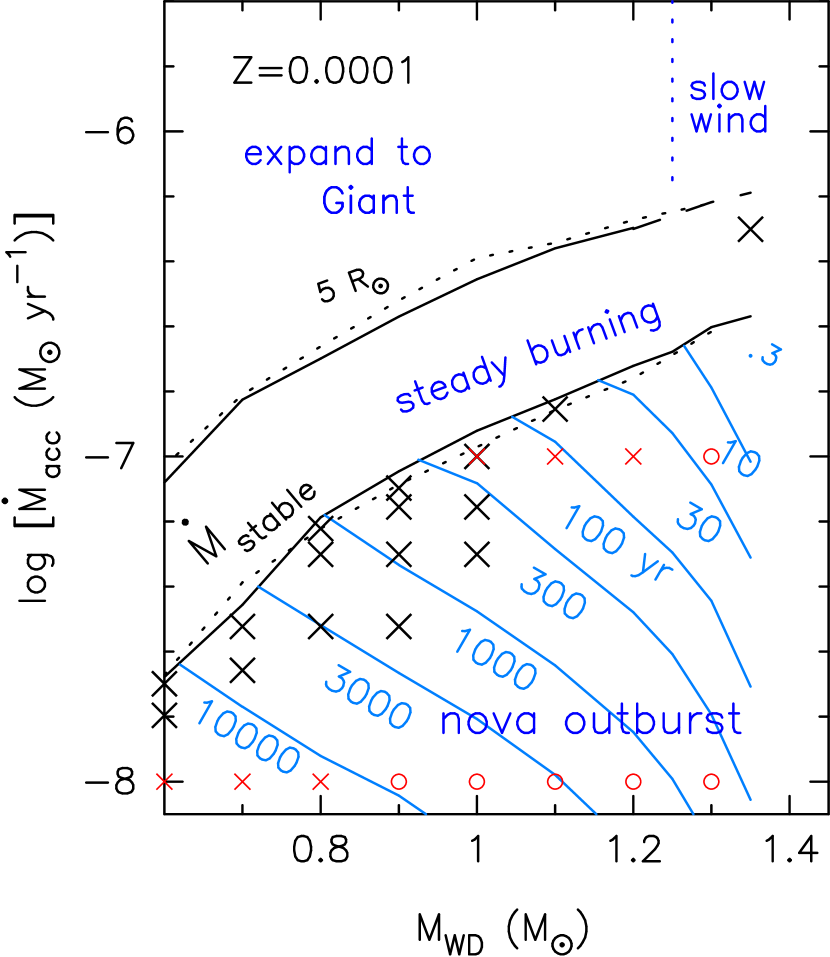
The WD mass and mass accretion rate of our models are plotted in Figure 5, which is the diagram of WD response for various WD masses and mass accretion rates. Below the stability line of steady hydrogen burning (lower black line labeled ), hydrogen shell burning is unstable and the accreting WDs experience periodic shell flashes, i.e., nova outbursts. The equi-recurrence period of shell flashes is depicted by the cyan-blue lines, with the period beside each line. The crosses represent no-mass-ejection models while the open circles depict models in which we assume mass-loss otherwise our calculation does not converge.
Above the stability line, the photospheric radius is larger for a larger mass accretion rate. In the region left to the vertical blue line (), the envelope eventually expands to giant size without mass-loss. The optically thick wind mass-loss occurs only in the region above the upper horizontal black line and right to the vertical blue line, i.e., very massive WDs () and high mass accretion rates ( yr-1).
3.3 Forced Novae and Natural Novae
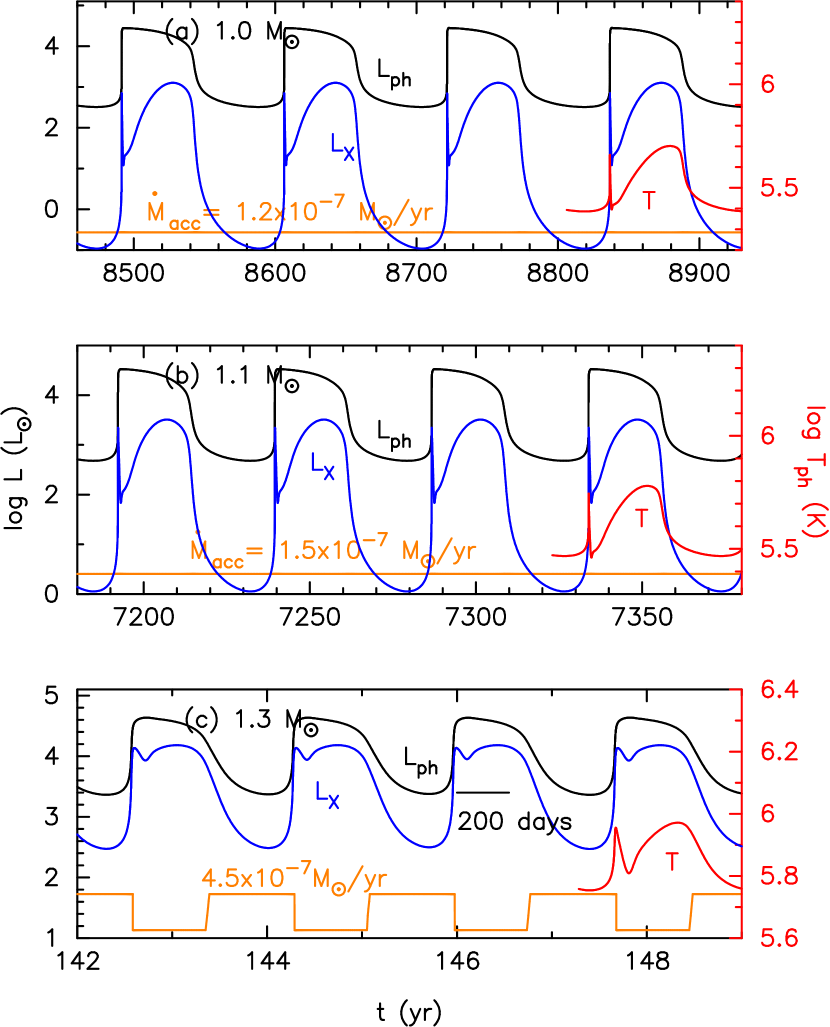
Figure 6 shows the last four cycles of our three models. No mass-ejection occurs in any of the models in this figure. The first two are close to but below the stability line, i.e., (a) with yr-1 and (b) with yr-1. The WD always accretes matter. The accretion rate is smaller than the nuclear burning rate during the flash (), then the envelope mass gradually decreases () to below the minimum envelope mass for hydrogen burning. Thus, hydrogen burning eventually ends. We call the novae that occur below the stability line “natural nova” to distinguish them from the “forced novae” that occur above the stability line (Hachisu et al., 2016).
Figure 6(c) shows an example of forced novae, i.e., with yr-1, being located above the stability line. In this region the nuclear burning rate is balanced to the accretion rate (). The decrease in the envelope mass is supplied by the mass accretion. Thus, if we continue the mass accretion, hydrogen-shell burning will never end. If we stop the mass accretion, the envelope mass decreases by nuclear burning and the shell-flash eventually ends. If we restart the mass accretion after some time later, we obtain the next shell flash. In this way, we have multi-cycle shell flashes. Figure 6(c) gives an example of the periodic change of the mass accretion rate. If we stop/restart the mass accretion in our model calculation, we obtain successive shell flashes.
Figure 6 compares characteristic properties of these three models: the photospheric luminosity , photospheric temperature , and supersoft X-ray light curve (0.3 - 1.0 keV) calculated from and , using a blackbody approximation. The photospheric temperature is shown only in the last cycle to avoid complication of lines. As the photospheric temperature is always high ( (K) ), most of photons are emitted in the far-UV and supersoft X-ray bands. As expected, they are all periodic supersoft X-ray sources.
4 Search for novae having a short X-ray duration with no-mass-ejection
4.1 Natural Novae
We searched shell-flash models for no-mass-ejection. Below the stability line, i.e., in the natural novae, we found no-mass-ejection models only in low mass WDs as shown in Figure 5. In more massive WDs (), shell flashes are stronger and mass ejection always occurs. The border of with/without mass ejection is about as in Figure 5. This is consistent with the study of occurrence condition of winds for metal-poor novae (Kato et al., 2013).
Far below the stability line, i.e., with lower mass-accretion rates, the shell flash becomes much stronger and we have to assume large mass-loss rates during the outburst.
The SSS duration is longer in lower mass WDs. In the and WD models, the massive limit of no-mass-ejection models has the SSS duration much longer than 200 days, being not consistent with the ASASSN-16oh observation (see Figure 6(c)). Thus, we conclude that there is no natural nova corresponding to ASASSN-16oh.
4.2 Forced Novae
Above the stability line, i.e., in forced novae, the recurrence period can be controlled by manipulating the re-starting time of accretion. If we delay the re-starting time the next outburst occurs later even if both the WD mass and mass-accretion rate are the same (Kato et al., 2014; Hachisu et al., 2016). The shell flash becomes stronger because the WD is cooled down during the delay.
As the recurrence period of forced novae can be controlled, we first search nova sequences for a short X-ray duration regardless of recurrence period. The outburst duration is shorter in more massive WDs. We found that a WD more massive than can have an X-ray duration shorter than 200 days. In WDs more massive than , however, we have to assume mass loss to continue numerical calculation. Thus, the WD is the upper mass limit in our calculation that fulfills a short X-ray duration ( days) and no-mass-ejection. In the next subsection we describe our WD model in detail.
4.3 Forced Nova Model
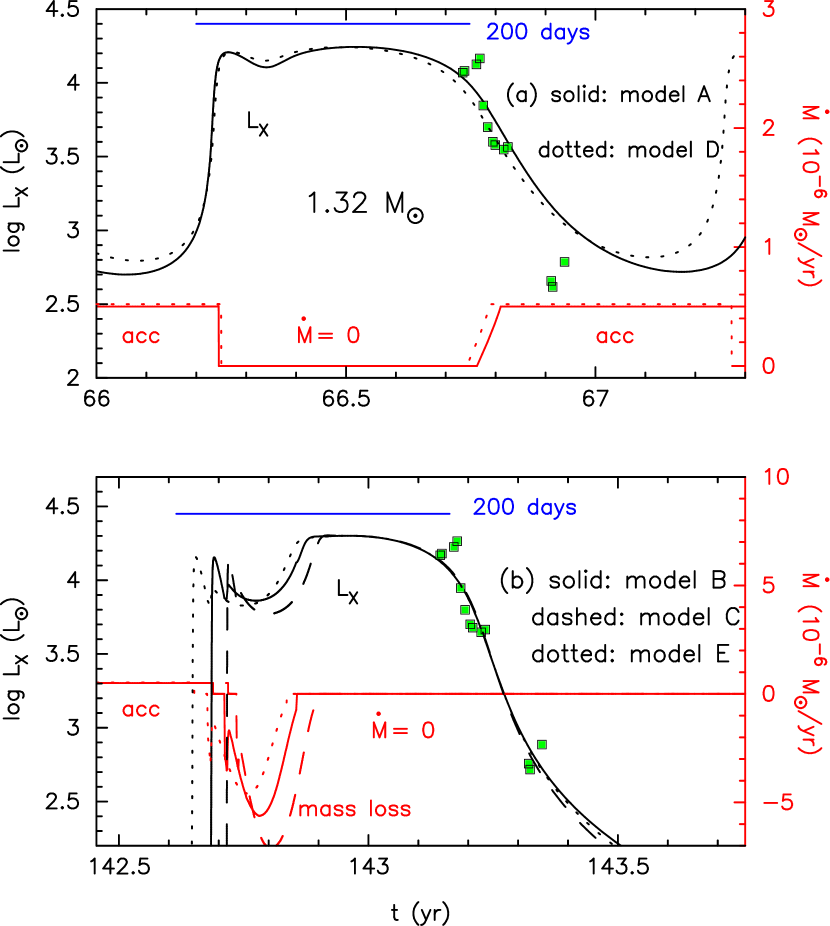
Table 1 summarizes shell flash properties of our five models. It lists the WD mass (), metallicity (), mass accretion rate (), restarting time () of accretion after previous shell flash occurs, i.e., time from the epoch when the maximum nuclear luminosity is attained, adopting numerical mass loss or not (yes or no), recurrence period (), maximum nuclear luminosity (), amount of accreted matter between two flashes (), mass retention efficiency, i.e., ratio of the mass of ash helium and accreted matter (), and mean mass increasing rate of the WD (a CO core with a He layer) (). The properties of Models A and D are almost the same because their mass accretion rates are not so different. Also Models B and E are similar. The maximum nuclear luminosity represents the flash strength. The flash is stronger for a smaller mass accretion rate, and a later re-starting time of accretion.
Figure 7(a) shows two models of no-mass-ejection, Models A (solid lines) and D (dotted lines). As the mass-accretion rates are almost the same, the light curves are very similar. The next outburst begins a bit later in the smaller mass-accretion model (Model A). The duration of the X-ray light curves are about 200 days in both models.
Figure 7(b) shows Models B, C and E, models with a later restarting time of mass-accretion. In these cases, the X-ray light curve decays faster than the models in panel (a). The recurrence period becomes longer to 4 years in Model B and E, and 7 years in Model C. In our calculation code, we cannot continue calculation in the expanded stage unless we adopt numerical mass-loss scheme, the rate of which is shown by the red line in the figure. As shown in Models B and C, we need to assume a larger mass-loss rate for a larger restarting time of mass-accretion. This does not directly mean that the mass-loss actually occurs because we did not adopt iteration process to include realistic wind solutions as we did in Kato et al. (2017a). Even if a real mass-loss occurs, the acceleration is very weak in such a low environment and the wind velocity would be as small as km s-1 (Kato, 1999), which is comparable with the FWHM of He II line in the optical spectra (Maccarone et al., 2019).
The wind durations of Models B, C, and E are 55–58 days as in Figure 7(b). The winds stopped 84–106 days before the optical detection of ASASSN-16oh. The wind velocity is as small as 100 km s-1 or smaller, much smaller than the escape velocity. Therefore, the escaping matter would soon fall back to the equatorial plane and stay as circumbinary matter or merge into the accretion disk. We suppose that the escaping matter (wind) from the WD may not contribute to the He II line at the detection of ASASSN-16oh.
Due to numerical difficulties, we did not calculate other models with similar parameters. We think that the 1.32 models are close to the one that is consistent with the observation of ASASSN-16oh.
We show the X-ray count rate of ASASSN-16oh to the decay phase of these theoretical light curves. In this fitting we regarded that the hydrogen shell flash started 200 days before the X-ray detection. The WD was always bright in the X-ray band during this 200 days, but unfortunately, we had no chance of detection until the very later phase. We further assume that a massive mass-inflow started shortly before the shell flash started. This mass-inflow may be associated with a dwarf nova outburst. The dwarf nova outburst developed from inside to out of the disk, which results in a slow rise of the light curves. The brightnesses could be brighter than normal dwarf nova outbursts because the disk is irradiated by the hot WD. irrespective of whether a dwarf nova triggered the nova outburst or a nova outburst triggered a dwarf nova outburst, this picture roughly explains observational properties of ASASSN-16oh discussed in Section 2.
We also calculated a similar model, but for a lower metallicity, i.e., , , and yr-1 with different restarting times of accretion. These model properties are listed in Table 1. Models F and G show no-mass-ejection, but Model H accompanies mass-loss. They have very similar X-ray light curves to those in Figure 7.
The models except Model C show shorter recurrence periods than 6 yr. This does not match the observation of ASASSN-16oh, because at least a 6 yr quiescent phase is obvious prior to the outburst from the OGLE IV data (Maccarone et al., 2019).
To summarize, searching for a model having a short X-ray duration ( 200 days), no-mass-ejection, and long recurrence period ( yr), we find that the 1.32 WD () model is the closest one to the ASASSN-16oh observation.
The mass retention efficiency is for no-mass-ejection models and for mass-ejection models. After one cycle of hydrogen shell flash, the ash helium accumulates on the CO core. This mass-increasing rate of CO core is listed in the last column of Table 1, which amounts as large as yr-1 for no-mass-ejection models.
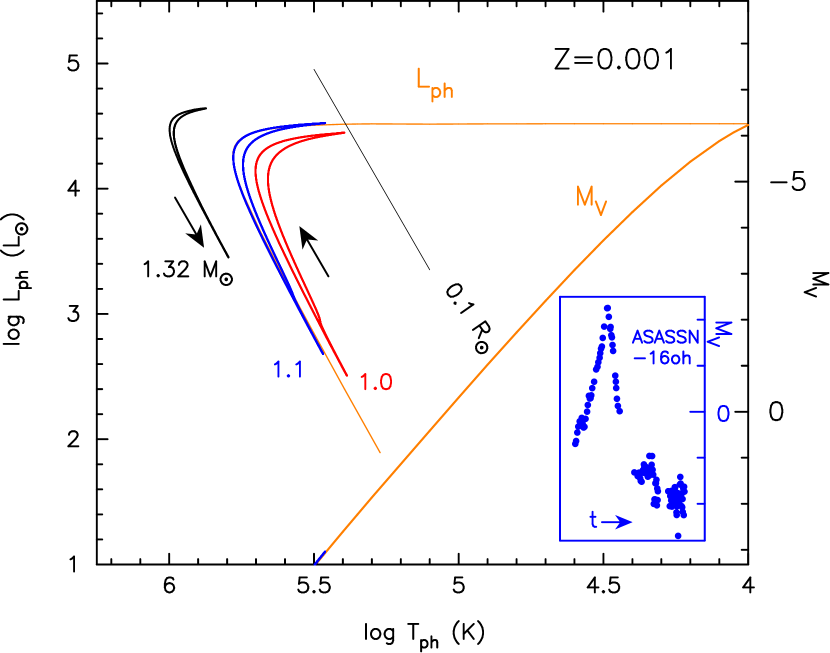
4.4 Shell Flashes in the HR Diagram
It is instructive to show how shell flashes behave in the HR diagram. Figure 8 shows shell-flash tracks in the HR diagram for the last cycle of our three models, 1.32 WD (black line), 1.1 WD (blue line), and 1.0 WD (red line). These models are already shown in Figures 7 (Model A), 6(b), and 6(a), respectively.
As the shell flash proceeds, the WD starts from the bottom of the curve and brightens up and turns to the right in the HR diagram. The maximum expansion of the WD photosphere depends on the ignition mass. In these models, the ignition masses are very small so their envelopes do not extend beyond (thin black line). This properties are already studied with hydrostatic approximation in Kato & Hachisu (2009) for .
The thin orange line labeled as shows a sequence of the hydro-static solutions that represents a theoretical nova outburst on a WD with a very large ignition mass of hydrogen envelope. Here we assume that the chemical composition of the envelope is , , and and the original WD radius underneath the hydrogen-rich envelope is taken from the model with the mass accretion rate of yr-1. It should be noted that the photospheric luminosity in the upper branch (horizontal part of the thin orange line) is almost the same as the Eddington luminosity.
The thick orange line labeled as denotes the absolute magnitudes correspond to the sequence of the thin orange line. Here we have calculated the absolute magnitude from and with the blackbody approximation. The contributions from the accretion disk and companion star are not included. This figure is similar to Figure 15 of Iben (1982). Even if the is constant, the is smaller (brighter) for a lower because of different bolometric correction. In our models, the photospheric temperature does not decrease much ( (K) ), so the brightness is rather faint. For example, our 1.1 WD model (blue line) reaches the maximum at as shown by the blue part on the lower orange line labeled .
The inset shows the absolute magnitudes of ASASSN-16oh. Its maximum brightness reaches , which is much brighter than the naked WD. It is obvious that there is another source in the brightnesses of ASASSN-16oh.
5 Comparison with Hillman et al.’s (2019) calculation
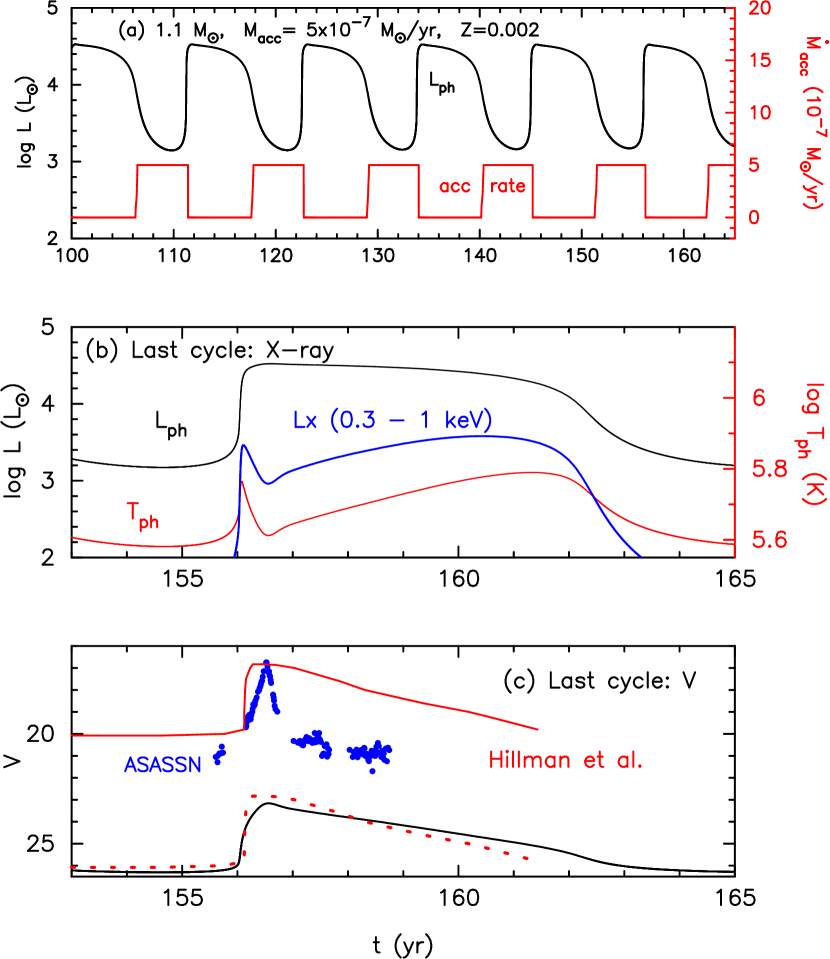
Hillman et al. (2019) presented a nova model with no mass-ejection for ASASSN-16oh. This model is based on the idea that both the photons and X-rays are emitted from the hot WD surface. Their best fit light curves are obtained for and yr-1.
In Section 4, however, we searched for possible nova models of ASASSN-16oh and obtained the WD mass to be , much more massive than Hillman et al.’s. As the mass accretion rate of yr-1 is above the stability line, we need some on/off-switch mechanism of mass accretion, otherwise we have steady-state burning (see Figure 1 of Hachisu et al., 2016). In other words, a forced nova does not occur in nature without some mechanism of on/off switch. In our model this on-switch is a mass accretion during a dwarf nova outburst. As shown below, Hillman et al.’s model is a forced nova with manipulated mass-accretion in their computer code, although no description about this on/off-switch is given.
We calculated a shell flash model with the same parameters as Hillman et al.’s, i.e., , yr-1, and , , and . As shown in Figure 9(a) we have successive hydrogen shell flashes only if we manipulated the mass-accretion as indicated by the red line. The photospheric luminosity , temperature , and supersoft X-ray luminosity in the last cycle of our calculation are shown in Figure 9(b). Figure 9(c) shows the light-curve of our model. The magnitudes are calculated from and with the band response function and converted to the magnitudes with the distance modulus of in band for ASASSN-16oh.
Figure 9(c) also shows the band light curve of ASASSN-16oh (blue dots) in comparison with our WD model. Our model light curve (black line) is much fainter, by 6 mag at the peak, than ASASSN-16oh. The solid red line indicates the light curve calculated by Hillman et al. (2019, taken from their Figure 2). The peak magnitude is comparable to that of ASASSN-16oh, but decays much slower. The light curve agrees well with our light curve if we assume as shown by the dotted red line. We suspect that Hillman et al. might wrongly adopt (rather than 19) for the distance modulus in band of ASASSN-16oh.
To summarize, we find that Hillman et al.’s light curve is fainter than ASASSN-16oh by 6 mag and decays 10 times slower.
6 Comparison with Maccarone et al.’s model
Our shell flash model and Maccarone et al.’s (2019) spreading layer model predict qualitatively similar observational properties. Both models predict supersoft X-rays of blackbody spectrum from optically thick matter on a massive WD. Both models are based on a dwarf nova outburst, in which the accretion disk and companion star is more or less irradiated by X-rays from the WD.
The main difference is in the emitting area and luminosity of X-ray radiation, corresponding to the different energy sources. In our shell flash model nuclear burning is the energy source and the whole WD surface is bright. In the spreading layer model, the gravitational energy is released in the inner edge of the accretion disk, and the X-ray emitting region is concentrated on the equatorial belt. These differences result in different observational properties which we discuss in the following subsections.
6.1 Total Flux and Binary Inclination of ASASSN-16oh
In the spreading layer model, the maximum luminosity is roughly estimated from gravitational energy release,
| (1) |
For a 1.3 WD with yr-1 and cm, we have erg s-1. On the other hand, our 1.32 WD model in Figure 7 emits erg s-1, 23 times larger than the spreading layer emission.
As introduced in Section 2, Maccarone et al. (2019) estimated X-ray luminosity from Chandra spectrum of ASASSN-16oh to be erg s-1. This value is consistent with the gravitational energy release from the spreading layer. Hillman et al. (2019) also obtained the unabsorbed X-ray flux to be erg s-1. They adopted a thermonuclear runaway model, which would emit an X-ray luminosity of about erg s-1, so they explained the observed small X-ray flux by occultation of the WD surface like in U Sco. We also assume the occultation of the WD surface by the inflated disk edge, that is, we can not directly observe the WD emission but detect scattered photons which are much fewer than the original WD emission. It could occur if the binary inclination is high enough like in U Sco.
Maccarone et al. (2019) estimated the inclination angle of the binary from the span of the velocity variation in the He II line (75 km s-1). They assumed that the He II line comes from the central part of the accretion disk. For a binary consisting of a WD and 0.7 companion, they obtained the binary inclination from Keplerian law to be for a orbital period of day, and for days. This value should be replaced by and , respectively, because the authors misplaced the masses of the WD and donor in their calculation.
The above argument on the inclination angle of the binary should be modified if the He II emission line is associated to the hot spot or irradiated companion. If the emitting region is close to the center of mass of the binary, the small line velocities are obtained even in a high inclination binary. Also the line velocity span may not always represent the radial velocity amplitude because of the sparse observation.
The accretion disk around a very hot WD may not be geometrically thin but could be inflated. The disk surface absorbs a part of the supersoft X-ray flux from the WD to become hot and emit higher energy photons. This irradiation and reprocess make the accretion disk inflated and brighter. Popham & Di Stefano (1996) assumed the inflation in the UV-optical spectrum model for CAL 83 and RX J0513.9-6951. Schandl et al. (1997) adopted an inflated disk shape of the angle up to in the light curve model of the LMC supersoft X-ray source CAL 87. Hachisu et al. (2000) adopted at the edge of the disk in their light curve model of U Sco 1999 outburst. Here, is the height of the disk surface from the equatorial plane and is the distance from the central WD.
The inclination angle of the binary could be one of the key parameters to distinguish the two models. If ASASSN-16oh is an eclipsing binary, it strongly support the shell flash model rather than the spreading layer model. If the binary is face on, the faint X-ray flux of ASASSN-16oh is consistent with the spreading layer model, while the shell flash model needs some explanation for the faint X-ray flux. The present status indicates that the observational clues are not sufficient to draw the definite conclusion.
6.2 UV/optical SED
Figure 4 shows the spectral energy distribution (SED) of ASASSN-16oh (Maccarone et al., 2019). This spectrum resembles those of RX J0513.9-6951 taken by Pakull et al. (1993) in the optical high state. RX J0513.9-6951 is a binary consisting of a massive WD that undergoes steady hydrogen burning, irradiated accretion disk, and irradiated companion. Hachisu & Kato (2003a) made light curve models (solid magenta line in Figure 3(b)) in which the irradiated disk mainly contributes to the optical brightness. The resemblance with RX J0513.9-6951 indicates the presence of bright irradiated accretion disk and companion in ASASSN-16oh.
Popham & Di Stefano (1996) calculated a composite spectrum for LMC persistent supersoft X-ray sources (thick solid black line in Figure 4). Their model binary consists of a hydrogen burning WD of , irradiated accretion disk with a radius of , and Roche-lobe-filling main-sequence companion. The orbital period is day. The inflated accretion disk ( at its outer edge) is irradiated and brightened by 19 times at Å, and 4 times at Å. As a results, the total flux, the summation of these three components, reproduces the law. The WD does not contribute much in the UV/optical region, but the hydrogen burning WD is necessarily because its large luminosity is the source of irradiation.
The composite spectrum by Popham and Di Stefano is fainter by than that of observed ASASSN-16oh data. They assumed the WD luminosity of erg sec-1, which is comparable to our H-burning WD model (erg sec-1). If we assume that ASASSN-16oh is a binary of a WD and a companion with days, the binary separation is times larger than Popham and Di Stefano’s model. If we scale up the binary size by a factor of 2.5, without changing the configuration, the irradiated area of the disk and companion become times larger. This makes the flux increase by . If we adopt the binary inclination of , instead of Popham and Di Stefano’s , then, the flux decrease owing to inclination is calculated to be . Then, the flux calculated by Popham and Di Stefano should be increased by for our assumed binary. The resultant spectral energy distribution is very consistent with that of ASASSN-16oh obtained by Maccarone et al. (2019).
In the spreading layer model, the irradiation effects is small because the X-ray luminosity is small. The main contributer in the UV/optical range is the dwarf nova outburst. In general, the absolute flux of a dwarf nova is smaller than those shown in Figure 4 and the wavelength dependence was reported to be , in the UV/optical range (e.g., Parikh et al., 2019).
6.3 X-ray light curve
In our shell flash model the X-ray flux begins to decrease when hydrogen burning almost dies out and the burning zone temperature gradually decreases. The speed of cooling depends on the WD mass; a more massive WD cools faster.
Figure 3(a) compares the light curves of ASASSN-16oh with those of U Sco in a normalized time scale. U Sco hosts a massive WD, (Hachisu et al., 2000), more massive than our for ASASSN-16oh, and then the cooling time is much shorter.
When the X-ray flux decreases with time, the irradiation effects decrease so that the UV/optical fluxes from the irradiated disk and companion also become faint. Thus, both the X-ray and optical fluxes decrease at the same time. In this way, our shell flash model naturally explains the simultaneous behavior in the X-ray and optical fluxes along with those of U Sco as in Figure 3(a).
In the spreading layer model, the optical flux decreases when the dwarf nova outburst approaches its end. As the X-ray flux is closely related to the mass-accretion rate onto the WD, the expected X-ray count rate decreases with decrease in the optical flux (e.g. Osaki, 1996). It is, however, unknown whether a dwarf nova outburst could show the simultaneous decrease, like in U Sco, in both the X-ray and optical fluxes in the normalized timescale in Figure 3(a).
6.4 Non-detection of supersoft X-rays in the quiescent phase of RS Oph
RS Oph is a recurrent nova that hosts a massive WD with high mass-accretion rate ( and yr-1: Hachisu et al. (2006); Hachisu & Kato (2001)). The WD mass and mass accretion rate are more or less similar to ASASSN-16oh. If the X-ray emission of ASASSN-16oh is emitted from the optically thick spreading layer, we may expect supersoft X-rays in the quiescent phase of RS Oph.
Nelson et al. (2011) observed quiescent phase of RS Oph with the Chandra and XMM-Newton satellites, 537 days and 744 days after the nova outburst. They analyzed the spectrum and obtained the maximum allowable blackbody temperature for an optically thick component of the spreading layer to be 0.034 keV (=3.9 K). The upper limit of unabsorbed luminosity is erg s-1, where is the distance to the star. This upper limit is smaller than those detected in ASASSN-16oh by a factor of 40.
The boundary layer between a WD and the inner edge of the accretion disk has been studied by various authors. (Popham & Narayan, 1995; Piro & Bildsten, 2004, and references therein). If the mass accretion rate is large, the boundary layer is geometrically thin, optically thick, and emits supersoft X-rays. When the accretion rate decreases, the boundary layer becomes optically thin, geometrically thick, and emits hard X-rays.
Popham & Narayan (1995) calculated the mass accretion rate at this transition. For a WD, the critical mass-accretion rate is yr. This value depends on the model parameters, e.g., such as the WD rotation rate, viscosity parameter. They did not calculate for , but from the tendency of quick increase with the WD mass, the transition may occur at yr for . Below this rate, the boundary layer is optically thin and would emit hard X-rays. A small accretion rate may be the reason why the supersoft X-ray component was not detected in the quiescent phase of RS Oph.
If the same argument is applied to ASASSN-16oh with an accretion
rate of yr-1,
the boundary layer should be optically thin and
hard X-ray component had to be expected during the
outburst. However, there are no hard X-ray component
in the spectrum (Maccarone et al., 2019).
The possible reasons for the absence of hard X-rays are:
(1) A hot optically thin extended boundary layer was formed
and emitted hard X-rays. However, the X-rays were occulted
by the inflated disk edge and undetected,
or its flux was too small to be detected.
(2) The mass accretion had already stopped before the period
of observation.
6.5 Summary
The resemblance of the color (Figure 2) and absolute magnitude (Figure 3) indicates that ASASSN-16oh is a binary system consisting of an hydrogen burning WD, irradiated accretion disk, and lobe-filling companion star. The spectral energy distribution (Figure 4) can be explained by the sum of contributions from an accretion disk and a companion star which are irradiated by a WD in the luminous stage of a shell flash. Our shell flash model is consistent with these three properties. We further show that the simultaneous declines in the X-ray and optical are also explained by our hydrogen burning model (Sections 6.3) and that our hydrogen burning model is consistent with undetected hard X-ray flux even for the optically thin boundary layer case (Section 6.4).
ASASSN-16oh is an atypical dwarf nova in its slow rise/decay and large amplitude. It is very helpful to see if similar shape dwarf novae show similar color and brightness to ASASSN-16oh.
| Model | Mass loss | ||||||||||
|---|---|---|---|---|---|---|---|---|---|---|---|
| () | ( yr-1) | (yr) | (yr) | () | () | ( yr-1) | |||||
| A | … | 1.32 | 0.001 | 5.0 | 0.55 | no | 1.1 | 1.2 | 2.9 | 1.0 | 2.6 |
| B | … | 1.32 | 0.001 | 5.0 | 2.6 | yes | 4.2 | 10 | 8.6 | 0.34 | 0.64 |
| C | … | 1.32 | 0.001 | 5.0 | 5.3 | yes | 7.3 | 13 | 9.5 | 0.26 | 0.35 |
| D | … | 1.32 | 0.001 | 5.2 | 0.53 | no | 1.0 | 1.0 | 2.7 | 1.0 | 2.6 |
| E | … | 1.32 | 0.001 | 5.2 | 2.8 | yes | 4.2 | 9.5 | 7.5 | 0.41 | 0.72 |
| F | … | 1.35 | 0.0001 | 5.0 | 0.58 | no | 1.1 | 0.85 | 2.7 | 1.0 | 2.4 |
| G | … | 1.35 | 0.0001 | 5.0 | 0.80 | no | 1.4 | 1.2 | 3.3 | 1.0 | 2.3 |
| H | … | 1.35 | 0.0001 | 5.0 | 1.5 | yes | 2.5 | 2.7 | 5.0 | 0.75 | 1.5 |
7 Discussion
7.1 A Dwarf Nova Triggers a Nova Outburst?
We examine the possibility if a dwarf nova outburst can trigger a nova outburst.
An accreting WD will experience a nova outburst when the mass of hydrogen-rich envelope reaches a critical value. Table 1 list the amount of accreted matter to trigger hydrogen ignition. They are a few to several times . This ignition mass is smaller for a shorter recurrence period because the WD surface is hotter.
On the other hand, the mass inflow rate onto the WD is estimated in several dwarf novae (Kimura et al., 2018). Among them, V364 Lib shows a relatively large mass inflow rate of yr-1 (Kimura et al., 2018). This object has an orbital period of days, rising (decay) time of 10 (35) days, and small outburst amplitude of 1 mag. As ASASSN-16oh has a much larger outburst amplitude and longer orbital period, we may expect a larger mass inflow rate. If we assume the mass inflow rate of several times yr-1, the WD may accrete sufficient mass for hydrogen ignition. Our calculation assumed a periodic change of mass accretion, but in the real world, the mass inflow may occur irregularly. If WDs accrete sufficient mass through one or several times of mass-accretion events with a large mass-inflow rate, a weak shell flash may occur similarly to ASASSN-16oh.
7.2 Forced Novae
Nova outbursts with high mass-accretion rates have been calculated by many authors (Prialnik & Kovetz, 1995; Yaron et al., 2005; Idan et al., 2013; Hillman et al., 2015, 2019). Forced nova phenomena are studied in detail by Kato et al. (2014) and by Hachisu et al. (2016) in which they pointed out that forced novae are already calculated without recognizing it because they automatically switched on/off the mass accretion in their numerical codes. In the cases with very high mass-accretion rates, characteristic properties are similar to those in Figure 6, i.e., no-mass-ejection and a short quiescent phase comparable to the shell flash duration.
The forced novae are still theoretical objects because no mechanism of switching-on/off is identified. If the ASASSN-16oh outburst is a shell-flash phenomenon triggered by a dwarf nova, this is the first observational support for a forced nova.
In the forced novae, the mass accretion rate is very high by its definition, so the shell flash could be weak. Thus, the mass retention efficiency of the WD is very high. Especially with no-mass-ejection, the mass retention efficiency of the WD is . Such an object is a candidate of Type Ia supernova progenitors. In this sense, ASASSN-16oh is a promising object.
7.3 Novae in a Very Low Metallicity of
Nova outbursts in various metallicities were systematically studied by Kato (1997, 1999) and by Kato et al. (2013). The optically thick winds, the main mechanism of mass loss during the nova outbursts, are accelerated owing to the prominent iron peak in the radiative opacity at (K) . For a lower metallicity, this Fe peak is small and almost disappears in . In such a case, another peak due to He ionization ( (K) , see Figure 4 of Kato et al., 2013, for opacities) works as the driving source.
Kato et al. (2013) showed that the Fe opacity peak works to drive the winds for a wide range of the WD masses () for . For , it works only in massive WDs () and the main driving source is replaced by the He opacity peak in less massive WDs. For , only the He opacity peak works because the Fe peak disappears. The acceleration by the He opacity peak may be weak because its peak is small. Thus, we expect weak mass-ejection or slow expansion. Observational counter-parts of such phenomena are not identified yet, and then, it is not known if such a weak wind results in a nova outburst with efficient mass ejection from the binary.
Figure 10 shows the stability line and recurrence periods for the composition of and . In the same figure, we added the results by Chen et al. (2019). The small red crosses denote flashes with no-mass-ejection and the small open red circles are for those with mass-loss. Their results are consistent with ours.
This plot also shows their stability line (lower dotted line) and their expansion line above which the WD envelope increases (upper dotted line). These two lines are consistent with our and lines.
7.4 Metallicity Dependence of Stability Line
The stability line has ever been calculated by many authors (Nomoto et al., 2007; Kato et al., 2014; Wolf et al., 2013a, b; Ma et al., 2013, for ), (and Chen et al., 2019, for ). Our stability lines are lower than that of and (Kato et al., 2014) by a factor of 0.8 - 0.9 (vertically lower by dex) for and in Figure 5, and by a factor of 0.6 - 0.8 (vertically lower by dex) for and in Figure 10.
The stability line shows the minimum mass-accretion rate below which the hydrostatic envelope cannot keep the temperature high enough to support steady nuclear burning (point B in Figure 1 of Kato et al., 2014). For the same WD mass and accretion rate, the envelope mass is larger for a lower because of difference in the opacity. Thus, the temperature at the bottom of the envelope is also high. This makes the difference in the stability line.
7.5 Metallicity Dependence of Recurrence Period
Figure 5 also shows the equi-recurrence period line. The recurrence period is shorter for massive WDs and higher mass accretion rates.
The equi-recurrence period lines were obtained for the solar composition ( and ) by Kato et al. (2014) and by Hachisu et al. (2016). Our equi-recurrence period lines are systematically longer than their equi-period lines by a factor of (shifted by 0.15 dex upward) in Figure 5 (for and ) and by a factor of (shifted by 0.25 dex upward) in Figure 10 (for and ).
For a lower , the ignition mass is larger because the lower opacity results in a lower blanket effect and it takes more time until a hydrogen ignition occurs at the bottom of the accreted matter. Thus, for the same WD mass and mass accretion rate, it takes a longer accretion time until the flash begins.
8 Conclusions
Our main results are summarized as follows.
-
1.
We summarize observational properties of ASASSN-16oh from the view point of an irradiated accretion disk model. The X-ray count rates are consistent with the scattered flux from the obscured WD in the SSS phase of the recurrent nova U Sco. The color, peak , and law are quite consistent with large irradiated accretion disks of U Sco and RX J0513.96951. Thus, we may conclude that the supersoft X-ray fluxes originate from the hydrogen burning WD while the and band fluxes come from the irradiated accretion disk.
-
2.
Supposing that a dwarf nova triggers a forced nova, we are able to obtain the X-ray light curve consistent with ASASSN-16oh, i.e., a short X-ray duration ( days) and no mass-ejection. We found a WD model is the closest one for the low metallicity environment of . If it is the case that ASASSN-16oh is a dwarf-nova and it triggers a nova, this is the first identified forced nova that occurs above the stability line.
-
3.
We have calculated a shell flash model with the same parameters as those in Hillman et al. (2019) and confirmed that their models are forced novae in which they manipulated on/off-switch of the mass-accretion in their computer code. We have found that their light curve to fit with ASASSN-16oh are based on a too small distance modulus for the SMC. If we corrected, the peak and decay timescale are very different from those of ASASSN-16oh.
-
4.
The galactic nova PU Vul was first observationally identified as a no-mass-ejection nova, but it occurred on a low mass WD (). If ASASSN-16oh is a thermonuclear runaway object like PU Vul, it is the second identified no-mass-ejection nova. No-mass-ejection novae hosting a very massive WD are a new type of SSSs in low environments. They could be a candidate of Type Ia supernova progenitors because the mass retention efficiency is very high ().
References
- Bohlin et al. (1978) Bohlin, R. C., Savage, B. D., & Drake, J. F. 1978, ApJ, 224, 132
- Chen et al. (2019) Chen, H., Woods, T. E., Yungelson, L. R., et al. 2019, MNRAS, 490, 1678
- Cioni (2009) Cioni, M.-R. L. 2009, A&A, 506, 1137
- Darnley et al. (2015) Darnley, M. J., Henze, M., Steele, I. A., et al. 2015, A&A, 580, A45
- Evans et al. (2009) Evans, P. A., Beardmore, A. P., Page, K. L., et al. 2009, MNRAS, 397, 1177
- Güver & Özel (2009) Güver, T., & Özel, F. 2009, MNRAS, 400, 2050
- Hachisu & Kato (2001) Hachisu, I., & Kato, M. 2001, ApJ, 558, 323
- Hachisu & Kato (2003a) Hachisu, I., & Kato, M. 2003a, ApJ, 590, 445
- Hachisu & Kato (2006) Hachisu, I., & Kato, M. 2006, ApJS, 167, 59
- Hachisu & Kato (2015) Hachisu, I., & Kato, M. 2015, ApJ, 798, 76
- Hachisu & Kato (2018b) Hachisu, I., & Kato, M. 2018b, ApJS, 237, 4
- Hachisu & Kato (2019a) Hachisu, I., & Kato, M. 2019a, ApJS, 241, 4
- Hachisu & Kato (2019b) Hachisu, I., & Kato, M. 2019b, ApJS, 242, 18
- Hachisu et al. (2000) Hachisu, I., Kato, M., Kato, T., & Matsumoto, K. 2000, ApJ, 528, L97
- Hachisu et al. (2006) Hachisu, I., Kato, M., Kiyota, S., et al. 2006, ApJ, 651, L141
- Hachisu et al. (2008) Hachisu, I., Kato, M., & Luna, G. J. M. 2008, ApJ, 659, L153
- Hachisu et al. (2016) Hachisu, I., Saio, H., & Kato, M. 2016 ApJ, 824, 22 2015b, A&A, 582, L8
- Henze et al. (2018) Henze, M., Darnley, M. J., Williams, S. C., et al. 2018, ApJ, 857, 68
- Hillman et al. (2015) Hillman, Y., Prialnik, D., Kovetz, A., & Shara, M. M. 2015, MNRAS, 446, 1924
- Hillman et al. (2019) Hillman, Y., Orio, M., Prialnik, D., et al. 2019, ApJ, 879, L5
- Iben (1982) Iben, I., Jr. 1982, ApJ, 259, 244
- Idan et al. (2013) Idan, I., Shaviv, N. J., & Shaviv, G. 2013, MNRAS, 433, 2884
- Iglesias & Rogers (1996) Iglesias, C. A., & Rogers, F. J. 1996, ApJ, 464, 943
- Imara & Blitz (2007) Imara, N., & Blitz, L. 2007, ApJ, 662, 969
- Jha et al. (2016) Jha, S. W., Colmenero, E. R., Stanek, K. Z., et al. 2016, The Astronomer’s Telegram, 9859, 1
- Kato (1985) Kato, M. 1985, PASJ, 37, 19
- Kato (1997) Kato, M. 1997, ApJS, 113, 121
- Kato (1999) Kato, M. 1999, PASJ, 51, 525
- Kato & Hachisu (1994) Kato, M., & Hachisu, I., 1994, ApJ, 437, 802
- Kato & Hachisu (2009) Kato, M., & Hachisu, I., 2009, ApJ, 699, 1293
- Kato et al. (2011) Kato, M., Hachisu, I., Cassatella, A., & González-Riestra, R. 2011, ApJ, 727, 72
- Kato et al. (2013) Kato, M., Hachisu, I., & Henze, M. 2013, ApJ, 779, 19
- Kato et al. (2012) Kato, M., Mikołajewska, J., & Hachisu, I., 2012, ApJ, 750, 5
- Kato et al. (2014) Kato, M., Saio, H., Hachisu, I., & Nomoto, K. 2014, ApJ, 793, 136
- Kato et al. (2017a) Kato, M., Saio, H., & Hachisu, I. 2017a, ApJ, 838, 153
- Kato et al. (2017c) Kato, M., Hachisu, I., & Saio, H. 2017c, in Proceedings of the Palermo Workshop 2017 on “The Golden Age of Cataclysmic Variables and Related Objects - IV”, ed. F. Giovannelli et al. (Trieste: SISSA PoS), 315, 56
- Kimura et al. (2018) Kimura, M., Kato, T., Maehara, H., et al. 2018, PASJ, 709. 78
- Liszt (2014) Liszt, H. S. 2014, ApJ, 780, 10
- Ma et al. (2013) Ma, X., Chen, X., Chen, H-L., Denissenkov, P. A., & Han, Z. 2013, ApJ, 778, L32
- Maccarone et al. (2019) Maccarone, T. J., Nelson, T. J., Brown, P. J., et al. 2019, Nature Astronomy, 3, 173 (arXiv:1907.02130) ApJ, 373, L51
- Mroz et al. (2016) Mroz, P., Udalski, A., Wyrzykowski, L., Kozlowski, S., & Poleski, R. 2016, The Astronomer’s Telegram, 9867, 1
- Nelson et al. (2011) Nelson, T., Mukai, K., Orio, M., Luna, G.J.M., Sokoloski, J., L. 2011, ApJ, 737,7
- Nomoto et al. (2007) Nomoto, K., Saio, H., Kato, M., & Hachisu, I. 2007, ApJ, 663, 1269
- Orio et al. (2013) Orio, M., Behar, E., Gallagher, J., et al. 2013, MNRAS, 429, 1342
- Osaki (1996) Osaki, Y. 1996, PASP, 108, 39
- Pagnotta et al. (2015) Pagnotta, A., Schaefer, B. E., Clem, J. L., et al. 2015, ApJ, 811, 32
- Pakull et al. (1993) Pakull, M. W., Moch, C., Bianchi, L., et al. 1993, A&A, 278, L39
- Parikh et al. (2019) Parikh, A. S., Hernández Santisteban, J. V., Wijnands, R., Page, D. 2019, Revista Mexicana de Astronomia y Astrofisca, 55, 55
- Pietrzyński et al. (2013) Pietrzyński, G., Graczyk, D., Gieren, W., et al. 2011, Nature, 495, 76
- Piro & Bildsten (2004) Piro, A.L., & Bildsten, L. 2004, ApJ, 610,979
- Popham & Di Stefano (1996) Popham, R., & Di Stefano, R. 1996, Lecture Notes in Physics, 472, p.66 ed. Greiner, J. (Springer:Berlin)
- Popham & Narayan (1995) Popham, R., & Narayan, R. 1995, ApJ, 442, 337
- Prialnik & Kovetz (1995) Prialnik, D., & Kovetz, A. 1995, ApJ, 445, 789
- Raj et al. (2012) Raj, A., Ashok, N. M., Banerjee, D. P. K., et al. 2012, MNRAS, 425, 2576
- Rieke & Lebofsky (1985) Rieke, G. H., & Lebofsky, M. J. 1985, ApJ, 288, 618
- Salazar et al. (2017) Salazar, I. V., LeBleu, A., Schaefer, B. E., Landolt, A. U., & Dvorak, S. 2017, MNRAS, 469, 4116
- Schaefer (2018) Schaefer, B. E. 2018, MNRAS, 481, 3033
- Schaefer & Ringwald (1995) Schaefer, B. E., & Ringwald, F. A. 1995, ApJ, 447, L45
- Schandl et al. (1997) Schandl, S., Meyer-Hofmeister, E., & Meyer, F. 1997, A&A, 318, 73
- Schwarz et al. (2011) Schwarz, G. J., Ness, J.-U., Osborne, J. P., et al. 2011, ApJS, 197, 31
- Udalski et al. (2015) Udalski, A., Szymański, M.K., Szymański, G., Acta Astronomica, 65,1
- Walter et al. (2012) Walter, F. M., Battisti, A., Towers, S. E., Bond, H. E., & Stringfellow, G. S. 2012, PASP, 124, 1057
- Wolf et al. (2013a) Wolf, W. M., Bildsten, L., Brooks, J., & Paxton, B. 2013a, ApJ, 777, 136
- Wolf et al. (2013b) Wolf, W. M., Bildsten, L., Brooks, J., & Paxton, B. 2013b, ApJ, 782, 117 (Erratum)
- Yaron et al. (2005) Yaron, O., Prialnik, D., Shara, M.M., & Kovetz, A. 2005, ApJ, 623, 398
- Warner (1995) Warner, B. 1995, Cataclysmic variable stars, Cambridge, Cambridge University Press