MBE preparation and in situ characterization of FeTe thin films
Abstract
We have synthesized Fe1+yTe thin films by means of molecular beam epitaxy (MBE) under Te-limited growth conditions. We found that epitaxial layer-by-layer growth is possible for a wide range of excess Fe values, wider than expected from what is known from studies on the bulk material. Using x-ray magnetic circular dichroism spectroscopy at the Fe and Te edges, we observed that films with high excess Fe contain ferromagnetic clusters while films with lower excess Fe remain nonmagnetic. Moreover, x-ray absorption spectroscopy showed that it is possible to obtain films with very similar electronic structure as that of a high quality bulk single crystal Fe1.14Te. Our results suggest that MBE with Te-limited growth may provide an opportunity to synthesize FeTe films with smaller amounts of excess Fe as to come closer to a possible superconducting phase.
I Introduction
Within the family of Fe-based superconductors Kamihara et al. (2008); Zhao et al. (2008); Hsu et al. (2008), FeSe has been one of the most studied materials due to its simple binary crystal structure Hsu et al. (2008). Its sister compound FeTe has received considerable attention as well, but surprisingly the latter is not superconducting. Instead, FeTe is an insulator that orders antiferromagnetically at low temperatures Bao et al. (2009); Li et al. (2009). Also astonishing is the contrasting behavior upon application of external pressure: while FeSe enhances its superconducting temperature Mizuguchi et al. (2008); Margadonna et al. (2009); Medvedev et al. (2009), FeTe becomes ferromagnetic when it turns into a metal at high pressures Ciechan et al. (2014); Mydeen et al. (2017). Adding to the complexity, bulk FeTe only forms in the presence of excess Fe, i.e. Fe1+yTe with Rodriguez et al. (2011); Rößler et al. (2011); Koz et al. (2013), which is quite different from FeSe, which is known to exhibit a negligible homogeneity range only.
FeTe in thin film form has also been studied. Many of the investigations were carried out with the focus on how one can induce superconductivity using thin films Han et al. (2010). It came as a surprise that a partial oxidation of the Fe1+yTe thin films by exposure to oxygen can indeed induce superconductivity Nie et al. (2010); Si et al. (2010); Telesca et al. (2012); Zheng (2013). This has to be contrasted with the observation that the superconductivity in FeSe thin films is destroyed by oxygen exposure Telesca et al. (2012). For bulk FeTe samples the situation is more complicated. It seems that superconductivity can be induced by reaction with oxygen or other chemicals only if there is also some minimum amount of S or Se in the system Dong et al. (2011); Hu et al. (2012); Kawasaki et al. (2012). The reasons behind the mechanism of superconductivity upon oxygen exposure are still not well understood, although there are some indications that the variation of interstitial Fe might play a crucial role Hu et al. (2012).
Pulsed laser deposition (PLD) Han et al. (2010); Nie et al. (2010); Si et al. (2010); Telesca et al. (2012) and molecular beam epitaxy (MBE) Zheng (2013); Hu et al. (2014); Li et al. (2016) have been applied to synthesize the films. In these earlier PLD studies, nominally stoichiometric targets or targets with some excess Te have been used. In the MBE investigations, the synthesis of the films was effectively carried out under the so-called Fe-limited growth conditions, in which the Te is deposited in excess and, at the same time, most of this excess is re-evaporated by using sufficiently high substrate temperatures.
In this study we explored a different route for the preparation of FeTe thin films. We applied the Te-limited growth in our MBE process. Our objective is to investigate the stability range of the excess Fe for the formation of FeTe films. By determining the electronic and magnetic properties of the Fe1+yTe films we aim to gain better insight into the growth properties of the films and to estimate whether films can be made with very small amounts of excess Fe, as to come closer to a possible superconducting phase. The structural, electronic and magnetic characterization measurements were carried out in situ in order to ensure reliable data.

II Experiment
The FeTe films were grown by MBE on epi-polished MgO (001) substrates purchased from CrysTec GmbH. Prior to the deposition, the substrates were annealed at 600 ∘C for 2 hours in an oxygen atmosphere of 310-7 mbar. The substrate temperature was kept at 250 ∘C during growth.
For all the reported films, the growth time was fixed at 30 minutes. Fe and Te were evaporated from effusion cells. The flux rates of the Fe and Te were measured by a quartz crystal monitor at the growth position. The Fe flux rate was set at 1 Å/min (TFe 1220 ∘C effusion cell temperature) for all films, while the Te flux rate (named throughout the report) was varied between 1 to 7 Å/min (TTe 245-265 ∘C effusion cell temperature). The base pressure of the MBE system was 510-10 mbar.
In situ and real-time monitoring of the epitaxial growth was performed by reflection high-energy electron diffraction (RHEED) measurements using a STAIB Instruments RH35 system. The kinetic energy of the electrons was set at 20 keV. X-ray absorption spectroscopy (XAS) and x-ray magnetic circular dichroism (XMCD) measurements at the Fe and Te edges were carried out in situ at the 11A Dragon beam line of the Taiwan Light Source at the NSRRC in Taiwan. The spectra were recorded at room temperature in the total electron yield mode with a photon-energy resolution of 0.25 eV. An Fe2O3 and a Cr2O3 crystal were measured simultaneously in a separate chamber to obtain relative energy referencing with an accuracy better than a few meV for the Fe ( eV) and Te ( eV) spectra. The Fe white line of Fe2O3 is set at 706.2 eV and the first peak of the Cr of Cr2O3 at 574.7 eV. A magnetic field of about 0.28 T was applied. The pressure of the XAS/XMCD chamber was 210-10 mbar during the measurements. In order to compare the electronic properties of the films, we used a bulk sample with composition Fe1.14Te, synthesized by chemical vapor transport as described in Rößler et al. (2016). The XAS measurements on this sample were performed at the TPS 45A beam line of the Taiwan Photon Source at the NSRRC in Taiwan.
Ex situ x-ray diffraction (XRD) measurements were used to further characterize the structural quality of the films. The measurements were performed with a PANalytical X’Pert PRO diffractometer using monochromatic Cu- radiation ( = 1.54056 Å).
III Results
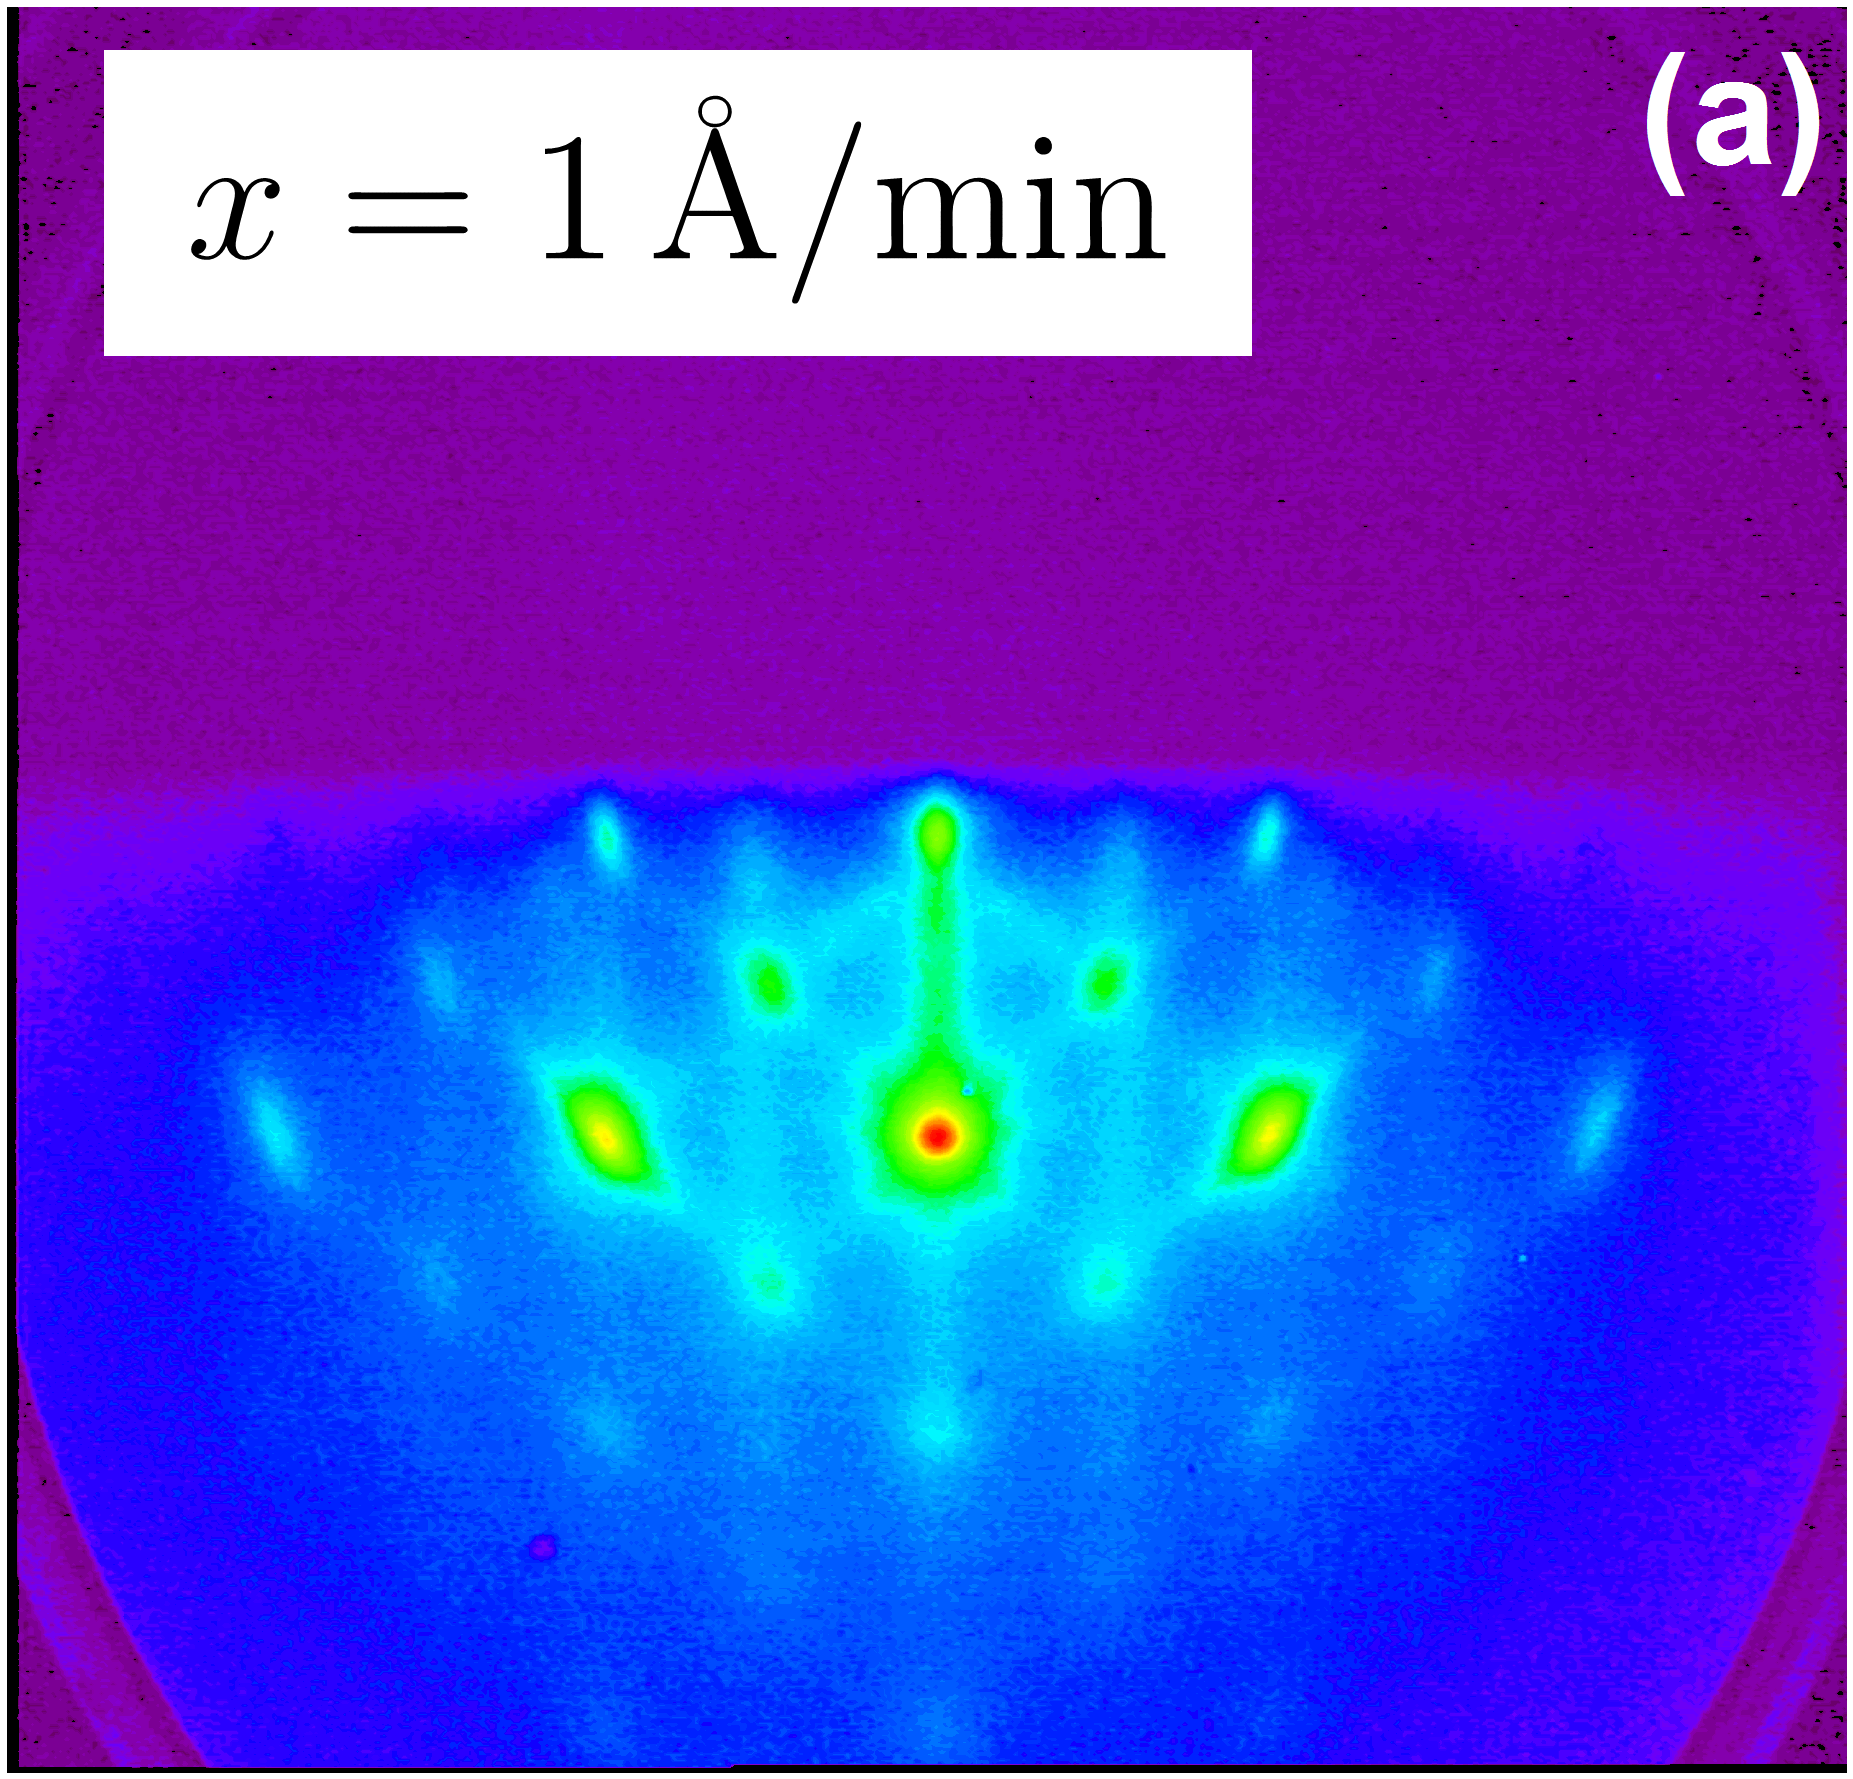
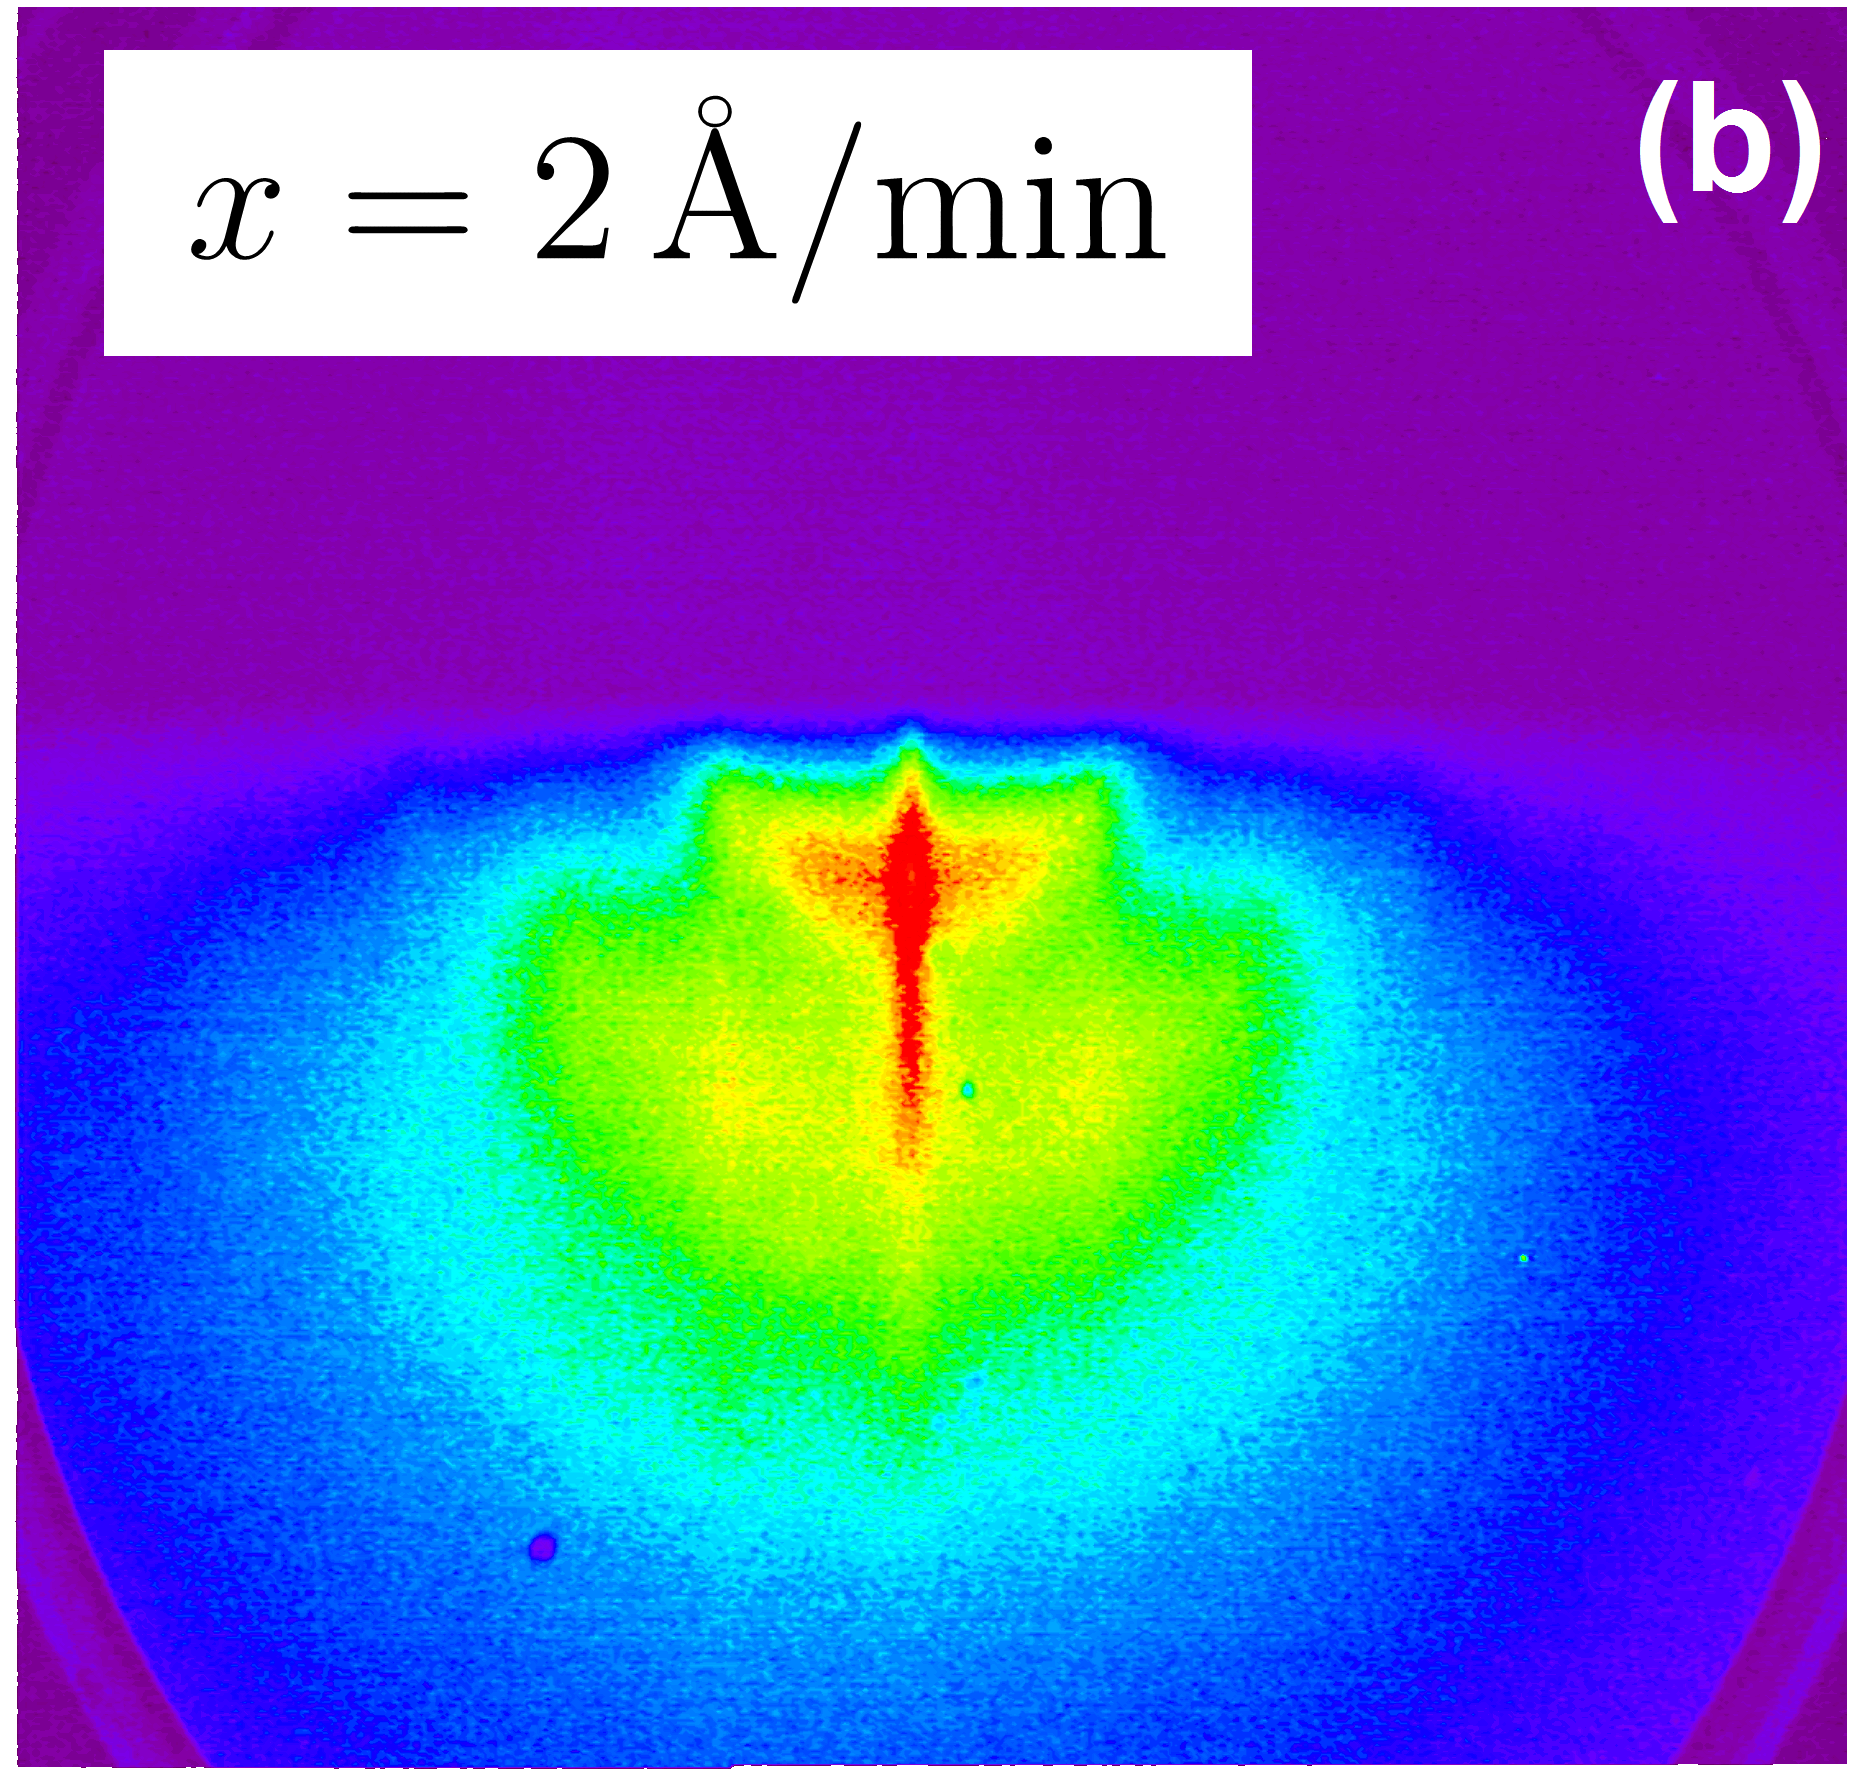
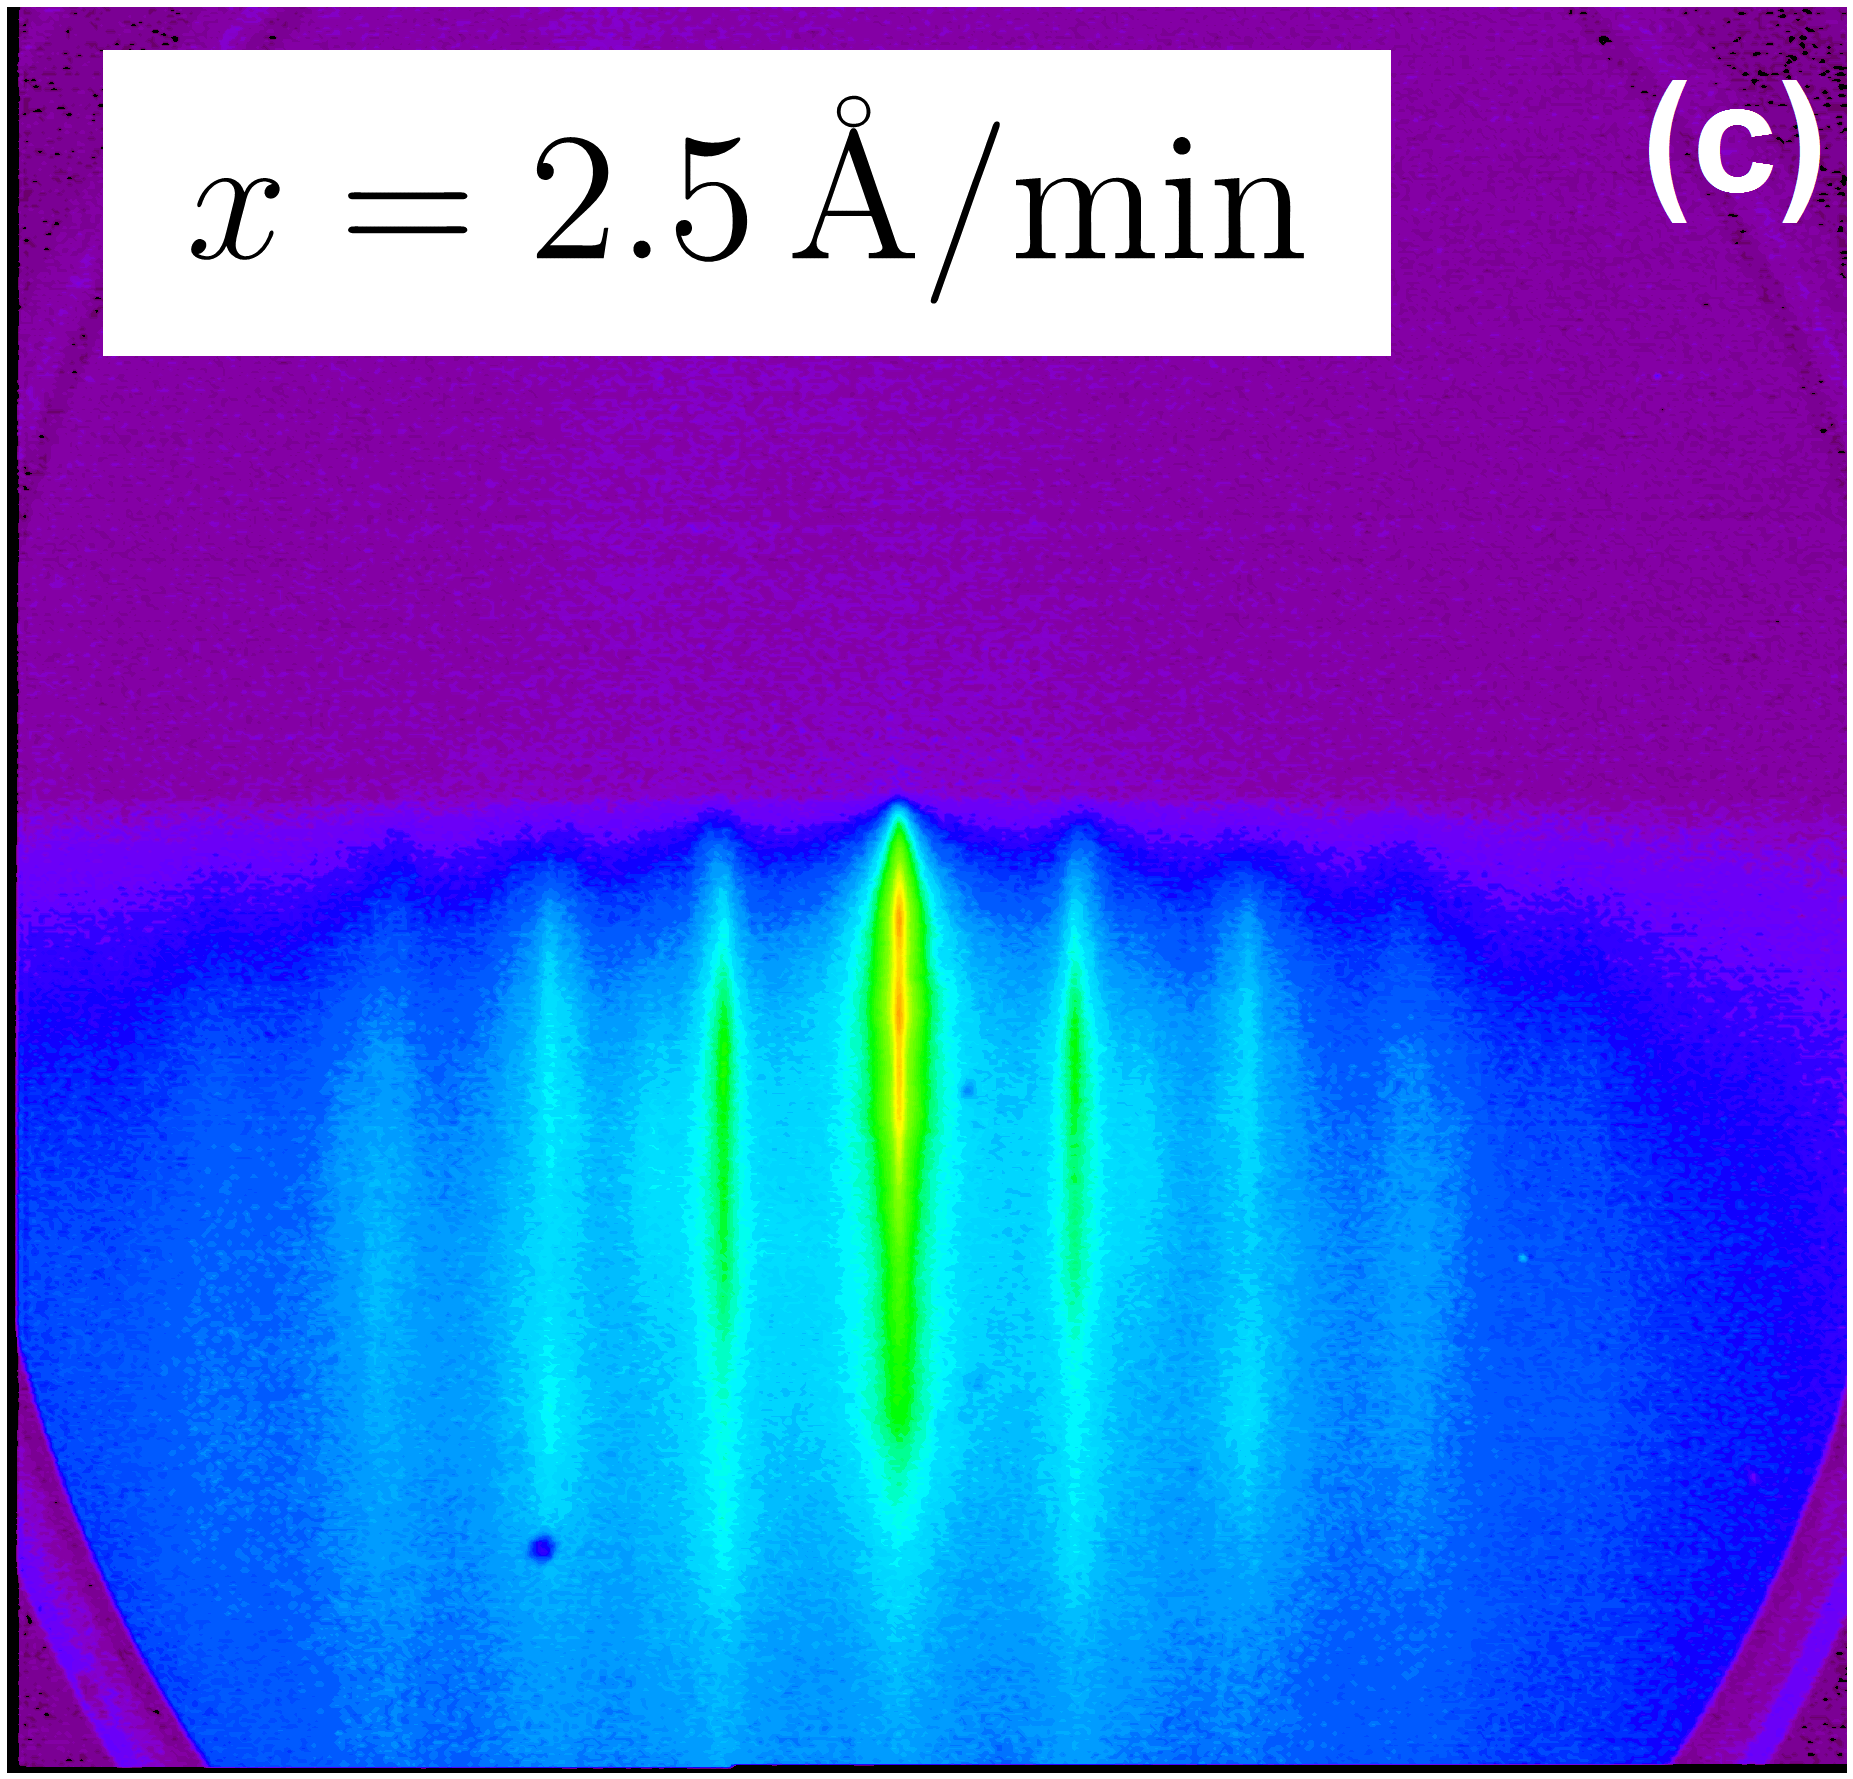
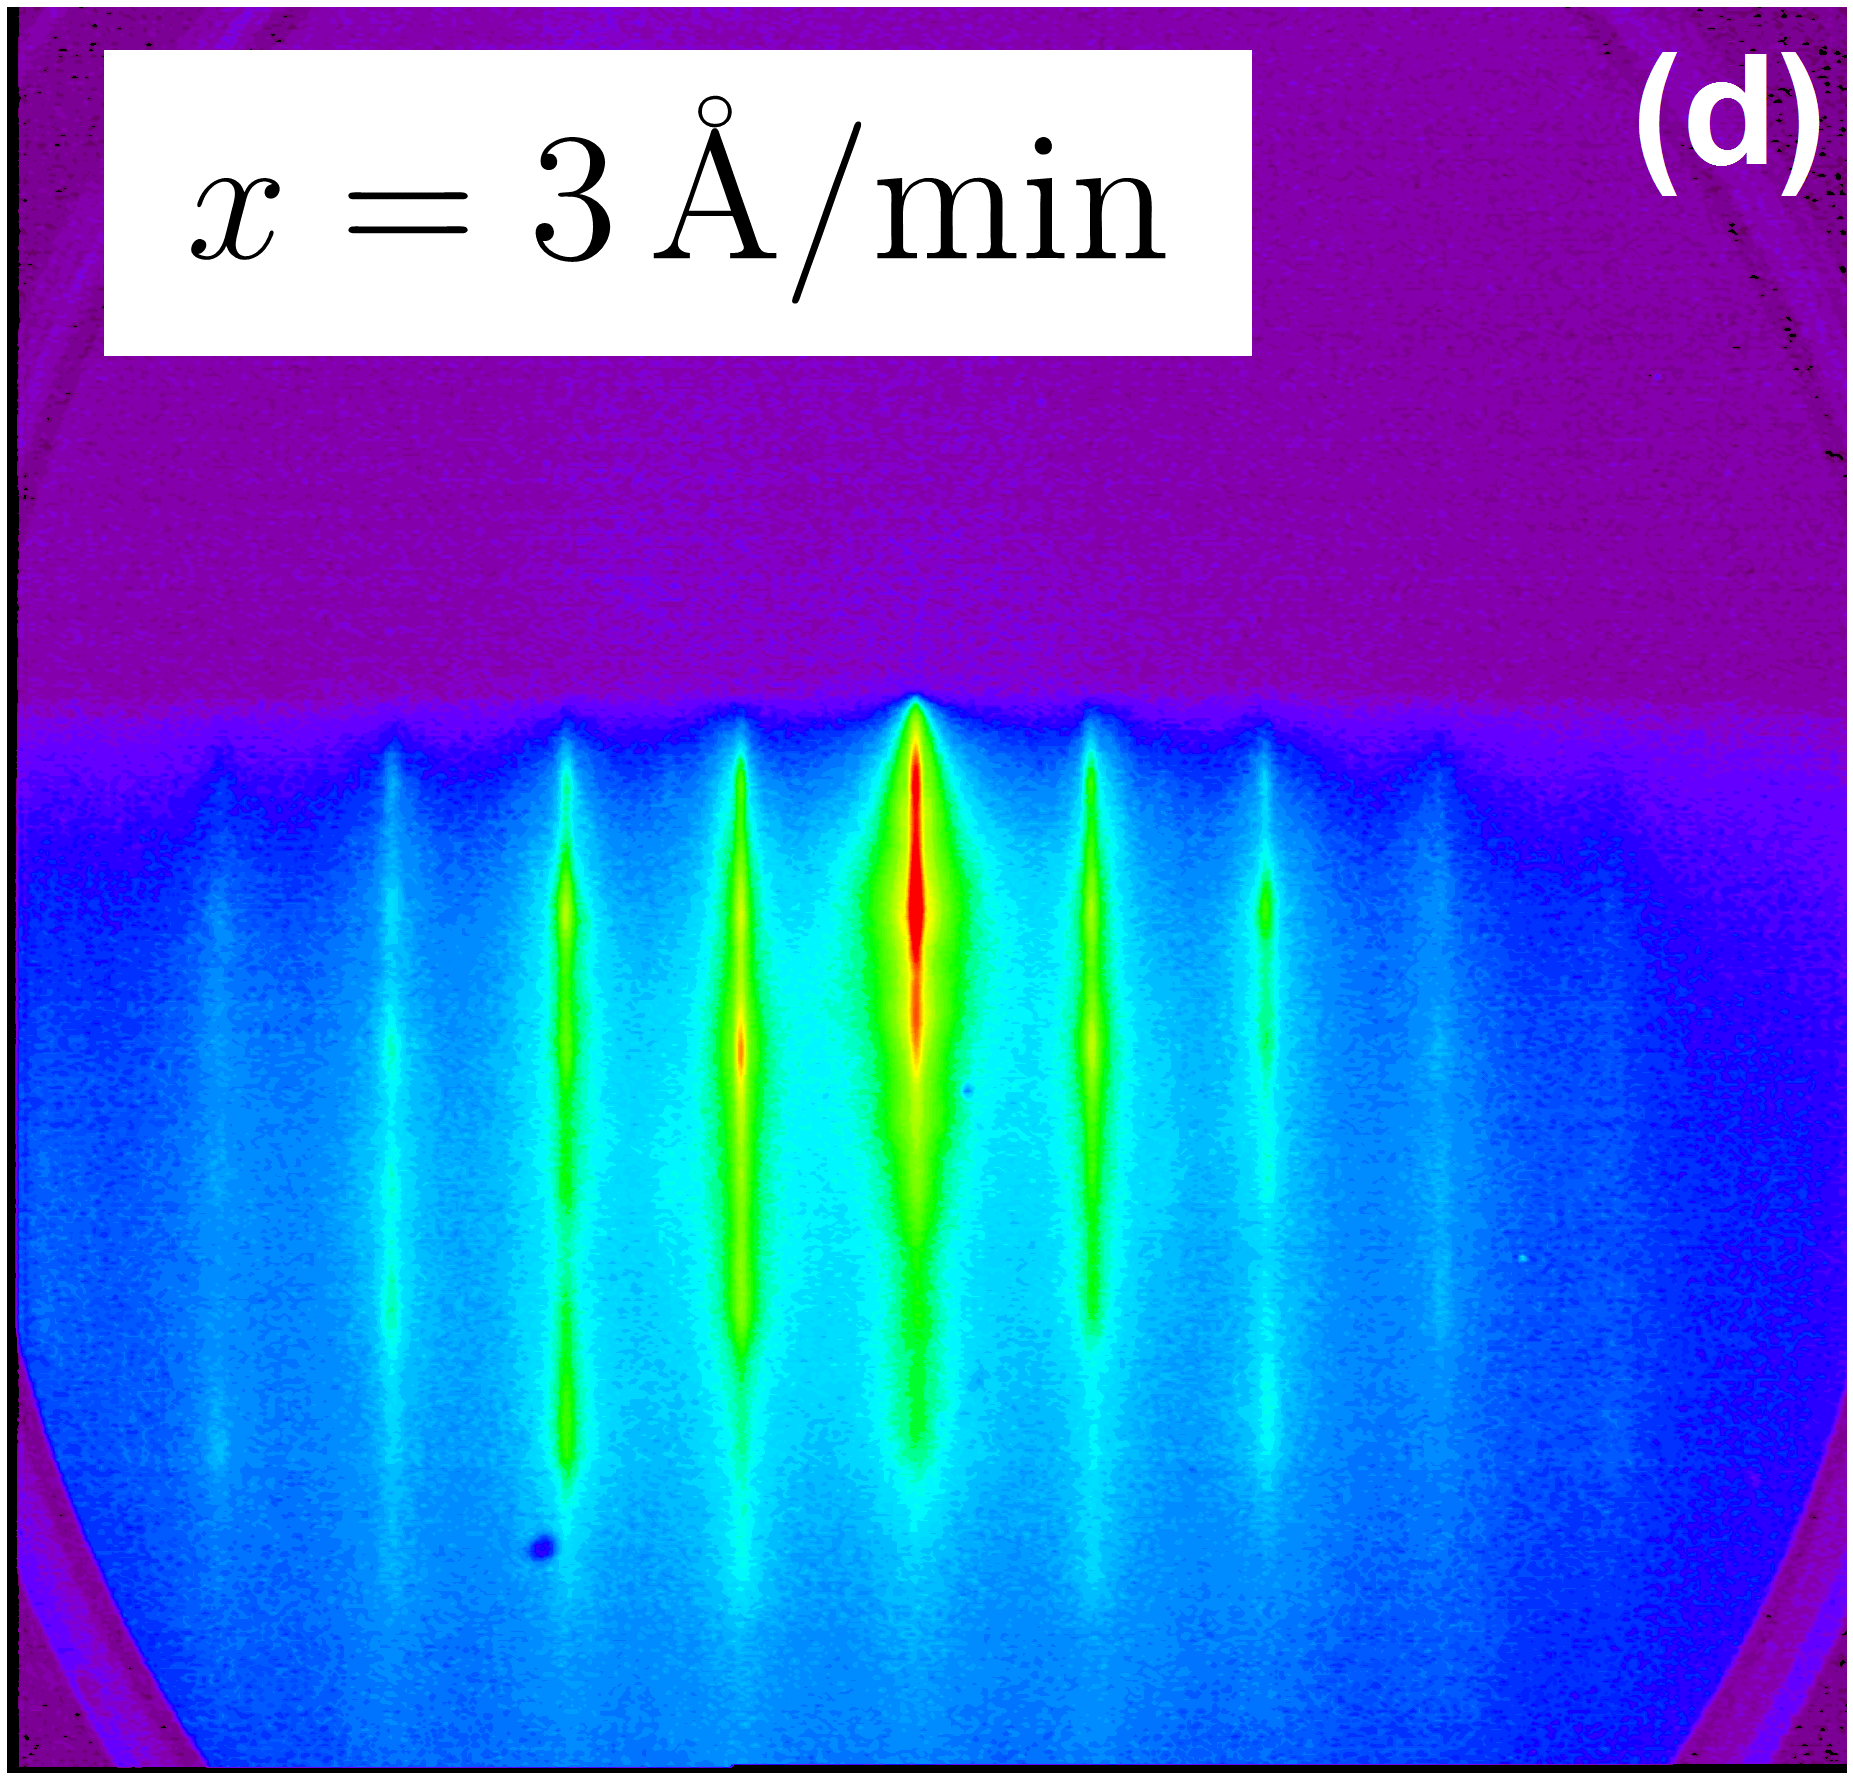
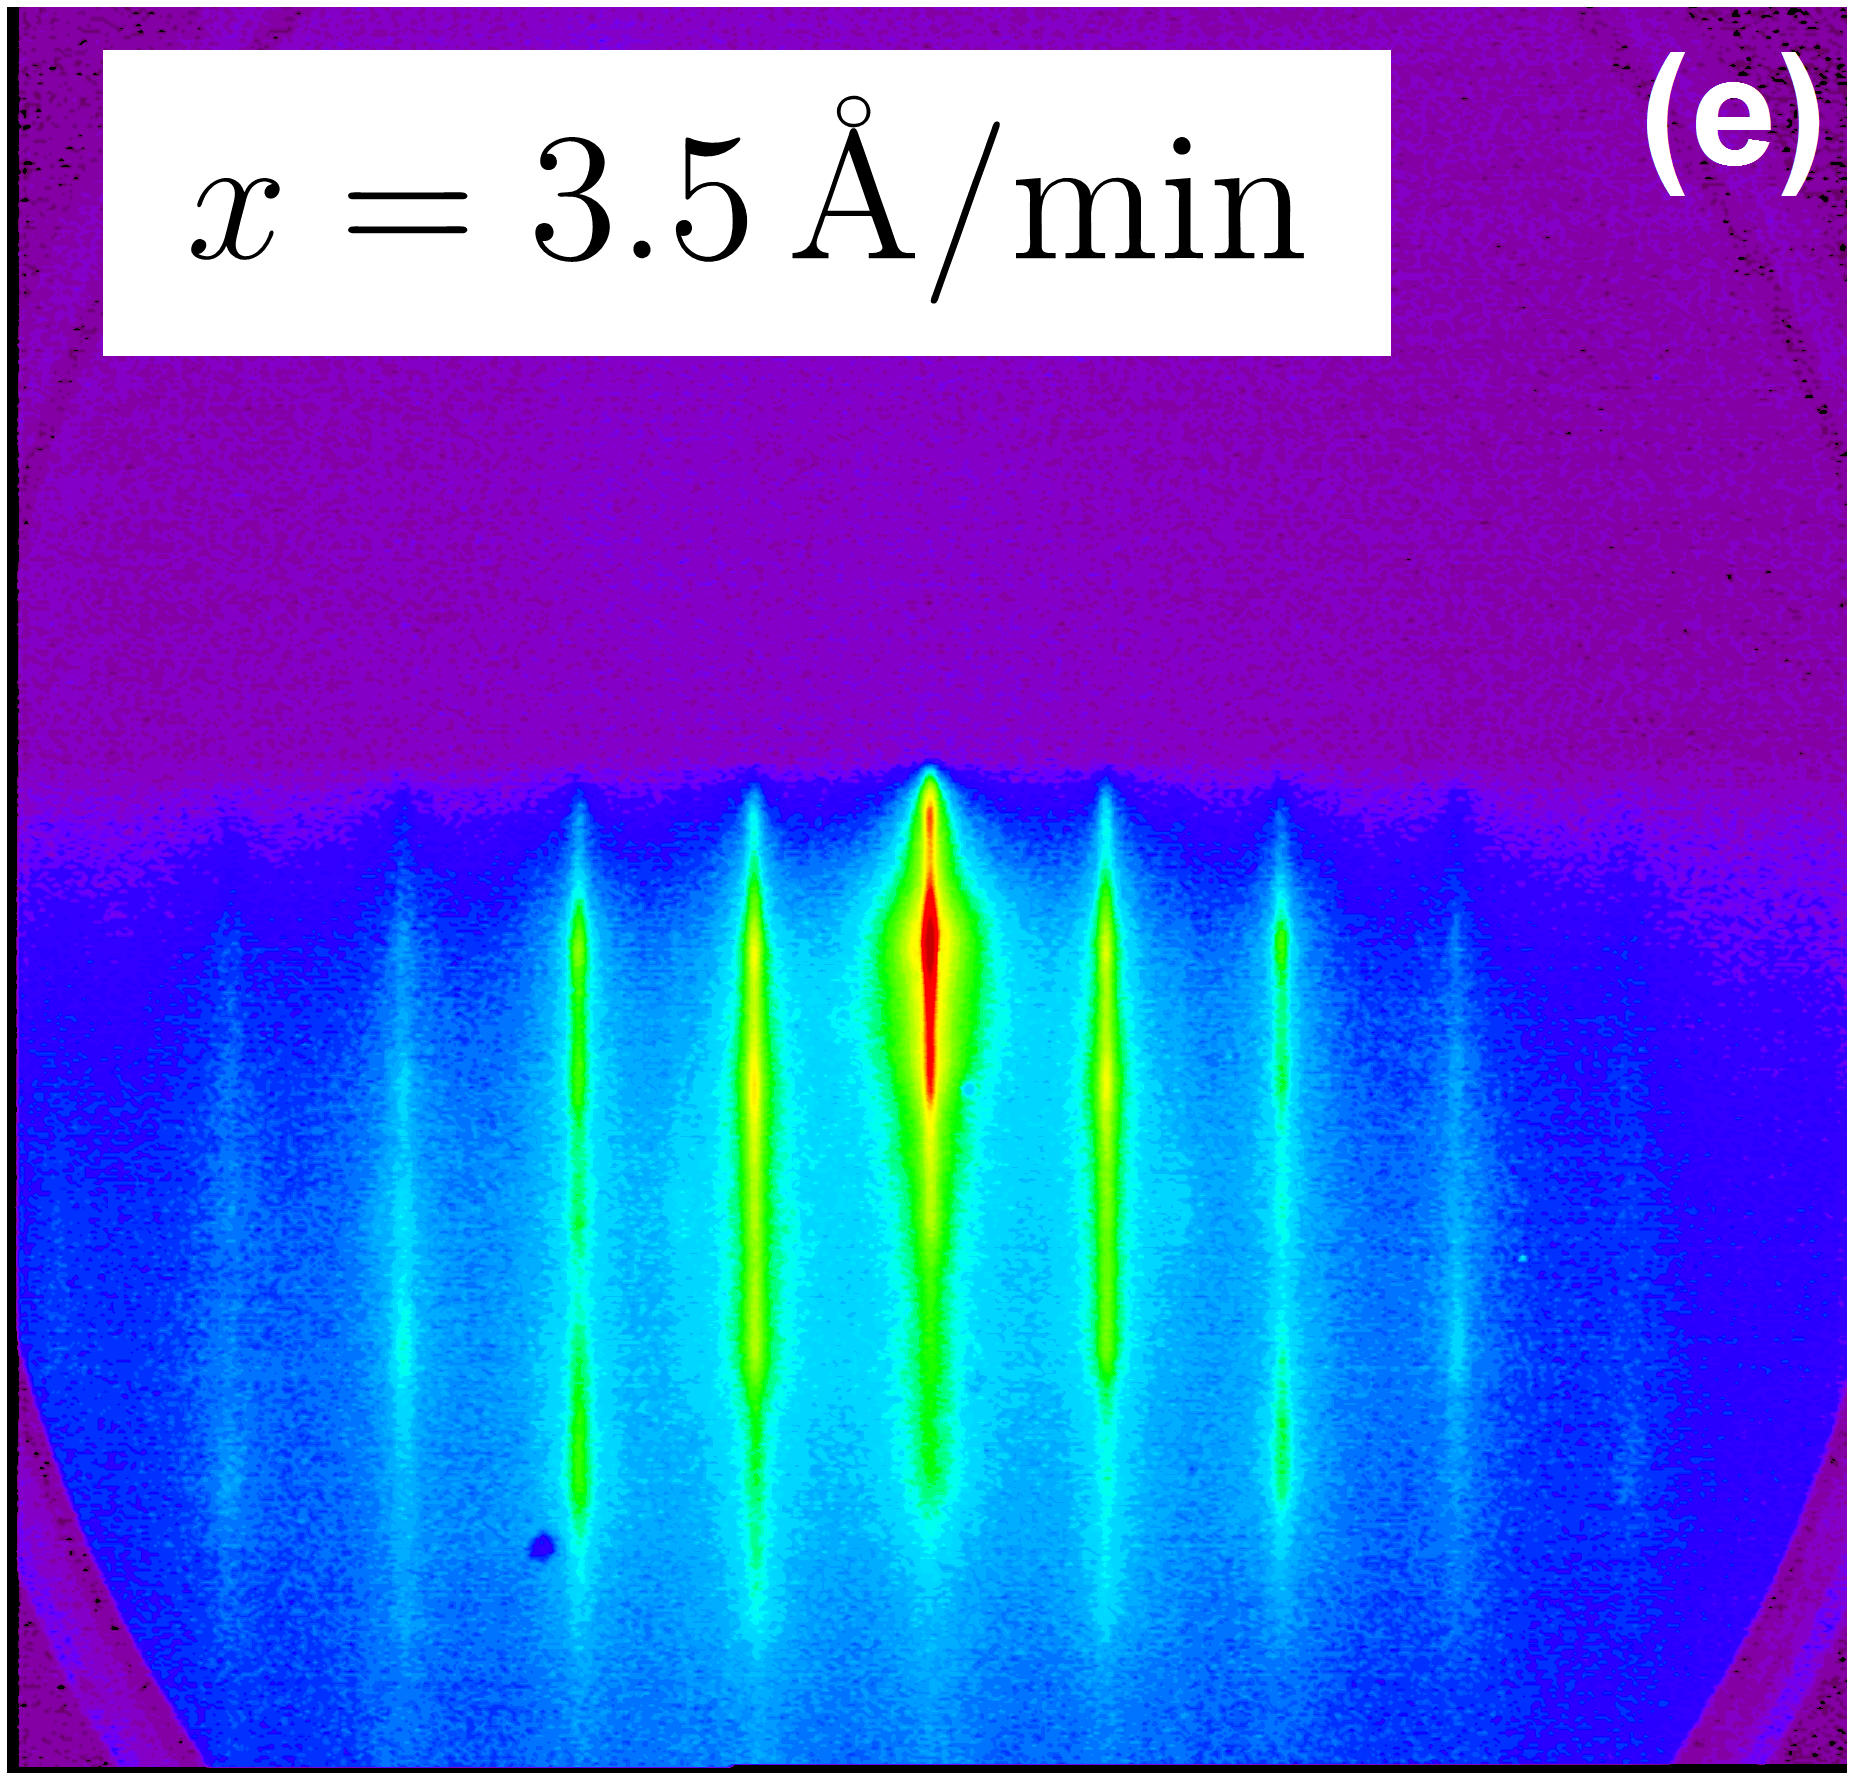
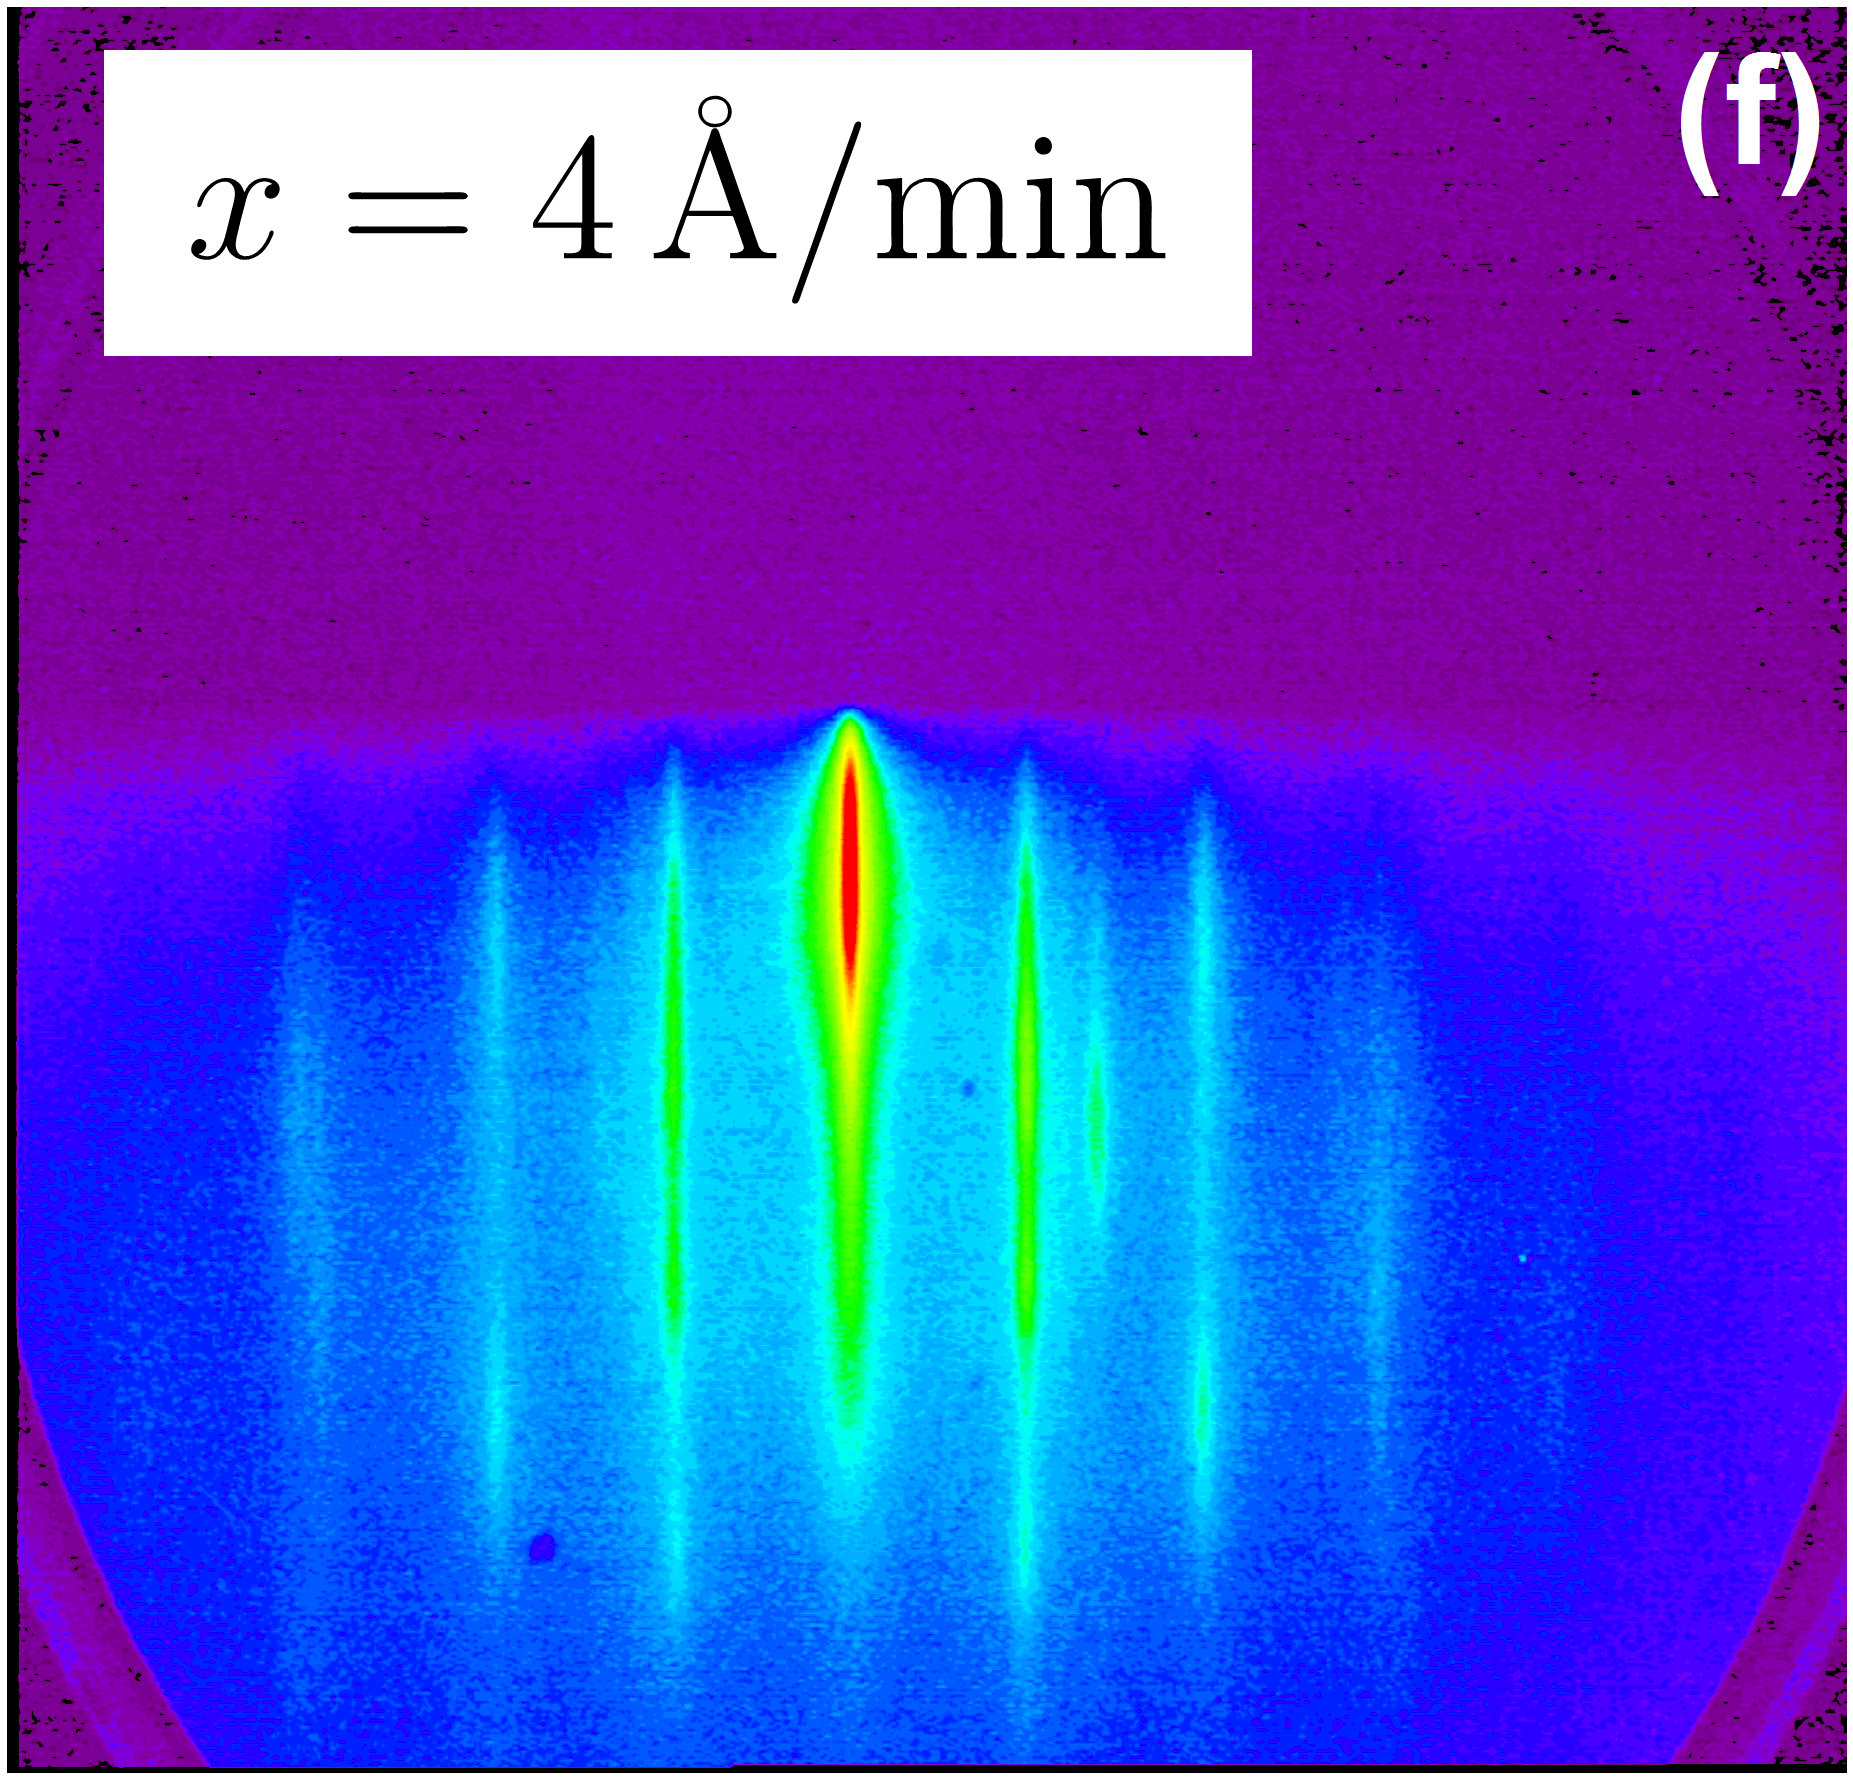
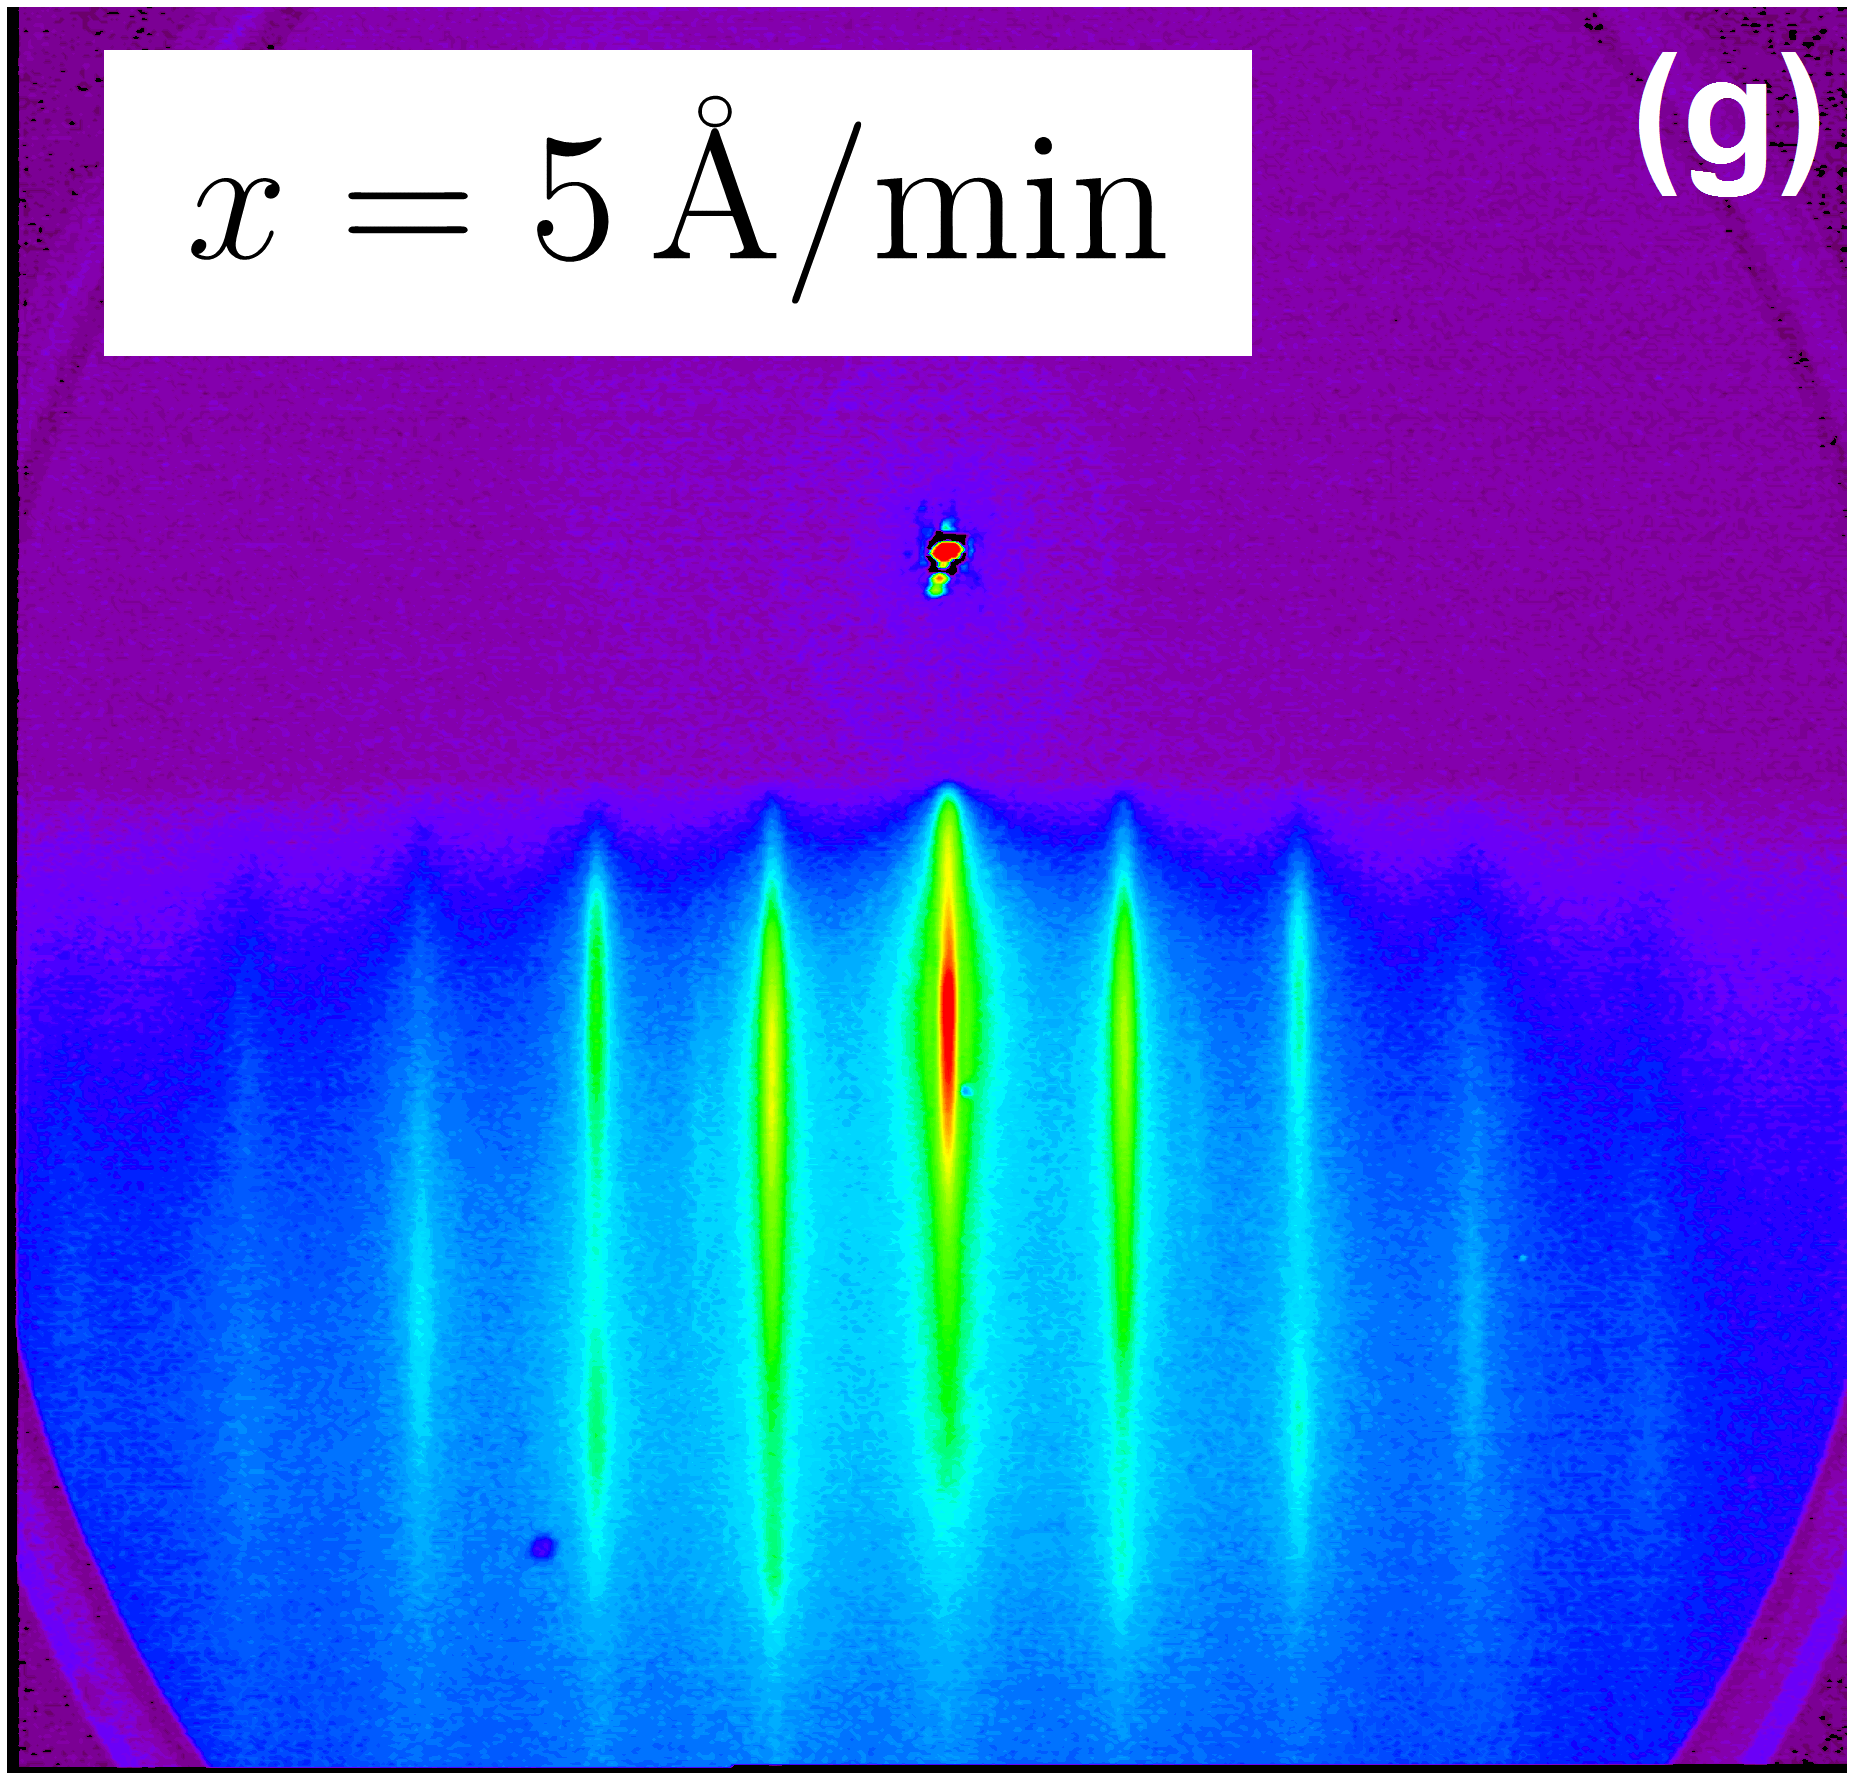
Figure 1 shows the RHEED patterns of the films prepared with the Fe deposition rate fixed at 1 Å/min and with Te deposition rates varied between 1 and 7 Å/min. These RHEED pictures were all taken after 30 min of deposition. One can observe spots and rings for the film prepared with = 1 Å/min (a), indicating polycrystalline and island growth. For = 2 Å/min (b), some faint streaky patterns can be seen on top of a high background, and for = 2.5, 3, 3.5, 4, and 5 Å/min (c-g) the same streaky patterns become much clearer. For = 7 Å/min (h), new additional streaks as well as spots start to appear. The results indicate that for = 1 and 7 Å/min the films consist of several different phases. For = 2, 2.5, 3, 3.5, 4 and 5 Å/min, the appearance of the same streaky patterns is in agreement with the presence of the Fe1+yTe phase of the bulk, although the amount and quality could vary depending on how clear and crisp the patterns are with respect to the background. We note that, although MgO (001) has a high lattice mismatch ( 9 %), the layered structure of FeTe relies on Van der Waals epitaxy, which enables a crystalline growth of the films.
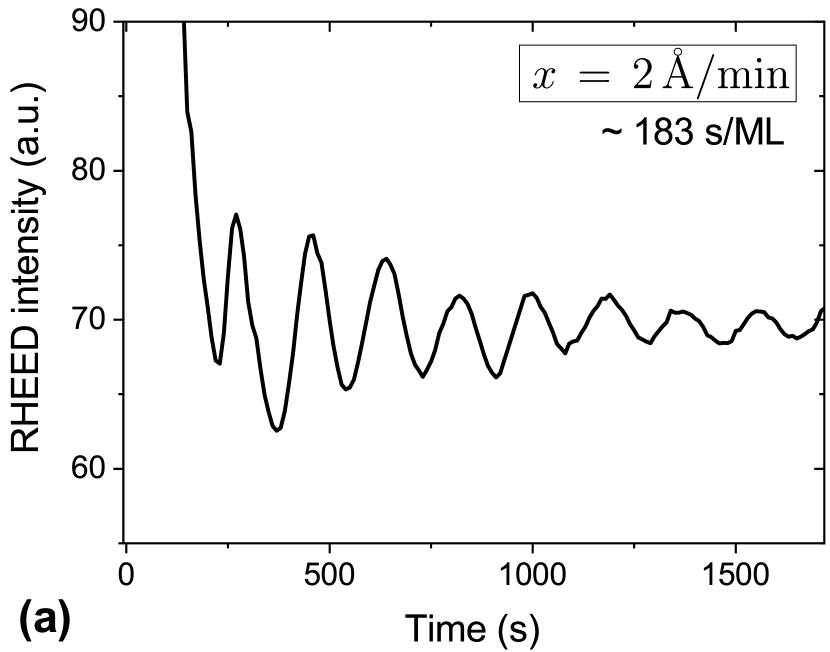
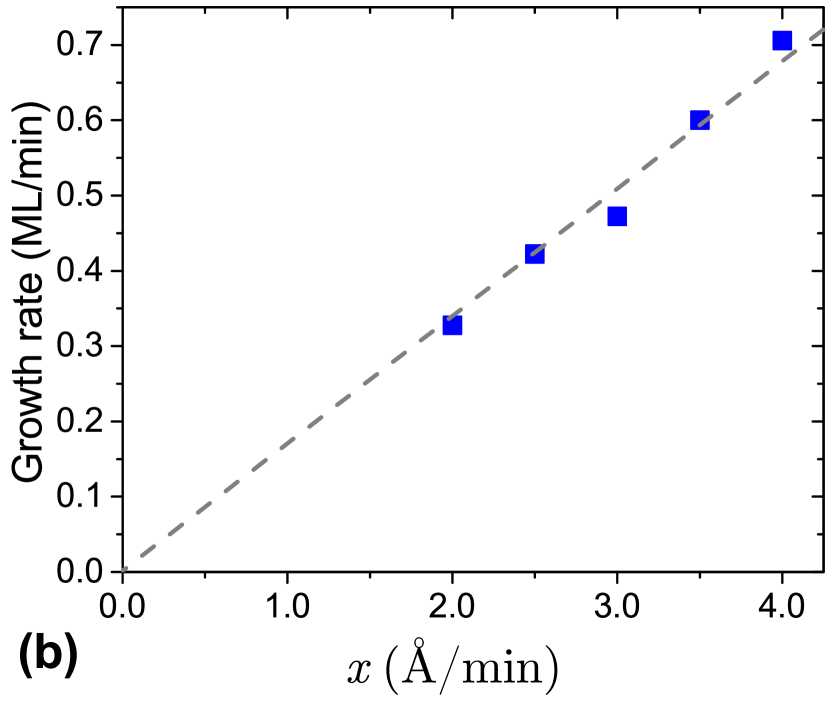
To obtain more information about the growth process, we have monitored the intensity of the specular spot of the RHEED as a function of time. We have been able to observe intensity oscillations for the films prepared with = 2, 2.5, 3, 3.5 and 4 Å/min. In Figure 2(a) we show an example of such oscillations for a film with = 2 Å/min. These pronounced oscillations indicate a layer-by-layer epitaxial growth. We found that the oscillation time varies with . It is about 183 seconds per monolayer (s/ML) for the = 2 Å/min film and becomes shorter for higher values. Converting these numbers into monolayer per minute (ML/min), we then can plot the growth rate as a function of . This is displayed in Figure 2(b). We can notice a strong linear relationship between the growth rate and the Te deposition rate, establishing that the growth is controlled by the Te supply. We are thus operating in a Te-limited growth mode. This is to be contrasted to the earlier thin film studies where the Fe supply was limiting the growth Zheng (2013); Hu et al. (2014); Li et al. (2016). This is caused by the low substrate temperature relative to the Te supply rate used in our study.
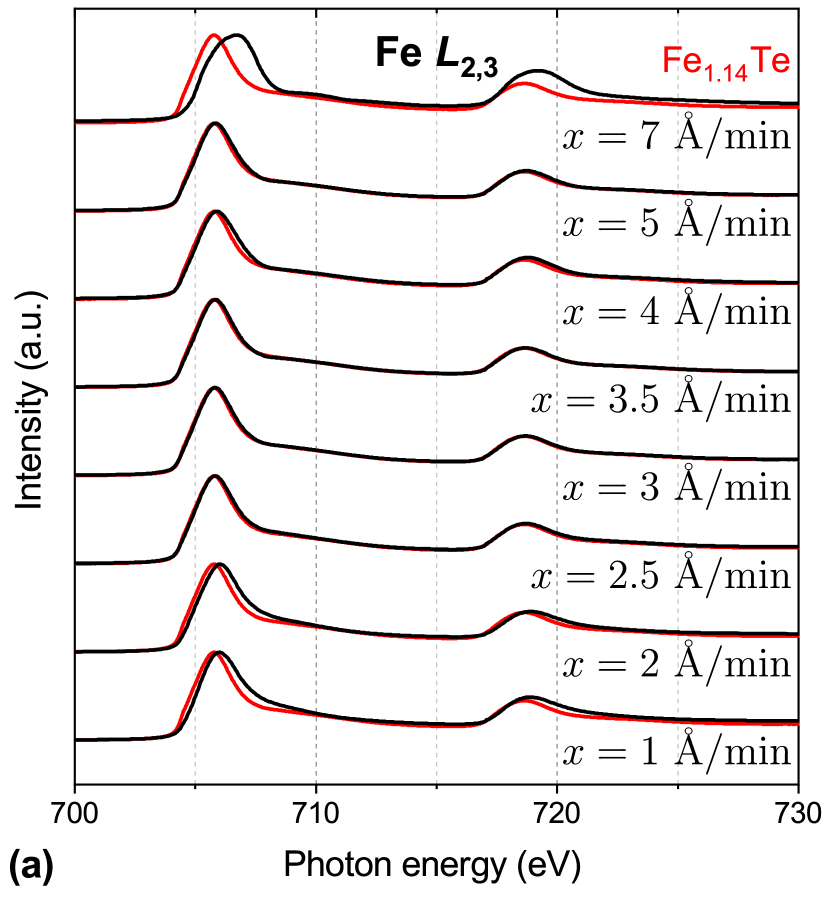
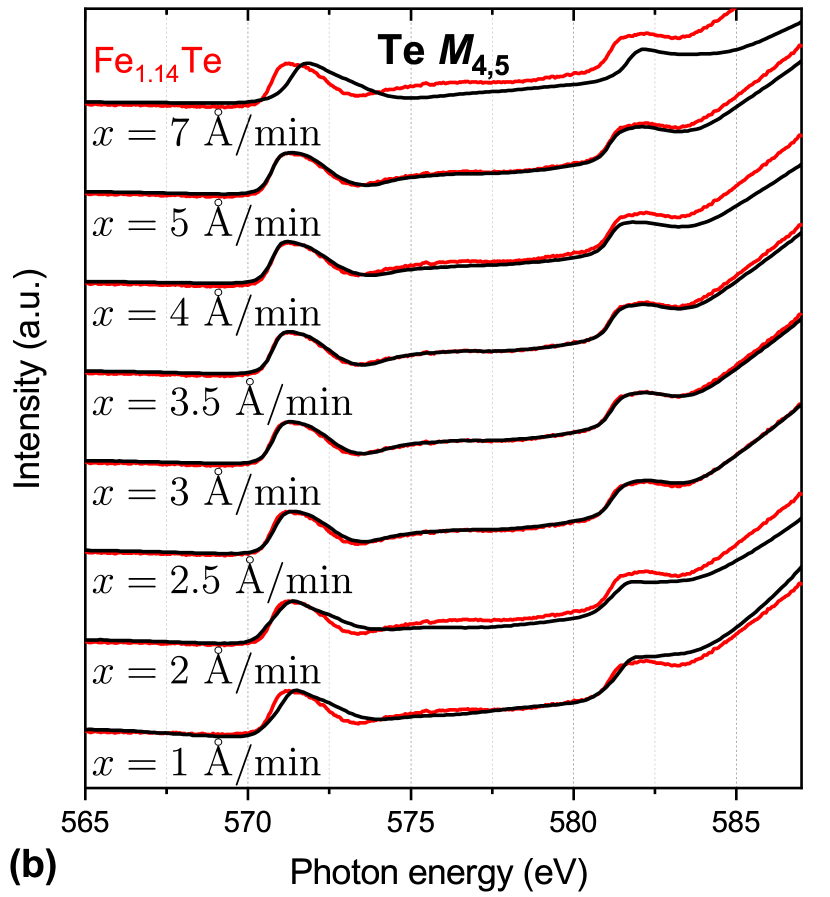
To characterize the electronic properties of the films, we have carried out x-ray absorption (XAS) measurements on the films across the Fe and Te edges. For comparison we have also collected the XAS spectra of a bulk single crystal with the composition Fe1.14Te. Figure 3 shows these results. We can observe that for films with = 1 and 2 Å/min (black curves) there are strong deviations in the Fe and Te spectra with respect to those of the Fe1.14Te bulk reference (red curve). For films with = 2.5, 3, 3.5, 4, and 5 Å/min on the other hand, the spectra (black curves) are quite similar to those of the bulk (red curve). For the = 7 Å/min film (black curve) we can, once again, observe substantial differences with the bulk (red curve). These results indicate that substantial amounts of different phases are present in the low and high films, but that for in the range of 2.5 - 5 Å/min we are quite close to the bulk Fe1+yTe phase.
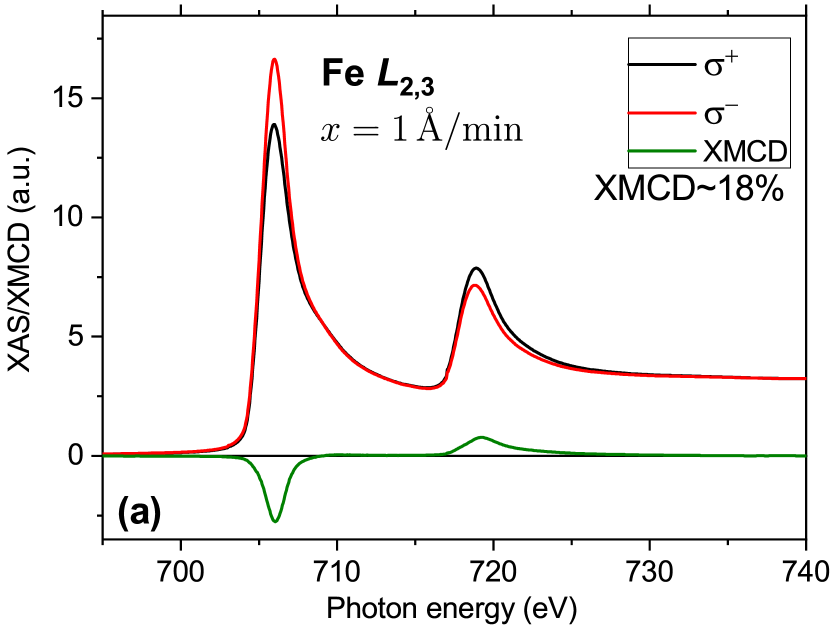
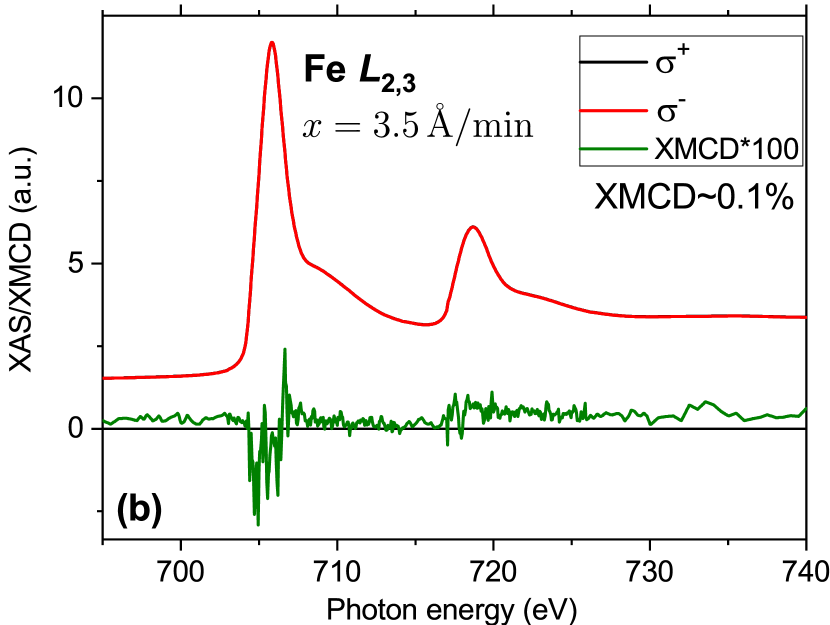
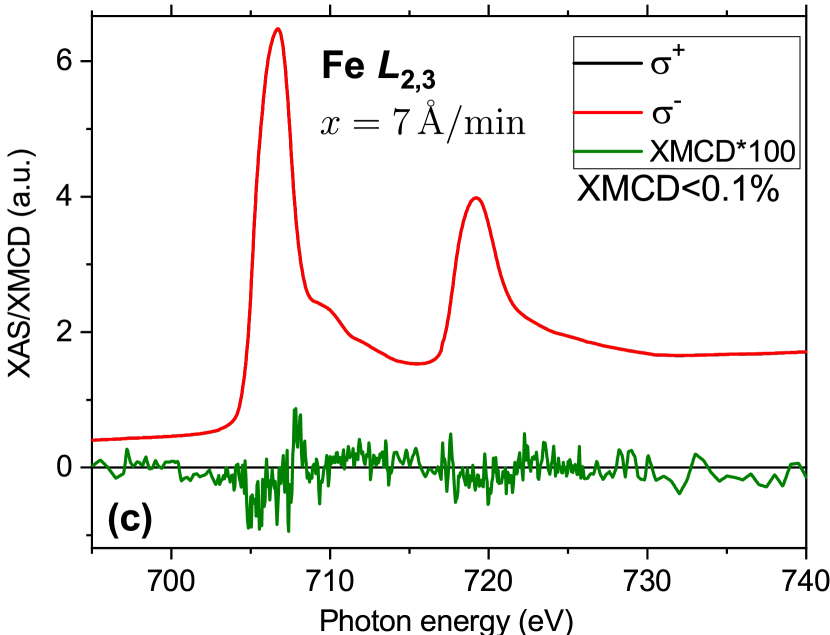
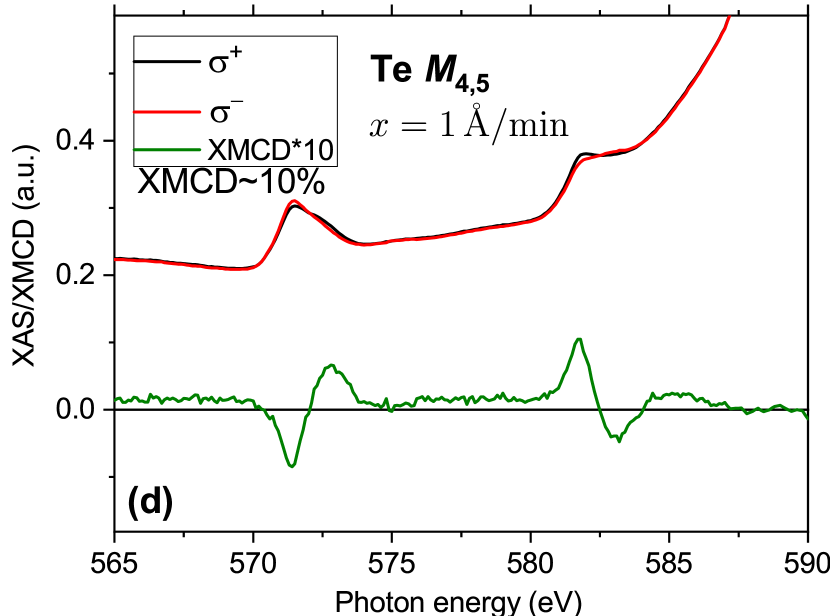
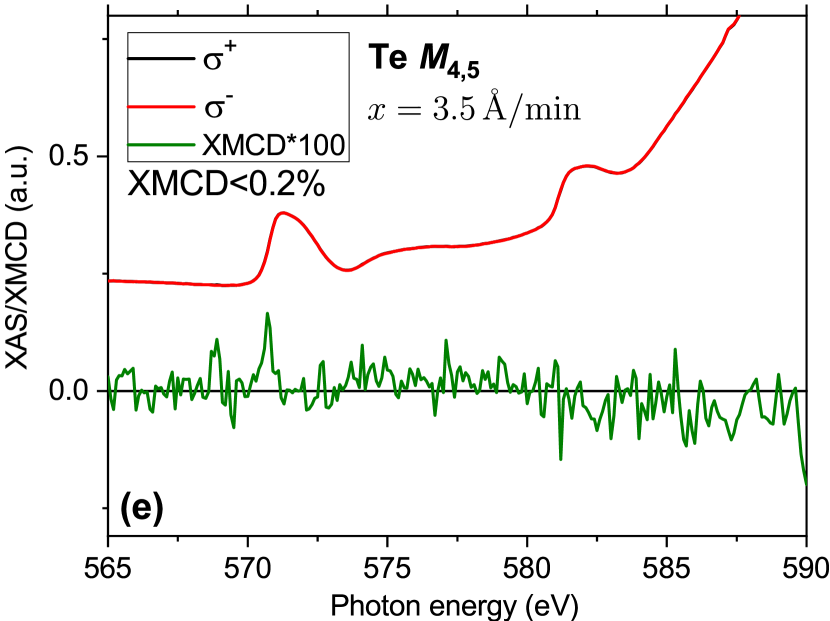
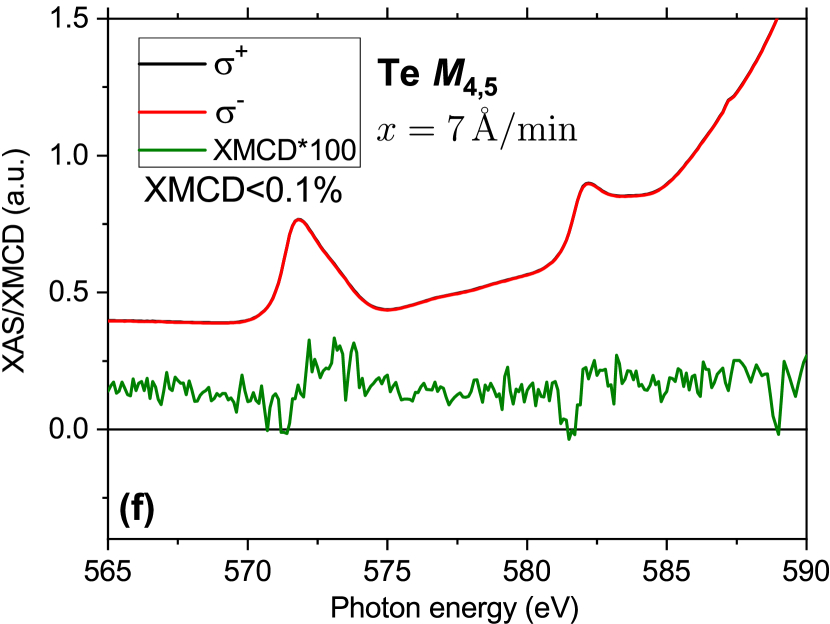
Figure 4 depicts Fe and Te XAS and XMCD spectra, taken at room temperature, for a representative selection of the films. For = 1 Å/min, we observe in panel (a) that the Fe spectrum taken with the positive light helicity (black curve) is different from the one taken with negative light helicity (red curve). Their difference or XMCD spectrum (green curve) reaches a maximum value of about 18% at 706 eV photon energy. Also at the Te edges there is a difference in the XAS spectra taken with the two helicities. The XMCD effect at 572 eV amounts to about 10%. For films grown with = 3.5 and 7 Å/min, there is essentially no difference in the XAS for the two helicities. The XMCD is smaller than 0.1-0.2 % across both the Fe and Te edges.
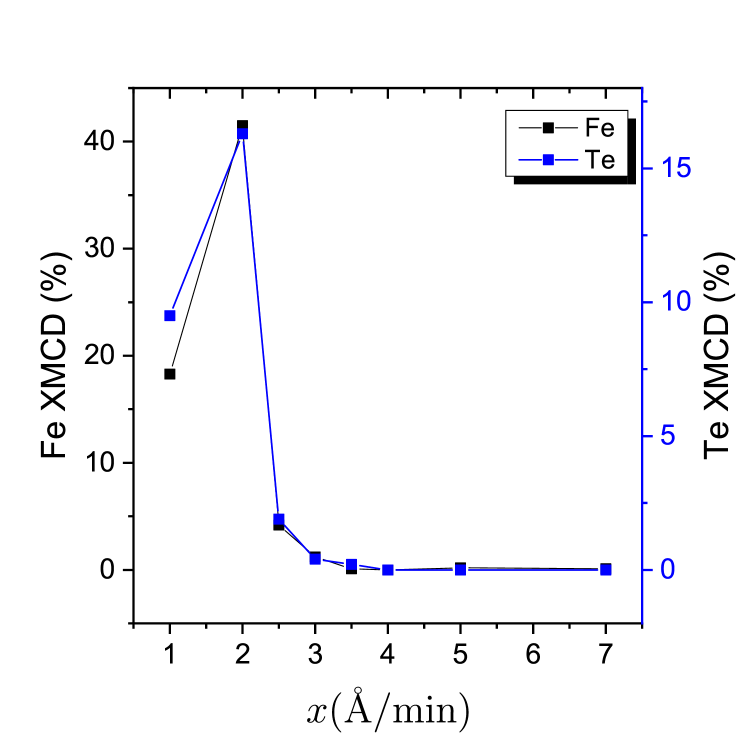
In Figure 5 we summarize the XMCD results for the entire range covered in this study. We found that there is a substantial and even strong XMCD signal for films grown with = 1 and 2 Å/min, and that this XMCD signal drops quickly for = 2.5 and 3 Å/min films. The XMCD is tiny for = 3.5 Å/min, and is beyond detection for the highest values, 4, 5, and 7 Å/min.
From the RHEED data, we can deduce that epitaxial strain does not play a significant role, as the lattice constant is relaxed to the value expected for bulk samples. This can be due to the weakness of the van der Waals forces between layers of FeTe. Therefore, a comparison with bulk samples should be possible. For these, it is known that Fe1+yTe with is paramagnetic at room temperature Koz et al. (2013). Therefore, films that show XMCD should have Fe in excess of = 0.16. The fact that films with = 1 and 2 Å/min have very strong XMCD may even indicate that there the excess Fe forms metallic clusters that are ferromagnetic, thereby also polarizing magnetically the adjacent Te atoms. Yet, it is also conceivable that part of the excess Fe is interstitial and then interacts with the in-plane Fe as to form magnetic clusters. Such a scenario was proposed by a study using density functional calculations Zhang et al. (2009).
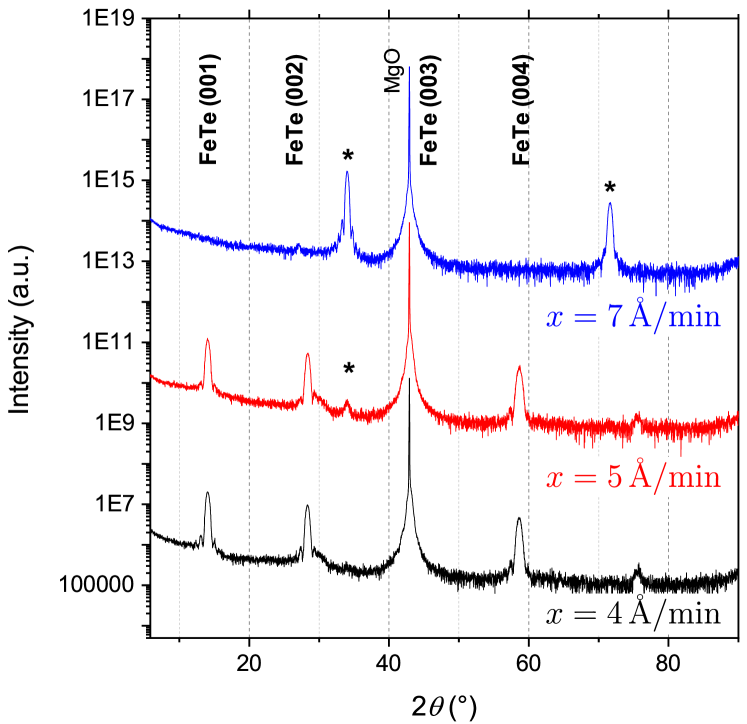
To complement the characterization of the films, we also have investigated ex situ their crystal structure using XRD. A selection of XRD scans is presented in Figure 6. For = 2.5 - 4 Å/min, all the peaks can be indexed to FeTe (0 0 n). For = 5 Å/min, we detect not only FeTe (0 0 n) peaks but also a secondary phase which can be identified as FeTe2, marked with an asterisk in Figure 6. This phase becomes predominant for = 7 Å/min, with all the observed peaks belonging to it. For = 1, 2 Å/min, no crystalline phase could be identified through XRD.
IV Discussion
Our thin film experiments using the Te-limited growth reveal that epitaxial and crystalline FeTe films can be synthesized for a wide range of Te-deposition rates . Clear and similar RHEED patterns can be observed for ranging from 2.5 to 5 Å/min. Intensity oscillations of the specular spot in the RHEED can be recorded for films with from 2.5 to 4 Å/min, actually even from = 2 Å/min. The XRD data also show that for = 2.5 - 4 Å/min, the films only show (0 0 n) peaks that belong to the FeTe phase. From the XAS measurements we find that, from = 2.5 to 3.5 Å/min, the films have very similar electronic properties as the bulk Fe1.14Te single crystal, and from the XMCD we see that there is no ferromagnetism for films with = 3.5 Å/min or higher. From all these results combined we can infer that the = 3.5 Å/min film has a composition which is very close or identical to that of the bulk Fe1.14Te single crystal. This implies that the = 2.5 Å/min film should correspond to a Fe1.60Te system and that the = 4 Å/min film should be close to a stoichiometric Fe1.00Te. The latter assignment is consistent with our XRD observation that FeTe2 peaks are visible only in films with higher values, namely = 5 and 7 Å/min.
The picture that arises from our study is the following: films that were grown with = 1 and 2 Å/min Te deposition rates have nominal compositions of roughly Fe4Te and Fe2Te, respectively. They contain large amounts of presumably Fe metal clusters that are ferromagnetic. It is nevertheless surprising that RHEED intensity oscillations can be observed for the = 2 Å/min film, suggesting that a substantial part of the excess Fe is residing in the interstitial positions of the FeTe phase. For = 2.5 - 3.5 Å/min, we have a layer-by-layer growth of Fe1+yTe films with the composition ranging from Fe1.60Te to Fe1.14Te, in which the excess Fe resides interstitially. For = 4 Å/min we may have achieved the stoichiometric Fe1.00Te compound and, for higher values, FeTe2 starts to be formed as well.
A note should be added regarding the purity of the Fe1+yTe films. The presence of non-crystalline parasitic phases cannot, at this stage, be completely excluded. The electronic and sructural properties explored in this work point towards a promising route to synthesize Fe1.00Te. However, other characterization techniques, as in situ transport measurements, shall be also explored in the future.
V Conclusions
To summarize, we were able to prepare good quality thin films of the Fe1+yTe system. The composition ranges from Fe1.00Te to Fe1.60Te, which is a wider range than anticipated from studies on Fe1+yTe bulk material Rodriguez et al. (2011); Rößler et al. (2011); Koz et al. (2013). Moreover, x-ray absorption and x-ray magnetic circular dichroism measurements show that it is possible to obtain films with very similar electronic properties as that of a high quality bulk single crystal Fe1.14Te. Even a high quality film with a nominally stoichiometric Fe1.00Te composition could be made. These results suggest that molecular beam epitaxy in the Te-limited growth mode may provide an opportunity to synthesize FeTe in a controlled manner that can become superconducting.
Acknowledgements.
We would like to thank Sahana Rößler and Steffen Wirth for the valuable discussions, Katharina Höfer and Christoph Becker for the skillful technical assistance and the department of Claudia Felser for the use of the thin films XRD instrument. We acknowlegde the financial support from the Deutsche Forschungsgemeinschaft, under the Priority Program SPP-1666 Topological Insulators. C.N.W. acknowledges support from the Ministry of Science and Technology of Taiwan under MoST 105-2112-M-007-014-MY3, and V.M.P. from the International Max Planck Research School for Chemistry and Physics of Quantum Materials (IMPRS-CPQM). The experiments in Taiwan were facilitated by the Max Planck-POSTECH-Hsinchu Center for Complex Phase Materials.References
- Kamihara et al. (2008) Y. Kamihara, T. Watanabe, M. Hirano, and H. Hosono, Iron-based layered superconductor La[O1-xFx]FeAs (= 0.05-0.12) with Tc = 26 K, Journal of the American Chemical Society 130, 3296 (2008).
- Zhao et al. (2008) J. Zhao, Q. Huang, C. de la Cruz, S. Li, J. W. Lynn, Y. Chen, M. A. Green, G. F. Chen, G. Li, Z. Li, J. L. Luo, N. L. Wang, and P. Dai, Structural and magnetic phase diagram of CeFeAsO1-xFx and its relation to high-temperature superconductivity, Nature Materials 7, 953 (2008).
- Hsu et al. (2008) F.-C. Hsu, J.-Y. Luo, K.-W. Yeh, T.-K. Chen, T.-W. Huang, P. M. Wu, Y.-C. Lee, Y.-L. Huang, Y.-Y. Chu, D.-C. Yan, and M.-K. Wu, Superconductivity in the PbO-type structure -FeSe, Proceedings of the National Academy of Sciences 105, 14262 (2008).
- Bao et al. (2009) W. Bao, Y. Qiu, Q. Huang, M. A. Green, P. Zajdel, M. R. Fitzsimmons, M. Zhernenkov, S. Chang, M. Fang, B. Qian, E. K. Vehstedt, J. Yang, H. M. Pham, L. Spinu, and Z. Q. Mao, Tunable (,)-type antiferromagnetic order in -Fe(Te,Se) superconductors, Physical Review Letters 102, 247001 (2009).
- Li et al. (2009) S. Li, C. de la Cruz, Q. Huang, Y. Chen, J. W. Lynn, J. Hu, Y.-L. Huang, F.-C. Hsu, K.-W. Yeh, M.-K. Wu, and P. Dai, First-order magnetic and structural phase transitions in Fe1+ySeTe1-x, Physical Review B 79, 054503 (2009).
- Mizuguchi et al. (2008) Y. Mizuguchi, F. Tomioka, S. Tsuda, T. Yamaguchi, and Y. Takano, Superconductivity at 27 K in tetragonal FeSe under high pressure, Applied Physics Letters 93, 152505 (2008).
- Margadonna et al. (2009) S. Margadonna, Y. Takabayashi, Y. Ohishi, Y. Mizuguchi, Y. Takano, T. Kagayama, T. Nakagawa, M. Takata, and K. Prassides, Pressure evolution of the low-temperature crystal structure and bonding of the superconductor FeSe (Tc=37 K), Physical Review B 80, 064506 (2009).
- Medvedev et al. (2009) S. Medvedev, T. M. McQueen, I. A. Troyan, T. Palasyuk, M. I. Eremets, R. J. Cava, S. Naghavi, F. Casper, V. Ksenofontov, G. Wortmann, and C. Felser, Electronic and magnetic phase diagram of -Fe1.01Se with superconductivity at 36.7 K under pressure, Nature Materials 8, 630 (2009).
- Ciechan et al. (2014) A. Ciechan, M. J. Winiarski, and M. Samsel-Czekała, Magnetic phase transitions and superconductivity in strained FeTe, Journal of Physics: Condensed Matter 26, 025702 (2014).
- Mydeen et al. (2017) K. Mydeen, D. Kasinathan, C. Koz, S. Rößler, U. K. Rößler, M. Hanfland, A. A. Tsirlin, U. Schwarz, S. Wirth, H. Rosner, and M. Nicklas, Pressure-induced ferromagnetism due to an anisotropic electronic topological transition in Fe1.08Te, Physical Review Letters 119, 227003 (2017).
- Rodriguez et al. (2011) E. E. Rodriguez, C. Stock, P. Zajdel, K. L. Krycka, C. F. Majkrzak, P. Zavalij, and M. A. Green, Magnetic-crystallographic phase diagram of the superconducting parent compound Fe1+xTe, Physical Review B 84, 064403 (2011).
- Rößler et al. (2011) S. Rößler, D. Cherian, W. Lorenz, M. Doerr, C. Koz, C. Curfs, Y. Prots, U. K. Rößler, U. Schwarz, S. Elizabeth, and S. Wirth, First-order structural transition in the magnetically ordered phase of Fe1.13Te, Physical Review B 84, 174506 (2011).
- Koz et al. (2013) C. Koz, S. Rößler, A. A. Tsirlin, S. Wirth, and U. Schwarz, Low-temperature phase diagram of Fe1+yTe studied using x-ray diffraction, Physical Review B 88, 094509 (2013).
- Han et al. (2010) Y. Han, W. Y. Li, L. X. Cao, X. Y. Wang, B. Xu, B. R. Zhao, Y. Q. Guo, and J. L. Yang, Superconductivity in iron telluride thin films under tensile stress, Physical Review Letters 104, 017003 (2010).
- Nie et al. (2010) Y. F. Nie, D. Telesca, J. I. Budnick, B. Sinkovic, and B. O. Wells, Superconductivity induced in iron telluride films by low-temperature oxygen incorporation, Physical Review B 82, 020508(R) (2010).
- Si et al. (2010) W. Si, Q. Jie, L. Wu, J. Zhou, G. Gu, P. D. Johnson, and Q. Li, Superconductivity in epitaxial thin films of Fe1.08Te:Ox, Physical Review B 81, 092506 (2010).
- Telesca et al. (2012) D. Telesca, Y. Nie, J. I. Budnick, B. O. Wells, and B. Sinkovic, Impact of valence states on the superconductivity of iron telluride and iron selenide films with incorporated oxygen, Physical Review B 85, 214517 (2012).
- Zheng (2013) M. Zheng, Superconductivity in oxygen doped iron telluride by molecular beam epitaxy, Ph.D. thesis, University of Illinois at Urbana-Champaign (2013).
- Dong et al. (2011) C. Dong, H. Wang, Z. Li, J. Chen, H. Q. Yuan, and M. Fang, Revised phase diagram for the FeTe1-xSex system with fewer excess Fe atoms, Physical Review B 84, 224506 (2011).
- Hu et al. (2012) J. Hu, G. C. Wang, B. Qian, and Z. Q. Mao, Inhomogeneous superconductivity induced by interstitial Fe deintercalation in oxidizing-agent-annealed and HNO3-treated Fe1+y(Te1-xSex), Superconductor Science and Technology 25, 084011 (2012).
- Kawasaki et al. (2012) Y. Kawasaki, K. Deguchi, S. Demura, T. Watanabe, H. Okazaki, T. Ozaki, T. Yamaguchi, H. Takeya, and Y. Takano, Phase diagram and oxygen annealing effect of FeTe1-xSex iron-based superconductor, Solid State Communications 152, 1135 (2012).
- Hu et al. (2014) H. Hu, J.-H. Kwon, M. Zheng, C. Zhang, L. H. Greene, J. N. Eckstein, and J.-M. Zuo, Impact of interstitial oxygen on the electronic and magnetic structure in superconducting Fe1+yTeOx thin films, Physical Review B 90, 180504(R) (2014).
- Li et al. (2016) W. Li, W.-G. Yin, L. Wang, K. He, X. Ma, Q.-K. Xue, and X. Chen, Charge ordering in stoichiometric FeTe: Scanning tunneling microscopy and spectroscopy, Physical Review B 93, 041101(R) (2016).
- Rößler et al. (2016) S. Rößler, C. Koz, S. Wirth, and U. Schwarz, Synthesis, phase stability, structural, and physical properties of 11-type iron chalcogenides, Physica Status Solidi (b) 254, 1600149 (2016).
- Zhang et al. (2009) L. Zhang, D. J. Singh, and M. H. Du, Density functional study of excess Fe in Fe1+xTe: Magnetism and doping, Physical Review B 79, 012506 (2009).