Measurements of ZnWO4 anisotropic response to nuclear recoils for the ADAMO project
P. Bellia,b, R. Bernabeia,b,111Corresponding
author. E-mail address: rita.bernabei@roma2.infn.it.,
F. Cappellac,d,
V. Caraccioloa,b,e, R. Cerullia,b, N. Cherubinif, F. A. Danevichg,
A. Incicchittic,d, D. V. Kasperovychg,
V. Merloa,b, E. Piccinellif, O. G. Polischukg and
V. I. Tretyakg
a INFN sezione Roma “Tor Vergata”, I-00133 Rome, Italy
b Dipartimento di Fisica, Università di Roma “Tor Vergata”,
I-00133, Rome, Italy
c INFN sezione Roma, I-00185 Rome, Italy
d Dipartimento di Fisica, Università di Roma “La Sapienza”, I-00185
Rome, Italy
e INFN, Laboratori Nazionali del Gran Sasso, I-67100 Assergi (AQ),
Italy
f Enea, Italian National Agency for New Technologies, Energy and Sustainable Economic
Development, C.R: Casaccia, Roma 00123, Italy
g Institute for Nuclear Research of NASU, 03028 Kyiv, Ukraine
Abstract
Anisotropic scintillators can offer a unique possibility to exploit the so-called directionality approach in order to investigate the presence of those Dark Matter (DM) candidates inducing nuclear recoils. In fact, their use can overcome the difficulty of detecting extremely short nuclear recoil traces. In this paper we present recent measurements performed on the anisotropic response of a ZnWO4 crystal scintillator to nuclear recoils, in the framework of the ADAMO project. The anisotropic features of the ZnWO4 crystal scintillators were initially measured with particles; those results have been also confirmed by the additional measurements presented here. The experimental nuclear recoil data were obtained by using a neutron generator at ENEA-CASACCIA and neutron detectors to tag the scattered neutrons; in particular, the quenching factor values for nuclear recoils along different crystallographic axes have been determined for three different neutron scattering angles (i.e. nuclear recoils energies). From these measurements, the anisotropy of the light response for nuclear recoils in the ZnWO4 crystal scintillator has been determined at 5.4 standard deviations.
Keywords: Anisotropic crystal scintillators; ZnWO4; quenching factors; dark matter; directionality approach
1 Introduction
Astrophysical observations have pointed out the presence of Dark Matter (DM) on all astrophysical scales and many arguments have been suggested that a large fraction of it should be in form of relic DM particles. In the direct search for DM, a positive model independent result has been obtained with high confidence level by DAMA/NaI, DAMA/LIBRA-phase1 and DAMA/LIBRA-phase2 [1, 2, 3, 4, 5] exploiting the DM annual modulation signature with ultra-low-background NaI(Tl) target. This model independent evidence is compatible with a wide set of scenarios regarding the nature of the DM candidates and related astrophysical, nuclear and particle physics (see e.g. Ref. [6] and references therein; also numerous references on DM candidates and scenarios exist). It is worth noting that the used approach and target assure sensitivity both to DM candidate particles inducing nuclear recoils, as well as to those giving rise to electromagnetic radiation.
Another possible approach to DM investigation is the directionality [7]. In principle, it is effective for those DM candidate particles able to induce nuclear recoils, and thus potentially giving complementary information. This approach studies the correlation between the arrival direction of the DM particles, through the induced nuclear recoils, and the Earth motion in the galactic rest frame. In fact, the dynamics of the rotation of the Milky Way galactic disc through the halo of DM causes the Earth to experience a wind of DM particles apparently flowing along a direction opposite to that of the solar motion relative to the DM halo. However, because of the Earth’s rotation around its axis, their average direction with respect to an observer fixed on the Earth changes during the sidereal day. Nuclear recoils are expected to be strongly correlated with the particle impinging direction, and thus the study of the nuclear recoils direction can offer a tool to point out the presence of the considered type of DM candidate particles. However, the range of recoiling nuclei is of the order of a few mm in low pressure Time Projection Chambers and typically of order of m in solid detectors. These practical limitations, affecting possible experiments aiming at measuring recoil tracks, can be overcome by using anisotropic scintillation detectors in a suitable low background experimental set-up located deep underground. In fact, in this case there is no need of a track detection and recognition, since the information on the presence of the considered DM candidate particles is given by the variation of the measured counting rate (for details see e.g. in Refs. [8, 9, 10]) during the sidereal day when the light output (as well as the pulse shape) vary depending on the direction of the impinging DM particles with respect to the crystal axes. Moreover, the use of inorganic crystal scintillators takes potentially advantage in terms of high duty cycle, high stability, etc.
The use of anisotropic scintillators to study the directionality signature was proposed for the first time in Ref. [8] and revisited in [9], where the case of anthracene detector was preliminarily analysed and several practical difficulties in the feasibility of such an experiment were underlined. Nevertheless, the authors suggested that competitive sensitivities could be reached with new devoted R&D’s for the development of anisotropic scintillators having significantly larger size, higher light response, better stiffness, higher atomic weights and anisotropic features similar as – or better than – those of the anthracene scintillator.
A possibility to use anisotropic properties of ZnWO4 scintillator to search for diurnal variation of the DM counting rate was pointed out for the first time in Ref. [11]. More recently, measurements and R&Ds have shown that the ZnWO4 can be a scintillator offering suitable features [10, 12, 13, 14, 15] for the purpose. In particular, the light output due to heavy particles (p, , nuclear recoils) depends on the direction of such particles with respect to the crystal axes. Such an anisotropic effect has been ascribed to preferred directions of the excitons’ propagation in the crystal lattice affecting the dynamic of the scintillation mechanism [16, 17, 18, 19, 20, 21, 22, 23]. In particular, the presence of heavy ionizing particles with a preferred direction (like recoil nuclei induced by the considered type of DM candidates) could be discriminated from the electromagnetic background by comparing the low energy distributions measured using different orientations of the crystal axes along the day [8, 9, 10].
In the light of this, the ADAMO (Anisotropic detectors for DArk Matter Observation) project [10, 24] was considered and R&Ds have been progressed. In particular, here the final results on the measurements performed with a neutron generator at ENEA-CASACCIA and neutron detectors to tag the scattered neutrons are presented; these results allow to quantify the ZnWO4 anisotropy. Preliminary results in various conditions have been previously presented [25, 26, 27, 15, 28, 14, 29, 24, 30].
2 The ZnWO4 crystal scintillator
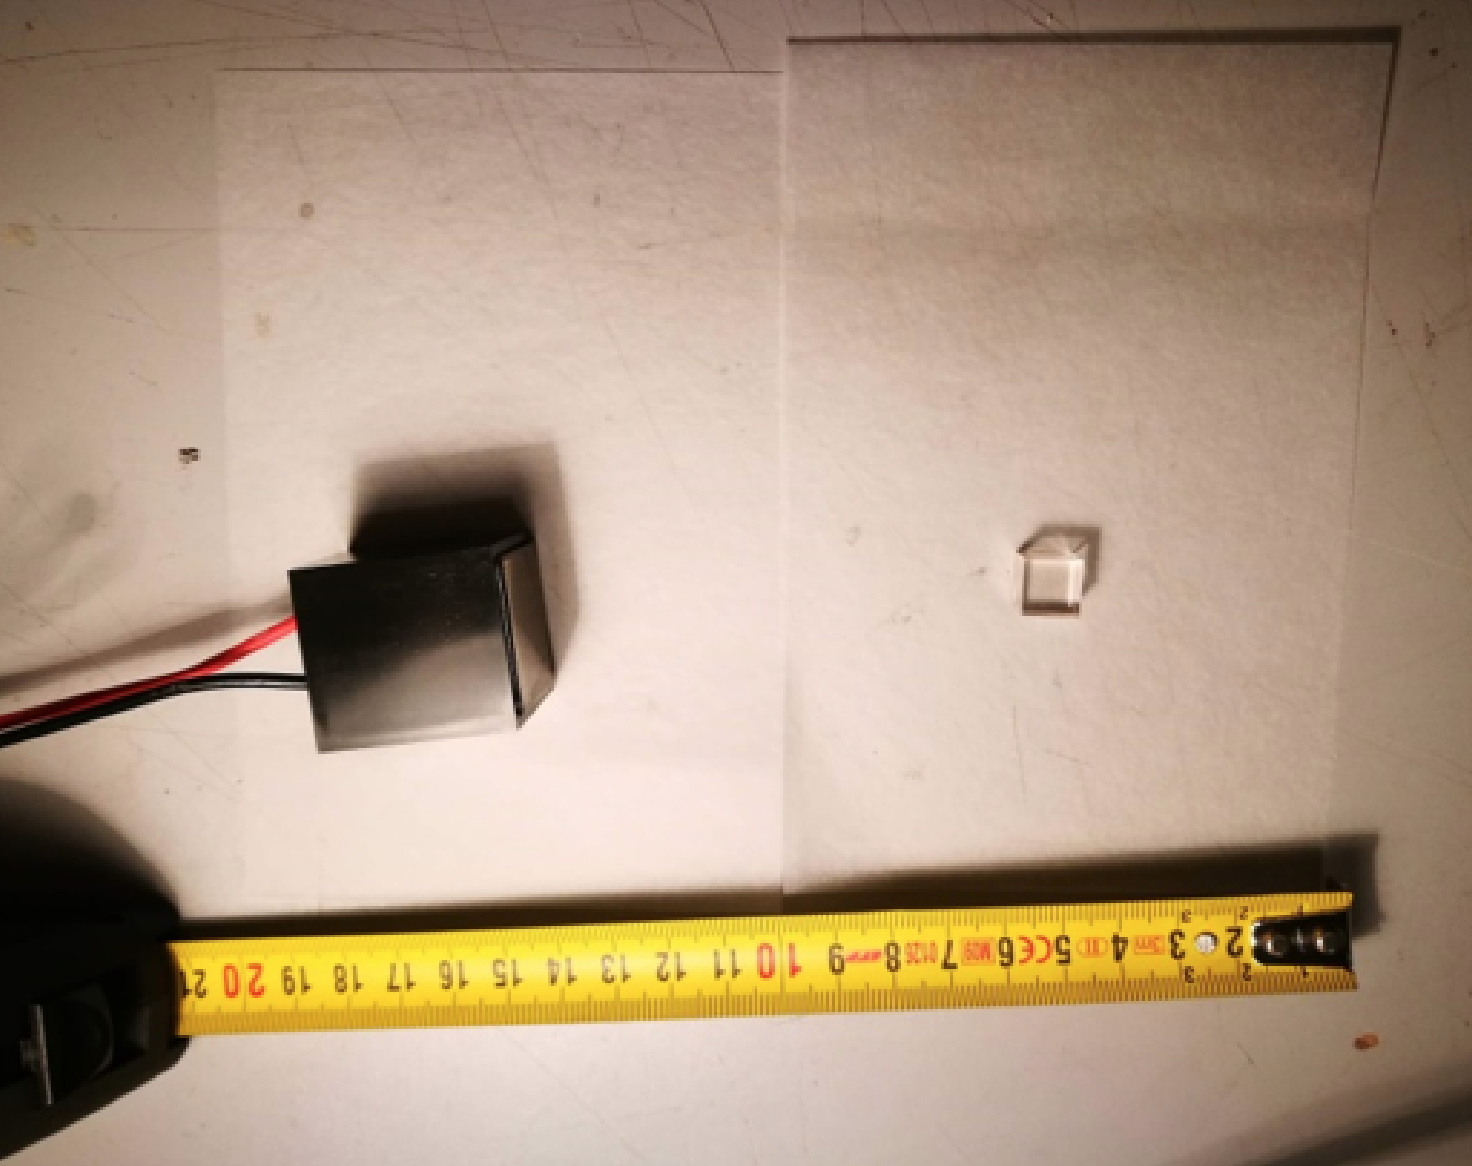
The used ZnWO4 crystal scintillator has a size of () mm3 and a mass of 7.99 g. The small size of the crystal is necessary to reduce as much as possible the multiple neutron scattering events in the measurements with the neutron generator.
The crystal has been produced in the framework of the ADAMO project for realizing high level radio-purity ZnWO4 crystal scintillators, with reasonably high optical and scintillation properties. In particular, it has been obtained by second crystallization (using low-thermal gradient Czochralski technique [31]) from zinc tungstate crystals made from tungsten oxide additionally purified by double sublimation of tungsten chlorides. Only top parts of first crystallization crystal boules were used to produce the second crystallization crystal boule. The boule then has been cut in various parts among which there was the scintillator used here. The crystal sample was etched in a solution of 80% of HNO3 (69.5%) and 20% of HF (40%) at temperature 85 ∘C over 4 hours222The etching procedure was applied to remove possible surface radioactive contamination of 3 samples of ZnWO4 scintillators, including the one used in the present study. Two other samples of larger mass, produced from the same crystal boule, were installed in a low-background set-up to investigate radioactive contamination of the material. The measurements are similar to those described in Ref. [15].. The crystallographic axes were identified by the producer and experimentally verified.
The ZnWO4 crystal has been coupled in case of neutron () measurements to two (one) high-speed response HAMAMATSU H11934-200 photomultipliers (PMTs), each one having squared window () mm2, effective area () mm2 and Ultra Bialkali photocathode. The quantum efficiency is equal to about 43% at the peak sensitivity (400 nm) and to around 25% at the 500 nm (close to the scintillation emission spectrum of the ZnWO4).
The crystal and one PMT are shown in Fig. 1. It should be noted the optical transparency of the realized ZnWO4 crystal sample, which is a very important issue to exploit such a kind of crystal in the considered framework.
3 Measurements with particles
In Ref. [11] pioneer studies on the anisotropic features of a ZnWO4 crystal have been performed showing that the light response and the pulse shape of such a scintillator depend on the impinging direction of the particles with respect to the crystal axes. In the present work new dedicated measurements with particles on the ZnWO4 detector, used in the measurements with neutron generator (discussed in Sect. 4), have been performed and compared with those of Ref. [11, 10].
In these measurements the small ZnWO4 crystal, described above, has been coupled to a HAMAMATSU H11934-200 PMT by optical grease, wrapped by teflon tape and installed in a “black box”.
The signal from the PMT has been acquired using a LeCroy WaveSurf24X-sA oscilloscope (4 channels, 2.5 GSamples/s, 200 MHz) and recorded in a time window of 100 ; an event-by-event data acquisition system stored the pulse profiles of the events.
The measurements have been performed in the MeV region with the help of a collimated beam of particles from an 241Am source and using various sets of thin mylar films as absorbers. The latter ones were placed perpendicular to the beam (fixed by a specific slot into the collimator, which was developed for this purpose). The energy scale of each measurement has been calibrated by using 137Cs and 22Na quanta.
The energies of particles, considering also the absorber mylar films previously mentioned, were determined with the help of a dedicated Silicon detector working in vacuum (CANBERRA Alpha Spectrometer model 7401VR).
Typical energy distributions of the particles impinging along the three axes of the crystal are shown in Fig. 2. The ZnWO4 crystal was irradiated in the directions perpendicular to the (100), (001) and (010) crystal planes: hereafter crystal axes I (blue on-line), II (green on-line) and III (red on-line), respectively in Fig. 2.
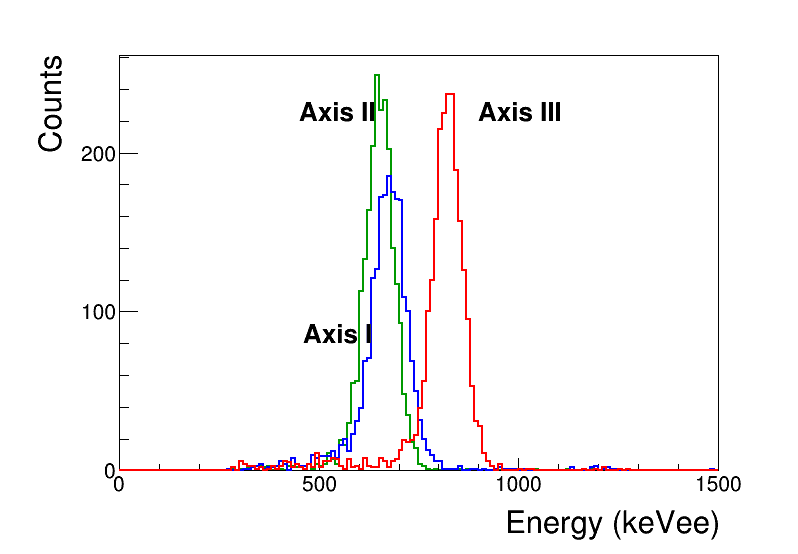
Figure 3 shows the dependence of the quenching factor Q.F.333The quenching factor Q.F. describes the response of a scintillator to heavy ionizing particles; in details, it is the ratio between the detected energy in the energy scale measured with sources to the energy of the heavy ionizing particle. for particles444Many times it is also named ratio. on the energy and on the direction of the beam relatively to the crystal planes in the ZnWO4 crystal.
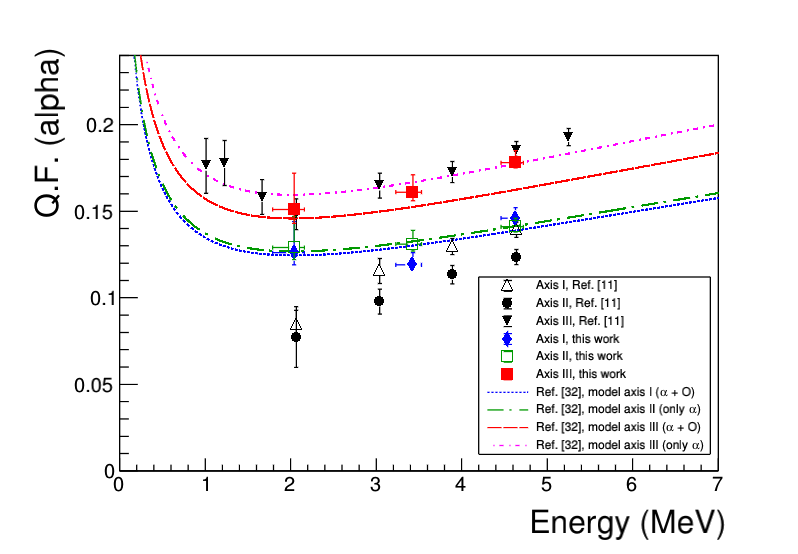
As shown in Fig. 3, the quenching factor for particles measured along the crystal axis III is about 20% higher than that measured along the crystal axes I and II. Instead, the quenching factor measured along the crystal axes I and II are quite similar. The error bars are mainly due to the uncertainty of the alpha energy slightly degraded in air.
The quenching factors and the anisotropic effect measured here are in reasonable agreement with those reported in Ref. [11], as shown in Fig. 3.
Fig. 3 also shows the models for each crystal axis obtained as global fit on the data of this paper following the prescription of Ref. [32], based on the semi-empirical classical Birks formula [16]:
| (1) |
where is a normalization factor, not relevant here, is the density of excitation centers along the track, and is a parameter; is usually treated as a single parameter (Birks factor). As done in Ref. [32], a single parameter has been used to fit the data of particles and recoils (see Section 4.5). Moreover, the fits of the only data for axes II and III are reported in Fig. 3 for further discussion.
In conclusion, the data confirm the anisotropic features of ZnWO4 crystal scintillator in the case of a beam of particles.
4 Measurements with neutrons
In order to verify and quantify scintillation anisotropy for low energy recoiling nuclei, the quenching factors for each crystallographic axis of the ZnWO4 crystal have been measured with the set-up described in the following. In particular, the nuclear recoils are induced by neutrons produced by a neutron generator; after a single elastic scattering, the neutron is tagged by two neutron detectors placed at a given scattering angle. This defines the energy and the direction of the recoiling nucleus, while the detected energy in the ZnWO4 detector – measured in keV electron equivalent (keVee) – allows the determination of the quenching factor, depending on the relative position of the crystal axes.
4.1 The neutron generator
The neutrons were generated by means of a neutron generator. In particular, a portable generator from Thermo Scientific (Model MP 320) has been used. In this device, deuterons are accelerated in electric potential up to 80 kV with available beam currents in the range 20-70 A. This particular device is endowed with a tritium target so that neutrons produced in the reaction have energies around 14.7 MeV in the forward direction. The experimental beam parameters were chosen in order to maximize the neutron yield at a stable beam operation. The cross section peaks at a deuteron beam energy of 160 keV, which is well beyond the attainable range of the generator. However, considering the power-law behaviour of the cross section as a function of the incident energy, no serious loss is suffered (roughly speaking, around 20%) in the neutron yield by choosing a beam acceleration voltage of 60 kV with a beam current I=40 A in continuous operation. With these conditions, extremely stable operation of the tube has been observed for long measuring times with a production rate Y=107 n/s, which we deem sufficient for the counting statistics of our experiment. In the experimental setup, neutrons leaving the target at 90 degrees to the forward direction have been used; at this angle, simple kinematics predicts a value MeV for a beam acceleration voltage of 60 kV.
4.2 The scheme of the experimental set-up
A schematic view of the experimental set-up is reported in Fig. 4. The neutron generator is contained in a wooden/paraffin box of about 10 cm of thickness. In correspondence with the tritium target inside the neutron generator there is a squared open channel (8 8) cm2 where the produced neutrons are free to impinge on the ZnWO4 detector. Other paraffin shield is placed ahead the box containing the neutron generator (see Fig. 5). In such a way, the total length of the neutron channel is about 50 cm.
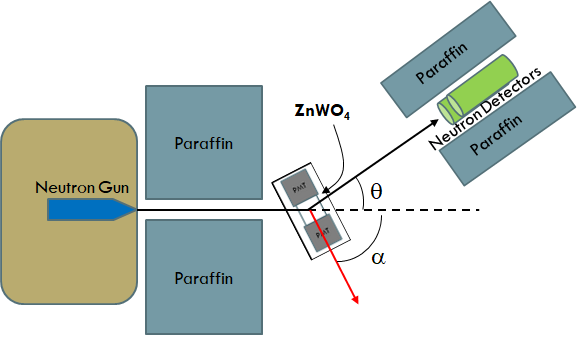
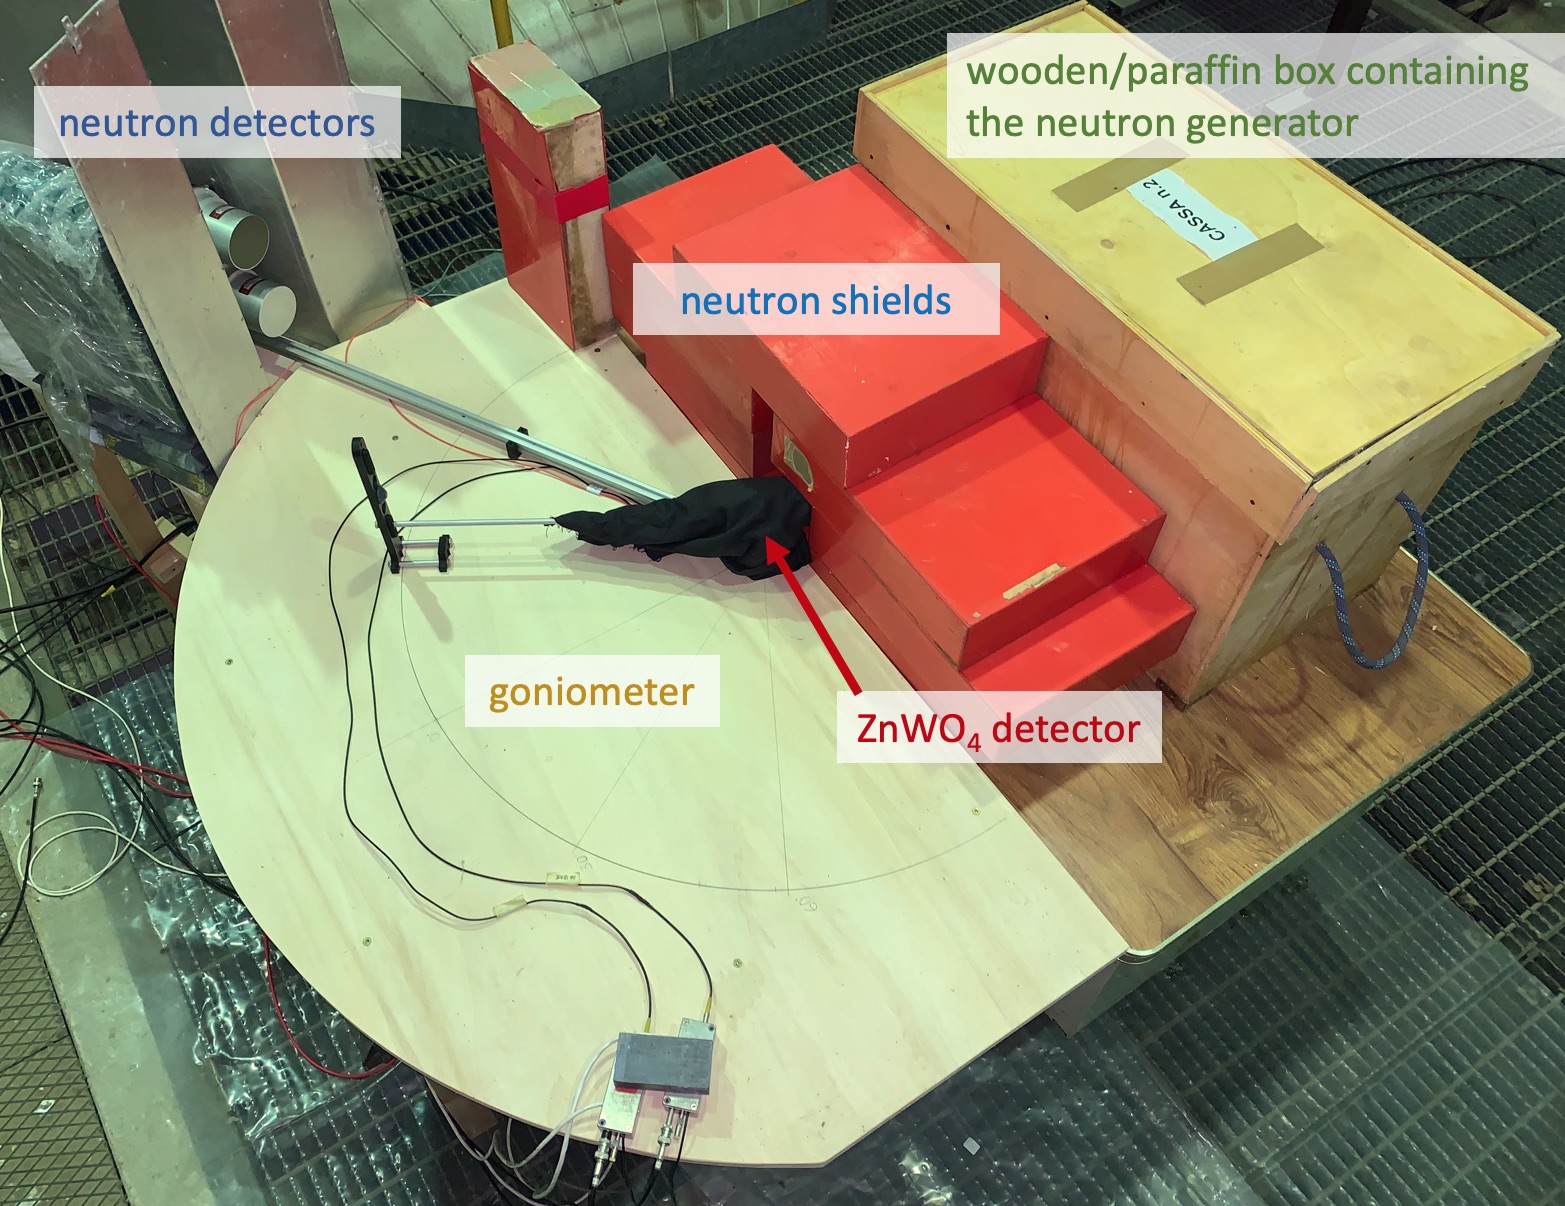
The ZnWO4 detector is placed in front of the neutron channel on a revolving platform around a vertical axis ( axis), which allows us to fix the direction of the crystal axis with respect to the impinging neutrons: the angle as depicted in Fig. 4. The ZnWO4 crystal is centered on the axis and is optically coupled to two HAMAMATSU H11934-200 PMTs on opposite faces. In the set-up, the PMTs are on the faces perpendicular to the crystal axis III; thus, identifies the angle between the crystal axis III and the impinging neutrons direction. The crystal axis I is also on the horizontal plane, while the axis II is vertical. The ZnWO4 crystal and the two PMTs are inside a black plastic box, as shown in the picture on Fig. 5.
The neutrons scattered off the ZnWO4 crystal are tagged by two neutron detectors by Scionix [33]; they have an active volume: 76 mm diameter 76 mm height, filled with EJ-309 liquid scintillator and a read-out by a 76 mm diameter ET 9821 PMT. The EJ-309 scintillator has a very high capability to discriminate neutrons interactions from the gamma background by Pulse Shape Discrimination (PSD).
The neutron detectors are placed 82 cm far from axis, one above the other (see Fig. 5), to maintain the same neutron scattering angle (see Fig. 4) and to improve the solid angle acceptance. The distance center-to-center is 13 cm and the center of the bottom (upper) EJ-309 detector is 13 (117) mm under (above) the horizontal plane crossing the center of the ZnWO4 detector. They are held by an arm, shown in Fig. 5, free to rotate around the axis. It is useful to define a third angle, , for each different recoiling nucleus: it is the angle between the nuclear recoil direction and the impinging neutron direction, obtained by the kinematics of the elastic scattering of neutrons off nuclei once the angle is fixed.
| Recoiling | ER | E | v | ||
|---|---|---|---|---|---|
| nucleus | (keV) | (MeV) | (m/s) | ||
| Zn | 216.7 | 59.6∘ | 13.835 | ||
| 60∘ | W | 77.5 | 59.9∘ | 13.975 | |
| O | 865.7 | 58.4∘ | 13.186 | ||
| Zn | 284.5 | 54.6∘ | 13.768 | ||
| 70∘ | W | 101.9 | 54.9∘ | 13.950 | |
| O | 1128.2 | 53.3∘ | 12.924 | ||
| Zn | 356.4 | 49.6∘ | 13.696 | ||
| 80∘ | W | 127.8 | 49.8∘ | 13.924 | |
| O | 1402.1 | 48.2∘ | 12.650 |
Some examples of the kinematic variables at different scattering angles and for the three nuclei of the ZnWO4 crystal are reported in Table 1. There is also reported the recoil energy, ER, the energy, E, and the velocity, v, of the scattered neutrons. The Time of Flight (), that is the time between the elastic scattering on the ZnWO4 crystal and the interaction on one of the two neutron EJ-309 detectors, 82 cm far away, is around 16 ns in all cases; the associated uncertainty has been evaluated by a Monte Carlo simulation as 0.5 ns (), mainly due to the geometrical shape of the neutron detectors. It is also worth noting that Table 1 also includes W and Zn recoiling nuclei, even if the experiment is not sensitive to them, as described in the following.
4.3 The electronic chain
The data acquisition is based on the use of a CAEN DT5720 transient digitizer with 250 MSamples/s, 12 bit, 4-channel. The signals from the two PMTs coupled to the ZnWO4 detector are summed; a sum signal is fed to the channel 0 of the digitizer.
The signals from the two EJ-309 neutron detectors are also summed and two copies are fed to the channels 1 and 2 of the digitizer. The first one is directly connected to the digitizer, the other one has a 2 ns delay; this permits to obtain interleaving sampling to increase the sampling frequency because of the fast decay time of the EJ-309 scintillator.
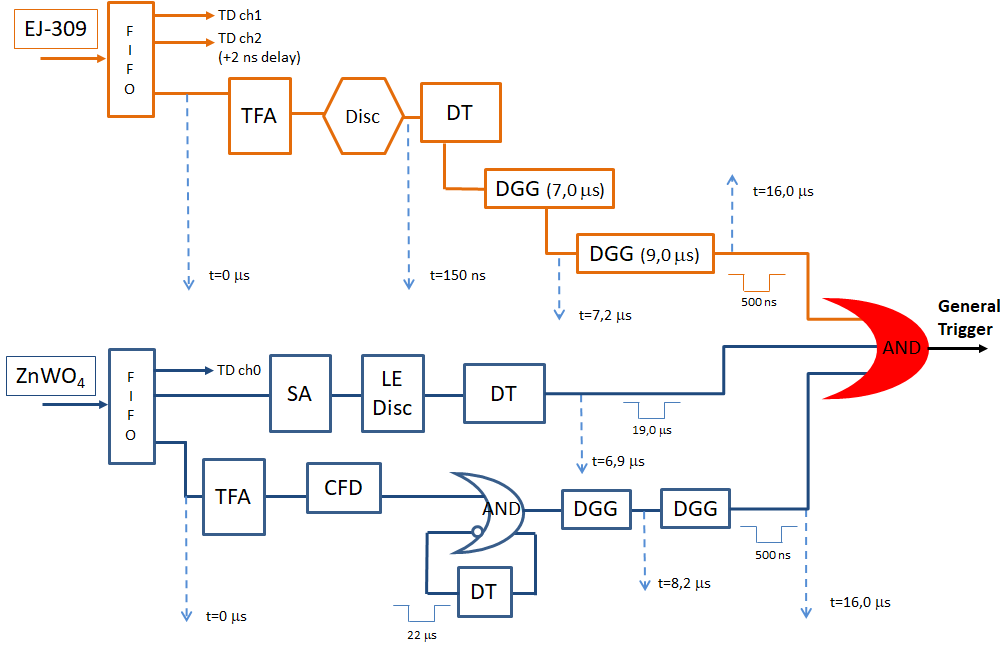
The trigger is obtained by the coincidence between a signal in the ZnWO4 detector and in the EJ-309 detectors within ns. The simplified electronic scheme is shown in Fig. 6. The upper part of the electronic scheme describes the trigger generation of the EJ-309 detectors, while the bottom part represents the trigger chain for the ZnWO4 detector. In particular, a copy of the ZnWO4 signal is shaped and amplified by a Spectroscopy Amplifier ORTEC 672, and discriminated to provide a energy-above-threshold logic signal. Another copy is amplified by a TFA ORTEC 474, which reduces the bandwidth, and discriminated for having a fast time trigger. The general trigger is issued about 16 s after the original pulses. This allows the recording of the tracks by the digitizer over a time window of 50 s, with 20 s of pre-trigger (this implies that the digitized tracks have at least the 4 s before the occurrence of the signal).
4.4 The data taking
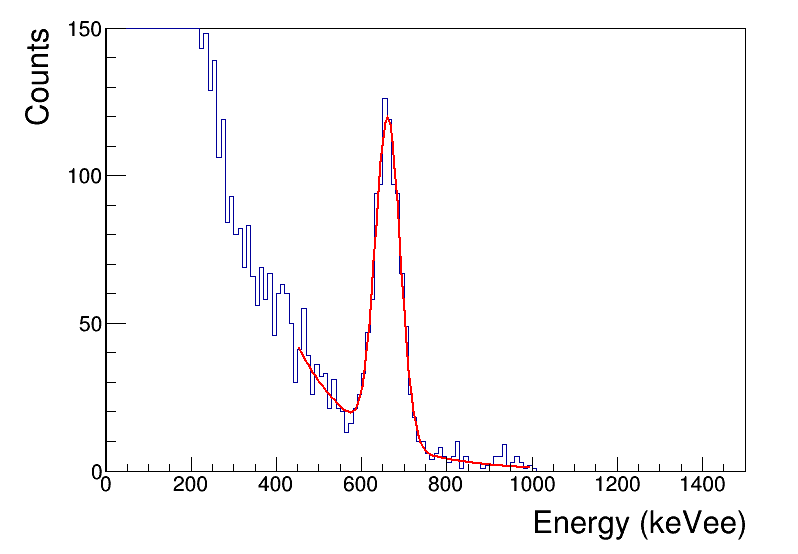
The energy detected in the ZnWO4 detector is reconstructed by calculating the digitized pulse area. The energy scale was calibrated with 133Ba and 137Cs sources. The typical energy resolution was at the 662 keV peak. The peak position was monitored before and after the data collection with neutrons; each data run lasts about two hours. To monitor the stability of the energy scale, the data have been grouped in several runs and the stability in time of the energy spectra has been verified. Moreover, the set-up was positioned inside a shelter where the temperature was maintained at reasonably constant level. However, the typical light output variation in ZnWO4 detectors is around C at room temperature (see Ref. [10] and references therein). Thus, even a C temperature variation implies 3% in the light yield of the crystal. Therefore, any drift during the data collection can be safely excluded. Fig. 7 shows a typical energy distribution of the ZnWO4 detector for ’s from 137Cs source.
Although the hardware energy threshold of the ZnWO4 detector is maintained as low as possible accordingly to the electronic noise, a software energy threshold of 30 keVee is applied to the off–line analysis of the neutron data in order to cut the large number of events due to inelastic processes, activation and background. Thus, the oxygen recoils can be properly observed, while the Zn and W recoils are expected to be at lower energies (between 7 keVee and 14 keVee for Zn recoils, and between 1.6 keVee and 2.5 keVee, for W recoils in the measurements here reported), considering the expected quenching factors using the extrapolation of Ref. [32], and the kinematical energies (see Table 1).
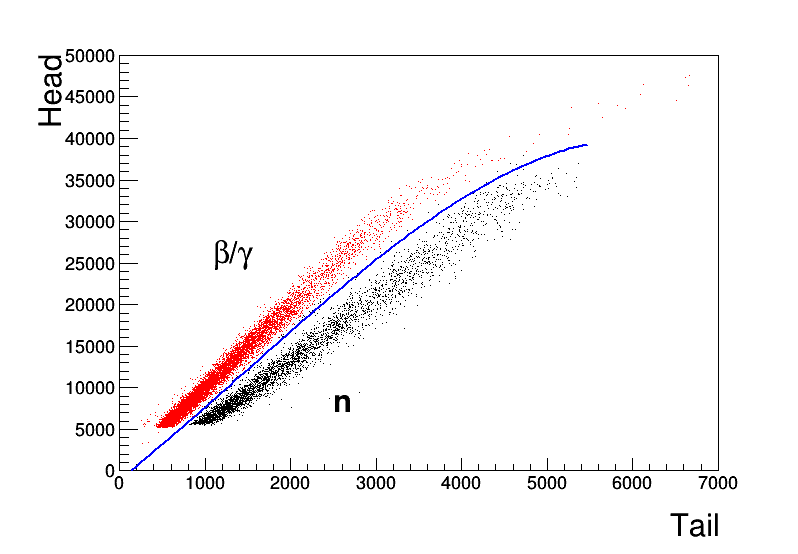
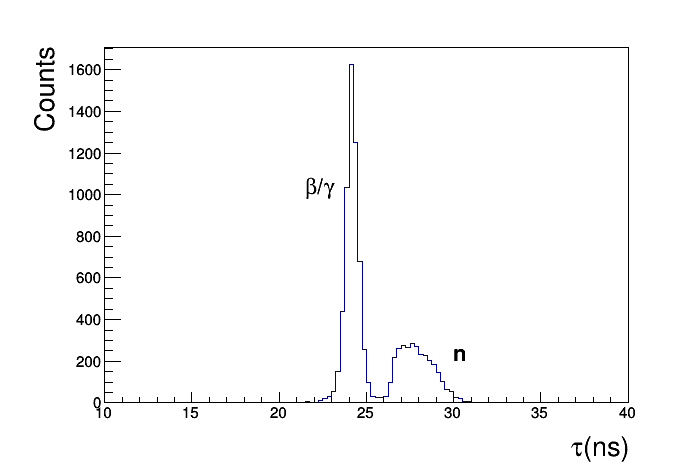
Concerning the neutron detectors EJ-309, two different techniques are used to extract the information on the PSD: i) head/tail analysis; ii) the analysis of the mean time, , of the time profile of the EJ-309 pulse. In particular, the head is defined as the area of the pulse between the starting time of the pulse, , up to ns; the tail is defined as the area between ns and ns. The variable is defined as:
where is the pulse height at the time beginning from the starting time of the signal; the sum is extended over the first 100 ns of the pulse. Typical examples of the separation between gamma and neutrons in both cases are reported in Fig. 8.
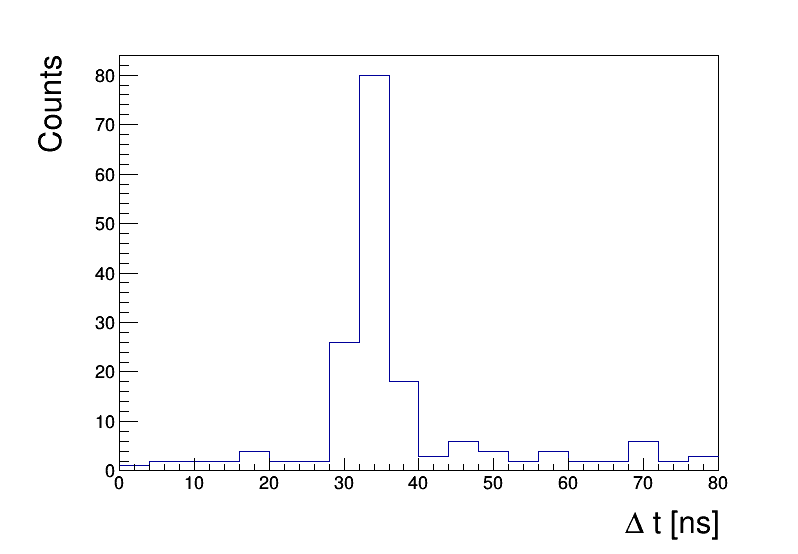
An important tool to select the events related to the searched effect (elastic scattering of neutrons in the ZnWO4 crystal) over the background is the study of the between the ZnWO4 detector and the neutron detectors EJ-309. For this purpose we define the variable , where () is the starting time of the EJ-309 (ZnWO4) pulse. Since the transit time of the used PMTs is different (in particular, it is ns for the ET 9821 [34] and ns for the HAMAMATSU H11934-200 [35]), the variable is shifted with respect to and must be properly calibrated. For this purpose we select coincidences between high energy events in the ZnWO4 detector and gamma events in the neutron detectors. These coincidences are mostly due to either interactions or Compton scatterings, from the neutron generator. The secondary gamma rays are observed in the neutron detectors; we select high energy events in ZnWO4 for having a clean sample of coincidences with a well-defined starting time of the ZnWO4 electronic pulse.
The corresponding distribution is reported in Fig. 9. A clear peak is present around ns (where it is expected); actually, this is consistent with ns, the time required for a quantum to travel from the ZnWO4 detector to the neutron detectors. This calibration of the is applied in the following analysis.
4.5 The measured quenching factors
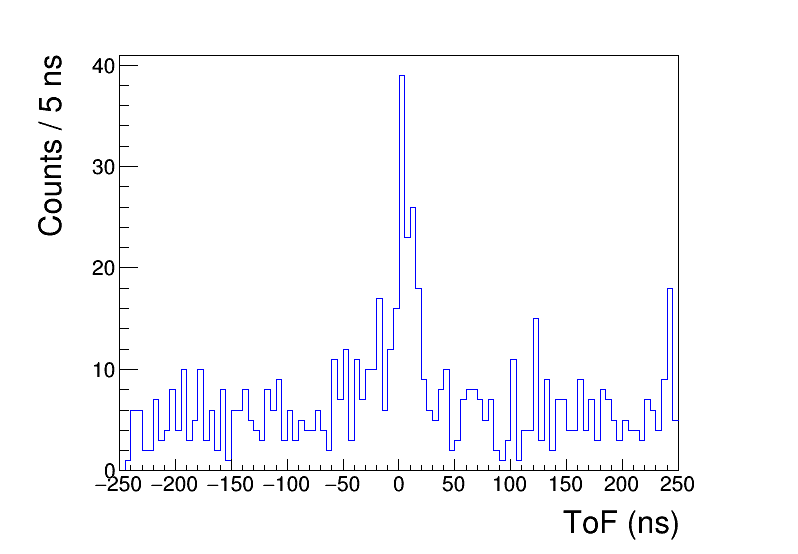
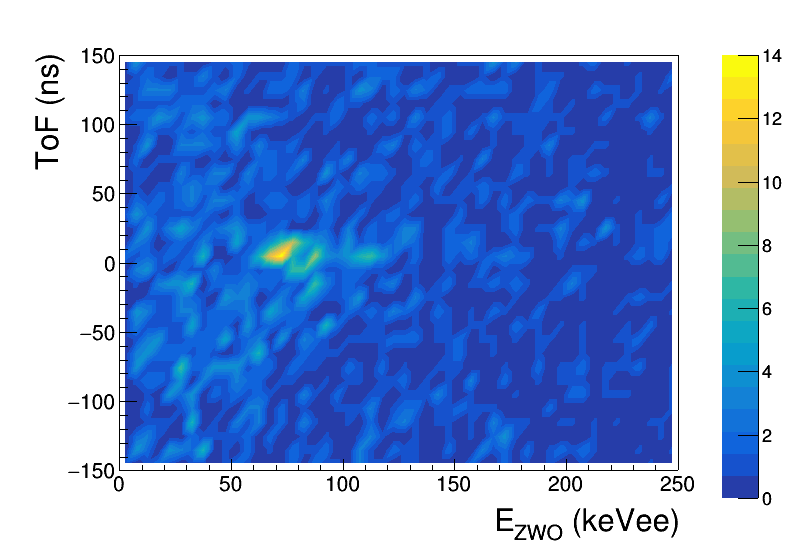
The data collected during the neutron irradiation at fixed scattering angle and crystal axis555The typical live time for each data set ranges from 11 to 25 h depending on the scattering angle and crystal axis. have been analysed by selecting coincidences between events in the ZnWO4 detector and neutrons in the neutron detectors. An example of the distribution and of the bi-dimensional plot vs ZnWO4 energy (, in keVee) is reported in Fig. 10 for the case of scattering angle and ZnWO4 crystal axis I. These plots show a continuum due to random coincidences and a clear peak which is well in agreement with the expected for neutrons after elastic scattering off ZnWO4 detector (see Table 1). The peak in the variable shows a tail on the left due to the first photoelectron delay in ZnWO4 (effective average scintillation decay time 24 s [11]). Thus, the mean value of the variable for neutrons after elastic scattering off ZnWO4 detector is systematically smaller than the values reported in Table 1 owing to the prompt response of the neutrons detectors and to the possible delay of the first photoelectron in the ZnWO4 scintillator. The peak in the variable is due to the oxygen recoils in the ZnWO4 detector and its position provides the quenching factor of oxygen in ZnWO4 for the used scattering angle and crystal axis.
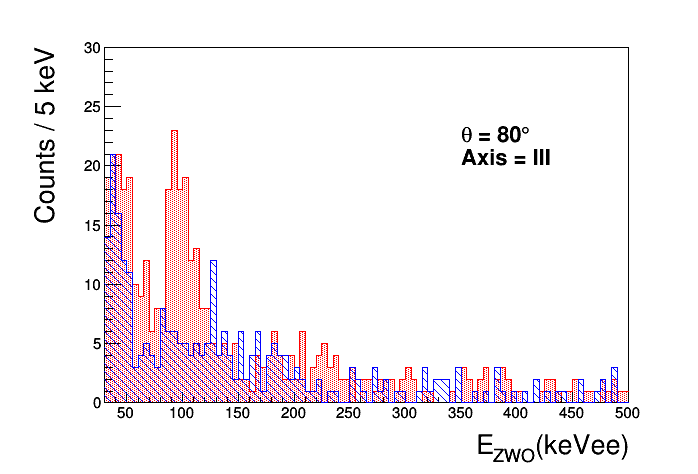
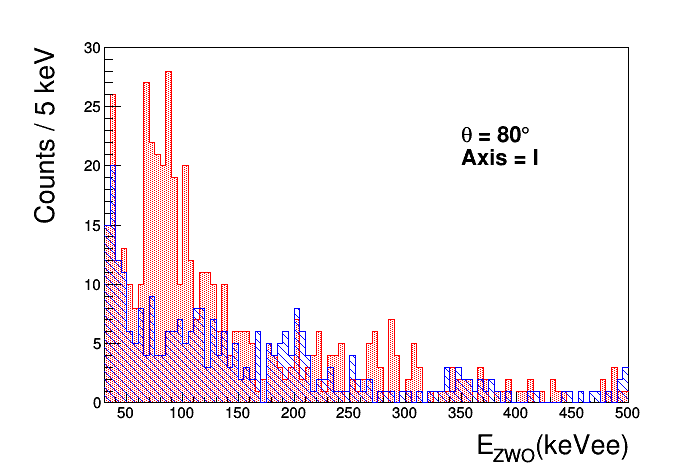
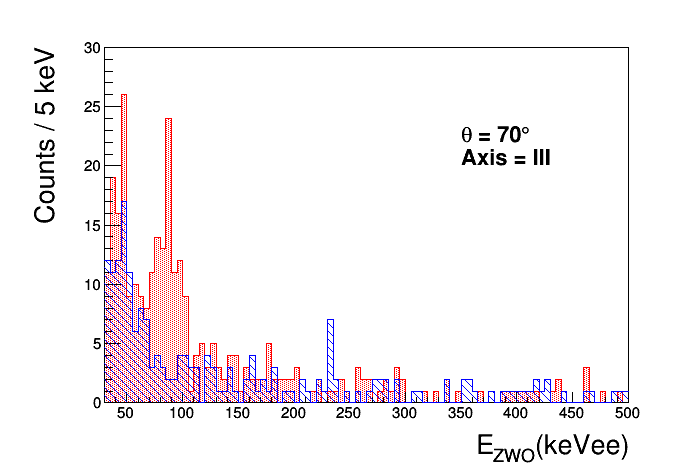
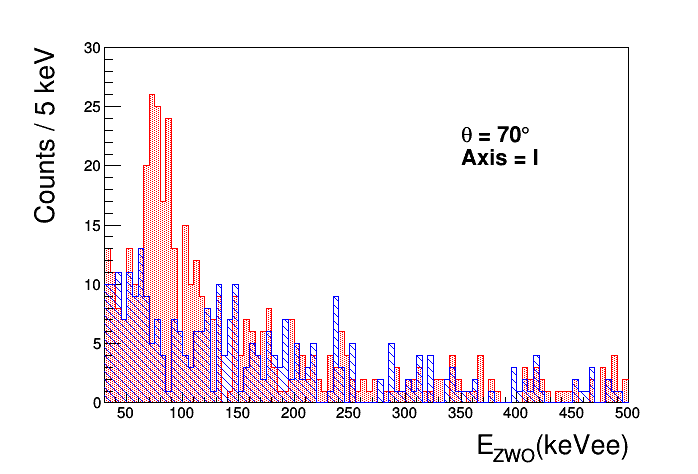
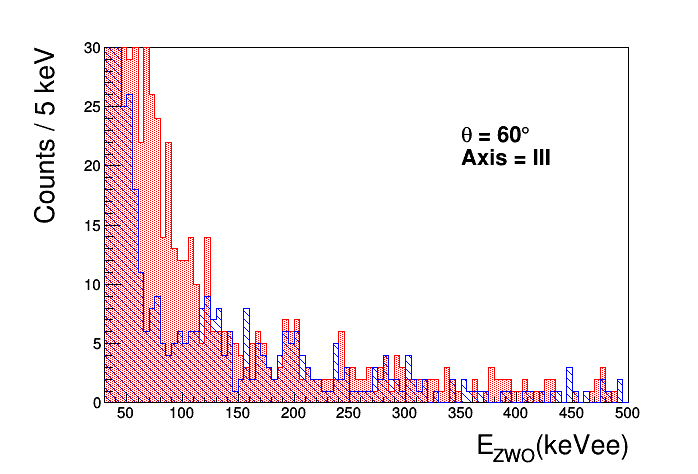
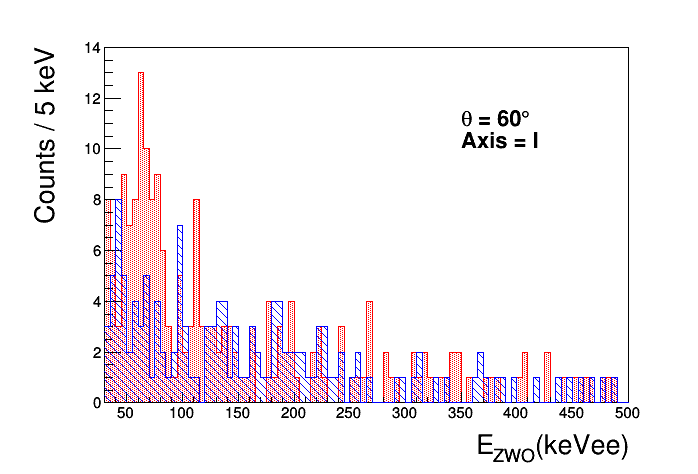
Three scattering angles were considered. Since the responses of the crystal axes I and II are rather similar, only the case of axis I was considered. Fig. 11 shows the energy distributions of the detected energy, , in the ZnWO4 detector, measured in keV electron equivalent, for the six configurations (3 scattering angles and axes III and I). Two distributions are reported for each plot: one is obtained by selecting events in the time window expected for the of neutrons elastically scattered off ZnWO4 detector, ns ns (light red histogram); the other is presented by selecting events in off-window (random coincidences), ns ns (blue histogram). The number of the selected events in the in-window (off-window) histograms in the six configurations runs from 211 to 792 (148 to 536).
The off-window events are related to random coincidences and, therefore, their distribution is the background distribution in the histogram of the in-window events. The peaks of oxygen nuclear recoils are rather evident. The positions of these peaks are obtained by fitting them by a gaussian curve plus an exponential, that simulates the background of the random coincidences. For the only case of for axis III, where such a method is less accurate, we adopt a slight different procedure: the spectrum obtained by subtracting the background of the off-window events has been fitted by a gaussian. The energy resolution, , of these peaks are between 8 and 12 keVee, values well in agreement with the hypothesis that the dependence of the energy resolution on the energy can be described by a root function .
The peak positions are reported in Table 2, where the expected recoil energies for the oxygen nucleus, , are also noted. The latter ones are verified by a Monte Carlo simulation including the kinematics of the process (see also Table 1); the intrinsic spread of the expected recoil energies are then evaluated to be of the order of 2-3 keVee, well below the energy resolution of the detector. The obtained quenching factors are calculated as the ratio and the last column of Table 2 reports the degree of anisotropy for each scattering-angle/recoil energy. Finally, we can define a “mean anisotropy” as the average of the three values. It is: , giving an evidence of anisotropy in the light response for oxygen nuclear recoils at 5.4 standard deviations confidence level.
| Scattering angle, | Crystal | Quenching | ||||
|---|---|---|---|---|---|---|
| axis | (keVee) | (keVee) | (keV) | factor, | ||
| 80∘ | III | 9 | 1402 | |||
| I | 12 | |||||
| 70∘ | III | 7 | 1128 | |||
| I | 10 | |||||
| 60∘ | III | 9 | 866 | |||
| I | 10 |
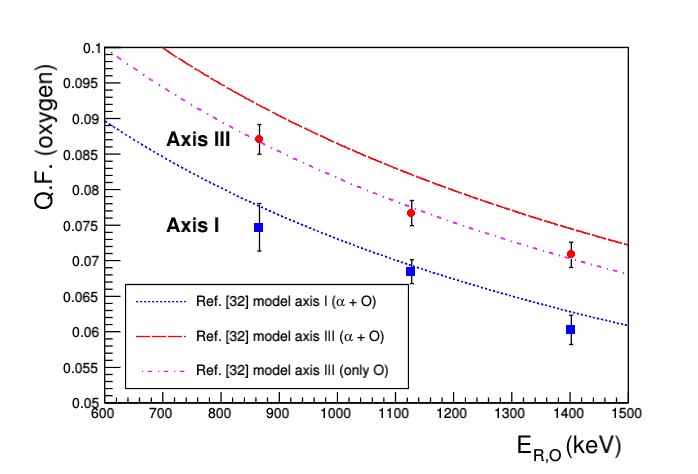
The obtained quenching factors are also depicted in Fig. 12. There are also shown the models for the considered crystal axes obtained as global fits on the data of this paper ( and oxygen recoil data, “O”) following the prescription of Ref. [32]. A single parameter has been used to fit the data of particles and oxygen recoils for each axis. They are mg MeV-1 cm-2 for axis I, mg MeV-1 cm-2 for axis II (only data are considered, “only ” in Fig. 3), and mg MeV-1 cm-2 for axis III, respectively.
The global fit for axis I shown in Figs. 3 and 12 is rather good; for axis III the trend is qualitatively well represented, anyhow a single value appears not sufficient to exactly reproduce both data sets: and oxygen recoils (“O”). Thus, only for axis III the fits have also been done separately, giving good agreements with the data. The obtained values are: mg MeV-1 cm-2 for data points (“only ” in Fig. 3); mg MeV-1 cm-2 for oxygen recoil data points (“only O” in Fig. 12).
For completeness, we also recall the results of Ref. [36], where the quenching factors for ions (including oxygen) in CdWO4 crystal scintillator were measured with the help of an accelerator. The CdWO4 quenching factors for the crystal plane (001) were given in Fig. 1 of Ref. [36]. The ZnWO4 and CdWO4 scintillators have rather similar properties, also including the presence of anisotropic properties.
5 Conclusions
The data presented here confirm the anisotropic response of the ZnWO4 crystal scintillator to particles in the MeV energy region. The anisotropy is significantly evident also for oxygen nuclear recoils in the energy region down to some hundreds keV at 5.4 confidence level. Moreover, the presence of a good anisotropic response also in lower energy region is supported by the trend of the measured quenching factors with lower energy, according to which, as shown in Fig. 12, the quenching factors of nuclear recoils improve going to lower energy.
6 Acknowledgement
It is a pleasure to thank Mr. A. Bussolotti and Mr. A. Mattei for their valuable technical support and Dr. M. Laubenstein for providing the silicon detector and for fruitful discussions. The group from the Institute for Nuclear Research was supported in part by the program of the National Academy of Sciences of Ukraine “Fundamental research on high-energy physics and nuclear physics (international cooperation)” (Grant No. 0118U005411). D.V.K. and O.G.P. were supported in part by the project “Investigations of rare nuclear processes” of the program of the National Academy of Sciences of Ukraine “Laboratory of young scientists” (Grant No. 0118U002328).
References
- [1] R. Bernabei el al., La Rivista del Nuovo Cimento 26 n.1, 1 (2003).
- [2] R. Bernabei et al., Eur. Phys. J. C 56, 333 (2008).
- [3] R. Bernabei et al., Eur. Phys. J. C 67, 39 (2010).
- [4] R. Bernabei et al., Eur. Phys. J. C 73, 2648 (2013).
- [5] R. Bernabei et al., Nucl. Phys. At. Energy 19, 307 (2018).
- [6] R. Bernabei et al., Nucl. Phys. At. Energy (2019) in press; arXiv:1907.06405
- [7] D.N. Spergel, Phys. Rev. D 37, 1353 (1988).
- [8] P. Belli et al., Nuovo Cimento C 15, 475 (1992).
- [9] R. Bernabei et al., Eur. Phys. J. C 28, 203 (2003).
- [10] F. Cappella et al., Eur. Phys. J. C 73, 2276 (2013).
- [11] F.A. Danevich et al., Nucl. Instrum. Methods A 544, 553 (2005).
- [12] P. Belli et al., Nucl. Instrum. Methods A 626-627, 31 (2011).
- [13] P. Belli et al., J. Phys. G 38, 115107 (2011).
- [14] A.S. Barabash et al., Nucl. Instrum. Methods A 833, 77 (2016).
- [15] P. Belli et al., Nucl. Instrum. Methods A 935, 89 (2019).
- [16] J.B. Birks, The Theory and Practice of Scintillation Counting (Pergamon, London, 1964).
- [17] P.H. Heckmann, Z. Phys. 157, 10 (1959).
- [18] P.H. Heckmann et al., Z. Phys. 162, 84 (1961).
- [19] W.F. Kienzle, A. Flammersfeld, Z. Phys. 165, 1 (1961).
- [20] K. Tsukada, S. Kikuchi, Nucl. Instrum. Methods 17, 286 (1962).
- [21] K. Tsukada et al., Nucl. Instrum. Methods 37, 69 (1965).
- [22] F.J. Kratochwill, Z. Phys. 234, 74 (1970).
- [23] F.D. Brooks, D.T. Jones, Nucl. Instrum. Methods 121, 69 (1974).
- [24] V. Caracciolo et al., J. Phys. Conf. Ser. 718, 042011 (2016).
- [25] R. Cerulli for DAMA/INR-Kyiv coll., talk at IPRD 2019, October 14-17 2019, Siena, Italy (http://people.roma2.infn.it/dama/pdf/ cerulli_IPRD2019.pdf).
- [26] A. Di Marco for DAMA/INR-Kyiv coll., talk at CYGNUS 2019 workshop on directional DM detection, July 10-12 2019, Rome, Italy (http://people.roma2.infn.it/dama/pdf/cygnus_2019.pdf).
- [27] V. Caracciolo for DAMA/INR-Kyiv coll., Particle Physics at the Silver Jubilee of Lomonosov Conferences, 464 (2019).
- [28] R. Bernabei et al., EPJ Web of Conferences 136, 05002 (2017).
- [29] V. Caracciolo for DAMA/INR-Kyiv coll., talk at CYGNUS-TPC kick-off meeting: a mini-workshop on directional Dark Matter searches and coherent neutrino scattering, LNF, April 7 2016, Italy.
- [30] R. Bernabei et al., AIP Conference Proceedings 1549, 189 (2013).
- [31] V.N. Shlegel et al., JINST 12, C08011 (2017).
- [32] V.I. Tretyak, Astropart. Phys. 33, 40 (2010).
- [33] Scionix high flash-point EJ-309 liquid scintillation detectors, https://scionix.nl/wp-content/uploads/2017/07/High-flashpoint-EJ-309-liquid-scintillation-detectors.pdf
- [34] Datasheet for ET Enterprises 9821, http://et-enterprises.com/images/ data_sheets/9821B.pdf
- [35] Datasheet for Hamamatsu H11934-200, https://www.hamamatsu.com/ resources/pdf/etd/R11265U_H11934_TPMH1336E.pdf
- [36] P.G. Bizzeti et al., Nucl. Instrum. Methods A 696, 144 (2012).