Sub-nanotesla magnetometry with a fibre-coupled diamond sensor
Abstract
Sensing small magnetic fields is relevant for many applications ranging from geology to medical diagnosis. We present a fiber-coupled diamond magnetometer with a sensitivity of (310 20) pT in the frequency range of 10-150 Hz. This is based on optically detected magnetic resonance of an ensemble of nitrogen vacancy centers in diamond at room temperature. Fiber coupling means the sensor can be conveniently brought within 2 mm of the object under study.
I Introduction
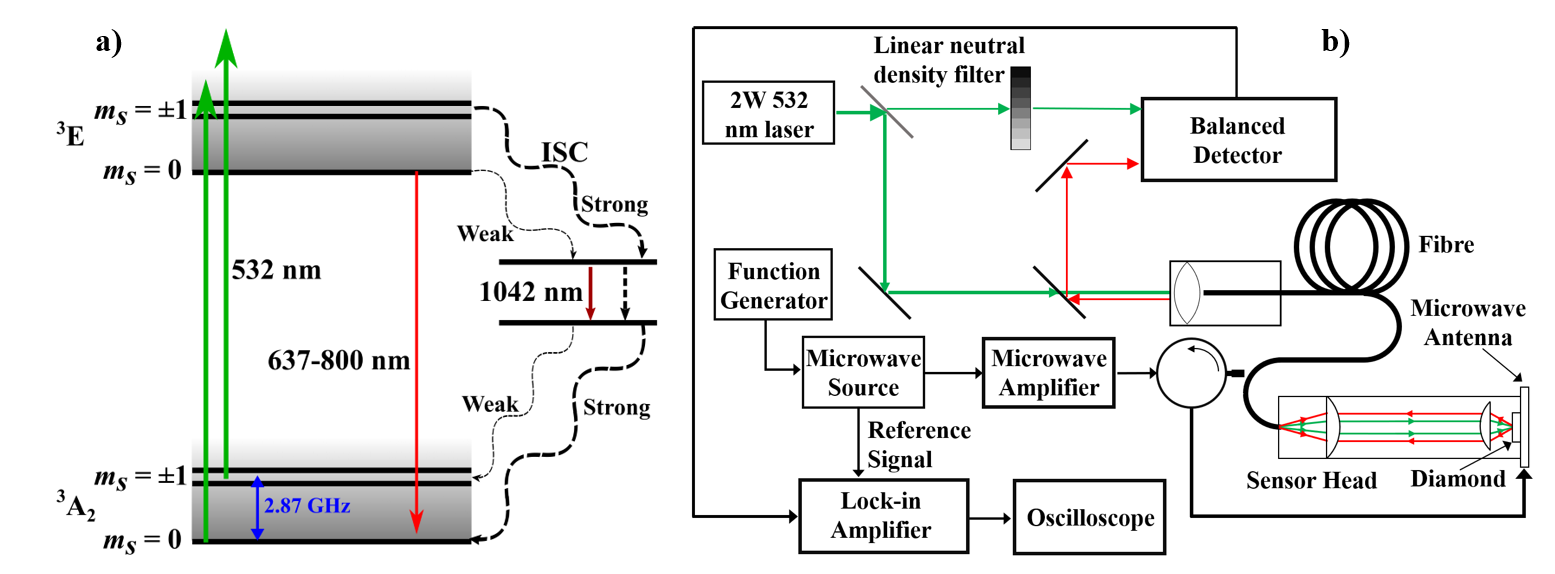
The sensing of magnetic fields using the nitrogen vacancy center (NVC) in diamond has seen rapid growth over the last decade due to the promise of high sensitivity magnetometry with exceptional spatial resolution Balasubramanian et al. (2008); Taylor et al. (2008) along with a high dynamic range Clevenson et al. (2018). The use of NVC ensembles rather than single centres improves sensitivity while degrading the spatial resolution Pham et al. (2011); Barry et al. (2016); Schloss et al. (2018); Le Sage et al. (2012); Levine et al. (2019); Barry et al. (2019); Eisenach et al. (2018); Bougas et al. (2018); Clevenson et al. (2015, 2018); Kim et al. (2019). Recent advancements have demonstrated ensemble sensitivities of 0.9 pT for d.c. fields Fescenko et al. (2019) and 0.9 pT for a.c fields Wolf et al. (2015). However, these results have been limited to systems that are bulky and are typically fixed to optical tables. In contrast, fibre-coupling provides a small sensor head that may be moved independently from the rest of the control instrumentation and thus offers the possibility of application in medical diagnostic techniques such as magnetocardiography (MCG) Dale and Morley (2017); Fenici et al. (2005). Most fiber-coupled diamond magnetometers have relied on using nanodiamonds/microdiamonds attached to the end of a fiber, achieving sensitivities in the range of 56000-180 nT Liu et al. (2013); Fedotov et al. (2014a); Duan et al. (2019). Utilising a two-wire microwave transmission line in addition to a fiber-diamond set-up was able to achieve a sensitivity of 300 nT Fedotov et al. (2014b). A fiber-based gradiometer approach was able to provide a sensitivity of 35 nT with projected shot-noise sensitivities potentially allowing for MCG Blakley et al. (2016, 2015a). Using a hollow-core fiber with many nanodiamond sensors in a fluidic environment provided a sensitivity of 63 nT per sensor and a spatial resolution of 17 cm Maayani et al. (2019). Other compact magnetometers that use a fiber have demonstrated sensitivities in the ranges of 67-1.5 nT dou Zheng et al. (2020); Webb et al. (2019); Dmitriev and Vershovskii (2016). The best sensitivity reported for a fibre-coupled diamond magnetometer so far is 35 nT when sensing a real test field Blakley et al. (2016), and 1.5 nT when estimating the sensitivity based on the signal-to-noise-to-linewidth using the slope of a resonance in the magnetic resonance spectrum Dmitriev and Vershovskii (2016). Other diamond magnetometers which offer high portability whilst maintaining a compact structure have been demonstrated with a compact LED-based design achieving a minimum detectable field of whilst offering minimal power consumption Stürner et al. (2019). Here, a diamond-based fiber-coupled magnetometer with sub-nT sensitivity is presented. The key feature is the use of lenses to reduce optical losses from the fiber to the diamond and back as shown in figure 1b).
The NVC, when in its negative charge state, is a spin defect that can be optically initialised into the ground state and possesses spin-dependent fluorescence giving rise to optically detected magnetic resonance (ODMR) Doherty et al. (2013). The energy level diagram is shown in figure 1a). The Zeeman-induced splitting of the NVC leads to the detection of magnetic fields with high sensitivity where the sensitivity of the magnetometer scales with , where is the number of centers probed Acosta et al. (2009); Rondin et al. (2014). The zero-field splitting at room temperature is 2.87 GHz. Upon application of an external magnetic field Zeeman-induced splitting leads to sub-levels that are split by
| (1) |
where is the NVC g-factor, is the Bohr magneton, is the projection of the external magnetic field onto the NVC symmetry axis (the crystallographic direction) and is Planck’s constant. The energy levels are further split by the hyperfine interaction between the electron spin and 14N nuclear spin () by MHz. Under a continuous wave excitation scheme, which is employed in this paper, the photon-shot-noise-limited sensitivity of a diamond-based magnetometer is given by
| (2) |
II Methods
Magnetometry is performed with the set-up shown in figure 1b). A Laser Quantum Gem-532 with a maximum power output of 2 W is used to excite the NVC ensemble; for our experiments 1 W was used to reduce laser noise. The laser beam is passed through a Thorlabs BSF10-A beam sampler whereby approximately 1% is picked off and supplied to the reference arm of a Thorlabs PDB450A balanced detector to cancel out laser intensity noise; the illumination levels incident upon each photodiode is equal in the absence of microwaves. The remaining (high-intensity) portion of the laser beam is focused into a custom-ordered 5 m 0.22 N.A. Thorlabs FG400AEA fiber with a core diameter of 400 and ceramic FC/PC termination. The fiber output is focused onto the diamond using a pair of aspheric lenses (Thorlabs) housed in a adjustable SM1 tube lens (Thorlabs SM1NR05). The first lens (C171TMD-B) collimates the fiber output whilst the second (C330TMD-B) focuses the beam onto the diamond. The same lenses are used to collect the emitted fluorescence from the NVC ensemble.
Microwave excitation is provided by an Agilent N5172B microwave source with a Mini-Circuits ZHL-16W-43-S+ microwave amplifier; hyperfine excitation is utilized to improve the contrast by mixing a 2.158 MHz sinewave Barry et al. (2016) from a RSPro arbitrary function generator AFG21005. The microwaves are then delivered to a 2-4 GHz coaxial circulator to reduce microwave reflection. The microwaves are square-wave frequency modulated El-Ella et al. (2017). The signal from the balanced detector is supplied to a Zurich MFLI DC - 500 kHz lock-in amplifier (LIA). The diamond is mounted on a 5 mm copper loop deposited onto an aluminium prototyping board (C.I.F AAT10) for microwave delivery and heat management. A permanent rare earth magnet is aligned to the (111) crystallographic orientation of the NVC ensemble, proving the spectrum shown in figure 2a). The optimum sensitivity was determined by varying the microwave power, the modulation amplitude and the frequency modulation to find the maximum value of the zero-crossing slope, as shown in figure 2. The microwave power was varied from -25 dBm to -8 dBm (pre-amplification value before the 43 dB amplifier, corresponding to 0.06 W and 3.16 W respectively after amplification with losses due to the cables neglected) in 1 dBm increments. The frequency modulation was investigated between 1 to 80 kHz and the frequency deviation was varied from 100 to 600 kHz. All ODMR spectra are taken with a frequency sweep range of 2.76 GHz to 2.94 GHz, a step resolution of 20 kHz, a step dwell time of 4 ms and a LIA frequency bandwidth of 200 Hz using a 48 dB/octave filter slope; the LIA output scaling was set to 500.
The microwave frequency is set then to the zero-crossing point and the fluorescence is monitored with the sensitivity determined by considering the mean and standard deviation of 160 one-second fast-Fourier transforms (FFT’s) using an oscilloscope. The sample employed in this work is a single crystal 99.995% 12C enriched sample of dimension 4 mm 4 mm 0.6 mm with a (100)-orientation, grown through chemical vapour deposition by Element Six. The concentration of negatively charged NVC, see appendix A, was measured to be [NV-] = 4.6 ppm.
III Results
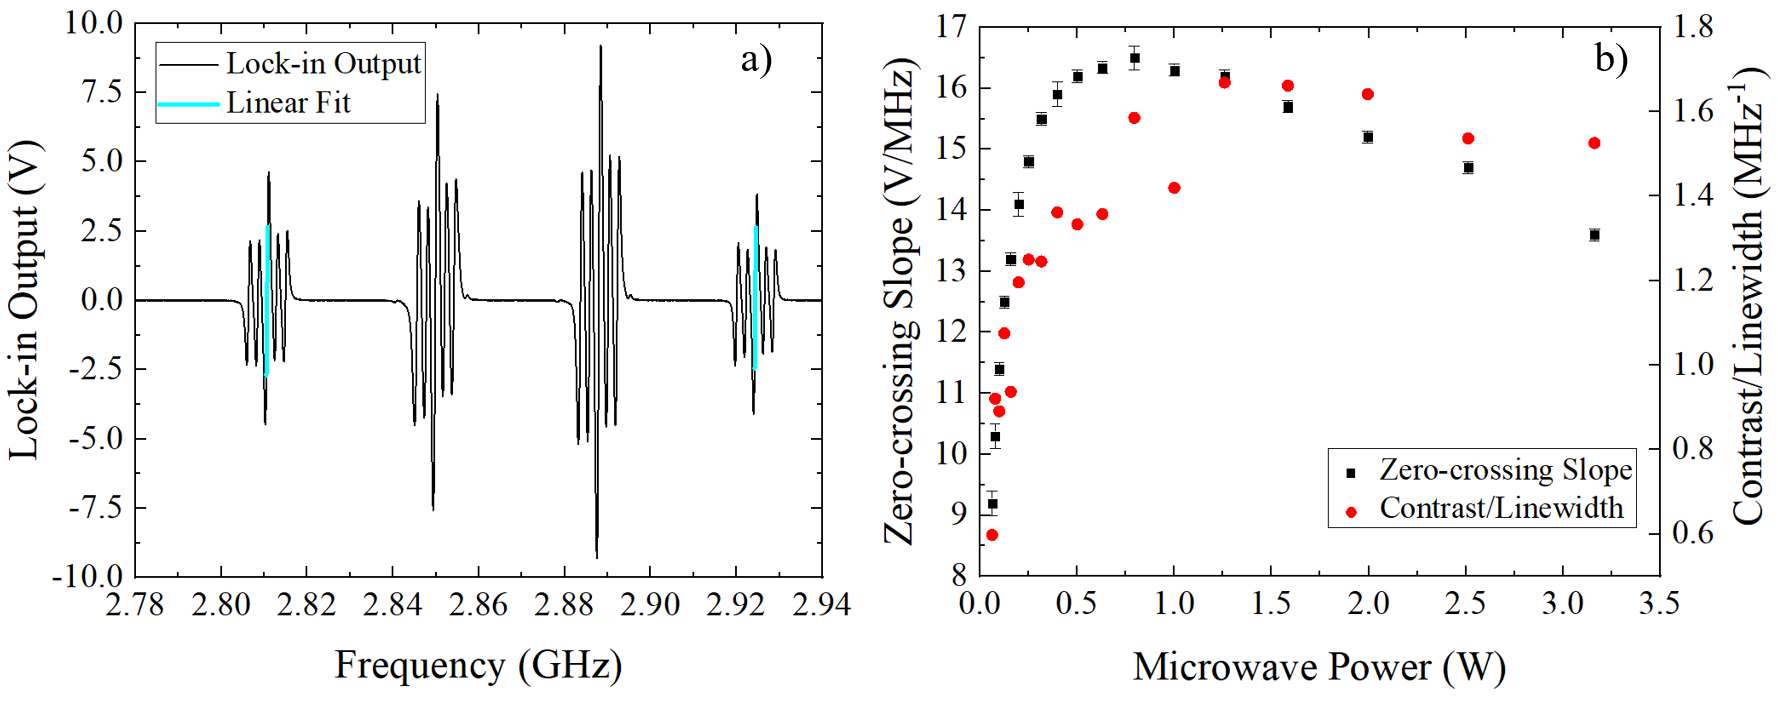
Two methods were used to determine the sensitivity. The first involved linear fits to the outermost NVC lock-in derivative spectrum resonances to determine the calibration constant, see figure 2a) whilst the second involved applying known test fields to determine the magnetometer response. The maximum value of the zero-crossing slope, see figure 2b), was found to occur at microwave power of 0.8 W, a frequency depth of 300 kHz and a modulation frequency of 1.0307 kHz. Equation 2 shows that the shot-noise limited sensitivity is improved by increasing the ratio of contrast/linewidth (), but there is a trade-off here as shown in figure 2b) because increasing the microwave power can increase both the contrast and the linewidth. The linewidth and contrast were extracted directly from ODMR spectra prior to lock-in amplification when exciting all three nitrogen-14 hyperfine resonances. The trends inferred from the () ratio in figure 2b) suggests further optimisation of the microwave parameters is possible to optimise the sensitivity. It was found that the zero-crossing slope increased with a decreasing modulation frequency (see appendix B), however, beyond 3.0307 kHz the noise floor of the FFT also increased and thus the best sensitivity was found to be 171 pT at a modulation frequency of 3.0307 kHz. This value improves upon the 1.5 nT obtained with a fiber-coupled diamond magnetometer with the same technique for sensitivity measurement.
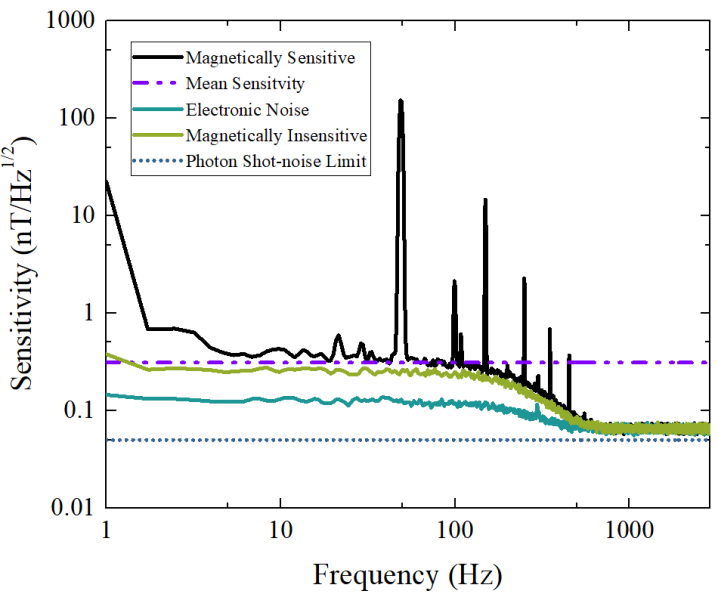
For the second method known test fields were applied using a Helmholtz coil which was calibrated using a Hirst Magnetics GM07 Hall probe. The test fields were applied along (100) and the sensitivity was found to be (310 20) pT, as shown in figure 3. The worse sensitivity is due to this non-optimal test field orientation. For the targeted application the fields of interest will be applied along the (100) direction and thus the sensitivity using the second method is considered to be the true sensitivity. Our sensitivity improves on the value of 35 nT previously obtained with a fiber coupled NVC magnetometer using applied test fields. The photon shot noise limit is calculated using equation 2 from the fluorescence which was measured to be 1.2 photons/s by directly measuring the incident power level on a power meter (Thorlabs PM100D equipped with a power meter head Thorlabs S121C). The linewidth of 1.11 MHz and contrast of 1.76 % were extracted directly from an ODMR spectrum prior to lock-in amplification when exciting all three nitrogen-14 hyperfine resonances. From this it is estimated that the photon shot noise limit is 50 pT.
IV Discussion
Our sensitivity is 310 pT and thus we are a factor of 6 away from the shot-noise limit. This may be due to uncancelled laser and microwave noise some of which could be cancelled out through the implementation of a gradiometer which would also alleviate ambient magnetic noise from the environment Blakley et al. (2015b); Acosta et al. (2010a). To detect signals for MCG it is estimated that the sensitivity required would need to be over an order of magnitude beyond what we currently achieve Clevenson et al. (2015); Watanabe and Yamada (2008).
The biggest limitation of our system is the collection efficiency in which significant improvements are expected as the conversion efficiency of green to red photons is calculated to be 0.03%. Improving this would also improve the excitation efficiency. Due to the high refractive index of diamond nd = 2.42, the majority of light emitted by the defects will undergo total internal reflection and thus the majority of emitted light will escape through the sides of the diamond Le Sage et al. (2012). A possible option for improvement would be an adaptation of the fluorescence waveguide excitation and collection Zhang et al. (2018) which reported a 96-fold improvement in the light collected. Another approach would be to surrounded the diamond with a total internal reflection lens to collect light from the diamond sides and focus it toward a small area Xu et al. (2019), which would be easier to integrate with our system, leading to an enhancement of 56 in the photon collection when compared to a lossless air objective of 0.55 N.A. This would represent a photon enhancement of 30 for our system and assuming a shot-noise limited scaling the measured sensitivity would become 60 pT.
Ferrite flux concentrators have demonstrated a 254 improvement in the sensitivity for a diamond magnetometer Fescenko et al. (2019) at a cost of degrading the spatial resolution due to concentrating the flux from a large area and directing it toward a diamond. Due to the constraints of our system integrating the design discussed in Fescenko et al. (2019) is not straightforward and thus the enhancement to sensitivity will be smaller. A further improvement would be to use the dual-resonance technique Fescenko et al. (2019) which would allow our system to be invariant to temperature fluctuations Acosta et al. (2010b) which is essential for practical applications of our magnetometer. Another way to introduce temperature invariance into our system would be the use of double-quantum magnetometry Fang et al. (2013); Mamin et al. (2014). This would also be compatible with the use of pulsed schemes such as Ramsey magnetometry which would offer significant improvements to the sensitivity of a magnetometer compared to continuous wave excitation schemes Barry et al. (2016, 2019). However, it should be noted that significantly more laser excitation power and more homogeneous microwave driving fields will be required to realize the potential benefits of Ramsey magnetometry Ahmadi et al. (2017); Jensen et al. (2014); Bauch et al. (2018).
V Conclusion
In this work a fiber-coupled magnetometer that reaches a sensitivity of (310 20) pT over the frequency range of 10-150 Hz has been presented. The mobility of the system and the compact nature of the sensor head are designed to target the application of magnetocardiography with further improvements discussed to be able to reach higher sensitivities.
Acknowledgements.
The authors would like to thank Mareike Herrmann and Luke Johnson for materials processing, Jeanette Chattaway and Lance Fawcett of the Warwick Physics mechanical workshop, and Robert Day and David Greenshields of the Warwick Physics electronics workshop. We are grateful for insightful discussions with Matthew Turner, Danielle Braje, John Barry, Jennifer Schloss, Ronald Walsworth, Olga Young and Junichi Isoya. R. L. P. and G. A. S.’s PhD studentships are cofunded by the EPSRC Centre for Doctoral Training in Diamond Science and Technology (Grant No. EP/L015315/1). G. A. S.’s PhD studentship is additionally supported by Bruker. This work was supported by the EPSRC Quantum Technology Hub NQIT (Networked Quantum Information Technologies - Grant No. EP/M013243/1), QCS (Quantum Computing and Simulation - Grant No. EP/T001062/1) and funding from NICOP (Grant No. N62909-16-1-2111-P00002 - Towards a Picotesla DC Diamond Magnetometer). E. C. N and W. T. were supported by the Warwick University URSS (Undergraduate Research Support Scheme). B. L. G is supported by the Royal Academy of Engineering. G. W. M. is supported by the Royal Society.Appendix A Diamond Characterisation
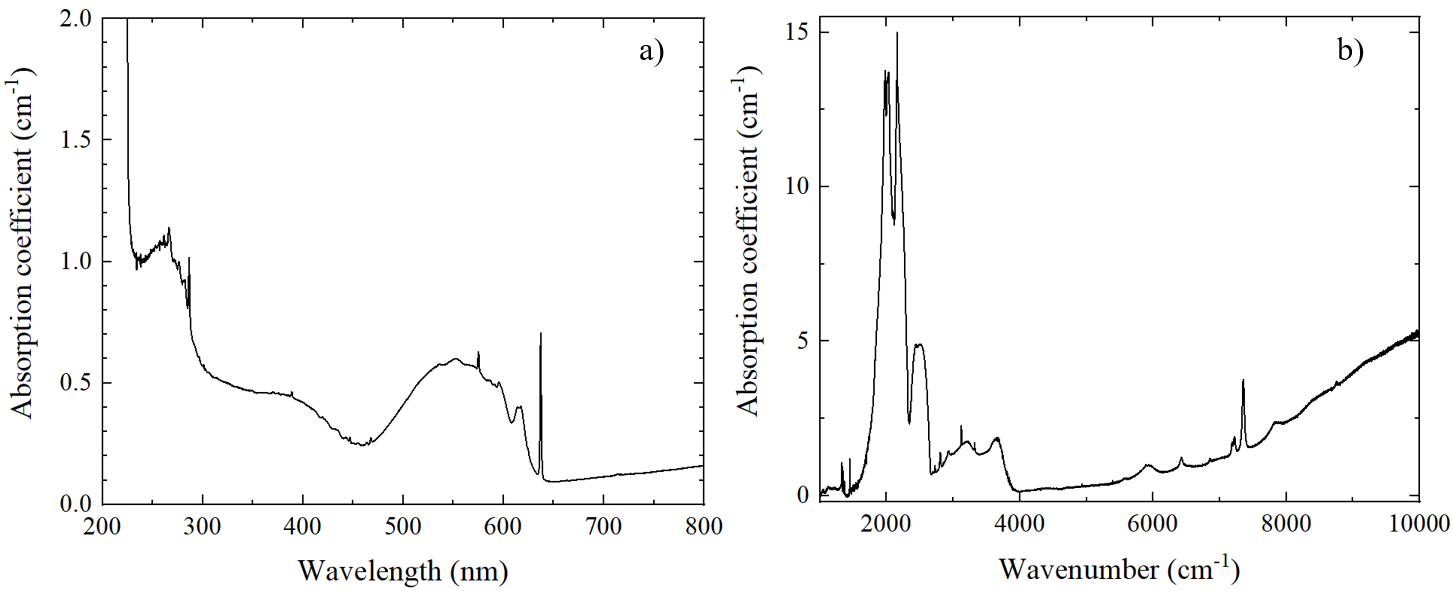
The defect concentration within the diamond was determined through Fourier-transform infrared spectroscopy (FTIR) and ultraviolet–visible spectroscopy (UV-Vis). US-Vis data, figure 4a) were taken at 80 K on a Perkin Elmer Lambda 1050 Spectrometer equipped with an Oxford Instrument Optistat cryostat. The concentration was determined to be 4.6 ppm for negatively charged NVC and 0.8 ppm for neutral NVC and was found from the intensities of the 637 nm and 575 nm zero-phonon line respectively Dale (2015). FTIR data, figure 4b) were taken at room temperature using a Perkin Elmer Spectrum GX FT-IR spectrometer. The concentrations from FTIR were established to be 5.6 ppm for neutral substitutional nitrogen (N) and 3 ppm for positively charged substitutional nitrogen (N) Lawson et al. (1998); Liggins (2010).
Appendix B Zero-crossing Slope vs. Modulation frequency
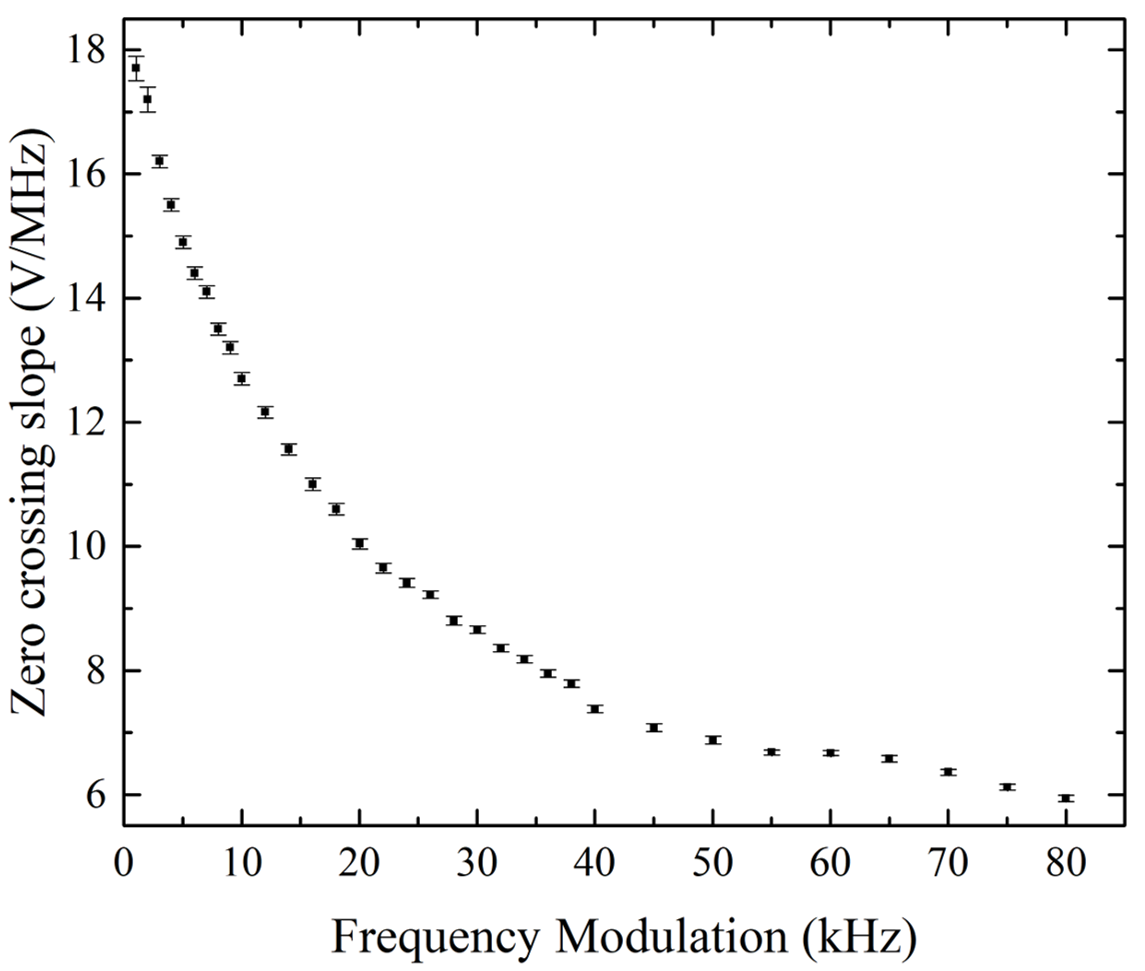
The variation of the zero-crossing slope as a function of the modulation frequency is shown in figure 5. The expected trend of a decrease in the zero-crossing slope for higher modulation frequencies due to the finite repolarisation time of the NVC centre is followed Barry et al. (2016); El-Ella et al. (2017); Schoenfeld and Harneit (2011). Despite the continued increase of the zero-crossing slope at progressively lower modulation frequencies, the best sensitivity was achieved at a modulation frequency of 3.0307 kHz (data not shown), we attribute this to an increased susceptibility to noise at particularly low modulation frequencies nearer to DC. The maximum value of the zero-crossing slope at a modulation of 3.0307 kHz was 17.9 V/MHz which was slightly higher than the maximum in figure 2b) due to improved photon collection rate.
References
- Balasubramanian et al. (2008) G. Balasubramanian, I. Y. Chan, R. Kolesov, M. Al-Hmoud, J. Tisler, C. Shin, C. Kim, A. Wojcik, P. R. Hemmer, A. Krueger, T. Hanke, A. Leitenstorfer, R. Bratschitsch, F. Jelezko, and J. Wrachtrup, Nature 455, 648 (2008).
- Taylor et al. (2008) J. M. Taylor, P. Cappellaro, L. Childress, L. Jiang, D. Budker, P. R. Hemmer, A. Yacoby, R. Walsworth, and M. D. Lukin, Nature Physics 4, 810 (2008).
- Clevenson et al. (2018) H. Clevenson, L. M. Pham, C. Teale, K. Johnson, D. Englund, and D. Braje, Applied Physics Letters 112, 252406 (2018).
- Pham et al. (2011) L. M. Pham, D. L. Sage, P. L. Stanwix, T. K. Yeung, D. Glenn, A. Trifonov, P. Cappellaro, P. R. Hemmer, M. D. Lukin, H. Park, A. Yacoby, and R. L. Walsworth, New Journal of Physics 13, 045021 (2011).
- Barry et al. (2016) J. F. Barry, M. J. Turner, J. M. Schloss, D. R. Glenn, Y. Song, M. D. Lukin, H. Park, and R. L. Walsworth, Proceedings of the National Academy of Sciences 113, 14133 (2016).
- Schloss et al. (2018) J. M. Schloss, J. F. Barry, M. J. Turner, and R. L. Walsworth, Physical Review Applied 10, 034044 (2018).
- Le Sage et al. (2012) D. Le Sage, L. M. Pham, N. Bar-Gill, C. Belthangady, M. D. Lukin, A. Yacoby, and R. L. Walsworth, Physical Review B 85, 121202 (2012).
- Levine et al. (2019) E. V. Levine, M. J. Turner, P. Kehayias, C. A. Hart, N. Langellier, R. Trubko, D. R. Glenn, R. R. Fu, and R. L. Walsworth, Nanophotonics 8, 1945 (2019).
- Barry et al. (2019) J. F. Barry, J. M. Schloss, E. Bauch, M. J. Turner, C. A. Hart, L. M. Pham, and R. L. Walsworth, (2019), arXiv:1903.08176 .
- Eisenach et al. (2018) E. Eisenach, J. Barry, R. Rojas, L. M. Pham, D. R. Englund, and D. Braje, Review of Scientific Instruments 89, 094705 (2018).
- Bougas et al. (2018) L. Bougas, A. Wilzewski, Y. Dumeige, D. Antypas, T. Wu, A. Wickenbrock, E. Bourgeois, M. Nesladek, H. Clevenson, D. Braje, D. Englund, and D. Budker, Micromachines 9, 276 (2018).
- Clevenson et al. (2015) H. Clevenson, M. E. Trusheim, C. Teale, T. Schröder, D. Braje, and D. Englund, Nature Physics 11, 393 (2015).
- Kim et al. (2019) D. Kim, M. I. Ibrahim, C. Foy, M. E. Trusheim, R. Han, and D. R. Englund, Nat. Electron. 2, 284 (2019).
- Fescenko et al. (2019) I. Fescenko, A. Jarmola, I. Savukov, P. Kehayias, J. Smits, J. Damron, N. Ristoff, N. Mosavian, and V. M. Acosta, (2019), arXiv:1911.05070 .
- Wolf et al. (2015) T. Wolf, P. Neumann, K. Nakamura, H. Sumiya, T. Ohshima, J. Isoya, and J. Wrachtrup, Physical Review X 5, 041001 (2015).
- Dale and Morley (2017) M. W. Dale and G. W. Morley, “Medical applications of diamond magnetometry: commercial viability,” (2017), arXiv:1705.01994 .
- Fenici et al. (2005) R. Fenici, D. Brisinda, and A. M. Meloni, Expert Review of Molecular Diagnostics 5, 291 (2005).
- Liu et al. (2013) X. Liu, J. Cui, F. Sun, X. Song, F. Feng, J. Wang, W. Zhu, L. Lou, and G. Wang, Applied Physics Letters 103, 143105 (2013).
- Fedotov et al. (2014a) I. V. Fedotov, L. V. Doronina-Amitonova, D. A. Sidorov-Biryukov, N. A. Safronov, A. O. Levchenko, S. A. Zibrov, S. M. Blakley, H. Perez, A. V. Akimov, A. B. Fedotov, P. Hemmer, K. Sakoda, V. L. Velichansky, M. O. Scully, and A. M. Zheltikov, Optics Letters 39, 6755 (2014a).
- Duan et al. (2019) D. Duan, G. X. Du, V. K. Kavatamane, S. Arumugam, Y.-K. Tzeng, H.-C. Chang, and G. Balasubramanian, Optics Express 27, 6734 (2019).
- Fedotov et al. (2014b) I. V. Fedotov, L. V. Doronina-Amitonova, D. A. Sidorov-Biryukov, N. A. Safronov, S. Blakley, A. O. Levchenko, S. A. Zibrov, A. B. Fedotov, S. Y. Kilin, and M. O. Scully, Optics Letters 39, 6954 (2014b).
- Blakley et al. (2016) S. M. Blakley, I. V. Fedotov, L. V. Amitonova, E. E. Serebryannikov, H. Perez, S. Y. A. Kilin, and A. M. Zheltikov, Optics Letters 41, 2057 (2016).
- Blakley et al. (2015a) S. M. Blakley, I. V. Fedotov, S. Y. Kilin, and A. M. Zheltikov, Optics Letters 40, 3727 (2015a).
- Maayani et al. (2019) S. Maayani, C. Foy, D. Englund, and Y. Fink, Laser & Photonics Reviews 13, 1900075 (2019).
- dou Zheng et al. (2020) D. dou Zheng, Z. M. Ma, W. Guo, L. Niu, J. Wang, X. Chai, Y. Li, S. Yasuhiro, C. Yu, Y. Shi, X. Zhang, J. Tang, H. Guo, and J. Liu, Journal of Physics D: Applied Physics (2020), doi:10.1088/1361-6463/ab6af2.
- Webb et al. (2019) J. L. Webb, J. D. Clement, L. Troise, S. Ahmadi, G. J. Johansen, A. Huck, and U. L. Andersen, Applied Physics Letters 114, 231103 (2019).
- Dmitriev and Vershovskii (2016) A. K. Dmitriev and A. K. Vershovskii, Journal of the Optical Society of America B 33, B1 (2016).
- Stürner et al. (2019) F. M. Stürner, A. Brenneis, J. Kassel, U. Wostradowski, R. Rölver, T. Fuchs, K. Nakamura, H. Sumiya, S. Onoda, J. Isoya, and F. Jelezko, Diamond and Related Materials 93, 59 (2019).
- Doherty et al. (2013) M. W. Doherty, N. B. Manson, P. Delaney, F. Jelezko, J. Wrachtrup, and L. C. L. Hollenberg, Physics Reports 528, 1 (2013).
- Acosta et al. (2009) V. M. Acosta, E. Bauch, M. P. Ledbetter, C. Santori, K.-M. C. Fu, P. E. Barclay, R. G. Beausoleil, H. Linget, J. F. Roch, F. Treussart, S. Chemerisov, W. Gawlik, and D. Budker, Physical Review B 80, 115202 (2009).
- Rondin et al. (2014) L. Rondin, J.-P. Tetienne, T. Hingant, J.-F. Roch, P. Maletinsky, and V. Jacques, Reports on Progress in Physics 77, 056503 (2014).
- Dréau et al. (2011) A. Dréau, M. Lesik, L. Rondin, P. Spinicelli, O. Arcizet, J. F. Roch, and V. Jacques, Physical Review B 84, 195204 (2011).
- El-Ella et al. (2017) H. A. R. El-Ella, S. Ahmadi, A. M. Wojciechowski, A. Huck, and U. L. Anderson, Optics Express 25, 14809 (2017).
- Blakley et al. (2015b) S. M. Blakley, I. V. Fedotov, S. Y. Kilin, and A. M. Zheltikov, Optics letters 40, 3727 (2015b).
- Acosta et al. (2010a) V. M. Acosta, E. Bauch, A. Jarmola, L. J. Zipp, M. P. Ledbetter, and D. Budker, Applied Physics Letters 97, 174104 (2010a).
- Watanabe and Yamada (2008) S. Watanabe and S. Yamada, Journal of Arrhythmia 24, 4 (2008).
- Zhang et al. (2018) S. Zhang, Z. Ma, L. Qin, Y. Fu, Y. Shi, J. Liu, and Y. J. Li, Applied Physics Express 11, 013007 (2018).
- Xu et al. (2019) L. Xu, H. Yuan, N. Zhang, J. Zhang, G. Bian, P. Fan, M. Li, C. Zhang, Y. Zhai, and J. Fang, Optics Express 27, 10787 (2019).
- Acosta et al. (2010b) V. M. Acosta, E. Bauch, M. P. Ledbetter, A. Waxman, L.-S. Bouchard, and D. Budker, Phys. Rev. Lett. 104, 070801 (2010b).
- Fang et al. (2013) K. Fang, V. M. Acosta, C. Santori, Z. Huang, K. M. Itoh, H. Watanabe, S. Shikata, and R. G. Beausoleil, Physical Review Letters 110, 130802 (2013).
- Mamin et al. (2014) H. J. Mamin, M. H. Sherwood, M. Kim, C. T. Rettner, K. Ohno, D. D. Awschalom, and D. Rugar, Physical Review Letters 113, 1 (2014).
- Ahmadi et al. (2017) S. Ahmadi, H. A. El-Ella, J. O. Hansen, A. Huck, and U. L. Andersen, Physical Review Applied 8, 034001 (2017).
- Jensen et al. (2014) K. Jensen, N. Leefer, A. Jarmola, Y. Dumeige, V. M. Acosta, P. Kehayias, B. Patton, and D. Budker, Physical Review Letters 112 (2014).
- Bauch et al. (2018) E. Bauch, C. A. Hart, J. M. Schloss, M. J. Turner, J. F. Barry, P. Kehayias, S. Singh, and R. L. Walsworth, Physical Review X 8, 31025 (2018).
- Dale (2015) M. W. Dale, Colour centres on demand in diamond, Ph.D. thesis, University of Warwick (2015).
- Lawson et al. (1998) S. C. Lawson, D. Fisher, D. C. Hunt, and M. E. Newton, Journal of Physics: Condensed Matter 10, 6171 (1998).
- Liggins (2010) S. Liggins, Identification of point defects in treated single crystal diamond, Ph.D. thesis, University of Warwick (2010).
- Schoenfeld and Harneit (2011) R. S. Schoenfeld and W. Harneit, Phys. Rev. Lett. 106, 030802 (2011).