The physics of sediment transport initiation, cessation, and entrainment across aeolian and fluvial environments
Abstract
Predicting the morphodynamics of sedimentary landscapes due to fluvial and aeolian flows requires answering the following questions: Is the flow strong enough to initiate sediment transport, is the flow strong enough to sustain sediment transport once initiated, and how much sediment is transported by the flow in the saturated state (i.e., what is the transport capacity)? In the geomorphological and related literature, the widespread consensus has been that the initiation, cessation, and capacity of fluvial transport, and the initiation of aeolian transport, are controlled by fluid entrainment of bed sediment caused by flow forces overcoming local resisting forces, whereas aeolian transport cessation and capacity are controlled by impact entrainment caused by the impacts of transported particles with the bed. Here the physics of sediment transport initiation, cessation, and capacity is reviewed with emphasis on recent consensus-challenging developments in sediment transport experiments, two-phase flow modeling, and the incorporation of granular physics’ concepts. Highlighted are the similarities between dense granular flows and sediment transport, such as a superslow granular motion known as creeping (which occurs for arbitrarily weak driving flows) and system-spanning force networks that resist bed sediment entrainment; the roles of the magnitude and duration of turbulent fluctuation events in fluid entrainment; the traditionally overlooked role of particle-bed impacts in triggering entrainment events in fluvial transport; and the common physical underpinning of transport thresholds across aeolian and fluvial environments. This sheds a new light on the well-known Shields diagram, where measurements of fluid entrainment thresholds could actually correspond to entrainment-independent cessation thresholds.
Reviews of Geophysics
Institute of Port, Coastal and Offshore Engineering, Ocean College, Zhejiang University, 866 Yu Hang Tang Road, 310058 Hangzhou, China State Key Laboratory of Satellite Ocean Environment Dynamics, Second Institute of Oceanography, 36 North Baochu Road, 310012 Hangzhou, China Naval Postgraduate School, Department of Physics, Monterey, CA, 93943 USA Infrastructure and Environment Research Division, School of Engineering, University of Glasgow, Glasgow, UK Department of Ocean Engineering, Texas A&M University, College Station, Texas 77843-3136, USA
Thomas Pähtz0012136@zju.edu.cn
The physics of sediment transport initiation, cessation, and entrainment across aeolian and fluvial environments is reviewed
The focus lies on the simplest physical systems: mildly sloped, nearly monodisperse sediment beds without complexities such as vegetation
A large part of the review concerns consensus-changing developments in the field within the last two decades
Plane Language Summary
Loose sediment grains can be transported by blowing wind (aeolian) or water flowing in a riverbed (fluvial). These processes are responsible for shaping much of the natural world, but they involve the combination of several very complex physical systems, like turbulent fluid flow near a rough boundary and the mechanical behavior of granular materials. Thus, there is no consensus about the minimum wind or water speeds required to initiate and sustain sediment transport. Additionally, wind and water-driven sediment transport are obviously similar, suggesting that it should be possible to capture both under one description. Recent advances in experiments and computer simulations have helped scientists to answer some key questions about why sediment transport is initiated and sustained. This article reviews many of these recent discoveries, focusing on three key topics: (1) the mechanical behavior of granular materials; (2) how turbulence in the fluid helps to move grains; and (3) the role of inertia of mobile grains. We show that a deeper understanding of these topics helps to resolve some major inconsistencies in our understanding of why sediment transport is initiated and sustained and may help to unify sediment transport by wind and water under a single theoretical description.
1 Introduction
When an erodible sediment bed is subjected to a shearing flow of a Newtonian fluid, such as air or water, bed particles may be entrained (i.e., set into motion) by the action of flow forces and then transported by the flow, initiating a process known as sediment transport. The critical conditions that are required for the initiation of sediment transport have been studied for more than two centuries (e.g., Brahms, 1757). Dating back to the pioneering studies for water-driven transport by Shields (1936) and for wind-driven transport by Bagnold (1936, 1937, 1938) (summarized in his book (Bagnold, 1941)), the initiation of sediment transport in both cases has been commonly described by threshold values of the time-averaged shear stress that the flow applies onto the bed (see reviews by Durán et al., 2011; Kok et al., 2012; Merrison, 2012; Dey and Ali, 2018, 2019; Yang et al., 2019, and references therein). The idea of a threshold value of is natural, since a necessary condition for flow-driven entrainment (or fluid entrainment) is that flow forces and/or flow-induced torques acting on bed surface particles must overcome resisting forces and/or torques. Consistently, for wall-bounded flows (to which sediment transport belongs) at a given shear Reynolds number , the shear velocity controls the near-surface profile of the streamwise flow velocity when averaged over the entire spectrum of turbulent fluctuations (see review by Smits et al., 2011, and references therein), where is the fluid density, the kinematic fluid viscosity, and a particle diameter characteristic for bed particles. As forces resisting entrainment of a bed particle scale with the submerged gravity force (), where is the particle density and the gravity constant, it has been common among geomorphologists to nondimenionalize via (Shields, 1936), which is known as the Shields number or Shields parameter. In the aeolian research community, the threshold parameter (Bagnold, 1941, p. 86) is also often used. Shields (1936) and numerous researchers after him have measured transport thresholds for water-driven transport (see reviews by Miller et al., 1977; Buffington and Montgomery, 1997; Paphitis, 2001; Dey and Papanicolaou, 2008; Dey and Ali, 2019; Yang et al., 2019, and references therein). These measurements are usually summarized in a diagram showing the threshold Shields number as a function of (the Shields curve ), which is known as the Shields diagram.
However, the concept of a threshold shear stress for incipient motion (i.e., for the initiation of sediment transport by fluid entrainment) has had several consistency problems. First, for wind-driven transport, the most widely used incipient motion models (Iversen and White, 1982; Shao and Lu, 2000), when applied to Martian atmospheric conditions, predict threshold shear stresses for fine sand particles that are so large that transport should occur only during rare strong Mars storms (Sullivan and Kok, 2017). However, this prediction is contradicted by modern observations indicating widespread and persistent sediment activity (Bridges et al., 2012a, b; Silvestro et al., 2013; Chojnacki et al., 2015), even of very coarse sand (Baker et al., 2018).
A second inconsistency, which has long been known, concerns water-driven sediment transport and is tacitly acknowledged whenever the concept of an incipient motion shear stress is applied: the sediment transport rate (i.e., the average particle momentum per unit bed area) seems to never truly vanish for nearly any in water flume experiments because of occasional strong turbulent fluctuation events causing entrainment by bursts of much-larger-than-average flow forces. That is why measurements of have relied either on indirect extrapolation methods or on vague criteria defining the value of (or a proxy of ) at which transport is critical (Buffington and Montgomery, 1997). Such criteria had been introduced even before Shields (Gilbert, 1914; Kramer, 1935). In particular, the experiments by Paintal (1971) suggest a power law relationship between , appropriately nondimensionalized, and for weak flows over gravel beds: (it was necessary to measure over tens of hours for the weakest flows), which describes a dramatic but not infinitely rapid decrease of with decreasing . Qualitatively similar observations were reported by Helland-Hansen et al. (1974). Largely because of Paintal’s experiments, Lavelle and Mofjeld (1987) strongly argued in favor of stochastic sediment transport models that do not contain a threshold shear stress (e.g., Einstein, 1950) in a highly cited paper with the title, “Do Critical Stresses for Incipient Motion and Erosion Really Exist?” Despite the fact that many researchers have been well aware of this inconsistency, the concept of a threshold shear stress has remained alive and never been truly questioned by the majority of scientists working on water-driven sediment transport (Dey and Ali, 2018, 2019; Yang et al., 2019). There are two main reasons for the trust in this concept. First, above a value of that roughly coincides with typical criteria defining critical transport (), the relationship between and turns into a much milder power law (Paintal, 1971): , suggesting a clear physical meaning of the threshold Shields number associated with this transition (). Second, descriptions of water-driven sediment transport that are based on a threshold shear stress (i.e., expressions with ) have been quite successful in reproducing transport rate measurements for well-controlled conditions when using very similar values of . For example, the scaling by Meyer-Peter and Müller (1948) with is one of the most widely used expressions in hydraulic engineering for gravel transport driven by water (Wong and Parker, 2006). However, if this value of has a real physical meaning, what is it? Does it truly describe incipient motion, which has always been the predominant interpretation (see reviews by Miller et al., 1977; Buffington and Montgomery, 1997; Paphitis, 2001; Dey and Papanicolaou, 2008; Dey and Ali, 2018, 2019; Yang et al., 2019, and references therein), despite the fact that (in Paintal’s experiments, even for )?
A third inconsistency in the concept of an incipient motion shear stress, which also concerns water-driven sediment transport, is also old but much less well known, perhaps because one of the key papers (Graf and Pazis, 1977) is published in French language. Graf’s and Pazis’ measurements show that increasing the shear stress on the bed due to the water flow from zero up to a certain value (a transport initiation protocol) results in smaller transport rates than decreasing the shear stress from a larger value down to (a transport cessation protocol). This clearly indicates an important role of particle inertia in sustaining water-driven sediment transport. Hence, any measurement of is affected by particle inertia because, regardless of whether an initiation or cessation protocol is used, particles are already transported when approaches (see the second inconsistency discussed above). Hence, is not, or at least not only, associated with fluid entrainment and thus incipient motion. The importance of particle inertia was proposed and indirectly shown even earlier, in a largely ignored study (only eight citations indexed by Web of Science today, half a century after publication) by Ward (1969). In this study, Ward (1969) measured smaller values of for a larger particle-fluid-density ratio (which is a measure for particle inertia) at the same shear Reynolds number . A slight downward trend of with even existed in the pioneering experiments by Shields (1936). Interestingly, a particle inertia effect in water-driven sediment transport has actually been studied. It is well known, although often not considered to be crucial in the context of transport thresholds, that the flow strength at which a transported particle can come to rest at the bed surface is weaker than the one at which it can reenter transport (e.g., Francis, 1973; Reid et al., 1985; Drake et al., 1988; Ancey et al., 2002). In contrast, another potentially important effect of particle inertia in water-driven sediment transport has not received the same attention: the interaction between particles that are already in transport and particles of the bed surface (e.g., particle-bed impacts) may support bed particle entrainment or even be predominantly responsible for it (impact entrainment).
Particle inertia and particularly impact entrainment have been widely recognized as crucial for sustaining wind-driven sediment transport since the pioneering studies by Bagnold (1941). Yet, in contrast to water-driven transport, there seems to be a clear-cut shear stress threshold when applying an initiation protocol in wind tunnel experiments (e.g., Bagnold, 1941). This rather curious difference between wind-driven and water-driven transport is usually not discussed in the context of incipient motion. Why is it necessary to define critical transport rates for measuring an incipient motion shear stress threshold in water-driven transport but not in wind-driven transport? A complete description of incipient motion should be generally applicable and not limited to a subset of possible sediment transport conditions, since there is no reason to believe that the physical mechanisms involved in the entrainment of a bed particle by a turbulent flow depend much on the nature of the flow. In fact, frameworks unifying sediment transport across driving fluids (not only in regard to transport thresholds) are scarce in general (e.g., apart from modern studies, only Bagnold (1956, 1973) seems to have attempted unifying water-driven and wind-driven transport conditions).
One of the most desired aspects of a general framework of sediment transport would be its ability to reliably predict the general dependency of on and other dimensionless environmental parameters, such as the density ratio . However, there is an obvious problem: since measured transport rates may depend on the experimental protocol for a given condition, as was the case in the experiments by Graf and Pazis (1977) (see third inconsistency), does the concept of a general relationship even make sense? The consensus is, yes, it does make sense when referring to transport capacity (also known as transport saturation in aeolian geomorphology), which loosely defines the maximal amount of sediment a given flow can carry without causing net sediment deposition at the bed. However, a precise definition of transport capacity is very tricky and controversial (see review by Wainwright et al., 2015, and references therein). For example, the fact that equilibrium transport rates may depend on the experimental protocol for a given condition implies that not every equilibrium transport condition is equivalent to transport capacity and that transport capacity is in some way linked to particle inertia. In fact, that the latter may be the case was recognized by no and García (1998), who numerically modeled water-driven sediment transport as a continuous motion of particles hopping along a flat wall. In particular, these authors mentioned that the capacity relation obtained from their numerical simulations contains a threshold Shields number that may not be associated with fluid entrainment, demonstrating the necessity for a good understanding of transport capacity and its relationship to particle inertia in the context of sediment transport thresholds.
While this introduction has focused on introducing issues in our understanding of fluid entrainment, shear stress thresholds, particle inertia, transport capacity, and their mutual relationships from a historical perspective, there have been major developments in these topics in the last two decades, largely because of the emergence of novel experimental designs and modeling techniques. The purpose of this review is to draw the attention of the involved research communities to these developments that, if put together, resolve the above issues and provide a largely improved conceptual understanding of sediment entrainment and transport thresholds.
A large portion of recent developments in the field can be attributed to numerical studies modeling the particle phase using the discrete element method (DEM). In comparison to other methods modeling the particle phase (e.g., continuum models), this method has the big advantage that it approximates the laws of physics at a very basic level, namely, at the level of intergrain contacts. In fact, the force laws commonly used to model intergrain contacts are known to produce system results that match experiments extremely well (e.g., Stewart et al., 2001; Lätzel et al., 2003; Clark et al., 2016). Additionally, granular continuum models are formulated using DEM simulations (da Cruz et al., 2005) but reproduce complex experiments on granular flows often very accurately (Jop et al., 2006). In the context of sediment transport, the main uncertainty of DEM-based models lies therefore in the modeling of the coupling between the particle phase and the Newtonian fluid driving transport. However, many of the simulations that are described in this review show that the results are often insensitive to the details of how this coupling is treated. The authors of this review thus argue that new physics uncovered by DEM-based numerical simulations are on a relatively solid footing.
To limit the scope of this review, it focuses on studies of mildly sloped beds of relatively uniform sediments unless mentioned otherwise. Also, because of the focus on physical processes involving the bed surface, this review largely concerns nonsuspended sediment transport (i.e., the fluid turbulence is unable to support the submerged particle weight), in which transported particles remain in regular contact with the bed surface (typical for particles of sand size and larger) and which is the relevant transport mode for the morphodynamics of planetary landscapes, riverscapes, and seascapes. In contrast, in suspended transport (typical for particles of silt or dust size and smaller), transported particles can remain out of contact with the bed surface for very long times (e.g., as atmospheric dust aerosols). In typical nonsuspended wind-driven (aeolian) sediment transport, many particles move in large ballistic hops and the transport layer thickness is therefore much larger than the particle diameter . In the aeolian geomorphology community, such hopping particles are said to move in saltation and explicitly distinguished from particles rolling and sliding along the surface. However, this terminology is not used in this review. Instead, the term saltation transport is used for general transport regimes with , that is, it refers to all rather than a subset of transported particles. In typical nonsuspended liquid-driven transport (henceforth referred to as fluvial transport for simplicity although this mode is not limited to fluvial environments), is of the order of because the largest particle hops are small. Following the fluvial geomorphology community, transport regimes with are termed bedload transport.
This manuscript is organized into sections that focus on specific topics (sections 2–4) followed by a summary and outlook section (section 5) and a Notation section describing the definitions of technical terms and mathematical symbols. It is noted that readers may find it useful to read section 5 first in order to organize the contents of the manuscript, and then consult sections 2–4 for more detailed information on a particular topic. Section 2 reviews recent insights into the mechanics of beginning sediment motion and fluid entrainment gained from studying sediment transport as a dense granular flow phenomenon. For example, it has become increasingly clear that granular material can flow even when a macroscopic motion does not occur, such as for a collapsed pile of sand, because of a process known as creeping, which describes an irreversible superslow granular motion associated with sporadic microscopic rearrangements. That is, it is crucial to clearly define what kind of motion one refers to when introducing sediment transport thresholds. Likewise, forces resisting the entrainment of a bed particle do not only depend on the local arrangement of bed particles but also on granular interactions with regions within the bed that are far away from the entrainment location (i.e., sediment entrainment is a nonlocal phenomenon). This is because of collective granular structures that particles can form. Section 3 reviews insights gained from recent experimental and theoretical studies showing that the fluid shear stress applied onto the bed surface alone only poorly characterizes the critical conditions required for fluid entrainment by turbulent flows. These studies have provided more suitable criteria for sediment entrainment that take into account turbulent fluctuation events and, in particular, their durations. However, section 3 also explains that a critical fluid shear stress for incipient motion does make sense when referring to the shear stress at which the fluid entrainment probability exceeds zero (which, for turbulent fluvial bedload transport, occurs much below the Shields curve (Paintal, 1971)). For example, in wind tunnel studies (but not necessarily in the field), aeolian saltation transport is initiated at about this threshold. Finally, section 4 reviews studies on the role of particle inertia in sediment transport, a topic that has very recently undergone a dramatic change. In fact, while it is well established that impact entrainment is crucial for aeolian saltation transport (see reviews by Durán et al., 2011; Kok et al., 2012; Valance et al., 2015, and references therein), very recent experimental and theoretical studies revealed that it is also crucial for sustaining fluvial bedload transport. Likewise, a very old argument by Bagnold (1941), which was forgotten or deemed unimportant, has recently been revived. Bagnold (1941) pointed out that, for aeolian saltation transport, a predominant role of impact entrainment requires that the flow is able to sustain the motion of transported particles. This is only possible if the energy loss of transported particles rebounding with the bed is compensated by their energy gain during their trajectories via fluid drag acceleration. Models that explicitly incorporate this requirement have been able to partially unify aeolian saltation and viscous and turbulent fluvial bedload transport. When combined, the insights from the studies reviewed in sections 2–4 provide a conceptual picture free of inconsistencies, which is described in section 5. For example, the shear stress threshold compiled in the Shields diagram seems to characterize the cessation of sediment bulk motion and an appropriately defined transport capacity rather than incipient motion. Section 5 also summarizes important open problems and provides a brief outlook into related problems that have not been discussed in this review, such as the effects of particle size heterogeneity on transport thresholds and bed sediment entrainment.
2 Yield and Flow of Dense Granular Media in the Context of Sediment Transport
In theoretical considerations of a problem as complex as the mechanics of beginning sediment motion, simplifying assumptions must be made. This often means that the granular phase is treated extremely coarsely, as a continuum with a Coulomb-like friction coefficient (Terzaghi, 1951; Drucker and Prager, 1952), or very finely, where the pocket geometry of individual grains sets the bed strength (Wiberg and Smith, 1987). However, recent advances in granular mechanics have shown that Coulomb-like behavior of granular materials is inherently nonlocal, so it must be treated on intermediate length scales. This is due to the fact that the yielding condition, defined as the minimum shear stress required to achieve permanent granular flow, is set by emergent, collective networks of grains. These networks can couple different sections of the material together over large distances. The purpose of this section is to provide an overview of recent work on yield and flow of dense granular materials in the context of sediment transport, with a particular focus on the nonlocal nature of granular yielding. To simplify the discussion, it is assumed throughout this section that the granular bed is subjected to a constant bed shear stress (like for laminar flows), in which case the existence of a fluid entrainment threshold associated with bed failure does make sense. However, this is no longer true for turbulent flows, as reviewed in section 3. For more information on dense granular flow, readers might consult recent reviews (Forterre and Pouliquen, 2008; Jop, 2015; Kamrin, 2018) devoted exclusively to the topic of dense granular flow. For the connection between granular flow and sediment transport, the perspective and review by Frey and Church (2009, 2011) are also recommended.
2.1 Yielding of Granular Media
Surface grains sit in pockets on top of the bed, and the geometry of the pocket determines the entrainment conditions for that particular grain via its protrusion (i.e., the grain height above surrounding grains) and friction angle. When the downstream drag force from the fluid overcomes resistive forces from gravity and from contact forces with the pocket, the grain will begin to move. This conceptually simple scenario appears in many theoretical studies (e.g., Wiberg and Smith, 1987; Ling, 1995; Dey, 1999; Dey and Papanicolaou, 2008; Ali and Dey, 2016). However, this picture has several conceptual problems. For example, there are many different pocket geometries (Kirchner et al., 1990; Buffington et al., 1992) implying a distribution of entrainment thresholds. Kirchner et al. (1990) made a similar argument, advocating for a statistical treatment of pocket geometries, where only the grains with the smallest entrainment thresholds would be relevant. Additionally, when transport thresholds are discussed, one typically does not include transient behavior, after the flow has pushed grains from less stable to more stable pockets. For example, an entrained grain that then restabilizes in a nearby pocket would not constitute sediment transport. After such a rearrangement, the resulting bed would have a different intergrain force and contact structure, which would be more suited to resisting the applied flow forces (Masteller and Finnegan, 2017). Thus, determining the fluid entrainment threshold amounts to determining the strongest bed that can be formed by the grains, subject to the flow forces and dynamics. This process necessarily involves transient behavior, as grains search for stable configurations, and spatial correlations, since information about each grain’s movement is transmitted through the intergrain force network.
While this represents a very challenging problem, it is exactly the picture that has emerged in recent years regarding the physical origin of frictional behavior in noncohesive soils or sediments. The yield criterion of granular materials is defined by the maximum internal shear stress that a granular material can achieve, but grains must rearrange to find this maximum stress, sometimes for a long time (Clark et al., 2018; Srivastava et al., 2019). The yield criterion has the form of a friction coefficient, where flow occurs only when , where and are the granular shear stress and pressure , respectively, that arise from intergrain contacts, and is the static friction coefficient of the material. At first glance, this is not surprising, since the grains themselves have a surface friction coefficient . However, is only weakly dependent on (da Cruz et al., 2005), as shown in Figure 1.
(a) (b)
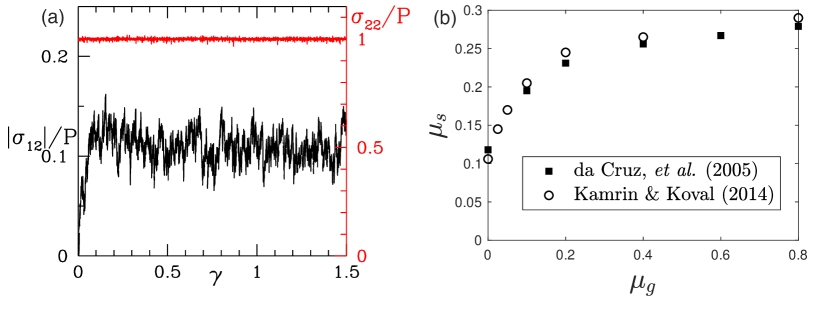
Even frictionless spheres have (Peyneau and Roux, 2008a, b), which arises from a preferred orientation for intergrain contacts that aligns with the compressive direction of the applied shear deformation. This effect is independent of whether the grains interact via linear spring forces (Thompson and Clark, 2019) or more realistic Hertzian interactions (Peyneau and Roux, 2008a). Similar behavior is observed for grains with surface friction and irregular shape (Radjaï et al., 1998; Azéma and Radjaï, 2010, 2014; Trulsson, 2018), but the maximum stress anisotropy is enhanced by these effects, since grain-grain contacts can have both normal and tangential components. This raises the yield stress slightly: frictional disks have (da Cruz et al., 2005) and frictional spheres have (Jop et al., 2006), with only a weak dependence on for . Additionally, is nearly independent of polydispersity (Voivret et al., 2009). This picture assumes grains are slowly moving with persistent intergrain contacts, but can be lowered significantly for more energetic kinds of driving, like vibration (Gaudel and De Richter, 2019) or in aeolian saltation transport (Pähtz et al., 2019), probably because the tendency of the contact orientation to align with the compressive direction is somewhat suppressed (Pähtz et al., 2019). Thus, frictional behavior in granular media arises primarily from the anisotropic structure of force and contact networks, and grain-grain friction, shape, and polydispersity play secondary roles.
Here, is used to denote the local nondimensional shear stress in the granular material itself, while the Shields number is the dimensionless shear stress applied to the granular bed surface, so the two quantities are not equivalent but are closely related. At the surface of the bed, if lift forces are neglected. The existence of a maximum shear stress that can be supported by a granular material (which is independent of grain size) suggests that, for noncohesive sediments, there should be a theoretical upper limit to the threshold Shields number , . This implies that the Shields curve must plateau at low values of the shear Reynolds number for laminar flows. This fact has been a subject of debate for many years, with some authors (Shields, 1936; Mantz, 1977; Miller et al., 1977; Yalin and Karahan, 1979; Govers, 1987; Buffington and Montgomery, 1997; Dey, 1999; Hong et al., 2015) showing a trend where continues to grow as gets smaller, while other studies (Wiberg and Smith, 1987; Paphitis, 2001; Pilotti and Menduni, 2001; Ouriemi et al., 2007) show a plateau at low . Recent work by the present authors (Clark et al., 2015a, 2017; Pähtz and Durán, 2018a) has investigated sediment transport thresholds over a wide range of and density ratio using simulations based on the DEM to model noncohesive grains that are coupled to fluid-driven shear forces. These studies all suggest that is a constant at low and , corresponding to the strongest possible state of the bed. It is noted that cohesive effects become important for very small grains, which can cause to continue to grow for smaller .
Open Problem: Value of Viscous Yield Stress
Measured values of the viscous yield stress vary substantially. For nearly monodisperse beds of spherical particles, most studies reported (Charru et al., 2004; Loiseleux et al., 2005; Ouriemi et al., 2007; Seizilles et al., 2014; Houssais et al., 2015), but larger values of up to about have also been reported (Lobkovsky et al., 2008; Hong et al., 2015). Also, some measurements suggest that depends on the median grain size (Hong et al., 2015), in contradiction to the grain size independence of , while other studies find no such dependence (Ouriemi et al., 2007). To the authors’ knowledge, there is currently no convincing explanation for these contradicting observations. However, the scatter in the reported values for (between 0.12 and 0.37) is within the range reported for the yield stress of granular materials, ranging from low-friction spheres to rougher, more frictional particles. Thus, the yield stress of the bulk granular material may at least play some role in setting the scatter in . In this context, it is worth noting that, for the entrainment of particles resting on an idealized substrate by a laminar flow, threshold Shields numbers range from zero to very large values depending on the packing arrangement (Agudo et al., 2017; Deskos and Diplas, 2018; Topic et al., 2019; Shih and Diplas, 2019).
2.2 Rheological Descriptions
The existence of a yield stress is one piece of a rheological description, which is a constitutive law that mathematically connects the strain rate to the local stress at each point in a material. For granular materials, dissipation implies that more force is required for faster strain rates, so will increase with strain rate . For the case of sediment transport, formulation of a constitutive law has obvious practical benefits, namely that it would allow an analytical prediction of transport rates at varying Shields number for transport conditions dominated by granular interactions. However, note that a bulk constitutive law may not be able to capture certain cases, particularly very near to the onset or cessation of fluvial bedload or aeolian saltation transport, where the transport layer is dominated by the isolated motion of a single grain along the bed (which is the typical situation in gravel-bed rivers (Parker, 1978; Phillips and Jerolmack, 2016)). Despite the fact that the force and contact networks discussed above are spatially extended, some progress has been made by considering so-called local rheologies. Based on dimensional analysis, da Cruz et al. (2005) showed that for dry, uniform granular flows must depend on via a single dimensionless number, , where is called the inertial number, similar to the Savage (Savage, 1984) or Coulomb (Ancey et al., 1999) numbers. A functional form for can then be measured from experiments or DEM simulations (a crude approximation is given by , where is a constant parameter). If one then assumes that a three-dimensional, tensorial generalization of this law is locally satisfied at each point in space in arbitrary geometries, then the equations of motion are closed and one can predict (at least numerically) flow in any arbitrary geometry where the forces and boundary conditions are known. Experimental measurements of rapid, dense flow in several geometries show good agreement with the local rheology (MiDi, 2004; Jop et al., 2005, 2006).
Open Problem: Rheology of Nonsuspended Sediment Transport
There are many physical mechanisms that are relevant to nonsuspended sediment transport that are not included in the inertial number description, but recent work has suggested that appropriate dimensional analysis can be used to find a general rheological description that is relevant in all contexts. For example, viscous effects from the fluid can be included (Boyer et al., 2011; Trulsson et al., 2012; Ness and Sun, 2015, 2016; Houssais et al., 2016; Amarsid et al., 2017; Houssais and Jerolmack, 2017; Guazzelli and Pouliquen, 2018) by replacing the inertial number with the viscous number . This description is valid when the Stokes-like number is small, and the standard rheology again takes over for large . This crossover can be heuristically written in terms of a viscoinertial number , where is an order-unity fit parameter (Trulsson et al., 2012; Ness and Sun, 2015, 2016; Amarsid et al., 2017), and the rheology takes the form .
The previous paragraph describes a unification of dry and wet, viscous granular flows, but some situations, like turbulent bedload or aeolian saltation transport, do not fit neatly into this description. Maurin et al. (2016) showed that, for intense turbulent bedload transport, the inertial number (used for dry flows) collapses the data best, but with a different relation compared to dry flows. Additionally, the presence of more severe velocity fluctuations and grain-grain collisions can weaken the material, giving a that is smaller than would be predicted by a or rheology at a given shear rate (Pähtz and Durán, 2018b). Another option is to build a rheological description that explicitly accounts for these fluctuations and collisions via the Péclet number (Pähtz et al., 2019), where the granular temperature equals the mean square of kinetic particle velocity fluctuations. The advantage of is that it is applicable to a wide range of different granular flows (e.g., it unifies intense fluvial bedload and aeolian saltation transport), whereas is limited to relatively homogeneous flows. The disadvantage is that involves another granular property () that requires modeling.
2.3 Creep and Nonlocal Rheologies
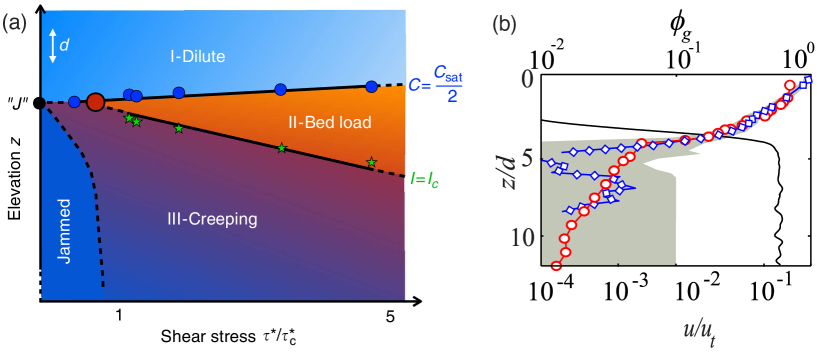
As discussed in section 1, some water flume experiments suggest that fluvial bedload transport never truly ceases for nearly any , which is usually attributed to turbulent fluctuations. However, as discussed in this section, the granular material itself may be partially responsible. In fact, it is well known that granular creep can be observed in a variety of observational geophysical contexts (Boulton and Hindmarsh, 1987; Pierson et al., 1987; Ferdowsi et al., 2018) as well as more idealized granular flows in a laboratory setting (Roering et al., 2001; Komatsu et al., 2001; Nichol et al., 2010; Moosavi et al., 2013; Amon et al., 2013), including sediment transport explicitly (Houssais et al., 2015; Allen and Kudrolli, 2018), as depicted in Figure 2.
Generally, creeping refers to slow, typically intermittent flow (not limited to the bed surface) that occurs below a macroscopic yield criterion.
One class of creeping flow involves systems where regions with and exist nearby each other, which often occurs in systems with stress gradients (e.g., due to gravity or curvature). In this case, creeping flow is observed in regions with (Fenistein and van Hecke, 2003; MiDi, 2004; Crassous et al., 2008; Koval et al., 2009). This creeping flow is not steady or continuous, but occurs in a series of intermittent, avalanche-like slips, which are triggered by the nearby steadily flowing region with . The time-averaged shear rate profiles decay quasi-exponentially with spatial distance to the steadily flowing region. Various nonlocal theories have been proposed (Baran et al., 2006; Pouliquen and Forterre, 2009) that include a spatial length scale over which flow can be triggered in this way. The most successful theories (Kamrin and Koval, 2012; Henann and Kamrin, 2013; Kamrin and Henann, 2015; Bouzid et al., 2013, 2015) suggest that the cooperative length scale diverges at the yield stress (i.e., , where ). This means that, near the yield stress, flow events can be triggered over arbitrarily large distances; this point is revisited below. The grain-scale physical origin of the nonlocal models and associated spatial correlations (Zhang and Kamrin, 2017) as well as how exactly to best mathematically formulate a nonlocal rheology (Bouzid et al., 2017; Li and Henann, 2019) is still a subject of debate in the literature.
The creeping flow captured by these nonlocal models is also apparent in laboratory flumes used to model fluvial sediment transport. Houssais et al. (2015, 2016) showed that sediment transport involves the coexistence of three regimes: a dilute suspension above the bed surface, the bedload layer at the bed surface, and creeping behavior below the surface. These regions are depicted in Figure 2a. The shear rate profile in the creeping regime follows an exponential decay, which is consistent with the predictions of nonlocal models. Similar behavior was also observed by Allen and Kudrolli (2017), shown in Figure 2b, who also stressed that the apparent agreement with nonlocal models formulated for dry granular materials implies that the fluid stress is not playing a major role in the observed creeping behavior. In the creeping regime, , but flow events are triggered via the bedload transport regime at the top of the bed via spatial correlations in the force network. These creeping events, although slow and intermittent, can lead to segregation effects over long times (10–100 hr), where large particles are sorted to the top (Ferdowsi et al., 2017). Thus, creep and nonlocal rheology may play a crucial role in armoring of gravel-bedded rivers, as opposed to size sorting in the transported layer. Additionally, recent computational work (Pähtz and Durán, 2018b) has shown that sediment transport rheology is nonlocal even relatively far from the sediment transport threshold.
There is a second class of creeping flow, which is currently not explained by any rheological model. In the above discussion, creeping granular flow at was always induced by nearby regions with . In some cases, creeping flow can be observed at without any apparent granular flow nearby at (Amon et al., 2013). This class of creep is often accompanied by compaction of the bed. Slow shear and compaction interact in a complex way that is not fully understood but can be crucial in regulating slow (e.g., millimeters to meters per day) geophysical flows (Moore and Iverson, 2002). Similar behavior was also observed in laboratory sediment transport experiments by Houssais et al. (2015) and further studied by Allen and Kudrolli (2018), as shown in Figure 3.
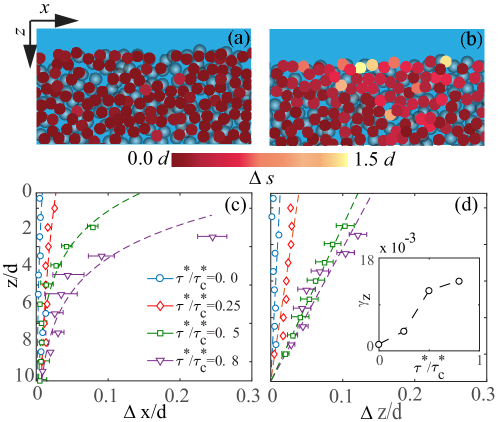
The latter authors observed a granular bed with an overlying laminar shear flow and showed that slow (less than 0.1 grain diameters in 90 min) creeping flow persisted even for (meaning that everywhere in the granular bed). The grain motion in the direction of fluid flow followed an exponential decay with depth, similar to the creep described by nonlocal models. However, it was not induced by granular flow but somehow by the laminar fluid flow. Streamwise creep was also accompanied by compaction of the bed, which can strengthen the material and thus reduce creep. This second class of creep is therefore similar to compaction (Knight et al., 1995; Ribière et al., 2005) and creep (Divoux et al., 2008; Candelier and Dauchot, 2009) that is induced by tapping or vibrations, despite the fact that no explicit vibrations were applied. The existence of this class of creep implies that sediment is likely always transported (albeit slowly) for arbitrarily small values of , even in the absence of turbulence. Another recent experimental flume study (Masteller and Finnegan, 2017) showed a similar result, where conditioning a bed by applying weak fluid flow led to zero net transport but a smoother bed profile with fewer protruding grains. Then, when the fluid flow rate was increased to a value associated with significant transport for a conditioned bed, sediment transport rates were smaller when compared with an unconditioned bed.
Open Problem: Physical Origin of Creeping Below Macroscopic Yield
The physical mechanisms that lead to the second class of creep, where everywhere in the system, are not known. One possible mechanism is contact aging (Jia et al., 2011), where the microscopic contact structure between two solid objects (i.e., grains) can evolve and weaken with time for reasons that are not fully understood (Liu and Szlufarska, 2012). Additionally, Pons et al. (2016) showed that this second class of creep could be induced in dry granular flow by applying small pressure fluctuations to the interstitial air, with resulting shear rates of the order of 10-7. Similar fluctuations likely always exist in natural systems. These two hypotheses are supported by the fact that, to the authors’ knowledge, this class of creep does not occur in DEM simulations, which use a Cundall-Strack model (Cundall and Strack, 1979) or similar Coulomb-like yield criterion for the frictional forces between grains, and fluctuating forces or slow variations in grain-grain friction are not included. Some DEM studies have observed creeping below a macroscopic yield criterion like the angle of response (Ferdowsi et al., 2018), but the results from these studies seem to always include some region of .
2.4 Critical Behavior and Weak Links
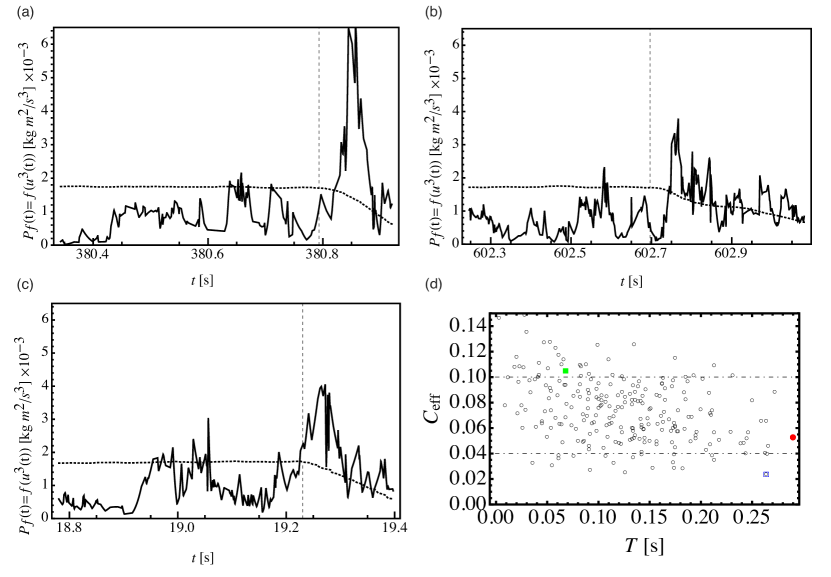
Many experimental and computational studies (Carneiro et al., 2011; Heyman et al., 2013; Houssais et al., 2015) have observed that, near sediment transport thresholds (including the impact entrainment threshold, reviewed in section 4.1.3), the time required for some system measurement (e.g., the sediment transport rate ) to converge to its steady state value appears to grow very large. A common form (Clark et al., 2015a) to capture these long time scales is , where is some positive exponent. A diverging time scale can arise in many ways, but one possibility is a critical phase transition. The study of phase transitions, where a material abruptly changes as a control parameter is smoothly varied, originated in thermal physics (e.g., liquid-gas or ferromagnetic transition), but it has also been successful in describing many other kinds of systems where thermal physics is not applicable. The key feature of a critical phase transition is a diverging correlation length, such that small changes near the critical point can have system-spanning effects that last for arbitrarily long times. The system is thus said to be scale-free at the critical point, since there is no largest length or time scale that is affected by a perturbation.
Open Question: Is Flow-Induced Bed Failure a Critical Phenomenon?
Bed failure at the yield stress describes by definition a phase transition, but whether this transition is critical and how it arises from grain-grain and grain-fluid interactions remain open questions. However, there is a growing body of work (Clark et al., 2018; Srivastava et al., 2019; Thompson and Clark, 2019) suggesting that the yielding transition for granular media is a critical transition. This is also suggested by the diverging correlation length that is present in the nonlocal models discussed above (Kamrin and Koval, 2012; Bouzid et al., 2013). In addition to describing creeping flow for , nonlocal theories are also able to correctly predict other size-dependent effects, like strengthening of thin layers (MiDi, 2004; Kamrin and Henann, 2015). The idea that yielding of granular media is a critical transition helps to explain certain experimentally observed behaviors in laboratory and computational models of sediment transport. For example, using a laboratory flume near the viscous limit, Houssais et al. (2015, 2016) found a diverging time scale near the critical Shields number that is “associated with the slowing down, and increasing variability, of the particle dynamics; it is unrelated to hydrodynamics.” Evidence of scale-free channeling patterns (Aussillous et al., 2016) was also observed during erosion of granular beds, which was attributed to the fact that the onset of erosion was behaving like a critical phase transition.
When the physics controlling the onset of grain motion is no longer just the yield strength of the granular material itself, then the picture changes somewhat. For example, once particle inertia becomes important in sustaining nonsuspended sediment transport (see section 4), the granular phase may not have a frictional state that is close to , and thus it may be far from the critical point. For viscous bedload transport (small ), when particle inertia is not important, computational studies typically show that obeys system size dependence that is consistent with a critical phase transition (Yan et al., 2016; Clark et al., 2018). However, under steady driving conditions, when grain inertia starts to play a role (e.g., for larger ), then still diverges, , but systems of different sizes will have the same (Clark et al., 2015a, 2017). Thus, for inertial particles appears to be more similar to a dynamical instability rather than a true critical point.
However, nonlocal effects still likely play a role in the initiation of permanent bed failure. For example, if particle inertia plays a crucial role in sustaining sediment transport, as argued below in section 4, then a bed could be above the threshold needed to sustain motion but not have any way to get started. Returning to the argument from Kirchner et al. (1990) discussed above, if only the grains with the lowest entrainment thresholds are susceptible to being moved by the fluid, then these grains might be thought of as weak links in the bed. Motion that is initiated by these weak links could trigger flow elsewhere in the system, via the redistribution of forces or by collision. Clark et al. (2015a, 2017) showed that the initiation of motion did indeed obey statistics consistent with a Weibullian weakest link scenario.
2.5 Summary
This section has described recent advances in the physics of sheared granular flows, with a focus on application to sediment transport. The main ideas are as follows. First, the yield condition for granular materials (e.g., a sediment bed) has the form of a static friction coefficient , but it is not set directly by grain-grain friction. Instead, is an emergent property that arises from the maximum structural anisotropy that the grain-grain contact network can support. Friction plays a minor role in determining this maximum anisotropy, and grain shape and polydispersity also play minor roles. Second, although these contact networks are extended in space (and thus inherently nonlocal), local rheological descriptions (i.e., constitutive laws) can be very successful in many contexts. Recent advances suggest that a unified, local rheological description might be within reach. This rule could be used to model any context of wet or dry granular flow with appropriate boundary conditions. Such a description could be used to predict sediment transport rates and thresholds if the grain properties (i.e., size distribution, friction coefficient, grain shape, etc.) were known, even approximately. Third, the inherently nonlocal nature of yielding is dominant when the material is near its yield condition. This causes creeping behavior in regions where a local rheology would predict no flow, which complicates the search for a unified rheological description. However, the results described in Figures 2 and 3 showed that creeping is similar in wet and dry flows, since it very slow and thus dominated by grain rearrangements (not fluid). This suggests that the nonlocal descriptions for wet and dry flows might also be unified in a relatively simple way. The underlying physics behind this nonlocal behavior is not fully understood, but there is mounting evidence that yielding of granular materials represents a kind of critical transition, where different parts of the system can be correlated over arbitrary distances. Remarkably, for sediment transport, creep seems to occur even much below the yield transition, that is, for seemingly arbitrarily small Shields numbers .
This section has considered only sediment beds sheared by nonfluctuating flows and usually neglected the effects of particle inertia in sustaining sediment transport. That is, except for the occurrence of creep, many of the results of this section do not apply to turbulent flows nor flows with significant particle inertia effects that are near the threshold for grain motion (occurring for sufficiently large and/or , see section 4). In particular, the average fluid shear stress at which turbulent flows are able to entrain bed particles is usually much below the yield stress of the granular phase. Nonetheless, both creep and the viscous yields stress will play crucial roles in the new conceptual picture of sediment transport thresholds and sediment entrainment that is presented in section 5.
3 Fluid Entrainment by Turbulent Flows
This section reviews the state of the art on the entrainment of bed particles by a turbulent flow of Newtonian fluid. This process is not equivalent to the initiation of overall sediment motion, which occurs even in the absence of bed sediment entrainment because of creeping (see section 2.3). It is also not equivalent to the comparably simple physics of fluid entrainment by a nonfluctuating flow. For example, when a laminar flow of a Newtonian fluid shears a target particle resting on the sediment bed, there are critical values of the fluid shear stress , which depend on the local bed arrangement, above which this particle begins to roll and slide, respectively (Agudo et al., 2017; Deskos and Diplas, 2018). Once motion begins, resisting forces weaken and, since the flow does not fluctuate, the particle will inevitably leave its bed pocket (i.e., become entrained). The entrained particle will travel along the bed until it comes to rest in another pocket in which it can resist the flow, provided such a pocket exists and is accessible (when the sediment bed has yielded, particles can no longer find stable resting place, see section 2.1). In contrast, in turbulent flows, even though resisting forces weaken when a bed particle becomes mobilized, such a mobilized particle may not find its way out of its initial bed pocket (i.e., incomplete entrainment). The prototype for this situation is a turbulent fluctuation of the flow that exerts a large force on the particle, but the fluctuation is too short-lived for it to become entrained. Hence, there are two important ingredients that need to be considered to accurately describe sediment entrainment by turbulent flows for a given pocket geometry: the magnitude and duration of turbulent fluctuations (evidence for this statement is briefly reviewed in section 3.1). Only entrainment criteria that account for both aspects are able to accurately describe fluid entrainment experiments (section 3.2). Shear stress-based criteria, in general, do not belong to this category. Yet one can still define the critical shear stress above which the probability of fluid entrainment exceeds zero. This and related thresholds have received a lot of attention in studies on aeolian and planetary transport (section 3.3).
3.1 The Role of Turbulent Fluctuations in Fluid Entrainment
Turbulent fluctuations have been known to play a crucial role in fluid entrainment for a long time. For example, Einstein and El-Samni (1949), and later Mollinger and Nieuwstadt (1996), measured large fluctuating lift forces on a fixed rough surface induced by pressure gradient fluctuations of the order of the mean pressure gradient. These authors concluded that such pressure gradient fluctuations must be important also for the mobilization of bed sediment. In fact, numerous laboratory, field, and theoretical studies have advocated the viewpoint that the magnitude of peaks of the instantaneous flow force acting on a bed particle, consisting of both lift and drag forces, is a key aspect of fluid entrainment (e.g., Kalinske, 1947; Sutherland, 1967; Paintal, 1971; Heathershaw and Thorne, 1985; Apperley and Raudkivi, 1989; Kirchner et al., 1990; Nelson et al., 1995; Papanicolaou et al., 2001; Sumer et al., 2003; Zanke, 2003; Hofland et al., 2005; Schmeeckle et al., 2007; Vollmer and Kleinhans, 2007; Giménez-Curto and Corniero, 2009; Dwivedi et al., 2010a, b; Cameron et al., 2019, 2020). However, while such force peaks explain certain observations, such as the episodic character of very weak turbulent bedload transport (Paintal, 1971; Helland-Hansen et al., 1974; Hofland, 2005) or the strong increase of weak turbulent bedload transport in the presence of vegetation (Yager and Schmeeckle, 2013; Yang and Nepf, 2018, 2019), they do not explain all observations. In fact, experiments in which a target particle was placed on an idealized rough substrate and exposed to an electrodynamic force revealed that very high force pulses do not lead to entrainment if their duration is too short (Diplas et al., 2008). Likewise, moderate force pulses that only barely exceed resisting forces lead to entrainment if their duration is sufficiently long. That the duration of force peaks is as important as their magnitude has also been experimentally confirmed both for particles resting on idealized, fixed beds (Diplas et al., 2008; Celik et al., 2010, 2013, 2014; Valyrakis et al., 2010, 2011, 2013; Valyrakis, 2013) and natural erodible sediment beds (Salim et al., 2017, 2018). However, note that, for sediment transport along erodible beds (with the exception of viscous bedload transport), the vast majority of entrainment events are triggered by particle-bed impacts, except for very weak transport conditions (see sections 4.1.2 and 4.1.3). In the following, criteria are reviewed that account for both the magnitude and duration of turbulent fluctuation events.
3.2 Entrainment Criteria That Account for the Magnitude and Duration of Turbulent Fluctuation Events
3.2.1 Impulse Criterion
The initiation of movement of a target particle resting in a pocket of the bed surface necessarily requires that the instantaneous flow forces (or torques) acting on it at the instant of initial motion overcome resisting forces (or torques) :
| (1) |
However, this criterion is not sufficient for entrainment to occur as the target particle may merely move back to its initial resting place if becomes subcritical for times too soon after so that its gained kinetic energy is insufficient to overcome the potential barrier of its bed pocket. For this reason, Diplas et al. (2008) proposed that the fluid impulse associated with larger-than-critical flow forces must exceed a critical value:
| (2) |
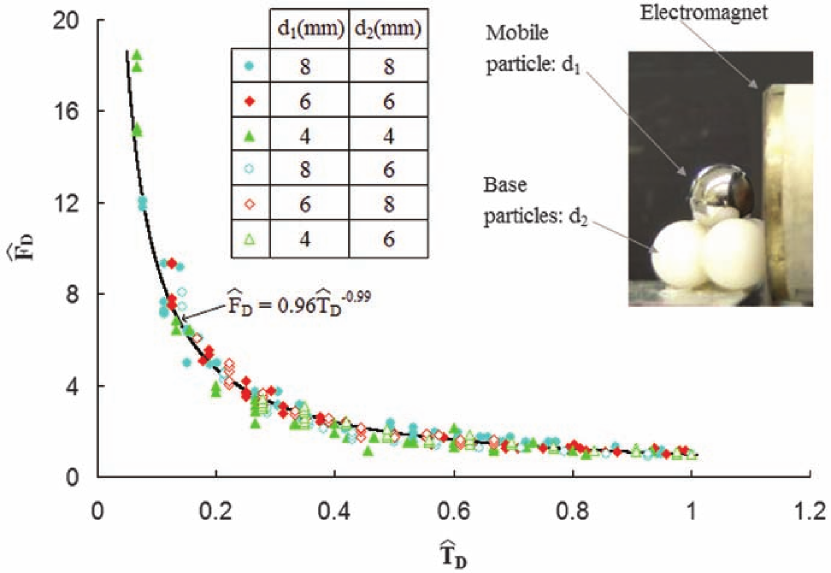
where is the duration of the impulse event (i.e., the duration of the particle acceleration phase of a turbulent fluctuation event). Note that can be much smaller than the time needed to leave the bed pocket as the latter also includes the particle deceleration phase. Diplas et al. (2008) confirmed their hypothesis with idealized experiments in which they subjected an isolated target particle with a constant electrodynamic, horizontal force for a given time , for which . In fact, their measured data of the force that is required for entrainment roughly obey the relation , where is the minimal force required for measurable particle motion (but not necessarily entrainment) and the associated time that is needed for to cause entrainment (Figure 4).
In order to use equation (2) for predicting particle entrainment, one needs to know the impulse threshold . For entrainment into a rolling motion, Valyrakis et al. (2010) derived an expression for the critical impulse ( is defined below) assuming a constant pulse of a hydrodynamic force, separated into a horizontal drag and vertical lift component (), of short duration (so that the angular displacement of the particle remains small for ):
| (3) |
where and are the tangential and normal components, respectively, of the driving flow force at the rest position, is the particle mass, the resisting force, the lever arm length, the added mass coefficient, and , with the bed slope angle and the pivoting angle (Figure 5).
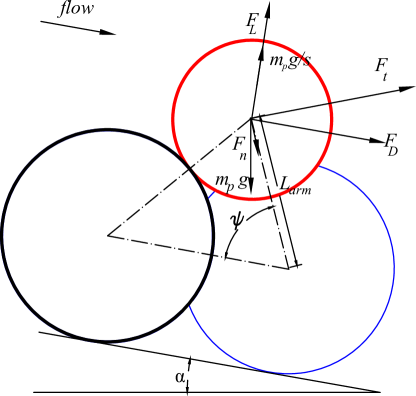
For many conditions, this expression can be well approximated by (Valyrakis et al., 2010)
| (4) |
Lee et al. (2012) derived an alternate expression for short turbulent fluctuation events. Instead of a pure rolling motion, they considered entrainment into a combined rolling and sliding motion (however, note that rolling is usually the preferred mode of entrainment) without bed slope (), assuming that the associated tangential motion is described by a Coulomb friction law with friction coefficient . Furthermore, instead of the pivoting angle, they described the pocket geometry by the horizontal () and vertical () particle displacement (in units of ) that is needed for the particle to escape (equivalent to in Figure 5). The expression by Lee et al. (2012) reads
| (5) |
where is an effective hydrodynamic force and its critical value. For entrainment into a hopping motion, defined as a lift force-induced particle uplift by a vertical distance , Valyrakis et al. (2010) derived
| (6) |
where the resistance force is given by . Note that equation (6) with is equivalent to equation (5) if the critical dimensionless displacement and replaced by .
3.2.2 Energy Criterion
The impulse criterion (equation (2)) accounts for the available momentum of the turbulent fluctuation event in comparison to the momentum required for entrainment. However, close observation of near-bed turbulence reveals that fluctuation events are scarcely ever square pulses or even single-peaked (Valyrakis, 2013). Instead, turbulent flows in nature exhibit a wide range of flow patterns and structures, some of which may be more efficient for particle entrainment than others. For example, the transfer of energy from flow to particles in turbulent fluctuation events with large driving flow forces () is expected to be much more efficient than in fluctuation events with near-critical flow forces (, see section 3.2.1). This motivates the characterization of entrainment using the energy of the fluctuation event that is effectively transferred to the particle (Valyrakis et al., 2013):
| (7) |
where is the minimal amount of work required for complete particle entrainment and the instantaneous flow power, parameterized by the cube of the local flow velocity, and is the coefficient of energy transfer efficiency of the turbulent fluctuation event. The energy transfer coefficient is expected to increase with (see section 3.2.1), where denotes the time average over the event. Water flume experiments on the entrainment of a particle resting on an idealized substrate have confirmed that tends to increase with (Figure 6).
However, one has to keep in mind that incorporates also other effects such as grain orientation and shape.
In order to use equation (7) for predicting particle entrainment, one needs to know the energy threshold . Valyrakis et al. (2013) derived
| Rolling: | (8) | ||||
| Hopping: | (9) |
For typical sediment beds, the ratio between both energy thresholds () is of the order of , demonstrating that a rolling motion is much more easily initiated upon entrainment than a hopping motion. Note that, in contrast to the expressions for the critical impulse for rolling (equations (3) and (4)), equation (8) does neither require the assumption of a small angular particle displacement during the acceleration phase of a turbulent fluctuation event nor the assumption of a short duration of this phase.
3.3 Shear Stress Threshold of Incipient Motion and Initiation of Aeolian Saltation Transport
The entrainment criteria reviewed in section 3.2 are able to predict whether a certain turbulent fluctuation event is capable of entraining a target particle, whereas a criterion based on a critical shear stress would not suffice for this purpose. However, one can still define a shear stress threshold (the initiation threshold) at which the fluid entrainment probability exceeds zero (i.e., below which entrainment never occurs). Such a threshold must exist because the size of turbulent flow eddies is limited by the system dimensions, such as the boundary layer thickness . In fact, a limited size of turbulent flow eddies implies that also the magnitude of peaks of the flow force is limited. That is, one can always find a nonzero shear stress below which even the largest fluctuation peaks do not exceed the resisting forces acting on bed particles (however, note that the existence of sufficiently large flow force peaks does not guarantee a nonzero entrainment probability because their durations may always be too short). Like for , transient behavior associated with the flow temporarily pushing particles from less stable to more stable pockets is excluded in the definition of , which implies for laminar flows at sufficiently low shear Reynolds number . Furthermore, surface inhomogeneities that can generate a lot of turbulence, such as vegetation (Yager and Schmeeckle, 2013; Yang and Nepf, 2018, 2019), are also not considered in the definition of . While is usually not measured for turbulent fluvial bedload transport (it is much below the Shields curve (Paintal, 1971)), it has often been measured in wind tunnel experiments (briefly reviewed in section 3.3.1), including those that sought to determine the initiation threshold of aeolian saltation transport. The reason is that as soon as the first particles of the initially quiescent bed surface are entrained (i.e., begin to roll as rolling requires the smallest flow forces), the flow is usually nearly sufficient to net accelerate them during their downstream motion, resulting in larger and larger particle hops (i.e., the initiation threshold of aeolian saltation transport is only slightly larger than ) (Bagnold, 1941; Iversen et al., 1987; Burr et al., 2015). This occurs because, for typical wind tunnels, is significantly above the cessation threshold of saltation transport (see section 4.3). However, it will become clear that this statement may not apply to aeolian field conditions. Section 3.3.2 briefly reviews models of derived from wind tunnel experiments, while section 3.3.3 reviews recent evidence that indicates that such models, in general, are unreliable, particularly when applied to field conditions.
3.3.1 Wind Tunnel Experiments of the Initiation of Aeolian Rolling and Saltation Transport
Two distinct experimental setups have been used to measure . In the first setup, small isolated patches of particles are placed at the bottom of a wind tunnel and then the fluid shear stress is increased until particles in such patches start to roll or detach (Williams et al., 1994; Merrison et al., 2007; de Vet et al., 2014). In the second setup, a complete bed of particles is prepared at the tunnel bottom and then the fluid shear stress is increased until saltation transport begins (e.g., Bagnold, 1937; Chepil, 1945; Lyles and Krauss, 1971; Iversen et al., 1976; Greeley et al., 1976, 1980, 1984; Gillette et al., 1980; Greeley and Marshall, 1985; Nickling, 1988; Iversen and Rasmussen, 1994; Dong et al., 2003; Cornelis and Gabriels, 2004; Burr et al., 2015; Carneiro et al., 2015; Swann et al., 2020) (see also Raffaele et al. (2016, and references therein)). It is worth noting that, according to the definition of , beginning saltation transport refers to the mere occurrence of saltation transport, even if very sporadic, which is also the definition used by Bagnold (1937). However, many experimental studies defined beginning saltation transport through a critical loosely defined saltation transport activity (similar to the definition of the fluvial transport thresholds compiled in the Shields diagram), which yields slightly larger threshold values (Nickling, 1988).
Open Problem: Qualitative Discrepancy Between Threshold Measurements
For cohesionless particles (m), existing threshold measurements based on the second setup show that increases relatively strongly with the particle diameter (Raffaele et al., 2016). In contrast, for the first setup, measurements indicate that remains constant with for m (Merrison et al., 2007; de Vet et al., 2014). The reason for this qualitative inconsistency is not understood. Merrison et al. (2007) suggested that the initiation of rolling (measured in their experiments) may be different to that of saltation transport. However, this suggestion is inconsistent with the observation that saltation transport in wind tunnels is preceded by rolling further upwind (Bagnold, 1941; Iversen et al., 1987; Burr et al., 2015). Furthermore, in contrast to standard wind tunnel experiments, for experiments in pressurized wind tunnels with Venusian air pressure, both an equilibrium rolling (lower initiation threshold) and an equilibrium saltation transport regime (higher initiation threshold) exist, and both initiation thresholds strongly increase with (Greeley and Marshall, 1985).
3.3.2 Models of the Initiation of Aeolian Rolling and Saltation Transport
Nearly all existing models of the initiation of aeolian rolling and saltation transport (including sand transport (Bagnold, 1941; Iversen et al., 1976, 1987; Iversen and White, 1982; Shao and Lu, 2000; Cornelis and Gabriels, 2004; Lu et al., 2005; Claudin and Andreotti, 2006; Kok and Renno, 2006; Merrison et al., 2007; Durán et al., 2011; Duan et al., 2013a; de Vet et al., 2014; Burr et al., 2015; Edwards and Namikas, 2015), drifting snow (Schmidt, 1980; Lehning et al., 2000; He and Ohara, 2017), and the transport of regolith dust by outgassed ice on the comet 67P/Churyumov-Gerasimenko (Jia et al., 2017)) predict from the balance between aerodynamic forces and/or torques and resisting forces and/or torques acting on a bed particle. Even though many of these models do not consider peaks of the aerodynamic force, and some of them do not treat as what it is (i.e., the threshold at which the fluid entrainment probability exceeds zero, see above), they are conceptually very similar and mainly differ in the empirical equations that they use for the aerodynamic and cohesive interparticle forces. For this reason, only one of the most popular and simple models, the model by Shao and Lu (2000), is discussed here. It reads
| (10) |
where is an empirical scaling factor and kg/s2 an empirical constant that accounts for cohesive interparticle forces. More complex models (e.g., Iversen and White, 1982; Claudin and Andreotti, 2006; Durán et al., 2011) involve additional dependencies of on the shear Reynolds number or, equivalently, on the Galileo number (also called Yalin parameter (Yalin, 1977)).
3.3.3 Effects of the Boundary Layer Thickness on the Initiation of Aeolian Rolling and Saltation Transport
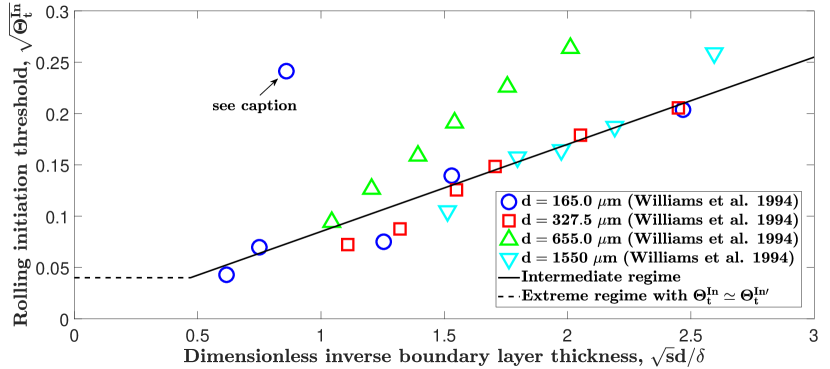
The size of turbulent flow eddies, and thus the duration of turbulent fluctuation events, is limited by the system dimensions, more specifically, the boundary layer thickness (see review by Smits et al., 2011, and references therein). However, in most wind tunnel experiments and the field, the produced turbulent boundary layer should be so thick that any turbulent fluctuation has a nonzero probability to last sufficiently long for entrainment to occur (Pähtz et al., 2018). That is, the mere existence of aerodynamic force peaks that exceed resisting forces is sufficient for to be exceeded. However, this is no longer true when becomes too small, at which point turbulent fluctuation events may cause particles to rock (i.e., vibrate or wobble or oscillate) within their bed pockets but no fluctuation lasts long enough for the particles to completely leave them. Pähtz et al. (2018) physically modeled such situations and derived an expression for the ratio between and the shear stress threshold of incipient rocking (equivalent to the Shields number ratio ). These authors’ derivation uses the impulse criterion of section 3.2.1 (even though Pähtz et al. (2018) start with the energy criterion, their analysis is effectively equivalent to assuming a constant impulse threshold) and the fact that the maximal duration of turbulent fluctuation events is controlled by and the local mean flow velocity via (Alhamdi and Bailey, 2017). The derived expression reads
| (11) | ||||
where is the ratio between the characteristic flow velocity associated with the largest positive fluctuations and , and is a factor that encodes information about particle shape, orientation, and the pocket geometry. Equation (11) encompasses three different regimes. In one extreme, if there is a nonzero probability that turbulent fluctuation events associated with the largest positive fluctuations last sufficiently long for particle entrainment, then there will be a nonzero probability that incipient rocking evolves into incipient rolling (i.e., ). In the other extreme, if all positive fluctuation events always last too short, the mean flow must exceed the torque balance for entrainment to occur (i.e., ). In the intermediate regime between these two extremes, is proportional to the square of the inverse dimensionless boundary layer thickness . Although weak logarithmic dependencies on are also incorporated in and (Lu et al., 2005), they are dominated by this proportionality. In fact, Figure 7 shows that the prediction for the intermediate regime is roughly consistent with the experimental data by Williams et al. (1994) if one uses that the Shields number for incipient rocking () is approximately constant, neglecting the logarithmic dependency of on (and further minor dependencies on ).
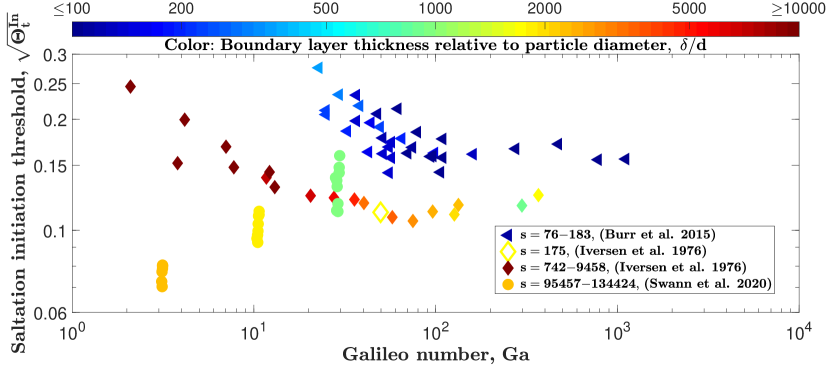
Williams et al. (1994) set up their wind tunnel in a manner that produces a relatively thin developing turbulent boundary layer (i.e., increases with downstream distance). However, once the intermediate regime is exceeded (i.e., ) because becomes too large, as for most wind tunnel experiments with fully developed boundary layers, the logarithmic dependency of on via may become significant (Figure 8).
Open Problem: Unexpected Behavior of Saltation Transport Initiation Threshold for Large Density Ratio
The very recent measurements by Swann et al. (2020), who used a very-low pressure wind tunnel and three different beds of cohesionless particles (m) to mimic Martian conditions, indicate that unexpectedly increases substantially with and thus (Figure 8). A possible explanation could be that, because of the very large density ratio , some of the experimental conditions may have been in the intermediate regime (i.e., in equation (11)), in which scales with (Figure 7). In fact, for the three conditions, where only the largest value (corresponding to m) is larger than the critical value that Pähtz et al. (2018) associated with the end of the intermediate regime. In other words, the measurements for m and m may both have been in the intermediate regime, in which roughly scales with (cf. Figure 7).
Controversy: Dependency of Saltation Transport Initiation Threshold on Density Ratio
Based on comparisons between experiments in pressurized wind tunnels with comparably very thin boundary layers but larger-than-normal air density (Greeley et al., 1984; Burr et al., 2015) and nonpressurized wind tunnels with comparably very large boundary layers (Iversen et al., 1976) (and normal air density), Iversen et al. (1987) and Burr et al. (2015) argued that there is an underlying decrease of the saltation transport initiation threshold (which is slightly larger than for aeolian transport in typical wind tunnels, see above) with the density ratio for a constant shear Reynolds number (equivalent to a constant ). However, this dependency on may be an artifact of huge differences in the dimensionless boundary layer thickness (Pähtz et al., 2018). In fact, even though the dependency of on is logarithmic once the intermediate regime is exceeded (like for the measurements in question), such weak dependencies can still have significant effects once differences in become very large. This point of view is supported by Figure 8, in which is color-coded. It can be seen that the yellow, open diamond (a measurement from a nonpressurized wind tunnel) exhibits a similar value of as the blue symbols (measurements from a pressurized wind tunnels), which was achieved by using a very light particle material (kg/m3). Nonetheless, the threshold of the former is significantly smaller than those of the latter. Also, the former measurement relatively smoothly connects to the other measurements carried out in the same nonpressurized wind tunnel, which exhibit much larger values of . On the other hand, the measurements by Swann et al. (2020), for which is comparably very large and of a similar size as for the measurements by Iversen et al. (1976), support the density ratio hypothesis because of comparably small values of . Note that, for the discussion of threshold values, one has to keep in mind that threshold measurements are highly prone to measurement errors of various sources (Raffaele et al., 2016). Such errors are likely much larger than often reported because measurements of can vary by more than a factor of for a given condition, even for cohesionless particles (Raffaele et al., 2016).
Open Problem: Aeolian Bedload Transport in the Field
In wind tunnel experiments, rolling is being initiated at threshold values that are significantly above the cessation threshold of saltation transport (see section 4.3). This is why rolling seems to always evolve into saltation transport (i.e., equilibrium rolling and thus aeolian bedload transport does not seem to exist) (Bagnold, 1941; Iversen et al., 1987; Burr et al., 2015). However, atmospheric boundary layers are several orders of magnitude thicker than those of wind tunnels (Lorenz et al., 2010; Petrosyan et al., 2011; Kok et al., 2012; Lebonnois et al., 2018) and may therefore exhibit a significantly smaller rolling threshold. In contrast, the cessation threshold of saltation transport is predominantly a property of the mean turbulent flow (see section 4.3) and therefore rather insensitive to the boundary layer thickness . Hence, for atmospheric boundary layers, it is possible that equilibrium rolling transport exists. Note that equilibrium rolling transport has been observed in pressurized wind tunnels with Venusian air pressure for a narrow range of Shields numbers (e.g., Greeley and Marshall, 1985).
Open Problem: Reliable Models of the Initiation Threshold of Planetary Saltation Transport
The most widely used models for the initiation of aeolian saltation transport (see section 3.3.2), which have been adjusted to wind tunnel measurements, do not take into account the dependency of the relative magnitude of turbulent fluctuations on the dimensionless boundary layer thickness . This may be the reason why these models, when applied to Martian atmospheric conditions, predict threshold shear stresses for fine sand particles that are so large that transport should occur only during rare strong Mars storms (Sullivan and Kok, 2017), in contradiction to modern observations indicating widespread and persistent sediment activity (Bridges et al., 2012a, b; Silvestro et al., 2013; Chojnacki et al., 2015), even of very coarse sand (Baker et al., 2018). For example, for the Martian conditions reported by Baker et al. (2018) (kg/m3, kg/m3, m/s2, mm), equation (10) predicts for the threshold shear velocity: m/s, which corresponds to winds that are more than twice as fast as the strongest Mars storms. Note that Lu et al. (2005) proposed a model for the initiation of rolling that includes the effect of . The authors of this review therefore recommend to use the model by Lu et al. (2005) in combination with models of the cessation threshold of saltation transport (see section 4.3) for the estimation of the occurrence of saltation transport in real atmospheric boundary layers. However, it remains to be demonstrated that this approach yields reliable predictions. In fact, in the field, atmospheric instability, topography gradients, and surface inhomogeneities, such as obstacles and vegetation, can dramatically enhance local turbulence and thus fluid entrainment. Likewise, sublimation of subsurface ice in cold environments (the so-called solid-state greenhouse effect (Kaufmann et al., 2006)) can generate airborne particles of carbon dioxide, methane, and nitrogen ice (Hansen et al., 1990; Thomas et al., 2015; Jia et al., 2017; Telfer et al., 2018). Given that even a few entrained particle can result in fully developed saltation transport provided that the fetch is sufficiently long (Sullivan and Kok, 2017), it may well be that saltation transport in the field can almost always be initiated close to the cessation threshold (Sullivan and Kok, 2017; Pähtz et al., 2018; Telfer et al., 2018). Evidence for this hypothesis is seen on Pluto, where aeolian dunes and wind streaks have been observed even though saltation transport initiation had been thought to be virtually impossible because of Pluto’s very thin atmosphere (pressure Pa) and relatively weak 10 m winds (m/s) (Telfer et al., 2018).
Open Problem: Lack of Direct Aeolian Sediment Transport Initiation Measurements in the Field
The overarching problem associated with the rather poor current knowledge of aeolian sediment transport initiation in the field (see open problems above) is that, to the authors’ knowledge, there are no direct field measurements of the transport initiation threshold . In fact, existing field experiments have focused on detecting aeolian saltation transport (Barchyn and Hugenholtz, 2011, and references therein) rather than on how the fluid entrainment of individual bed particles, which usually starts out as a rolling motion, leads to saltation transport. Hence, we currently do neither know the wind speeds that are required in the field to initiate rolling transport of individual bed particles nor whether such rolling transport, like in wind tunnels, always evolves into saltation transport (see open problems above). What adds to the problem is that existing field studies either obtain saltation transport threshold estimates using methods that do not seek to distinguish saltation transport initiation and cessation (Barchyn and Hugenholtz, 2011, and references therein) or assume that coincides with the continuous saltation transport threshold (Martin and Kok, 2018) (which is a controversial assumption, see section 4.1.3).
4 The Role of Particle Inertia in Nonsuspended Sediment Transport
As discussed in section 1, old experimental studies (e.g., Ward, 1969; Graf and Pazis, 1977) strongly indicated that the fluvial transport threshold measurements that are compiled in the Shields diagram are to a nonnegligible degree affected by particle inertia. As the Shields diagram shows a rough data collapse of the threshold Shields number as a function of the shear Reynolds number , this raises the question of whether is in some way associated with particle inertia. Indeed, while has usually been interpreted as the ratio between the particle size and the size of the viscous sublayer of the turbulent boundary layer, Clark et al. (2017) showed that it can also be interpreted as a number that compares the viscous damping time scale to the ballistic time scale between bed collisions. Importantly, these authors showed that the shape of the Shields curve can be partly explained by the fact that inertial particles at high are harder to stop.
In general, the role of particle inertia in nonsuspended sediment transport can be twofold. On the one hand, entrainment by or supported by particle-bed impacts may be able to supply the transport layer with bed particles and thus compensate captures of transported particles by the bed (section 4.1). This mechanism gives rise to a shear stress threshold associated with impact entrainment. On the other hand, although the mean turbulent flow is usually too weak to initiate transport (which instead usually requires turbulent fluctuation events, see section 3), it may be able to sustain the motion of particles that are already in transport. This mechanism gives rise to a physical process-based definition of transport capacity and a shear stress threshold, which has often been misidentified as an entrainment threshold by Shields (1936) and others (section 4.2). Various models for both shear stress thresholds that have been proposed in the literature are compared with one another in section 4.3.
4.1 Impact and Impact-Supported Entrainment
Bagnold (1941) was the first to recognize that impact entrainment is crucial for sustaining aeolian saltation transport. Based on his wind tunnel and field observations, he explained (Bagnold, 1941, p. 102), “In air, the grains, when once set in motion along the surface, strike other stationary grains, and either themselves bounce high (a distance measured in hundreds if not thousands of grain diameters) into the relatively tenuous fluid, or eject other grains upwards to a similar height.” Largely because of Bagnold’s observations, the statistics of particle impacts onto a static granular packing have been subject of many experimental and theoretical investigations (section 4.1.1). Bagnold (1941, p. 102) also believed that impact entrainment is negligible for fluvial bedload transport: “If the physics of this impact-ejection mechanism is applied to sand in water, it is found that the impact momentum of the descending grains is insufficient to raise surface grains to a height greater than a small fraction of one grain diameter.” However, Bagnold, and numerous researchers after him, did not consider that even a marginal uplift of a bed particle can make it much easier for a turbulent fluctuation event to entrain it (section 4.1.2) and that, once bedload transport becomes sufficiently strong, multiple particle-bed impacts occur in so short sequence that the bed can no longer be considered as static. In fact, for continuous transport, recent studies revealed that impact entrainment alone can sustain bedload transport (section 4.1.3).
4.1.1 Impact of an Incident Particle Onto a Static Granular Packing
The collision process between an incident particle and a static granular packing has been investigated in many experimental (Mitha et al., 1986; Werner, 1990; Rioual et al., 2000, 2003; Tanaka et al., 2002; Nishida et al., 2004; Beladjine et al., 2007; Oger et al., 2008; Ammi et al., 2009; Clark et al., 2012, 2015b, 2016; Bachelet et al., 2018; Chen et al., 2019) and theoretical (Werner and Haff, 1988; Anderson and Haff, 1988, 1991; Haff and Anderson, 1993; McElwaine et al., 2004; Oger et al., 2005, 2008; Zheng et al., 2005, 2008; Namikas, 2006; Crassous et al., 2007; Bourrier et al., 2008; Kok and Renno, 2009; Valance and Crassous, 2009; Ho et al., 2012; Duan et al., 2013b; Xing and He, 2013; Comola and Lehning, 2017; Huang et al., 2017; Tanabe et al., 2017; Lämmel et al., 2017) studies in order to better understand aeolian saltation transport and other geophysical phenomena (e.g., rockfall (Bourrier et al., 2008; Bachelet et al., 2018)); see also (White and Schulz, 1977; Willetts and Rice, 1986, 1989; McEwan et al., 1992; Nalpanis et al., 1993; Rice et al., 1995, 1996; Dong et al., 2002; McElwaine et al., 2004; Gordon and McKenna Neuman, 2009, 2011) for collision statistics during ongoing aeolian saltation transport. In typical experiments, a spherical incident particle of diameter and mass is shot (e.g., by an airgun) at a given speed and angle onto a static packing of spheres of the same size. As shown in Figure 9 and sketched in Figure 10, as a result of its impact on the packing, the incident particle may rebound (velocity , angles , ) and/or eject bed particles into motion (number , velocity , angles , ), where a particle is typically counted as ejected if its center is lifted by more than above the top of the bed surface.
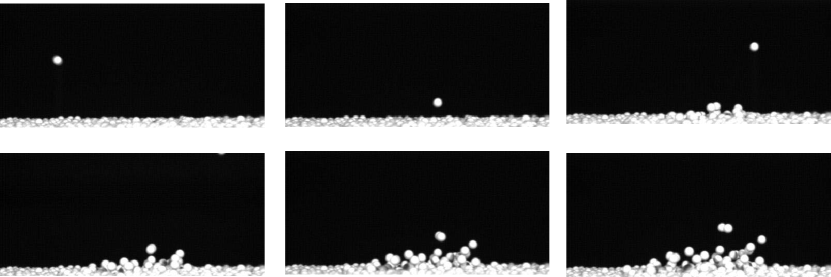
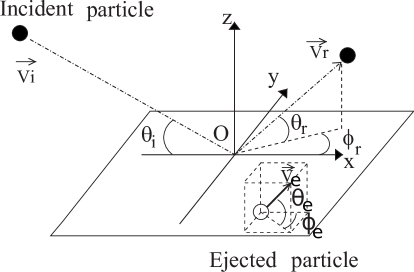
The statistics of this process has been the subject of several recent experimental and numerical studies (e.g., Beladjine et al., 2007; Ammi et al., 2009; Tanabe et al., 2017) (note that experimental studies that used only one camera measured quantities projected into the incident plane: and ). These studies have yielded the following insights:
(i) The incident particle loses much more energy in head-on than in grazing collisions. In fact, the average restitution coefficient and its two-dimensional projection obey the following empirical relationships for :
| (12a) | ||||
| (12b) | ||||
where the overbar denotes an ensemble average over collision experiments, and the and coefficients are empirical constants that vary slightly between the studies (e.g., , (Ammi et al., 2009), and (Beladjine et al., 2007)).
(ii) The average vertical restitution coefficient exceeds unity at small impact angles and obeys the following empirical relationship for :
| (13) |
where and for the experiments by Beladjine et al. (2007). Pähtz et al. (2020) suggested the following modification of equation (13):
| (14) |
This modification, which is also consistent with the experimental data, ensures the correct asymptotic behavior of the average rebound angle, (Lämmel et al., 2017), in the limit .
(iii) The average rebound angle and its two-dimensional projection are independent of the incident speed, increase with the impact angle, and obey the following empirical relationships for :
| (15a) | ||||
| (15b) | ||||
where and for the experiments by Ammi et al. (2009).
(iv) The average energy that the incident particle transfers to the bed is spent for the ejection of bed particles. That is, it is proportional to the average of the sum of the kinetic energy of ejected particles ( and ). In fact, the following empirical relationships are obeyed for :
| (16a) | ||||
| (16b) | ||||
where and for the experiments by Ammi et al. (2009). Note that and decrease with the coordination number of the particle packing (Rioual et al., 2003).
(v) The average number of ejected particles is a linear function of the incident speed for :
| (17) |
where and for the experiments by Ammi et al. (2009). Note that decreases with the coordination number of the particle packing (Rioual et al., 2003).
(vi) The average horizontal and lateral velocities of ejected particles are nearly independent of the incident velocity, but the average vertical velocity increases slightly with the incident velocity and is independent of the impact angle for (Ammi et al., 2009):
| (18a) | ||||
| (18b) | ||||
| (18c) | ||||
Open Problem: Behavior of the Rebound Probability
Mitha et al. (1986) measured that about of all impacting particles are not captured by the bed (i.e., they successfully rebound). However, the range of impact velocities in their experiments was very narrow (). More systematic measurements of the rebound probability are needed.
Studies have attempted to physically describe both the rebound (Zheng et al., 2005, 2008; Namikas, 2006; Lämmel et al., 2017) and ejection dynamics (McElwaine et al., 2004; Crassous et al., 2007; Kok and Renno, 2009; Valance and Crassous, 2009; Ho et al., 2012; Comola and Lehning, 2017; Lämmel et al., 2017). For example, the rebound dynamics can be analytically calculated for an idealized packing geometry and a given rebound location assuming a binary collision between the incident particle and hit bed particle. From averaging over all possible rebound locations, one can then determine the rebound angle and restitution coefficient distributions. Using this procedure, Lämmel et al. (2017) derived the following expressions for , , , and in the limit of shallow impact angles ():
| (20) | ||||
| (21) | ||||
| (22) | ||||
| (23) |
where and are the normal and tangential rebound restitution coefficients, respectively, in the impact plane, which depend on the binary normal and tangential restitution coefficient (i.e., the ratio between the postcollisional and precollisional relative particle velocity component normal and tangential, respectively, to the contact plane). Figure 11 compares equations (20)–(22) with the experimental data by Beladjine et al. (2007) using the values and , which Lämmel et al. (2017) obtained from fitting the numerical solution of the full problem (i.e., not limited to ) to the experimental data.
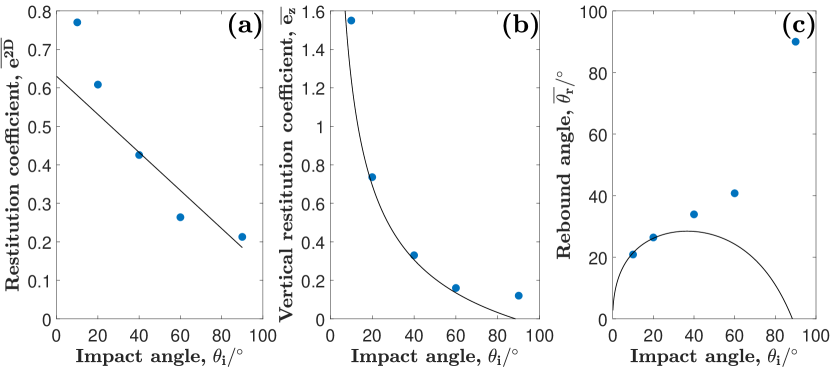
The agreement with the data with is acceptable considering that the theory has been derived mostly from first physical principles. Equation (23), which is the modified version of equations (41) and (42) of Lämmel et al. (2017) that these authors describe in their text, cannot be tested because of the lack of systematic measurements of the rebound probability . A widely used alternative expression for was given by Anderson and Haff (1991): . However, this expression is empirical and contains the dimensional parameter (note that Andreotti (2004) assumed ). Because , which is a precondition for sustained aeolian saltation transport (from energy conservation), requires shallow impact angles, equations (20)–(23) can be used for the theoretical modeling of aeolian saltation transport.
For the description of the ejection dynamics, there have been two distinct approaches: solving an underdetermined momentum and/or energy balance of the particles involved in the collision process (Kok and Renno, 2009; Comola and Lehning, 2017) and treating the collision process as a sequence of binary collisions, in which the energy is split between the collisional partners (i.e., incident and bed particle or two bed particles) (McElwaine et al., 2004; Crassous et al., 2007; Valance and Crassous, 2009; Ho et al., 2012; Lämmel et al., 2017). A minimal numerical model that is based on the latter approach has been able to reproduce experimental data of both the rebound and ejection dynamics, including the measured log-normal distribution of the vertical ejection velocity (Crassous et al., 2007). Furthermore, based on this approach and the derivation by Ho et al. (2012), Lämmel et al. (2017) derived the following analytical expression for the distribution of the ejection energy :
| (24) | ||||
from which they further obtained expressions for , , and :
| (25) | ||||
| (26) | ||||
| (27) |
where . Figure 12 shows that these expressions are roughly consistent with experimental data considering that they have been derived mostly from first physical principles.
Note that equations (20)–(27), after some minor modifications, can also be applied to situations in which the size of the impacting particle differs from the size of the particles of the granular packing (Lämmel et al., 2017). Further note that equation (38) of Lämmel et al. (2017), which is the equivalent of equation (27), contains a typo (a is missing in the denominator).
Open Problem: Impacts Onto Mobile Beds
The findings from collision experiments with static beds are often applied to model fluvial bedload (Berzi et al., 2016; Pähtz et al., 2020) and aeolian saltation transport (Andreotti, 2004; Claudin and Andreotti, 2006; Creyssels et al., 2009; Kok and Renno, 2009; Kok, 2010a; Jenkins et al., 2010; Lämmel et al., 2012; Pähtz et al., 2012; Huang et al., 2014; Jenkins and Valance, 2014, 2018; Wang and Zheng, 2014, 2015; Berzi et al., 2016, 2017; Bo et al., 2017; Lämmel and Kroy, 2017; Pähtz et al., 2020). However, if the time between successive particle-bed impacts is too short for a bed particle to fully recover from each impact, it can accumulate more and more kinetic energy with each impact. Hence, for a sufficiently large impact frequency and impact energy (both increase with the sediment transport rate ), the bed can no longer be treated as static and the findings from such collision experiments may no longer apply. For example, the simultaneous impact of two particles onto the bed leads to a significantly different outcome compared with the situation in which each particle impacts separately (Duan et al., 2013b). For these reasons, future studies should try to systematically investigate the effects of disturbances from the static bed on the outcome of a particle-bed impact.
Open Problem: Effects of Particle Shape and Size Distribution
Chen et al. (2019) investigated the particle-bed collision process for natural sand particles, which exhibit nonspherical shapes and nonuniform particle size distributions. They found significant quantitative and qualitative deviations from the laws describing spherical, uniform particles. More systematic experimental studies are needed to pinpoint the exact manner in which particle shape and size distribution affect the collision process.
Controversy: Effects of Viscous Damping
Binary collisions that occur within an ambient fluid can be significantly damped depending on the Stokes number (Gondret et al., 2002; Yang and Hunt, 2006; Schmeeckle, 2014; Maurin et al., 2015), where is the relative particle velocity just before a collision. For example, experiments suggest that the effective normal restitution coefficient of a damped binary collision vanishes for (Gondret et al., 2002). The question that then arises is how does viscous damping affect the rebound and ejection dynamics of a particle-bed impact. Berzi et al. (2016, 2017) assumed that the rebound restitution coefficients and , like , also vanish when falls below a critical value. In contrast, DEM-based simulations indicate that the dynamics of saltation (Pähtz and Durán, 2018a) and particularly bedload transport (Drake and Calantoni, 2001; Maurin et al., 2015; Elghannay and Tafti, 2017; Pähtz and Durán, 2017, 2018a, 2018b) are not much affected by the value of , which suggests that the rebound and ejection dynamics of a particle-bed impact may not be much affected by viscous damping. A possible explanation for this unexpected behavior could be that a nearly elastic particle-bed impact may be roughly equivalent to a sequence of binary collisions between particles in contact at the instant of impact. In fact, a theoretical model based on this hypothesis reproduced experiments of the collision process (Crassous et al., 2007; Valance and Crassous, 2009). For the perfectly elastic case (), the impactor would then transfer all of its momentum in the direction normal to the contact plane to the particle it hit (which is the expected result of an elastic binary collision between a mobile and a resting particle) and, therefore, rebound with zero normal momentum. A complete loss of normal momentum is also expected for the completely inelastic case (). This suggests that the rebound process is not much affected by , which would imply that the momentum in the direction tangential to the contact plane is what mainly matters. Collision experiments in an ambient viscous liquid could resolve this controversy.
Open Problem: Effects of Cohesion
Cohesive interparticle forces, including van der Waals (Castellanos, 2005), water adsorption (Herminghaus, 2005), and electrostatic forces (Lacks and Sankaran, 2011), become significant in the collision process for sufficiently small particles (on Earth, for m) because they scale with a lower power in the particle diameter () than the gravity force (). However, collision experiments with so small particles have not been carried out because it is very difficult to detected their dynamics with cameras. Numerical studies are also very scarce. To the authors’ knowledge, only the very recent study by Comola et al. (2019a) studied cohesive forces, by implementing them in a numerical DEM-based model of aeolian saltation transport. These authors investigated the impact of a particle onto the bed for a large range of the strength of cohesive forces and found that cohesion decreases via solidifying the bed, while slightly and considerably increase. However, more systematic studies are needed to confirm these results and determine scaling laws describing the effects of cohesion on the outcome of a particle-bed impact.
4.1.2 Collision-Enhanced Turbulent Entrainment in Fluvial Bedload Transport
To the authors’ knowledge, only a single study has resolved the effects of particle-bed impacts on entrainment by turbulent fluctuation events in bedload transport (Vowinckel et al., 2016). However, this study provided one of the largest, if not the largest, data sets of entrainment events associated with fluvial bedload transport with a very high resolution in space and time. Vowinckel et al. (2016) coupled direct numerical simulations (DNS) for the fluid phase (i.e., the Navier-Stokes equations are directly solved without using turbulent closure assumptions) with DEM simulations for the particle phase (i.e., particles interact with each other according to a contact model) using the immersed boundary method, which fully resolves the geometry of particles (and thus the hydrodynamic forces acting on them) without remeshing the grid during their motion (Vowinckel et al., 2014). Because of the sophistication of this numerical method (i.e., resolving all relevant physical processes at very small scale), the produced data can be considered to be very reliable. The simulated setup consisted of two layers of grains resting on the simulation bottom wall, the lower of which was fixed, arranged in a hexagonal packing, and exposed to a unidirectional open channel flow of thickness (Reynolds number , where is the bulk flow velocity). The Shields number was at , which is about below the Shields curve for the simulated condition. That is, the nondimensionalized transport rate was likely below the value associated with critical transport conditions (see section 1), which is consistent with Vowinckel et al. (2016) reporting that only of all particles were in motion on average. For these conditions, it was found that, in the vast majority of cases (overall ), a particle-bed impact and a subsequent turbulent fluctuation event are responsible for entrainment, even when one or more of the six pockets surrounding the target particle were not occupied by other particles (in which case the target particle experiences a larger exposure to the flow). For an entrainment event following this pattern, Figure 13 shows the time evolution of (a) the vertical displacement () and (b) velocity of a bed surface particle (), while Figure 14 shows the simulation domain and contour plots of the instantaneous flow field.
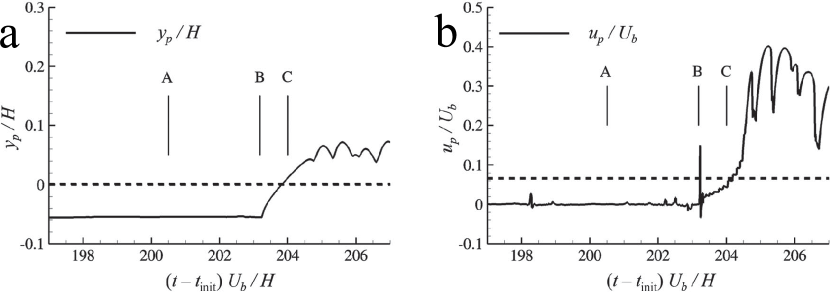
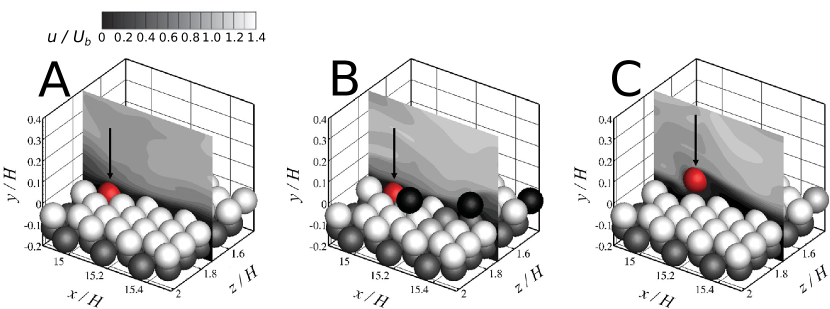
It can be seen that, at the instant of entrainment, the instantaneous streamwise flow velocity () exhibits larger-than-average values (Figure 14c). In fact, Vowinckel et al. (2016) reported that of the entrainment events were caused by sweep, characterized by positive fluctuations of and negative fluctuations of the flow velocity component in the direction normal to the bed.
The results by Vowinckel et al. (2016) were obtained for an idealized hexagonal packing and may not necessarily apply in their full extent to realistic sediment beds found in nature. While for a hexagonal packing, the vast majority of entrainment events are initiated by particle-bed impacts, it remains unclear whether this holds true also for natural sediment beds, in which bed surface particles tend to protrude much more strongly into the flow. On the one hand, a larger protrusion makes it easier for a turbulent fluctuation event to entrain a bed surface particle without a preceding particle-bed impact. On the other hand, particle-bed impacts can result in entrainment without the need of a turbulent fluctuation event (see section 4.1.3).
4.1.3 The Role of Particle-Bed Impacts in Sustaining Continuous Sediment Transport
Pähtz and Durán (2017) numerically studied the role of particle-bed impacts in sustaining continuous nonsuspended sediment transport for transport conditions characterized by a large range of the Shields number , density ratio , and Galileo number . These authors coupled quasi-two-dimensional DEM simulations for the particle phase with a Reynolds-averaged description of the fluid hydrodynamics that neglects turbulent fluctuations around the mean turbulent flow. While such simulations cannot resolve entrainment by turbulent fluctuation events, they are able to elucidate the importance of entrainment by particle-bed impacts relative to entrainment by the mean turbulent flow. Also, the absence of turbulent fluctuations eliminates transport intermittency in the sense that transport in the simulation domain is either continuous (i.e., periods of rest are absent) or it completely stops after a finite time (except for potential creeping, see section 2.3). From their simulations, Pähtz and Durán (2017) determined an effective value of the local particle velocity averaged over elevations near the bed surface () relative to the critical velocity that is needed to escape the potential wells set by the pockets of the bed surface (, where is the value of the gravity constant reduced by the buoyancy and added mass force, with the added mass coefficient). They found that exhibits a universal approximately constant value of order unity for continuous nonsuspended sediment transport if the following constraint is obeyed:
| (28) |
The interpretation of is that particles located near the bed surface (which includes both particles of the bed and transported particles) are on average at the verge of leaving it or being captured by its potential wells, consistent with a dynamic equilibrium that is solely controlled by particle inertia. This implies that entrainment occurs solely due to the action of particle-bed impacts. Consistently, Pähtz and Durán (2017) observed from visually inspecting simulations that obey equation (28) that every entrainment event is initiated by a particle-bed impact, usually with a small time delay between the instant of impact and beginning visible motion. In contrast, for transport conditions that do not obey equation (28), exhibits a smaller value, which means that the mean turbulent flow must assist particles located near the bed surface in escaping the potential wells. For bedload transport, the findings by Pähtz and Durán (2017) were independent of the effective normal restitution coefficient for a damped binary collision, which indicates that viscous damping does not suppress impact entrainment (see also the discussion of viscous damping in section 4.1.1).
The constraint set by equation (28) is obeyed by the vast majority of sediment transport regimes, including turbulent fluvial bedload transport. That is, for the absence of turbulent fluctuation events, only viscous fluvial bedload transport is significantly affected by the entrainment of bed sediment by the mean turbulent flow. The numerical prediction that impact entrainment dominates entrainment by the mean turbulent flow in turbulent fluvial bedload transport is supported by experiments (Heyman et al., 2016; Lee and Jerolmack, 2018). Lee and Jerolmack (2018) studied bedload transport driven by a water flow in a quasi-two-dimensional flume (i.e., its lateral dimension was only slightly larger than the particle diameter ). Because the size of turbulent structures, and thus turbulent fluctuation events, is strongly suppressed when the system dimensions are so strongly narrowed down, their experiments are somewhat comparable to the numerical simulations by Pähtz and Durán (2017) described above. Lee and Jerolmack (2018) fixed the water discharge and fed particles at the flume entrance with varying frequency (the tested range of was likely associated with a transport rate below capacity). In contrast to similar older experiments (Böhm et al., 2004; Ancey et al., 2008; Heyman et al., 2013), the bed was relatively deep, which ensured the complete dissipation of shock waves associated with particle-bed impacts (Rioual et al., 2003). Lee and Jerolmack (2018) reported that, for all tested conditions, every entrainment event is initiated by a particle-bed impact, exactly as numerically predicted, and that the number of transported particles roughly scales with the energy transferred to the bed by rebounding particles. The latter finding is remarkably similar to the scaling of the average ejected particle number in static bed experiments (e.g., see equation (25)). Lee and Jerolmack (2018) also measured the frequency of particles passing an illuminated window near the flume exit (). They found that for sufficiently small and that once exceeds a critical value.
Similar observations were made by Heyman et al. (2016), who used a water flume with a narrow but larger width () than Lee and Jerolmack (2018) and who also used a relatively deep bed. Heyman et al. (2016) measured that the entrainment rate was proportional to the number of transported particles per unit bed area, which is indirect evidence supporting that the majority of entrainment events is caused by particle-bed impacts. These authors also reported for all their tested feeding frequencies that the entrainment and deposition rate are equal to one another, in resemblance of the measurement for sufficiently large by Lee and Jerolmack (2018). Note that one expects the approximate equality to break down for large (when the influx exceeds transport capacity) because increasing momentum transfer from fluid to particles slows down the flow, which at some point can no longer sustain the particle motion.
The results by Heyman et al. (2016) and Lee and Jerolmack (2018) suggest that mainly (but not solely) particles that were previously in motion are being entrained by particle-bed impacts. Otherwise, there would be no reason to expect that the entrainment and deposition rate are relatively equal to one another for a large range of (instead, one would expect that only for transport capacity). This can be explained when assuming that particle-bed impacts are effective in mobilizing a bed particle almost only when the bed particle exceeds a critical energy level just before the impact. On the one hand, this assumption would explain why bed particles that have never been transported only rarely become mobilized by particle-bed impacts. On the other hand, this assumption is consistent with the fact that a transported particle that has just been captured by a bed pocket exhibits a residual kinetic energy that takes some time to be completely dissipated, during which it can be remobilized by an impact from a particle coming from behind. It seems that, once exceeds a critical value, there is usually a particle coming from behind in time and transported particles can only rarely settle completely even though they may temporarily stop. Temporary particle stops and reentrainment make transported particles tend to move in clusters near the flume exit even though they are apart from one another at the flume entrance, which is exactly what Lee and Jerolmack (2018) reported and what can be observed in the numerical simulations by Pähtz and Durán (2018a, Movie S2).
There is evidence that the presumed impact entrainment mechanism described above may play an important role in nonsuspended sediment transport in general. In fact, in simulations of steady, homogenous sediment transport using DEM-based numerical models that neglect turbulent fluctuations around the mean turbulent flow, the steady state transport rate exhibits a discontinuous jump at a fluid shear stress (Carneiro et al., 2011, 2013; Clark et al., 2015a, 2017; Pähtz and Durán, 2018a). That is, for , transport is significantly larger than zero () and continuous, whereas when . Assuming that only impact entrainment took place in all these simulations (as the mean turbulent flow is too weak for entrainment, see above), can be identified as the impact entrainment threshold. The discontinuous jump of thus means that, in order for impact entrainment to sustain transport, a critical transport rate must be exceeded. Like the critical feeding frequency in the experiments by Lee and Jerolmack (2018), this critical transport rate may be interpreted as the value above which most transported particles can be captured only temporarily by bed pockets as they are usually hit in time and thus reentrained by an impact from a particle coming from behind before dissipating too much of their kinetic energy. However, it is crucial to point out that impact entrainment of bed particles that have never been transported occasionally occurs in DEM-based sediment transport simulations as well, which is why a further interpretation of the physical origin of the discontinuous jump of has been proposed (Pähtz and Durán, 2018a). It states that, at a critical transport rate, bed surface particles do no longer sufficiently recover between successive particle-bed impacts. They thus accumulate energy between successive impacts until they are eventually entrained. In contrast, for subcritical transport rates, particles sufficiently recover between impacts so that impact entrainment is inefficient, causing transport to eventually stop. The two interpretations above are based only on the energy of bed particles or temporarily captured transported particles. In contrast, in the context of an idealized continuous rebound modeling framework (see section 4.2), an alternative mechanism based on the critical amount of energy that bed particles need to acquire for entrainment (more precisely, for entering a quasi-continuous motion) can explain the discontinuous jump of without further assumptions (see section 4.2.1).
Open Problem: Precise Mechanism of Impact Entrainment in Continuous Transport
The proposed impact entrainment mechanisms described above and in section 4.2.1 are mostly speculative and based on indirect experimental or theoretical evidence, or idealized models. More direct investigations are therefore needed to uncover the precise nature of impact entrainment and the degree to which each of these mechanisms contributes. Such investigations may also help to better understand fluctuations of nonsuspended sediment transport. For example, the longer the average time it takes for transport to stop (in the absence of turbulent fluctuations around the mean turbulent flow) when ( obeys a critical scaling behavior at , see section 2.4), the larger are the transport autocorrelations, which can be quite substantial in fluvial bedload transport (Heathershaw and Thorne, 1985; Drake et al., 1988; Dinehart, 1999; Ancey et al., 2006, 2008, 2015; Martin et al., 2012).
Open Problem: Precise Definitions of Intermittent and Continuous Transport
As explained above, in simulations of steady, homogenous sediment transport using DEM-based numerical models that neglect turbulent fluctuations, the steady transport rate (in a time-averaged sense) exhibits a discontinuous jump at the impact entrainment threshold . In contrast, for most natural conditions, fluid entrainment by turbulent events can reinitiate transport whenever it temporarily stops, meaning that remains significant below (Carneiro et al., 2011). Hence, since turbulent events capable of fluid entrainment occur only at an intermittent basis (see section 3), Pähtz and Durán (2018a) suggested that is equivalent to the continuous transport threshold for most natural conditions and that transport becomes intermittent below . However, provided that fluid entrainment does occur, it is certain to find particles being in transport below at any given instant in time in the large-system limit, which renders the distinction between intermittent and continuous transport somewhat ambiguous. For this reason, Pähtz and Durán (2018a) referred to intermittent conditions as those that deviate significantly from transport capacity (defined as in section 4.2.2). Consistently, Martin and Kok (2018) and Comola et al. (2019b) found from aeolian field experiments that the long-term-averaged transport remains at capacity when the fraction of active saltation transport is close to unity, that is, when transport quantified over a short but somewhat arbitrary time interval (s (Martin and Kok, 2018) or s (Comola et al., 2019b)) almost never stops. Interestingly, Comola et al. (2019b) showed that the value of can be indirectly estimated from the lowpass-filtered wind speed associated with large and very large scale turbulent structures (cutoff frequency Hz). Alternatively, for their coupled DNS/DEM simulations of fluvial bedload transport, González et al. (2017) fitted continuous functions to the distributions of the discrete transported particle number (defined as the number of particles faster than a somewhat arbitrary velocity threshold) at different and identified the onset of continuous transport as the value of at which these fitting functions predict a zero probability for a vanishing particle number. Future studies should investigate the compatibility of these and other definitions of continuous transport.
Controversy: Threshold of Continuous Aeolian Saltation Transport
In the opinion of the authors, the evidence reviewed above for the hypothesis that continuous transport occurs once impact entrainment alone is sufficient in compensating random captures of transported particles is quite strong. (In other words, significant fluid entrainment may occur in continuous transport—and does so quite likely in aeolian saltation transport given that the turbulent intensity within the saltation transport layer increases with the sediment transport rate (Li and McKenna Neuman, 2012)—but it is not needed to sustain continuous transport.) However, it is worth pointing out that most aeolian researchers prefer a different narrative for aeolian saltation transport. For example, Martin and Kok (2018) assumed that continuous aeolian saltation transport in the field occurs once the saltation transport initiation threshold () is exceeded, whereas the impact entrainment threshold describes the cessation of intermittent saltation transport. This assumption is based on the idea that fluid entrainment continuously provides the transport layer with bed particles. However, this idea is problematic because turbulent events capable of fluid entrainment occur only at an intermittent basis (see section 3). The interested reader is also referred to the commentary by Pähtz (2018), in which this controversy is extensively discussed.
4.2 Continuous Particle Rebounds and Transport Capacity
In order for the mean turbulent flow to sustain the motion of particles that are already in transport, it needs to compensate, on average, the energy dissipated in particle-bed rebounds via drag acceleration during the particle trajectories. This mechanism, which is illustrated in detail by means of a thought experiment in section 4.2.1, gives rise to a shear stress threshold of sediment transport (henceforth termed rebound threshold), as was already noted by Bagnold (1941, p. 94) for aeolian saltation transport: “Physically [the rebound threshold] marks the critical stage at which the energy supplied to the saltating grains by the wind begins to balance the energy losses due to friction when the grains strike the ground [and rebound].” It also suggests a clear-cut definition of transport capacity, which is otherwise difficult to define (see review by Wainwright et al., 2015, and references therein), that leads to an experimentally and numerically validated universal scaling of the transport load (i.e., the mass of transported sediment per unit bed area) with the fluid shear stress (section 4.2.2). From the appearance of the rebound threshold in this scaling of , one can conclude that at a significant if not predominant portion of the threshold measurements by Shields (1936) and others have been misidentified as measurements of the entrainment threshold (section 4.2.3).
4.2.1 Particle Rebounds Along a Flat Wall
To illustrate the concept of continuous particle rebounds, the motion of a particle along a flat wall driven by a constant flow (e.g., the mean turbulent flow) is considered. This particle shall never be captured and instead, for illustration purposes, always rebound with a constant angle and lose a constant fraction of its impact energy (the core of the argument will not significantly change if more sophisticated rebound laws, such as equations (20)–(22), are considered). For this idealized scenario, there are two extremes of possible particle trajectories depending on the initial particle velocity , which are sketched in Figure 15.
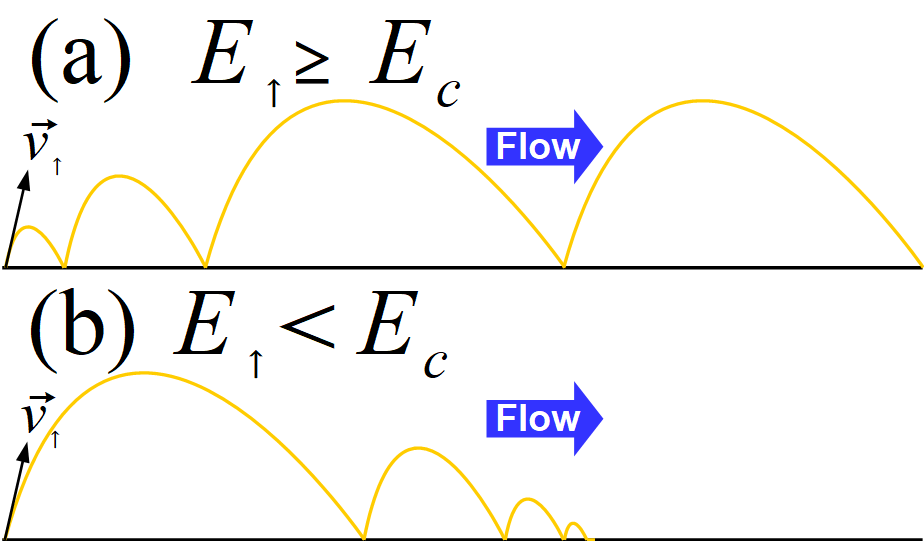
First, if the corresponding initial kinetic energy exceeds a critical value , the particle will spend sufficiently long within the flow so that it gains sufficient energy via fluid drag during its hops to approach a steady, periodic hopping motion, in which its energy gain via fluid drag is exactly balanced by its energy loss during its rebounds (Figure 15a). Henceforth, such particles are termed continuous rebounders. Second, if , the particle loses net energy in its initial and all subsequent hops until it stops (Figure 15b). The critical energy depends on properties of the flow. Crucially, if the flow is too weak, all possible trajectories fall into the second category (i.e., ).
There are a few takeaways from the this simple thought experiment for realistic systems. First, as the mean turbulent flow is controlled by the fluid shear stress , it suggests the existence of a rebound threshold below which the energy losses in particle-bed rebounds cannot be compensated by the flow on average (Jenkins and Valance, 2014; Berzi et al., 2016, 2017; Pähtz and Durán, 2018a; Pähtz et al., 2020). Second, the randomness introduced by inhomogeneities of the bed and turbulent fluctuations of the flow introduce trajectory fluctuations that can lead to random losses of continuous rebounders, particularly when the lift-off energy accidentally falls below (Pähtz and Durán, 2018a). Such losses must be compensated by the entrainment of bed particles into the continuous rebound layer. Hence, the mere mobilization of bed particles is not sufficient because the lift-off energy of mobilized particles must also exceed . In particular, for rebound threshold models (see section 4.3), it has been shown that becomes equal to the average rebound energy of continuous rebounders in the limit (Pähtz et al., 2020). This implies that the impact entrainment threshold must be strictly larger than , since the energy of an entrained particle is much smaller than the energy of the particle that caused its entrainment (i.e., a continuous rebounder) because of energy conservation. In particular, automatically explains the discontinuous jump of the sediment transport rate at that has been observed in the absence of fluid entrainment by turbulent fluctuation events (see section 4.1.3) because is controlled by the excess shear stress in the absence of such events (see section 4.2.2).
4.2.2 Transport Capacity Interpretation Based on Continuous Rebounds
A third takeaway for realistic systems of the thought experiment described in section 4.2.1 involves the fact that, because of momentum transfer from flow to particles, the flow slows down with increasing transport load . Hence, for a given , provided that there is an abundance of impact and/or fluid entrainment, the system tends to entrain bed material until the mean turbulent flow becomes so weak that it can barely sustain the average motion of continuous rebounders (Pähtz and Durán, 2018b). Any further slowdown of the flow would then spike the deposition rate, leading to a decrease of and subsequent increase of the flow speed. That is, the system is at a dynamic equilibrium that may be interpreted as transport capacity.
Pähtz and Durán (2018b) analytically showed that this interpretation of transport capacity leads to the capacity scaling
| (29) |
where is the buoyancy-reduced value of the gravitational constant and an approximately constant bed friction coefficient (i.e., the ratio between the particle shear stress and normal-bed particle pressure evaluated at the bed surface). Note that the definitions of and (and thus ), in contrast to the definitions of and (and thus the yield stress ratio , see section 2.1), include contributions from stresses associated with the particle fluctuation motion in addition to contributions from intergranular contacts. The derivation of equation (29) by Pähtz and Durán (2018b) is based on two main steps: showing the approximate constancy of starting from a geometric constraint on particle-bed rebounds in the steady state and assuming , which expresses the aforementioned dynamic equilibrium condition associated with the continuous rebound motion. Interestingly, describes the momentum that is transferred from flow to transported particles per unit bed area per unit time, which implies that high-buoyant fluids (small ), such as water, require a larger transport load for a given rate of momentum transfer (i.e., for a given ) than low-buoyant fluids (large ), such as air. Pähtz and Durán (2018b) tested these derivation steps with numerical data from DEM-based simulations of nonsuspended sediment transport (the same as those by Pähtz and Durán (2017), see section 4.1.3). It turned out that these steps, and thus equation (29), are obeyed across nonsuspended sediment transport conditions with (all but relatively viscous bedload transport) provided that the bed surface is defined as the effective elevation of energetic particle-bed rebounds.
The functional form of equation (29) is the foundation of the majority of theoretical and experimental shear stress threshold-based expressions for the capacity transport rate, (where is the average streamwise velocity of particles moving above the bed surface), and goes back to the pioneering theoretical descriptions of nonsuspended sediment transport by Bagnold (1956, 1966, 1973). However, Bagnold’s physical interpretation of the assumptions leading to this scaling was inaccurate: is not equal to and is not an entrainment threshold, as Bagnold assumed (Pähtz and Durán, 2018b). In fact, equation (29) has no association with sediment entrainment whatsoever, except for the fact that sediment entrainment is a necessary requirement to keep transport at capacity (Pähtz and Durán, 2018b).
As explained in section 4.1.3, , and thus , is significantly larger than zero at the impact entrainment threshold . In particular, transport becomes intermittent for or even stops in the absence of entrainment by turbulent fluctuation events (i.e., transport capacity cannot be sustained). Hence, equation (29) is, in general, valid only for and also consistent with the rebound threshold model prediction (see section 4.2.1). Note that aeolian saltation transport experiments (Carneiro et al., 2015; Martin and Kok, 2018) and coupled DNS/DEM fluvial bedload transport simulation (González et al., 2017), indeed, very roughly suggest and , respectively. In order to extend the validity of equation (29), and thus of standard sediment transport rate relationships, to shear stresses with , one must abandon long-term averaging sediment transport data. Instead, it is necessary to conditionally average (or ) only over periods of near-capacity transport (on short-term average), but ignore periods with transport significantly below capacity or even at rest (Bunte and Abt, 2005; Singh et al., 2009; Shih and Diplas, 2018; Comola et al., 2019b). Likewise, for realistic fluvial bedload transport, it is necessary to exclude the turbulence-driven fluctuation motion (including turbulent entrainment events) when measuring for equation (29) to remain valid; otherwise, transport does not vanish for . Salevan et al. (2017) demonstrated that implementing such constraints in the analysis of experimental data is, in principle, possible. By separating the velocity distribution of all measurable particles (including those that are visually perceived as resting) into a Student’s -distribution associated with the turbulence-driven fluctuation motion and an exponential distribution associated with the bulk transport of particles (which automatically implies conditional averaging as periods of rest do not affect this distribution), they obtained a measure for the number of transported particles relative to the total number of bed surface particles (). This measure, indeed, vanishes within experimental precision below a Shields number threshold (Figure 16a), which can be interpreted as , whereas the number of particles that are faster than a certain velocity threshold remains nonzero for the entire range of because of the turbulence-driven fluctuation motion (Figure 16b).
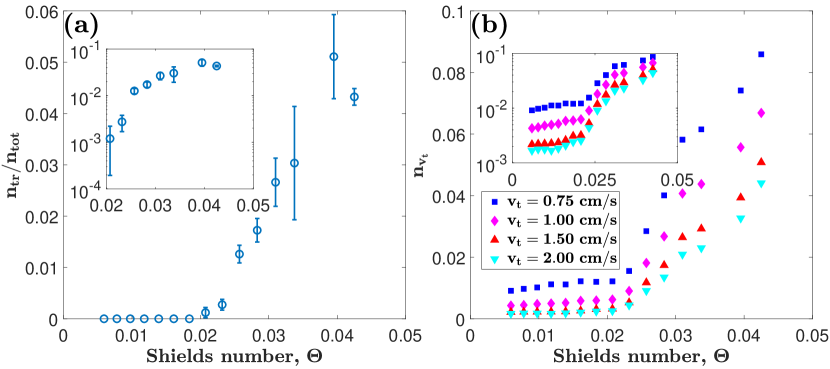
4.2.3 Does the Shields Diagram Truly Show Incipient Motion Thresholds?
The Shields diagram is a compilation of measurements of the threshold Shields number as a function of the shear Reynolds number , which have been labeled as measurements of incipient sediment motion by numerous studies and reviews (e.g., Shields, 1936; Miller et al., 1977; Yalin and Karahan, 1979; Parker and Klingeman, 1982; van Rijn, 1984; Wiberg and Smith, 1987; Ling, 1995; Buffington and Montgomery, 1997; Dey, 1999; Paphitis, 2001; Cao et al., 2006; Dey and Papanicolaou, 2008; Ali and Dey, 2016; Dey and Ali, 2018, 2019; Yang et al., 2019, and references therein). However, incipient motion of turbulent fluvial bedload transport is much better characterized by impulse and energy-based criteria (section 3.2), unless one refers to the Shields number at which the fluid entrainment probability exceeds zero (section 3.3), which is much below the Shields curve (Paintal, 1971). Furthermore, in steady, homogenous turbulent fluvial bedload transport in which turbulence is suppressed (e.g., in narrow water flumes), the vast majority of entrainment events is caused by particle-bed impacts (see section 4.1.3). It is therefore here argued, based on the results reviewed in section 4.2.2, that many of the threshold data compiled in the Shields diagram are actually measurements of the rebound threshold .
The Shields diagram shows two kinds of threshold measurements obtained using two different methods. The first method is the reference method, where one takes paired measurements of and the nondimensionalized transport rate (or transport load ) and extrapolates them to the Shields number at which (or ) either vanishes (e.g., Shields, 1936) (it is slightly controversial whether Shields really used this method (Buffington, 1999)) or equals a small reference value (e.g., Parker and Klingeman, 1982). This method yields approximately the rebound threshold if an expression for (or ) based on equation (29) is used for the extrapolation and provided that the data used for the extrapolation are at capacity (i.e., ). For example, Lajeunesse et al. (2010) extrapolated their measurements (many data points obeyed ) to using exactly equation (29), yielding exactly . That the reference method yields the rebound threshold is further supported by the fact that the values of obtained from the DEM-based fluvial bedload transport simulations by Pähtz and Durán (2018a) are consistent with the compilation of reference method-based threshold measurements by Buffington and Montgomery (1997).
The second method is the visual method, where one increases until criteria defining what is considered critical transport are obeyed (e.g., Kramer, 1935) (see section 1). The threshold values obtained from this method depend significantly on the chosen criterion and are, on average, close to those obtained from the reference method (Buffington and Montgomery, 1997). For example, the transition point at which the function measured in the gravel-bed experiments by Paintal (1971) changed from to (see section 1) is indistinguishable from the reference threshold for the same conditions within measurement uncertainty. In particular, a close examination of Paintal’s and other gravel bed data has revealed that Paintal’s power-16 region can actually be subdivided into two regions (Dey and Ali, 2019, Figure 5) (see also (Shih and Diplas, 2019, Figure 8b)): one region () with a milder power law and one with a stronger power law (), which includes a jump of by an order of magnitude at . Such a jump is consistent with exceeding the rebound threshold because transported particles suddenly become able to move along the surface for comparably long times before being captured by the bed. Hence, it seems that also the visual method, at least for typical critical transport criteria, approximately yields the rebound threshold rather than an entrainment threshold.
The hypothesis that the Shields diagram shows measurements of the rebound threshold is further supported by the fact that certain rebound threshold models (Pähtz and Durán, 2018a; Pähtz et al., 2020) reproduce the Shields curve without fitting to the experimental data compiled in the Shields diagram (see section 4.3), even when limited to only visually measured data (Pähtz et al., 2020).
4.3 Sediment Transport Cessation Models
This section reviews theoretical models for both the rebound threshold and impact entrainment threshold . One of the early motivations for developing such models was to better understand the hysteresis between the initiation and cessation of aeolian saltation transport observed in wind tunnel experiments (e.g., Bagnold, 1941; Chepil, 1945; Iversen and Rasmussen, 1994; Carneiro et al., 2015). While the difference between transport initiation and cessation is relatively small on Earth, wind tunnel experiments and observations suggested a substantial difference on Mars, which needed to be explained (Almeida et al., 2008; Kok, 2010b). (However, note that extrapolating wind tunnel measurements of the initiation threshold to field conditions using standard initiation threshold models is actually inappropriate because depends on the boundary layer thickness , as discussed in section 3.3.) Later on, cessation threshold models were developed with the purpose to unify fluvial bedload and aeolian saltation transport in a single theoretical framework (Berzi et al., 2016; Pähtz and Durán, 2018a; Pähtz et al., 2020).
As cessation threshold models are associated with a sustained motion of transported particles, they require a physical description of the particle motion within the transport layer that is coupled with boundary conditions that describe the interaction between transported particles and the bed surface. In general, there have been two approaches to describe the transport layer and bed interactions. The first approach consists of representing the entire particle motion by particles moving in identical periodic trajectories along a flat wall that mimics the bed surface (section 4.3.1). The second approach consists of deriving general correlations between transport layer-averaged physical quantities and obtain the correlation coefficients from numerical simulations (section 4.3.2). It will be shown that the latter approach is probably a rough approximation of a variant of the former. Correlation-based model equations elucidate the role that the density ratio plays for the rebound threshold in a simple manner and therefore provide a simple conceptual explanation for why is smaller in aeolian saltation than in fluvial bedload transport (section 4.3.3).
Open Problem: Effect of Cohesion on Transport Cessation Thresholds
Most of the sediment transport cessation threshold models reviewed here account for cohesive interparticle forces and do so in a similar manner as transport initiation threshold models. However, Comola et al. (2019a) recently revealed that the effects of cohesion on transport cessation and initiation thresholds are actually fundamentally different from one another, which is why this section only considers versions of existing cessation threshold models for cohesionless particles. The effect of cohesion on transport cessation thresholds remains a major open problem.
4.3.1 Identical Periodic Trajectory Models (IPTMs)
Most studies proposing cessation threshold models start with the assumption that the motion of transported particles can be represented by a system in which all particles hop in the same periodic trajectory, referred to as the average trajectory, driven by the mean turbulent flow along a flat wall, with which they interact according to certain boundary conditions (Claudin and Andreotti, 2006; Kok, 2010a; Berzi et al., 2016, 2017; Pähtz et al., 2020). (Note that, although Kok (2010a) does not explicitly refer to identical periodic trajectories, his mathematical treatment of the problem is equivalent to IPTMs.) However, the assumption of identical periodic particle trajectories introduces a variety of potentially major weaknesses, which has cast doubt on the reliability of IPTMs (Andreotti, 2004; Lämmel and Kroy, 2017; Pähtz and Durán, 2017, 2018a):
-
1.
In IPTMs, the particle concentration increases with elevation and jumps to zero when exceeds the hop height (Anderson and Hallet, 1986). In contrast, in real nonsuspended sediment transport, it monotonously decreases with , often exponentially (e.g., Durán et al., 2012). IPTMs that refer only to the motion of a well-defined species of particles (e.g., continuous rebounders) do not necessarily suffer from this weakness because the concentration profile associated with this species may behave differently from that of the entire ensemble of transported particles.
-
2.
In IPTMs, the mean square of the vertical particle velocity () decreases with . In contrast, in real nonsuspended sediment transport, it increases with , except far from the bed surface (Pähtz and Durán, 2017). This behavior is a signature of the fact that the transport layer, in general, consists of different species of particles with different characteristic velocities (e.g., Durán et al., 2011, Figure 21). That is, IPTMs that refer only to the motion of a well-defined species of particles (e.g., continuous rebounders) do not necessarily suffer from this weakness.
-
3.
Only particles that take off from the wall with an energy that is larger than a critical value can continue their motion after the initial few hops (Figure 15). That is, IPTMs that take into account the motion of entrained particles (Claudin and Andreotti, 2006; Kok, 2010a) effectively assume that all entrained particles obey even though most of them do not (Pähtz and Durán, 2018a).
-
4.
IPTMs neglect particle motion via rolling and sliding, which is significant in bedload transport.
Depending on the boundary conditions, three conceptually different kinds of IPTMs can be distinguished:
-
1.
Models of the rebound threshold consider only the dynamics of continuous rebounders. Their rebounds are described, for example, by equations (12b) and (13), which link the streamwise () and normal-wall () components of the impact velocity to the streamwise and normal-wall components of the rebound velocity . Such models then look for the smallest Shields number that results in a periodic trajectory under the constraint that the hop height of particles exceeds one particle diameter (). This constraint ensures consistency with the underlying model assumption that continuous rebounders are never captured by the bed surface. The threshold resulting from this constraint is denoted as . Pähtz et al. (2020) modified this constraint to take into account that the near-surface flow can assist particles in escaping the bed surface and is even predominantly responsible for the escape in the viscous bedload transport regime. These authors’ escape criterion reads , where is the viscous fluid entrainment threshold (see section 2.1), the pocket angle for particles resting within the deepest pockets of the bed surface, and . This criterion means that the rebound kinetic energy only needs to uplift a particle rebounding within the deepest pocket to a point at which the near-surface flow is able to push it out of the pocket. The threshold resulting from this modified constraint is denoted as .
-
2.
Models of the impact entrainment threshold (Claudin and Andreotti, 2006; Kok, 2010a) do not neglect captures of continuous rebounders and therefore take into account the entrainment of bed particles. One possible way to do this is by combining rebound boundary conditions with an additional constraint that describes that one particle leaves the surface per impact on average (e.g., (Claudin and Andreotti, 2006)). However, the incorporation of entrained particles as part of the average trajectory leads to consistency problems (see third point in the list above).
-
3.
Hybrids between continuous rebound and impact entrainment models (Berzi et al., 2016, 2017) look for the smallest Shields number (denoted as ) that results in a periodic trajectory under the constraint (like before) and the additional constraint that particle-bed impacts do not lead to entrainment. Berzi et al. (2016, 2017) modeled the latter constraint via (cf. equation (17)), which assumes that the fastest particles represented by the average trajectory of continuous rebounders do not exceed the value of the nondimensionalized impact velocity that is associated with the onset of entrainment (which can be roughly justified by assuming an even impact velocity distribution between and ). However, Pähtz and Durán (2018a) pointed out that this additional constraint is inconsistent with the experimental and numerical evidence that impact entrainment to be effective requires that the transport rate is significantly larger than zero (see section 4.1.3), which is never the case at the rebound threshold in the absence of entrainment by turbulent fluctuation events (see section 4.2.2 and equation (29)). Consistently, Pähtz et al. (2020) showed that, in the limit , identical periodic trajectories of continuous rebounders are unstable against trajectory fluctuations. That is, the energy that a particle must acquire upon entrainment to become a continuous rebounder is equal to the rebound energy of the continuous rebounder that has entrained it in this limit. This requirement contradicts the fact that the entrainment energy is much smaller than the rebound energy because of energy conservation, which implies that impact entrainment is impossible in this limit (see also discussion in section 4.2.1).
Apart from these conceptual differences, existing IPTMs differ in several details (partly summarized in Table 1): the form of the fluid drag law, the consideration or neglect of vertical drag forces on the particle motion, the form of the mean flow velocity profile (including the question of whether the viscous sublayer of the turbulent boundary layer is considered; for more details, see Appendix), and the bed boundary conditions (including the incorporation of viscous damping in the rebound laws).
| Study | Model | Vertical drag | Viscous sublayer | Viscous damping | Boundary Conditions |
|---|---|---|---|---|---|
| CA06 | yes | yes | no | ||
| K10 | yes | no | no | complex | |
| B16/17 | no | no | yes | eqs. (12b) and (13) | |
| P19 | yes | yes | no | eqs. (12b) and (14) |
In this regard, it is reiterated that the effects of viscous damping on the dynamics of particle-bed rebounds are probably negligible for bedload transport (for which viscous damping is deemed as potentially significant), even for conditions with strongly damped binary particle collisions (see section 4.1.1).
In order to facilitate a comparison between the different model types that does not depend on modeling details but focuses only on conceptual differences, the same mean flow velocity profile (equation (A1), which includes the viscous sublayer), boundary conditions (equations (20) and (21)), and fluid drag law (the drag law by Camenen (2007)) are used for all model types. Following the trajectory calculation by Pähtz et al. (2020), the impact velocity as a function of the rebound velocity approximates as
| (30a) | ||||
| (30b) | ||||
where is the hop time, the principal branch of the Lambert- function, the dimensionless value of the settling velocity (defined in equation (31)), the average elevation of the particles’ center during particle-bed rebounds (obtained from experiments (Dey et al., 2012; Hong et al., 2015)), and expresses the nonfluctuating wall-bounded flow after Guo and Julien (2007), with the function given in equation (A1). Furthermore, the hat denotes nondimensionalized quantities using combinations of and , which is given by
| (31) |
where and are parameter values associated with the drag law for naturally shaped particles. Equations (20), (21), (30a), and (30b) can be iteratively solved for . Then the thresholds are obtained from
| (32a) | ||||
| (32b) | ||||
| (32c) | ||||
| (32d) | ||||
where the hop height is given by (for small , ). In equations (32a)–(32d), the rebound threshold is the only modeled cessation threshold that is linked to the viscous yield stress and thus to dense granular flow rheology (see section 2.1). In a complete model covering all transport regimes, such a connection must exist because represents an upper limit to any kind of cohesionless sediment transport threshold. Also, a complete model of any kind of cohesionless transport threshold must reach this maximum value in the limit of vanishing particle inertia (i.e., when typical particle velocities during a trajectory become much smaller than ). The characteristic particle velocity scale in IPTMs is given by the settling velocity , which scales as in the viscous regime (Eq. (31) for small ). That is, a complete model of any kind of cohesionless transport threshold must approach in the limit , where can be interpreted as a Stokes-like number (Berzi et al., 2016, 2017; Clark et al., 2017; Pähtz and Durán, 2018a).
Figures 17a, 17b, and 18a show the thresholds calculated by equations (32a)-(32d) as a function of for five different density ratios (2.65, 40, 190, 2200, and 250000) corresponding to five different fluvial or aeolian conditions (Water, Venus, Titan, Earth, and Mars).
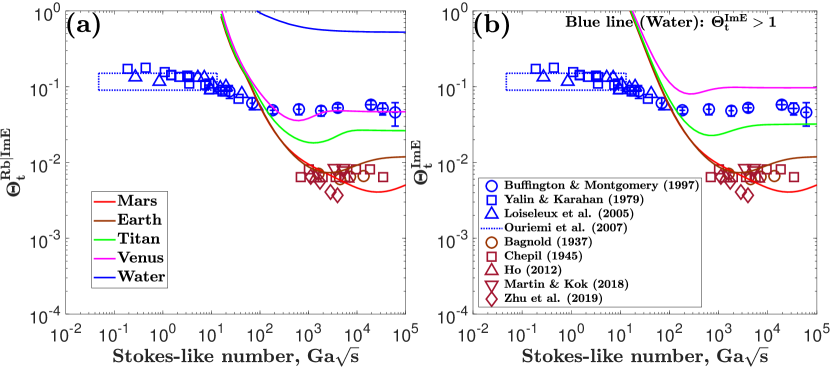
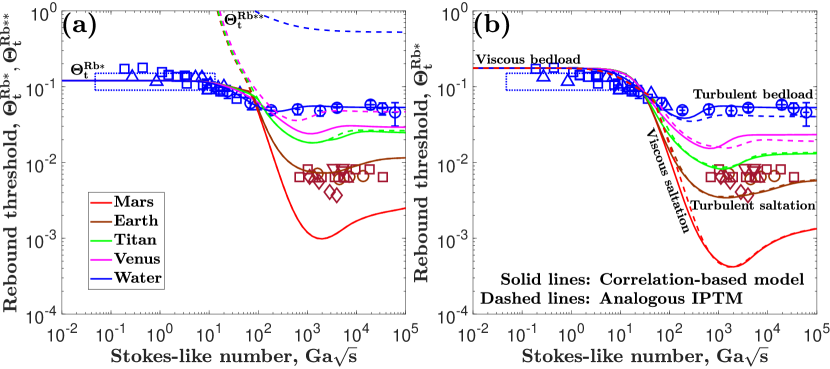
These figures also show cessation threshold measurements obtained for nearly cohesionless conditions using different experimental methods. For turbulent bedload transport driven by water, the compilation of reference method-based measurements (measurement mean and its confidence interval) by Buffington and Montgomery (1997), which make up a large portion of the Shields diagram, is shown. As explained in section 4.2.3, this method yields approximately the rebound threshold . For viscous bedload transport driven by water-oil mixtures, the visual incipient motion measurements by Yalin and Karahan (1979) and Loiseleux et al. (2005) and cessation threshold measurements by Ouriemi et al. (2007) are shown (for viscous bedload transport, the differences between transport initiation, rebound, and impact entrainment threshold are very small (Pähtz and Durán, 2018a)). For aeolian saltation transport, a few studies (e.g., Ho, 2012; Zhu et al., 2019) carried out an indirect extrapolation to vanishing transport to obtain using a proxy of : the surface roughness (see Appendix for its definition in the absence of transport), which undergoes a regime shift when saltation transport ceases. Furthermore, visual measurements of by Bagnold (1937) and Chepil (1945) are shown, obtained from successively decrementing until intermittent saltation transport stops. Direct measurements of the intermittent saltation transport threshold (and thus ), based on the so-called Time Frequency Equivalence Method (TFEM) (Wiggs et al., 2004), by Martin and Kok (2018) are also shown. Note that, although the evidence that the thresholds obtained from extrapolation to vanishing transport and from direct measurements of the cessation of intermittent saltation transport correspond to the rebound threshold is quite strong (see section 4.1.3 and 4.2.2), many aeolian researchers believe that they correspond to the impact entrainment threshold (e.g., Martin and Kok, 2018). One of the reasons for this belief can be seen in Figure 17b: the prediction of from equation (32c) is consistent with aeolian saltation transport data on Earth despite not containing fit parameters. In fact, for the range of conditions corresponding to these data, the predictions of and by equations (32a) and (32b) are equivalent and, coincidentally, very close to the predictions of and by equations (32c) and (32d), which are also equivalent to each other. At this point, it is worth reiterating that differences between the models caused by differences in the modeling details (e.g., those in Table 1) have been excluded here. Such detail differences cause the predictions of existing models to differ more strongly from one another than shown here.
Figures 17a, 17b, and 18a show that the predictions of , , and from equations (32b)–(32d) overestimate threshold measurements for fluvial bedload transport by at least an order of magnitude. For and , this overestimation is caused by the constraint in the minimization of that the particle hop height must exceed one particle diameter to escape the bed surface (equations (32b) and (32d)), preventing solutions with small particle velocities that would have a smaller threshold. However, the prediction of from equation (32a), which is based on a modified escape condition that takes into account the near-surface flow, is consistent with fluvial bedload transport conditions (Figure 18a). The simultaneous agreement of the prediction of from equation (32a) with aeolian and fluvial transport regimes strongly supports modeling nonsuspended sediment transport within the continuous rebound framework.
4.3.2 Models Based on Correlations Between Transport Layer-Averaged Physical Quantities
Existing correlation-based cessation threshold models start with the assumption of a constant bed friction coefficient (Pähtz et al., 2012; Pähtz and Durán, 2018a) ( is the inverse of the parameter in the model by Pähtz et al. (2012)). As discussed in section 4.2.2, the approximate constancy of has been analytically linked to continuous rebounds (Pähtz and Durán, 2018b). However, in contrast to the purely kinematic meaning of in IPTMs (equation (31)), for realistic nonsuspended sediment transport, conveys information about both the particle kinematics and interparticle contacts. Note that is also predicted by IPTMs when vertical drag forces are small (i.e., the buoyancy-reduced gravity force dominates the vertical motion) because this fixes and thus , , and via the rebound laws (Pähtz et al., 2020).
A constant links the average horizontal fluid drag acceleration to the buoyancy-reduced gravity via , where the overbar denotes a particle concentration-weighted height average (Pähtz and Durán, 2018a) (which is equal to the average over the hop time for IPTMs). This link subsequently fixes the value of the nondimensionalized average velocity difference (Pähtz et al., 2020) as a function of the Galileo number via equation (31). In fact, equation (31) is not limited to IPTMs but actually more general (Pähtz and Durán, 2018a). A further general correlation between and the nondimensionalized transport layer thickness can be obtained from approximating (Pähtz and Durán, 2018a). An analogous approximation is also involved in some IPTMs, namely, in the right-hand side of equation (30b), since in leading order in (i.e., when vertical drag forces are small). Up to this point, the two existing correlation-based models by Pähtz et al. (2012) and Pähtz and Durán (2018a) are equivalent. From now on, only the latter model is reviewed as it constitutes a substantial improvement of the former model in many regards. Pähtz and Durán (2018a) derived the further correlation , where is a proportionality constant. This correlation with is also predicted by IPTMs in the limit of small vertical drag forces. That is, up to here, the model by Pähtz and Durán (2018a) is effectively an IPTM that neglects vertical drag forces. The main differences between the model by Pähtz and Durán (2018a) and IPTMs lie in the latter two equations of the full set of model equations:
| (33a) | ||||
| (33b) | ||||
| (33c) | ||||
| (33d) | ||||
| (33e) | ||||
where , , , , and are the model parameter values that Pähtz and Durán (2018a) obtained from adjusting equations (33a)–(33e) to DEM-based simulations of nonsuspended sediment transport (the same kind of simulations as those by Pähtz and Durán (2017), see section 4.1.3). Equation (33d) contains two terms: a term () that is associated with the vertical motion of particles (equivalent to in IPTMs) and a term () that is associated with particle collisions and particle-bed contacts of particles moving above the bed surface level, which occur because of the surface texture (Pähtz and Durán, 2018a). A term analogous to the latter does not appear in existing IPTMs. Equation (33e) empirically merges two extremes. On the one hand, when the transport layer is completely submerged within the viscous sublayer of the turbulent boundary layer (small ), it predicts . For viscous bedload transport (i.e., when the transport layer is small: ), this correlation with is also predicted by IPTMs that employ the constrained minimization principle in equation (32a) to calculate the rebound threshold . For viscous saltation transport (i.e., when the transport layer is large: ), IPTMs of the rebound threshold that consider vertical drag forces also predict (Pähtz and Durán, 2018a). However, the proportionality constant exhibits a different value (but still near unity) that depends on . On the other hand, when most transport occurs within the log-layer of the turbulent boundary layer (large ), equation (33e) predicts , which also follows from the minimization principle for turbulent saltation transport (i.e., ) (Pähtz and Durán, 2018a). For these reasons, equation (33e) can be interpreted as a rough approximation of the constrained minimization in equation (32a) yielding . In fact, Figure 18b shows that the predictions of from the model by Pähtz and Durán (2018a) are similar to those from an analogous IPTM and that they are also consistent with measurements across aeolian and fluvial environments. The predictions from these two models differ for turbulent bedload transport (large and small transport layer: ), mainly because the scaling that equation (33e) predicts for large does not capture the outcome of the constrained minimization in equation (32a) for . The predictions from these two models also differ for viscous saltation transport because the model by Pähtz and Durán (2018a) neglects vertical drag forces at various instances. However, note that this model does not completely neglect vertical drag forces because the scaling that equation (33e) predicts for viscous saltation transport is associated with vertical drag (Pähtz and Durán, 2018a), which is why deviations between this model and the analogous IPTM are only moderate in this regime.
Open Problem: Reliable Models of the Impact Entrainment Threshold and Planetary Saltation Transport
Existing models of the impact entrainment threshold (Claudin and Andreotti, 2006; Kok, 2010a; Pähtz et al., 2012), which is arguably also the continuous transport threshold, do not take into account that the transport rate is significantly larger than zero at , even in the absence of entrainment by turbulent fluctuation events (see section 4.1.3). Instead, vanishes at the rebound threshold , which is smaller than (see section 4.2.2). Likewise, as mentioned before, existing models of effectively assume that all entrained particles exhibit a kinetic energy that allows them to participate in the continuous rebound motion even though most of them do not (Pähtz and Durán, 2018a). For these reasons, existing impact entrainment threshold models seem to be missing important physics and need to be improved. This is problematic for modeling and predicting extraterrestrial sediment transport and associated bedform evolution (e.g., Almeida et al., 2008; Bourke et al., 2010; Kok, 2010b; Ayoub et al., 2014; Lorenz, 2014; Rasmussen et al., 2015; Jia et al., 2017; Telfer et al., 2018; Durán Vinent et al., 2019) because most predictions of the aeolian saltation transport rate require that transport is continuous (i.e., at capacity).
4.3.3 Main Difference Between Aeolian and Fluvial Rebound Threshold
The most important difference between aeolian saltation and fluvial bedload transport is the largely different density ratio , which ranges from close to unity for oil and water to the order of for air on Mars. Equations (33a)-(33e) elucidate that affects the modeled rebound threshold in a relatively simple manner. In fact, it can be seen that explicitly appears only in Eq. (33d), which describes a monotonous increase of the dimensionless transport layer thickness with . Subsequently, monotonously increases the dimensionless transport layer-averaged flow velocity via equation (33b). That is, given a certain solution of equations (33a)–(33e), an increase of leads to an increase of , which must be compensated by a decrease of via a decrease of to achieve a new steady solution for the same Galileo number . This mathematical fact expresses the physical fact that particles that stay longer in the flow can feel a given effective flow forcing at a lower fluid shear stress, which is the ultimate reason for why decreases with for a given .
5 Summary and Outlook
Section 1 outlined five old, yet very significant, inconsistencies related to the concept of a threshold shear stress for incipient motion. For the concept of a threshold shear stress to be physically meaningful, these inconsistencies must be addressed and resolved. They can be briefly summarized as follows:
-
1.
By design, existing models of incipient motion capture the conditions to which they have been adjusted (aeolian or fluvial transport on Earth). However, the predictions from standard models adjusted to aeolian transport on Earth (Iversen and White, 1982; Shao and Lu, 2000) are in stark disagreement with recent observations of aeolian transport on Mars (e.g., Sullivan and Kok, 2017; Baker et al., 2018).
-
2.
Because of turbulent fluctuation events, fluid entrainment gives rise to fluvial bedload transport even for Shields numbers much below the Shields curve (Paintal, 1971), which is the curve that is thought to describe incipient motion.
-
3.
Below the respective shear stress threshold associated with incipient motion, turbulent fluctuation events are able to initiate fluvial bedload transport but not aeolian saltation transport. However, there is no reason to believe that the physics of incipient motion are different in aeolian and fluvial environments.
- 4.
-
5.
In old numerical simulations of turbulent fluvial bedload transport (no and García, 1998), it was recognized that the threshold shear stress obtained from extrapolating the simulated capacity transport rate to vanishing transport may not be associated with fluid entrainment. This is problematic because many of the threshold data compiled in the Shields diagram have been obtained from such or similar extrapolation methods (e.g., Shields, 1936).
As a result of the latest research reviewed in sections 2–4, a new conceptual picture has emerged (section 5.1) that resolves these problems. However, it must be emphasized that this conceptual picture represents the authors’ synthesis of the current state of the art, and many aeolian and fluvial geomorphologists may disagree. This is because, in some places, it stands in stark contrast to what has been a century old consensus. Likewise, there are still many open problems and controversies, summarized in section 5.2 (and highlighted in sections 2–4), as well as a number of issues that have not been discussed in this review (e.g., the effects of particle size heterogeneity on transport thresholds and sediment entrainment), into which section 5.3 presents a brief outlook.
5.1 A New and Controversial Conceptual Picture of the Physics of the Thresholds of Nonsuspended Sediment Transport and Bed Sediment Entrainment
Figure 19 summarizes the various shear stress thresholds of nonsuspended sediment transport and their relations to and effects on the transport characteristics.
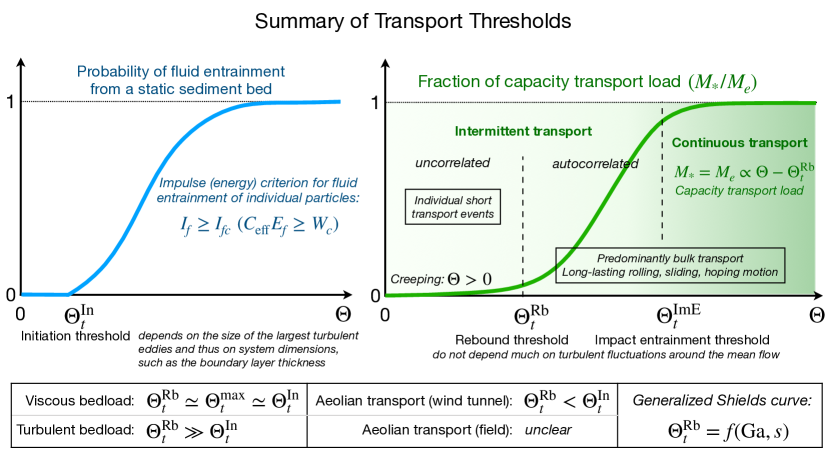
5.1.1 Creeping ()
Creeping (see section 2.3) refers to a superslow granular motion, usually in the form of intermittent local particle rearrangements within the sediment bed (not limited to the bed surface), that occurs below a macroscopic yield criterion (see section 2.1). One form of creeping is triggered by nearby regions above yield, while another form (the origin of which is not fully understood) occurs even in the absence of such regions. The existence of the latter form implies that sediment likely is always transported (albeit slowly) for arbitrarily small values of the Shields number , even in the absence of turbulence. Creeping of both kinds is very important in determining the particle motion near transport initiation. It is fundamentally related to the granular material, not a purely fluid-driven effect.
5.1.2 Viscous Yield Stress
Apart from creeping, which affects the entire granular bed, bed surface particles can be entrained directly by flow forces. When a sediment bed is subjected to a laminar flow at a sufficiently low shear Reynolds number , there is a critical Shields number, the yield stress , above which motion of bed surface particles is initiated and then never stops, whereas potential transient motion below will inevitably come to an end (see section 2.1). The viscous yield stress constitutes the upper limit for any kind of cohesionless sediment transport threshold, including the Shields curve. The values of reported in the literature are somewhat scattered (between 0.1 and 0.4), but these numbers are within the range of the bulk friction coefficients for granular materials (ranging from low friction spheres to more frictional, rough particles), suggesting that the granular material’s yield condition (see section 2.1) is very important in determining the viscous yield stress.
5.1.3 Initiation Threshold
While for laminar flows, the entrainment of individual bed surface particles is controlled by a critical Shields number, the entrainment of individual bed surface particles by turbulent flows is better described by an impulse (section 3.2.1) or energy (section 3.2.2) criterion. Nonetheless, one can still define an initiation threshold Shields number (see section 3.3) at which the probability of fluid entrainment exceeds zero (i.e., for laminar flows at sufficiently low ). Because fluid entrainment is predominantly caused by turbulent fluctuation events, depends not only on but also on properties that control the size of the largest turbulent flow eddies, such as the turbulent boundary layer thickness. This may be one of the reasons why aeolian incipient motion models adjusted to wind tunnel measurements fail when applied to atmospheric boundary layers (see first problem outlined at the beginning of section 5). Further possible reasons include atmospheric instability, topography gradients, surface inhomogeneities, such as obstacles and vegetation, and sublimation of subsurface ice in natural atmospheres (see section 3.3.3).
5.1.4 Rebound Threshold (Generalized Shields Curve)
The rebound threshold (see section 4.2) is largely unrelated to the entrainment of bed sediment (except for viscous bedload transport, for which ) but describes the minimal dimensionless fluid shear stress that is needed for the mean turbulent flow to compensate the average energy loss of rebounding particles by fluid drag acceleration during their trajectories. Hence, for , transported particles rebound for comparably longer periods before they deposit, whereas they deposit very quickly for . The former transport regime gives rise to transport autocorrelations, while the latter gives rise to individual uncorrelated transport events. Hence, bulk sediment transport vanishes at , which is described by a general law for the dimensionless bulk transport load at transport capacity (i.e., , see equation (29)). In fact, fluvial incipient motion measurements compiled in the Shields diagram are actually measurements of (see section 4.2.3), consistent with the fact that turbulent fluvial bedload transport does not vanish even much below the Shields curve because of occasional strong turbulent fluctuation events (Paintal, 1971). The notion that is largely unrelated to incipient motion and instead related to particle inertia resolves the second, third, fourth, and fifth problems outlined at the beginning of section 5. There are relatively simple models (which neglect turbulent fluctuations around the mean turbulent flow) predicting in agreement with measurements across aeolian and fluvial environment without containing fitting parameters (models of in section 4.3). Such models predict a generalized Shields curve of the form , where is the Galileo number and the particle-fluid-density ratio, via modeling steady continuous particle trajectories. In fact, in aeolian environments, comparably large values of allow the flow to sustain comparably large steady trajectories at a comparably low Shields number , causing to be substantially smaller than in fluvial environments for a given (see section 4.3.3).
5.1.5 Impact Entrainment Threshold
Even for , randomness introduced by inhomogeneities of the bed and turbulent fluctuations of the flow introduce trajectory fluctuations that can lead to random captures of rebounding particles by the bed. To sustain transport capacity, these captures must be compensated by entrainment of bed sediment into the rebound layer by the action of the fluid (see section 3), by particle-bed impacts (see section 4.1.3), or a combination of both (see section 4.1.2). Because entrainment involving the flow requires strong turbulent fluctuation events (see sections 3 and 4.1.2), which occur only at an intermittent basis, transport remains intermittent when impact entrainment alone is insufficient in providing the transport layer with rebounders (i.e., for ). However, once the impact entrainment threshold (see section 4.1.3) is exceeded (), impact entrainment is sufficient to do so, even without the assistance of fluid entrainment (i.e., significant fluid entrainment may occur, but is not needed). The impact entrainment threshold is strictly larger than the rebound threshold (), which is associated with a nonzero bulk transport rate (). This behavior can be explained within the continuous rebound framework (see section 4.2.1). Nonetheless, reliable models of are currently missing (see section 4.3).
5.1.6 Differences Between Bedload and Saltation Transport
To avoid confusion, we reiterate that the terms bedload transport () and saltation transport () have been defined through the transport layer thickness relative to the particle diameter (see notation and section 1). Depending on the relationship between the initiation threshold and the rebound threshold , one observes different dynamics. For turbulent fluvial bedload transport, , which means that transport can be initiated much below the Shields curve by occasional turbulent fluctuation events. However, whenever this happens, transport will very rapidly stop again. This is, indeed, the typical situation for gravel-bed rivers, which adjust their shape so that they remain in a low-mobility state (Parker, 1978; Phillips and Jerolmack, 2016). For aeolian transport in wind tunnels, is significantly larger than . This explains why aeolian bedload transport is usually very short-lived. In fact, even though bed particles are usually entrained into a rolling motion at (i.e., ), this rolling motion rapidly evolves into saltation transport (Bagnold, 1941; Iversen et al., 1987; Burr et al., 2015) as the flow is sufficiently strong to net accelerate particles moving near the surface. By doing so, their hop height becomes larger and larger (i.e., substantially increases) until a steady state is approached. For aeolian transport in the field, the magnitude of relative to is unclear as is smaller than in wind tunnels because of a much larger boundary layer thickness , since controls the size of the largest turbulent eddies and thus entrainment by turbulent fluctuation events (see section 3.3).
5.1.7 Implications for Field Phenomenona
The new conceptual picture described above has been derived nearly entirely from theoretical and laboratory investigations. One may therefore wonder to what degree does the notion of various transport thresholds have implications for natural field conditions, such as bedload transport in rivers and saltation transport driven by planetary winds. There are three major aspects in which the field differs from most laboratory experiments: much broader particle size distributions, much larger and more unstable boundary layers (mainly for aeolian transport), and various kinds of surface inhomogeneities, such as bedforms, obstacles, and vegetation. The effects of particle size heterogeneity have been excluded from this review (they are briefly discussed in the outlook, section 5.3.1). The remaining two aspects are both associated with increasing turbulence and thus fluid entrainment (see section 3). In contrast, the rebound threshold and arguably the impact entrainment threshold , as well as the transport capacity scaling (which requires ), are mainly controlled by the mean turbulent flow and relatively insensitive to turbulent fluctuations around it and should therefore be similar in laboratory and field (provided that the bed particle size distributions are similar). That is, for (typical for river floods and many aeolian processes), one expects capacity relationships derived from laboratory experiments to reasonably work and laboratory and field to behave similar. This expectation is consistent with observations reported in recent studies (Recking, 2010; Recking et al., 2012; Martin and Kok, 2017). Even if transport is not at capacity, it is, in principle, possible to separate the turbulence-induced random transport contribution from sediment transport rate data sets (Salevan et al., 2017) (see section 4.2.2) and to modify capacity relationships to account for noncapacity transport (Comola et al., 2019b).
5.2 Summary of Important Open Problems and Controversies
Sections 2–4 have highlighted several important open questions and controversies that need to be addressed in future studies, which are summarized below. Section 2:
-
1.
Why do fluid-sheared surfaces creep below a macroscopic yield criterion? And why do they do so even for seemingly arbitrarily small values of the Shields number and in the absence of turbulence?
-
2.
What is responsible for the large spread of experimentally measured values of the viscous yield stress ?
-
3.
Is flow-induced bed failure (i.e., yielding) a critical phenomenon?
-
4.
What is the rheology of nonsuspended sediment transport?
Section 3 (although this section concerns both fluvial and aeolian transport conditions, open questions and controversies in this section regard mainly aeolian transport):
-
1.
Why do different experimental designs for measuring the initiation threshold of aeolian rolling and saltation transport cause qualitative differences in the scaling of with the particle diameter ?
-
2.
Is the measured dependency of on the density ratio for constant Galileo number real or an artifact of differences in the boundary layer thickness of the wind tunnels used to carry out the experiments?
-
3.
Is the measured strong increase of with for very large in a wind tunnel with Martian pressure conditions real or an artifact of a limited boundary layer thickness of this wind tunnel?
-
4.
Is aeolian transport in the field on Earth and other planetary bodies, in contrast to wind tunnels with similar atmospheric pressure conditions, always being initiated close to the rebound threshold because of thick boundary layers, atmospheric instability, topography inhomogeneities, and subsurface ice sublimation? The answer to this question is probably the most important one, since a positive answer would imply that a reliable model for (i.e., answers to the previous three questions) is not required for predicting aeolian processes on such bodies.
-
5.
Does equilibrium aeolian bedload transport (i.e., ) exist in the field because of thick boundary layers?
-
6.
Direct measurements of aeolian sediment transport initiation, which are currently missing, can help answering the questions above.
Section 4:
-
1.
For a particle collision with a static sediment bed: how does the rebound probability depend on impact velocity and angle?
-
2.
How do particle shape and size distribution affect particle-bed collisions?
-
3.
Does viscous damping truly not much affect particle-bed collisions, as suggested by the insensitivity of DEM-based sediment transport simulations to the normal restitution coefficient of binary collisions? And if so, what is the physical reason?
-
4.
How do cohesive interparticle forces affect the collision process and thus sediment transport cessation?
-
5.
How do the laws describing a particle collision with a static bed change for a particle collision with a mobile bed?
-
6.
It is straightforward to define intermittent and continuous sediment transport for the absence of fluid entrainment because the sediment transport rate exhibits a discontinuous jump from nearly zero to a finite value at the continuous transport threshold. However, how does one universally define intermittent and continuous transport if fluid entrainment does occur?
-
7.
Is the transition from intermittent to continuous aeolian saltation transport associated with fluid entrainment (the current consensus) or with impact entrainment (the authors’ opinion, based on recent developments in the field)?
-
8.
What controls the impact entrainment threshold and how does one model it?
5.3 Outlook
To limit the scope of this review, several important topics have been excluded. Two of them are briefly discussed below.
5.3.1 Effects of Particle Size Heterogeneity on Sediment Transport Initiation, Cessation, and Entrainment
Perhaps the most important topic that has been excluded from this review is the effects of the heterogeneity of the size of bed surface particles on sediment transport initiation, cessation, and entrainment. Naturally, sediment transport initiation and entrainment are size-selective. However, it is unclear whether this is also true for sediment transport cessation. While the continuous rebound mechanism (see section 4.2) is clearly a size-selective process (coarser particles are less accelerated during their trajectories), impact entrainment may not be (Martin and Kok, 2019; Zhu et al., 2019). Furthermore, in heterogeneous sediment beds, relatively fine particles tend to be surrounded by coarser ones and their protrusion (i.e., the particle height above surrounding sediment) is thus smaller than on average, whereas relatively coarse particles tend to have a larger-than-average protrusion. Because driving forces decrease and resisting forces increase with decreasing protrusion (Yager et al., 2018), relatively fine particles are more difficult to be entrained when compared with a bed made only of such fine particles. The ability of fine particles to continuously rebound is also suppressed by the presence of coarse particles (Zhu et al., 2019). All these effects can make heterogeneous sediment beds much less mobile than homogeneous ones of the same median particle size. For example, for both fluvial bedload (MacKenzie and Eaton, 2017; MacKenzie et al., 2018) and aeolian saltation transport (Zhu et al., 2019), it was found for certain heterogeneous beds that the largest particles of the particle size distribution (larger than the 90th percentile) have a very strong control on overall mobility. However, the manner and degree of the heterogeneousness seem to play an important role as not all kinds of heterogeneous beds are so strongly affected by the presence of large particles (e.g., Wilcock, 1993; Martin and Kok, 2019). In particular, in the early stages of bed armoring, the sediment transport rate can increase because collisions between transported fine particles and coarse bed particles are more elastic than collisions between particles of the same size (Bagnold, 1973).
5.3.2 Effects of Steep Bed Slope on Sediment Transport Initiation, Cessation, and Entrainment
Another important topic that has been excluded from this review is the effects of steep bed slope angles on sediment transport initiation, cessation, and entrainment. For example, horizontal downslopes should, if everything else stays the same, increase bed mobility because of the additional horizontal gravity force acting on particles (Maurin et al., 2018). However, in fluvial environments, steep slopes are usually accompanied by a very small water depth of the order of one particle diameter (or even lower), which strongly suppresses the magnitude of hydrodynamic forces acting on particles, thus decreasing rather than increasing bed mobility (Prancevic and Lamb, 2015). Then again, an increasing downslope angle increases the bulk friction coefficient within the sediment bed (for turbulent flows, (Maurin et al., 2018), where is the bed volume fraction). Once exceeds the static friction coefficient associated with the yielding transition (see section 2.1), the entire bed fails and a debris flow forms (Takahashi, 1978; Prancevic et al., 2014; Cheng et al., 2018).
Appendix: Mean Flow Velocity Profile (Law of the Wall)
The mean flow velocity profile within the inner turbulent boundary layer above a flat wall (the law of the wall) exhibits three regions: a log-layer for large nondimensionalized elevations (wall units) , a viscous sublayer for small , and a buffer layer for transitional . For more details on turbulent wall-bounded flows, see the review by Smits et al. (2011). In section 4.3, the following form of the law of the wall is used (Guo and Julien, 2007):
| (A1) |
where and . Within the viscous sublayer of the turbulent boundary layer, , whereas in the log-layer, . The roughness length equals in the hydraulically smooth and in the hydraulically rough regime (Guo and Julien, 2007).
Acknowledgements.
All data shown in the figures of this review can be found in the following references: Peyneau and Roux (2008a), da Cruz et al. (2005), Kamrin and Koval (2014), Houssais et al. (2015), Allen and Kudrolli (2017, 2018), Diplas et al. (2008), Valyrakis (2013), Williams et al. (1994), Iversen and White (1982), Burr et al. (2015), Swann et al. (2020), Beladjine et al. (2007), Vowinckel et al. (2016), Salevan et al. (2017), Buffington and Montgomery (1997), Yalin and Karahan (1979), Loiseleux et al. (2005), Ouriemi et al. (2007), Bagnold (1937), Chepil (1945), Ho (2012), Martin and Kok (2018), and Zhu et al. (2019). We thank Michael Church and three anonymous reviewers for their critical reviews and numerous insightful comments and suggestions. T.P. acknowledges support from grant National Natural Science Foundation of China (No. 11750410687). {notation} {notation} Fluid shear stress [Pa] {notation} Particle shear stress [Pa] {notation} Particle pressure [Pa] {notation} Particle density [kg/m3] {notation} Fluid density [kg/m3] {notation} Particle mass [kg] {notation} Instantaneous local flow velocity [m/s] {notation} Bulk flow velocity [m/s] {notation} Fluid shear velocity [m/s] {notation} Kinematic fluid viscosity [m2/s] {notation} Boundary layer thickness [m] {notation} Flow thickness [m] {notation} Flow width [m] {notation} Characteristic particle diameter [m] {notation} Transport layer thickness [m] {notation} Particle shear rate (strain rate) [1/s] {notation} Granular temperature [m2/s2] {notation} Gravitational constant [m/s2] {notation} Buoyancy-reduced gravitational constant [m/s2] {notation} Sediment transport load [kg/m2] {notation} Sediment transport rate [kg/(ms)] {notation} Shields number or Shields parameter {notation} Particle-fluid-density ratio {notation} Reynolds number {notation} Shear Reynolds number {notation} Galileo number (also called Yalin parameter) {notation} Stokes number, where is the relative velocity between two particles just before they collide {notation} Nondimensionalized sediment transport load {notation} Nondimensionalized sediment transport rate {notation} Inertial number {notation} Viscous number {notation} Viscoinertial number, where is an order-unity fit parameter {notation} Péclet number {notation} Added mass coefficient {notation} von Kármán constant {notation} Pocket angle {notation} Pocket angle for particles resting within the deepest pockets of the bed surface {notation} Lever arm length [m] {notation} Bed slope angle {notation} Critical dimensionless vertical particle displacement required for entrainment {notation} Critical dimensionless horizontal particle displacement required for entrainment {notation} Effective Coulomb friction coefficient encoding the combined effects of sliding and rolling friction in entrainment {notation} Ratio between particle shear stress and particle pressure (bulk friction coefficient) {notation} Surface friction coefficient of granular particle {notation} Static friction coefficient of granular bulk (yield stress ratio) {notation} Bulk friction coefficient at the interface between bed and transport layer. In contrast to and , includes contributions from stresses associated with the particle fluctuation motion in addition to contributions from intergranular contacts. {notation} Correlation length associated with the yielding transition, where is the critical exponent {notation} Instantaneous force applied by the fluid on a particle [kgm/s2]. Subscript (, , , , ) refers to nature of force (drag, lift, tangential, normal, effective). {notation} Duration of turbulent fluctuation event [s]. Subscript (, , , , ) refers to nature of applied fluid force (drag, lift, tangential, normal, effective). {notation} Impulse of turbulent fluctuation event [kgm/s] {notation} Energy of turbulent fluctuation event [kgm2/s2] {notation} Force resisting initial particle motion [kgm/s2] {notation} Critical instantaneous local flow velocity associated with resisting forces [m/s] {notation} Critical impulse required for fluid entrainment [kgm/s] {notation} Critical work done by flow event required for fluid entrainment [kgm2/s2] {notation} Energy transfer coefficient, describing the fraction of energy transferred from flow to target particle during turbulent fluctuation event {notation} Inverse dimensionless boundary layer thickness {notation} Ratio between the characteristic flow velocity associated with the largest turbulent fluctuations and the local mean flow velocity {notation} Maximal duration of turbulent fluctuation events [s] {notation} Factor that encodes information about particle shape, orientation, and the pocket geometry {notation} Impact velocity [m/s] {notation} () Rebound velocity (projected into incident plane) [m/s] {notation} () Ejection velocity (projected into incident plane) [m/s] {notation} Impact angle {notation} () Rebound angle (projected into incident plane) {notation} () Ejection angle (projected into incident plane) {notation} Impact energy [kgm2/s2] {notation} () Ejection energy (projected into incident plane) [kgm2/s2] {notation} Average number of ejected particles {notation} Rebound probability {notation}() (Projected) rebound restitution coefficient {notation} Vertical rebound restitution coefficient {notation} Dimensionless parameters appearing in empirical or semi-empirical relations describing the collision process between an incident bead and a granular packing {notation} Normal rebound restitution coefficient in the impact plane {notation} Tangential rebound restitution coefficient in the impact plane {notation} Restitution coefficient for binary particle collision {notation} Effective value of the local particle velocity averaged over elevations near the bed surface [m/s] {notation} Particle feeding frequency at flume entrance [1/s] {notation} Frequency of particles passing an illuminated window near the flume exit [1/s] {notation} Fraction of active aeolian saltation transport {notation} Initial particle velocity in thought experiment in section 4.2.1 [m/s] {notation} Initial particle energy in thought experiment in section 4.2.1 [kgm2/s2] {notation} Critical energy that must exceed for particle to continuously rebound along the surface [kgm2/s2] {notation} Number of transported particles relative to the total number of bed surface particles {notation} Number of particles that are faster than a certain velocity threshold {notation} Hop height [m] {notation} Hop time [s] {notation} Function given by equation (A1) {notation} Settling velocity [m/s] {notation} Dimensionless transport layer-averaged fluid velocity {notation} Dimensionless transport layer-averaged horizontal particle velocity {notation} Dimensionless transport layer-averaged vertical particle velocity {notation} Dimensionless transport layer thickness {notation} Dimensionless average elevation of the particles’ center during particle-bed rebounds {notation} Surface roughness [m] {notation} Model constants in equations (33c)-(33e) {notation}Bed sediment entrainment Mobilization of bed sediment {notation}Fluid entrainment Entrainment caused by the action of flow forces {notation}Incipient motion Initiation of sediment transport by fluid entrainment {notation}Impact entrainment Entrainment caused by the impacts of transported particles onto the bed {notation}Sediment transport Sediment motion caused by the shearing of an erodible sediment bed by flow of a Newtonian fluid {notation}Aeolian sediment transport Wind-driven sediment transport {notation}Fluvial sediment transport Liquid-driven sediment transport (despite its name, not limited to fluvial environments) {notation}Nonsuspended sediment transport Sediment transport in which the fluid turbulence is unable to support the submerged particle weight {notation}Saltation transport Nonsuspended sediment transport with comparably large transport layers () {notation}Bedload transport Nonsuspended sediment transport with comparably small transport layers () {notation}Transport capacity (or saturation) Loosely, the maximum amount of sediment a given flow can carry without causing net sediment deposition at the bed. More precisely, in the context of nonsuspended transport of nearly monodisperse sediment, it is defined as a steady transport state at which any further net entrainment of bed sediment into the transport layer would weaken the mean turbulent flow to a degree at which it is no longer able to compensate the average energy loss of particles rebounding with the bed by their energy gain during their trajectories via fluid drag acceleration. The so defined transport capacity obeys equation (29). {notation}Creeping A superslow granular motion, usually in the form of intermittent local particle rearrangements within the sediment bed (not limited to the bed surface), that occurs below a macroscopic yield criterion {notation} () Shields number (fluid shear stress) at a nonspecified transport threshold. For specifications, see below. {notation} Time scale for transport property to converge in the steady state near , where is a positive exponent {notation}Shields diagram (Shields curve) Diagram compiling measurements of as a function of (the Shields curve ) for fluvial bedload transport conditions {notation} () Viscous yield stress. The upper limit of the threshold Shields number (fluid shear stress) in the Shields diagram, which is associated with viscous bedload transport. For , a sediment bed subjected to a laminar flow at low Shear Reynolds number may temporarily fail but will eventually rearrange itself into a more stable packing that resists the applied fluid shear stress. For , a sediment bed subjected to a laminar flow can no longer find packing geometries that are able to resist the applied fluid shear stress. {notation} () Initiation threshold. Shields number (fluid shear stress) at which the probability of fluid entrainment of bed particles exceeds zero (which, for turbulent fluvial bedload transport, occurs much below the Shields curve). For sediment beds subjected to turbulent flows, a critical fluid shear stress does no longer describe the fluid entrainment of individual particles. However, one can still define a Shields number () below which fluid entrainment does never occur. Like for , transient behavior associated with the flow temporarily pushing particles from less stable to more stable pockets is excluded in the definition of . {notation} () Rocking initiation threshold. Shields number (fluid shear stress) above (below) which there is a nonzero (zero) probability that peaks of flow forces associated with turbulent fluctuation events acting on bed particles exceed resisting forces. That is, there is a nonzero probability that particles rock (or wobble or oscillate) within their bed pockets. Rocking may () or may not () lead to complete entrainment depending on the maximal duration of the strongest possible turbulent fluctuation events. {notation} () Rebound threshold. Shields number (fluid shear stress) above which the mean turbulent flow is able to compensate the average energy loss of transported particles rebounding with the bed by their energy gain during their trajectories via fluid drag acceleration, giving rise to a long-lasting rebound motion. In general, this threshold is unrelated to the entrainment of bed sediment. It is also the threshold that appears in most threshold shear stress-based sediment transport expressions. {notation} () Modeled rebound threshold. Values of from models that consider (neglect) that the near-surface flow can assist rebounding particles in escaping the bed surface. {notation} () Impact entrainment threshold. Shields number (fluid shear stress) above which entrainment of bed sediment by impacts of transported particles onto the bed is able to compensate captures of long-lasting rebounders (see above) by the bed. This threshold is arguably also the threshold of continuous nonsuspended sediment transport. {notation} () Modeled hybrid between rebound and impact entrainment thresholdReferences
- Agudo et al. (2017) Agudo, J. R., C. Illigmann, G. Luzi, A. Laukart, A. Delgado, and A. Wierschem (2017), Shear-induced incipient motion of a single sphere on uniform substrates at low particle Reynolds numbers, Journal of Fluid Mechanics, 825, 284–314, 10.1017/jfm.2017.370.
- Alhamdi and Bailey (2017) Alhamdi, S. F. H., and S. C. C. Bailey (2017), Universality of local dissipation scales in turbulent boundary layer flows with and without free-stream turbulence, Physics of Fluids, 29, 115,103, 10.1063/1.4996200.
- Ali and Dey (2016) Ali, S. Z., and S. Dey (2016), Hydrodynamics of sediment threshold, Physics of Fluids, 28, 075,103, 10.1063/1.4955103.
- Allen and Kudrolli (2017) Allen, B., and A. Kudrolli (2017), Depth resolved granular transport driven by shearing fluid flow, Physical Review Fluids, 2, 024,304, 10.1103/PhysRevFluids.2.024304.
- Allen and Kudrolli (2018) Allen, B., and A. Kudrolli (2018), Granular bed consolidation, creep, and armoring under subcritical fluid flow, Physical Review Fluids, 3, 074,305, 10.1103/PhysRevFluids.3.074305.
- Almeida et al. (2008) Almeida, M. P., E. J. R. Parteli, J. S. Andrade, and H. J. Herrmann (2008), Giant saltation on Mars, Proceedings of the National Academy of Science, 105(17), 6222–6226, 10.1073/pnas.0800202105.
- Amarsid et al. (2017) Amarsid, L., J.-Y. Delenne, P. Mutabaruka, Y. Monerie, F. Perales, and F. Radjaï (2017), Viscoinertial regime of immersed granular flows, Physical Review E, 96, 012,901, 10.1103/PhysRevE.96.012901.
- Ammi et al. (2009) Ammi, M., L. Oger, D. Beladjine, and A. Valance (2009), Three-dimensional analysis of the collision process of a bead on a granular packing, Physical Review E, 79, 021,305, 10.1103/PhysRevE.79.021305.
- Amon et al. (2013) Amon, A., R. Bertoni, and J. Crassous (2013), Experimental investigation of plastic deformations before a granular avalanche, Phys. Rev. E, 87, 012,204, 10.1103/PhysRevE.87.012204.
- Ancey et al. (1999) Ancey, C., P. Coussot, and P. Evesque (1999), A theoretical framework for granular suspensions in a steady simple shear flow, Journal of Rheology, 43(6), 1673–1699, 10.1122/1.551067.
- Ancey et al. (2002) Ancey, C., F. Bigillon, P. Frey, J. Lanier, and R. Ducret (2002), Saltating motion of a bead in a rapid water stream, Physical Review E, 66, 036,306, 10.1103/PhysRevE.66.036306.
- Ancey et al. (2006) Ancey, C., T. Böhm, M. Jodeau, and P. Frey (2006), Statistical description of sediment transport experiments, Physical Review E, 74, 011,302, 10.1103/PhysRevE.74.011302.
- Ancey et al. (2008) Ancey, C., A. C. Davison, T. Böhm, M. Jodeau, and P. Frey (2008), Entrainment and motion of coarse particles in a shallow water stream down a steep slope, Journal of Fluid Mechanics, 595, 83–114, 10.1017/S0022112007008774.
- Ancey et al. (2015) Ancey, C., P. Bohorquez, and J. Heyman (2015), Stochastic interpretation of the advection-diffusion equation and its relevance to bed load transport, Journal of Geophysical Research: Earth Surface, 120, 529–2551, 10.1002/2014JF003421.
- Anderson and Haff (1988) Anderson, R. S., and P. K. Haff (1988), Simulation of eolian saltation, Science, 241, 820–823, 10.1126/science.241.4867.820.
- Anderson and Haff (1991) Anderson, R. S., and P. K. Haff (1991), Wind modification and bed response during saltation of sand in air, Acta Mechanica Supplementum, 1, 21–51, 10.1007/978-3-7091-6706-9_2.
- Anderson and Hallet (1986) Anderson, R. S., and B. Hallet (1986), Sediment transport by wind: toward a general model, Geological Society of America Bulletin, 97, 523–535, 10.1130/0016-7606(1986)97¡523:STBWTA¿2.0.CO;2.
- Andreotti (2004) Andreotti, B. (2004), A two-species model of aeolian sand transport, Journal of Fluid Mechanics, 510, 47–70, 10.1017/S0022112004009073.
- Apperley and Raudkivi (1989) Apperley, L. W., and A. J. Raudkivi (1989), The entrainment of sediments by the turbulent flow of water, Hydrobiologia, 176(1), 39–49, 10.1007/978-94-009-2376-8_5.
- Aussillous et al. (2016) Aussillous, P., Z. Zou, E. Guazzelli, L. Yan, and M. Wyart (2016), Scale-free channeling patterns near the onset of erosion of sheared granular beds, Proceedings of the National Academy of Science, 113(42), 11,788–11,793, 10.1073/pnas.1609023113.
- Ayoub et al. (2014) Ayoub, F., J.-P. Avouac, C. E. Newman, M. I. Richardson, A. Lucas, S. Leprince, and N. Bridges (2014), Threshold for sand mobility on Mars calibrated from seasonal variations of sand flux, Nature Communication, 5, 5096, 10.1038/ncomms6096.
- Azéma and Radjaï (2010) Azéma, E., and F. Radjaï (2010), Stress-strain behavior and geometrical properties of packings of elongated particles, Physical Review E, 81, 051,304, 10.1103/PhysRevE.81.051304.
- Azéma and Radjaï (2014) Azéma, E., and F. Radjaï (2014), Internal structure of inertial granular flows, Physical Review Letters, 112, 078,001, 10.1103/PhysRevLett.112.078001.
- Bachelet et al. (2018) Bachelet, V., A. Mangeney, J. de Rosny, R. Toussaint, and M. Farin (2018), Elastic wave generated by granular impact on rough and erodible surfaces, Journal of Applied Physics, 123, 044,901, 10.1063/1.5012979.
- Bagnold (1936) Bagnold, R. A. (1936), The movement of desert sand, Proceedings of the Royal Society London Series A, 157, 594–620, 10.1098/rspa.1936.0218.
- Bagnold (1937) Bagnold, R. A. (1937), The transport of sand by wind, The Geographical Journal, 89(5), 409–438, 10.2307/1786411.
- Bagnold (1938) Bagnold, R. A. (1938), The measurement of sand storms, Proceedings of the Royal Society London Series A, 167, 282–291, 10.1098/rspa.1938.0132.
- Bagnold (1941) Bagnold, R. A. (1941), The Physics of Blown Sand and Desert Dunes, Methuen, New York.
- Bagnold (1956) Bagnold, R. A. (1956), The flow of cohesionless grains in fluid, Philosophical Transactions of the Royal Society London A, 249, 235–297, 10.1098/rsta.1956.0020.
- Bagnold (1966) Bagnold, R. A. (1966), An approach to the sediment transport problem from general physics, in US Geological Survey Professional Paper 422-I, U.S. Government Printing Office, Washington, DC, 10.3133/pp422I.
- Bagnold (1973) Bagnold, R. A. (1973), The nature of saltation and ‘bed-load’ transport in water, Proceedings of the Royal Society London Series A, 332, 473–504, 10.1098/rspa.1973.0038.
- Baker et al. (2018) Baker, M. M., C. E. Newman, M. G. A. Lapotre, R. Sullivan, N. T. Bridges, and K. W. Lewis (2018), Coarse sediment transport in the modern Martian environment, Journal of Geophysical Research: Planets, 123(6), 1380–1394, 10.1002/2017JE005513.
- Baran et al. (2006) Baran, O., D. Ertas, and T. C. Halsey (2006), Velocity correlations in dense gravity-driven granular chute flow, Physical Review E, 74, 051,302, 10.1103/PhysRevE.74.051302.
- Barchyn and Hugenholtz (2011) Barchyn, T. E., and C. H. Hugenholtz (2011), Comparison of four methods to calculate aeolian sediment transport threshold from field data: Implications for transport prediction and discussion of method evolution, Geomorphology, 129, 190–203, 10.1016/j.geomorph.2011.01.022.
- Beladjine et al. (2007) Beladjine, D., M. Ammi, L. Oger, and A. Valance (2007), Collision process between an incident bead and a three-dimensional granular packing, Physical Review E, 75, 061,305, 10.1103/PhysRevE.75.061305.
- Berzi et al. (2016) Berzi, D., J. T. Jenkins, and A. Valance (2016), Periodic saltation over hydrodynamically rough beds: aeolian to aquatic, Journal of Fluid Mechanics, 786(1), 190–209, 10.1017/jfm.2015.601.
- Berzi et al. (2017) Berzi, D., A. Valance, and J. T. Jenkins (2017), The threshold for continuing saltation on Earth and other solar system bodies, Journal of Geophysical Research: Earth Surface, 122, 1374–1388, 10.1002/2016JF003982.
- Bo et al. (2017) Bo, T. L., L. T. Fu, L. Liu, and X. J. Zheng (2017), An improved numerical model suggests potential differences of wind-blown sand between on Earth and Mars, Journal of Geophysical Research: Atmospheres, 122, 5823–5836, 10.1002/2016JD026132.
- Böhm et al. (2004) Böhm, T., C. Ancey, P. Frey, J. L. Reboud, and C. Ducottet (2004), Fluctuations of the solid discharge of gravity-driven particle flows in a turbulent stream, Physical Review E, 69, 061,307, 10.1103/PhysRevE.69.061307.
- Boulton and Hindmarsh (1987) Boulton, G. S., and R. C. A. Hindmarsh (1987), Sediment deformation beneath glaciers: rheology and geological consequences, Journal of Geophysical Research: Solid Earth, 92(B9), 9059–9082, 10.1029/JB092iB09p09059.
- Bourke et al. (2010) Bourke, M. C., N. Lancaster, L. K. Fenton, E. J. R. Parteli, J. R. Zimbelman, and J. Radebaugh (2010), Extraterrestrial dunes: An introduction to the special issue on planetary dune systems, Geomorphology, 121, 1–14, 10.1016/j.geomorph.2010.04.007.
- Bourrier et al. (2008) Bourrier, F., F. Nicot, and F. Darve (2008), Physical processes within a 2D granular layer during an impact, Granular Matter, 10, 415–437, 10.1007/s10035-008-0108-0.
- Bouzid et al. (2013) Bouzid, M., M. Trulsson, P. Claudin, E. Clément, and B. Andreotti (2013), Nonlocal rheology of granular flows across yield conditions, Physical Review Letters, 111, 238,301, 10.1103/PhysRevLett.111.238301.
- Bouzid et al. (2015) Bouzid, M., A. Izzet, M. Trulsson, E. Clément, P. Claudin, and B. Andreotti (2015), Non-local rheology in dense granular flows – Revisiting the concept of fluidity, The European Physics Journal E, 38, 125, 10.1140/epje/i2015-15125-1.
- Bouzid et al. (2017) Bouzid, M., M. Trulsson, A. Izzet, A. Favier de Coulomb, P. Claudin, E. Clément, and B. Andreotti (2017), Non-local rheology of dense granular flows, p. 11013, 10.1051/epjconf/201714011013.
- Boyer et al. (2011) Boyer, F., E. Guazzelli, and O. Pouliquen (2011), Unifying suspension and granular rheology, Physical Review Letters, 107, 188,301, 10.1103/PhysRevLett.107.188301.
- Brahms (1757) Brahms, A. (1757), Anfangsgründe der Deich- und Wasserbaukunst, Tapper, Aurich.
- Bridges et al. (2012a) Bridges, N. T., F. Ayoub, J.-P. Avouac, S. Leprince, A. Lucas, and S. Mattson (2012a), Earth-like sand fluxes on Mars, Nature, 485, 339–342, 10.1038/nature11022.
- Bridges et al. (2012b) Bridges, N. T., M. C. Bourke, P. E. Geissler, M. E. Banks, C. Colon, S. Diniega, M. P. Golombek, C. J. Hansen, S. Mattson, A. S. McEwen, M. T. Mellon, N. Stantzos, and B. J. Thomson (2012b), Planet-wide sand motion on Mars, Geology, 40(1), 31–34, 10.1130/G32373.1.
- Buffington (1999) Buffington, J. M. (1999), The legend of A. F. Shields, Journal of Hydraulic Engineering, 125(4), 376–387, 10.1061/(ASCE)0733-9429(1999)125:4(376).
- Buffington and Montgomery (1997) Buffington, J. M., and D. R. Montgomery (1997), A systematic analysis of eight decades of incipient motion studies, with special reference to gravel-bedded rivers, Water Resources Research, 33(8), 1993–2029, 10.1029/96WR03190.
- Buffington et al. (1992) Buffington, J. M., W. E. Dietrich, and J. W. Kirchner (1992), Friction angle measurements on a naturally formed gravel streambed: Implications for critical boundary shear stress, Water Resources Research, 28(2), 411–425, 10.1029/91WR02529.
- Bunte and Abt (2005) Bunte, K., and S. R. Abt (2005), Effect of sampling time on measured gravel bed load transport rates in a coarse-bedded stream, Water Resources Research, 41, W11,405, 10.1029/2004WR003880.
- Burr et al. (2015) Burr, D. M., N. T. Bridges, J. R. Marshall, J. K. Smith, B. R. White, and J. P. Emery (2015), Higher-than-predicted saltation threshold wind speeds on Titan, Nature, 517(7532), 60–63, 10.1038/nature14088.
- Camenen (2007) Camenen, B. (2007), Simple and general formula for the settling velocity of particles, Journal of Hydraulic Engineering, 133(2), 229–233, 10.1061/(ASCE)0733-9429(2007)133:2(229).
- Cameron et al. (2019) Cameron, S. M., V. I. Nikora, and I. Marusic (2019), Drag forces on a bed particle in open-channel flow: effects of pressure spatial fluctuations and very-large-scale motions, Journal of Fluid Mechanics, 863, 494–512, 10.1017/jfm.2018.1003.
- Cameron et al. (2020) Cameron, S. M., V. I. Nikora, and M. J. Witz (2020), Entrainment of sediment particles by very large-scale motions, Journal of Fluid Mechanics, 888, A7, 10.1017/jfm.2020.24.
- Candelier and Dauchot (2009) Candelier, R., and O. Dauchot (2009), Creep motion of an intruder within a granular glass close to jamming, Physical Review Letters, 103, 128,001, 10.1103/PhysRevLett.103.128001.
- Cao et al. (2006) Cao, Z., G. Pender, and J. Meng (2006), Explicit formulation of the shields diagram for incipient motion of sediment, Journal of Hydraulic Engineering, 132(10), 1097–1099, 10.1061/(ASCE)0733-9429(2006)132:10(1097).
- Carneiro et al. (2011) Carneiro, M. V., T. Pähtz, and H. J. Herrmann (2011), Jump at the onset of saltation, Physical Review Letters, 107(9), 098,001, 10.1103/PhysRevLett.107.098001.
- Carneiro et al. (2013) Carneiro, M. V., N. A. M. Araújo, T. Pähtz, and H. J. Herrmann (2013), Midair collisions enhance saltation, Physical Review Letters, 111(5), 058,001, 10.1103/PhysRevLett.111.058001.
- Carneiro et al. (2015) Carneiro, M. V., K. R. Rasmussen, and H. J. Herrmann (2015), Bursts in discontinuous aeolian saltation, Scientific Reports, 5, 11,109, 10.1038/srep11109.
- Castellanos (2005) Castellanos, A. (2005), The relationship between attractive interparticle forces and bulk behaviour in dry and uncharged fine powders, Advances in Physics, 54(4), 263–376, 10.1080/17461390500402657.
- Celik et al. (2010) Celik, A. O., P. Diplas, C. L. Dancey, and M. Valyrakis (2010), Impulse and particle dislodgement under turbulent flow conditions, Physics of Fluids, 22, 046,601, 10.1063/1.3385433.
- Celik et al. (2013) Celik, A. O., P. Diplas, and C. L. Dancey (2013), Instantaneous turbulent forces and impulse on a rough bed: Implications for initiation of bed material movement, Water Resources Research, 49, 2213–2227, 10.1002/wrcr.20210.
- Celik et al. (2014) Celik, A. O., P. Diplas, and C. L. Dancey (2014), Instantaneous pressure measurements on a spherical grain under threshold flow conditions, Journal of Fluid Mechanics, 741, 60–97, 10.1017/jfm.2013.632.
- Charru et al. (2004) Charru, F., H. Mouilleron, and O. Eiff (2004), Erosion and deposition of particles on a bed sheared by a viscous flow, Journal of Fluid Mechanics, 519, 55–80, 10.1017/S0022112004001028.
- Chen et al. (2019) Chen, Y., J. Zhang, N. Huang, and B. Xu (2019), An experimental study on splash functions of natural sand-bed collision, Journal of Geophysical Research: Atmospheres, 124, 7226–7235, 10.1029/2018JD029967.
- Cheng et al. (2018) Cheng, N. S., H. Tang, and J. Yan (2018), Low-submergence effect on incipient sediment motion, Journal of Engineering Mechanics, 144(12), 04018,111, 10.1061/(ASCE)EM.1943-7889.0001540.
- Chepil (1945) Chepil, W. S. (1945), Dynamics of wind erosion: II. Initiation of soil movement, Soil Science, 60(5), 397–411, 10.1097/00010694-194511000-00005.
- Chojnacki et al. (2015) Chojnacki, M., J. R. Johnson, J. E. Moersch, L. K. Fenton, T. I. Michaels, and J. F. Bell III (2015), Persistent aeolian activity at Endeavour crater, Meridiani Planum, Mars; new observations from orbit and the surface, Icarus, 251, 275–290, 10.1016/j.icarus.2014.04.044.
- Clark et al. (2012) Clark, A. H., L. Kondic, and R. P. Behringer (2012), Particle scale dynamics in granular impact, Physical Review Letters, 109, 238,302, 10.1103/PhysRevLett.109.238302.
- Clark et al. (2015a) Clark, A. H., M. D. Shattuck, N. T. Ouellette, and C. S. O’Hern (2015a), Onset and cessation of motion in hydrodynamically sheared granular beds, Physical Review E, 92(4), 042,202, 10.1103/PhysRevE.92.042202.
- Clark et al. (2015b) Clark, A. H., A. J. Petersen, L. Kondic, and R. P. Behringer (2015b), Nonlinear force propagation during granular impact, Physical Review Letters, 114, 144,502, 10.1103/PhysRevLett.114.144502.
- Clark et al. (2016) Clark, A. H., L. Kondic, and R. P. Behringer (2016), Steady flow dynamics during granular impact, Physical Review E, 93, 050,901(R), 10.1103/PhysRevE.93.050901.
- Clark et al. (2017) Clark, A. H., M. D. Shattuck, N. T. Ouellette, and C. S. O’Hern (2017), Role of grain dynamics in determining the onset of sediment transport, Physical Review Fluids, 2, 034,305, 10.1103/PhysRevFluids.2.034305.
- Clark et al. (2018) Clark, A. H., J. D. Thompson, M. D. Shattuck, N. T. Ouellette, and C. S. O’Hern (2018), Critical scaling near the yielding transition in granular media, Physical Review E, 97(6), 062,901, 10.1103/PhysRevE.97.062901.
- Claudin and Andreotti (2006) Claudin, P., and B. Andreotti (2006), A scaling law for aeolian dunes on Mars, Venus, Earth, and for subaqueous ripples, Earth and Planetary Science Letters, 252, 30–44, 10.1016/j.epsl.2006.09.004.
- Comola and Lehning (2017) Comola, F., and M. Lehning (2017), Energy- and momentum-conserving model of splash entrainment in sand and snow saltation, Geophysical Research Letters, 44, 1601–1609, 10.1002/2016GL071822.
- Comola et al. (2019a) Comola, F., J. Gaume, J. F. Kok, and M. Lehning (2019a), Cohesion-induced enhancement of aeolian saltation, Geophysical Research Letters, 46(10), 5566–5574, 10.1029/2019GL082195.
- Comola et al. (2019b) Comola, F., J. F. Kok, M. Chamecki, and R. L. Martin (2019b), The intermittency of wind-driven sand transport, Geophysical Research Letters, 46, 10.1029/2019GL085739.
- Cornelis and Gabriels (2004) Cornelis, W. M., and D. Gabriels (2004), A simple model for the prediction of the deflation threshold shear velocity of dry loose particles, Sedimentology, 51, 39–51, 10.1111/j.1365-3091.2004.00609.x.
- Crassous et al. (2007) Crassous, J., D. Beladjine, and A. Valance (2007), Impact of a projectile on a granular medium described by a collision model, Physical Review Letters, 99, 248,001, 10.1103/PhysRevLett.99.248001.
- Crassous et al. (2008) Crassous, J., J. F. Metayer, P. Richard, and C. Laroche (2008), Experimental study of a creeping granular flow at very low velocity, Journal of Statistical Mechanics: Theory and Experiment, 2008(03), P03,009, 10.1088/1742-5468/2008/03/P03009.
- Creyssels et al. (2009) Creyssels, M., P. Dupont, A. Ould El Moctar, A. Valance, I. Cantat, J. T. Jenkins, J. M. Pasini, and K. R. Rasmussen (2009), Saltating particles in a turbulent boundary layer: experiment and theory, Journal of Fluid Mechanics, 625, 47–74, 10.1017/S0022112008005491.
- Cundall and Strack (1979) Cundall, P. A., and O. D. L. Strack (1979), A discrete numerical model for granular assemblies, Geotechnique, 291, 47–65, 10.1680/geot.1979.29.1.47.
- da Cruz et al. (2005) da Cruz, F., S. Emam, M. Prochnow, J.-N. Roux, and F. Chevoir (2005), Rheophysics of dense granular materials: Discrete simulation of plane shear flows, Physical Review E, 72, 021,309, 10.1103/PhysRevE.72.021309.
- de Vet et al. (2014) de Vet, S. J., J. P. Merrison, M. C. Mittelmeijer-Hazeleger, E. E. van Loon, and L. H. Cammeraat (2014), Effects of rolling on wind-induced detachment thresholds of volcanic glass on Mars, Planetary and Space Science, 103, 205–218, 10.1016/j.pss.2014.07.012.
- Deskos and Diplas (2018) Deskos, G., and P. Diplas (2018), Incipient motion of a non-cohesive particle under stokes flow conditions, International Journal of Multiphase Flow, 99, 151–161, 10.1016/j.ijmultiphaseflow.2017.09.015.
- Dey (1999) Dey, S. (1999), Sediment threshold, Applied Mathematical Modelling, 23, 399–417, 10.1016/S0307-904X(98)10081-1.
- Dey and Ali (2018) Dey, S., and S. Z. Ali (2018), Review article: Advances in modeling of bed particle entrainment sheared by turbulent flow, Physics of Fluids, 30, 061,301, 10.1063/1.5030458.
- Dey and Ali (2019) Dey, S., and S. Z. Ali (2019), Bed sediment entrainment by streamflow: State of the science, Sedimentology, 66(5), 1449–1485, 10.1111/sed.12566.
- Dey and Papanicolaou (2008) Dey, S., and A. Papanicolaou (2008), Sediment threshold under stream flow: A state-of-the-art review, KSCE Journal of Civil Engineering, 12(1), 45–60, 10.1007/s12205-008-8045-3.
- Dey et al. (2012) Dey, S., R. Das, R. Gaudio, and S. K. Bose (2012), Turbulence in mobile-bed streams, Acta Geophysica, 60(6), 1547–1588, 10.2478/s11600-012-0055-3.
- Dinehart (1999) Dinehart, R. L. (1999), Correlative velocity fluctuations over a gravel river bed, Water Resources Research, 35(2), 569–582, 10.1029/1998WR900038.
- Diplas et al. (2008) Diplas, P., C. L. Dancey, A. O. Celik, M. Valyrakis, K. Greer, and T. Akar (2008), The role of impulse on the initiation of particle movement under turbulent flow conditions, Science, 322(5902), 717–720, 10.1126/science.1158954.
- Divoux et al. (2008) Divoux, T., H. Gayvallet, and J. C. Géminard (2008), Creep motion of a granular pile induced by thermal cycling, Physical Review Letters, 101, 148,303, 10.1103/PhysRevLett.101.148303.
- Dong et al. (2002) Dong, Z., X. Liu, F. Li, H. Wang, and A. Zhao (2002), Impact-entrainment relationship in a saltating cloud, Earth Surface Processes and Landforms, 27(6), 641–658, 10.1002/esp.341.
- Dong et al. (2003) Dong, Z., X. Liu, H. Wang, and X. Wang (2003), Aeolian sand transport: a wind tunnel model, Sedimentary Geology, 161, 71–83, 10.1016/S0037-0738(02)00396-2.
- Drake and Calantoni (2001) Drake, T. G., and J. Calantoni (2001), Discrete particle model for sheet flow sediment transport in the nearshore, Journal of Geophysical Research: Oceans, 106(C9), 19,859–19,868, 10.1029/2000JC000611.
- Drake et al. (1988) Drake, T. G., R. L. Shreve, W. E. Dietrich, P. J. Whitings, and L. B. Leopold (1988), Bedload transport of fine gravel observed by motion-picture photography, Journal of Fluid Mechanics, 192, 193–217, 10.1017/S0022112088001831.
- Drucker and Prager (1952) Drucker, D. C., and W. Prager (1952), Soil mechanics and plastic analysis or limit design, Quarterly of Applied Mathematics, 10(2), 157–165.
- Duan et al. (2013a) Duan, S., N. Cheng, and L. Xie (2013a), A new statistical model for threshold friction velocity of sand particle motion, Catena, 104, 32–38, 10.1016/j.catena.2012.04.009.
- Duan et al. (2013b) Duan, S. Z., W. Zhu, and X. J. Zheng (2013b), Numerical investigation on two-grain-bed collisions in windblown sand transport, Powder Technology, 235, 431–436, 10.1016/j.powtec.2012.10.059.
- Durán et al. (2011) Durán, O., P. Claudin, and B. Andreotti (2011), On aeolian transport: Grain-scale interactions, dynamical mechanisms and scaling laws, Aeolian Research, 3, 243–270, 10.1016/j.aeolia.2011.07.006.
- Durán et al. (2012) Durán, O., B. Andreotti, and P. Claudin (2012), Numerical simulation of turbulent sediment transport, from bed load to saltation, Physics of Fluids, 24, 103,306, 10.1063/1.4757662.
- Durán Vinent et al. (2019) Durán Vinent, O., B. Andreotti, P. Claudin, and C. Winter (2019), A unified model of ripples and dunes in water and planetary environments, Nature Geoscience, 12, 345–350, 10.1038/s41561-019-0336-4.
- Dwivedi et al. (2010a) Dwivedi, A., B. W. Melville, A. Y. Shamseldin, and T. K. Guha (2010a), Drag force on a sediment particle from point velocity measurements: A spectral approach, Water Resources Research, 46, W10,529, 10.1029/2009WR008643.
- Dwivedi et al. (2010b) Dwivedi, A., B. W. Melville, A. Y. Shamseldin, and T. K. Guha (2010b), Flow structures and hydrodynamic force during sediment entrainment, Water Resources Research, 47, W01,509, 10.1029/2010WR009089.
- Edwards and Namikas (2015) Edwards, B. L., and S. L. Namikas (2015), Characterizing the sediment bed in terms of resistance to motion: Toward an improved model of saltation thresholds for aeolian transport, Aeolian Research, 19, 123–128, 10.1016/j.aeolia.2015.10.004.
- Einstein (1950) Einstein, H. A. (1950), The Bed-Load Function for Sediment Transportation in Open Channel Flows, United States Department of Agriculture, Washington, DC, 10.22004/ag.econ.156389.
- Einstein and El-Samni (1949) Einstein, H. A., and E. S. A. El-Samni (1949), Hydrodynamic forces on a rough wall, Review of Modern Physics, 21(3), 520–524, 10.1103/RevModPhys.21.520.
- Elghannay and Tafti (2017) Elghannay, H. A., and D. K. Tafti (2017), Sensitivity of numerical parameters on DEM predictions of sediment transport, Particulate Science and Technology, 36(4), 438–446, 10.1080/02726351.2017.1352638.
- Fenistein and van Hecke (2003) Fenistein, D., and M. van Hecke (2003), Kinematics: Wide shear zones in granular bulk flow, Nature, 425(6955), 256, 10.1038/425256a.
- Ferdowsi et al. (2017) Ferdowsi, B., C. P. Ortiz, M. Houssais, and D. J. Jerolmack (2017), River-bed armouring as a granular segregation phenomenon, Nature communications, 8(1), 1363, 10.1038/s41467-017-01681-3.
- Ferdowsi et al. (2018) Ferdowsi, B., C. P. Ortiz, and D. J. Jerolmack (2018), Glassy dynamics of landscape evolution, Proceedings of the National Academy of Sciences, 115(19), 4827–4832, 10.1073/pnas.1715250115.
- Forterre and Pouliquen (2008) Forterre, Y., and O. Pouliquen (2008), Flows of dense granular media, Annual Review of Fluid Mechanics, 40, 1–24, 10.1146/annurev.fluid.40.111406.102142.
- Francis (1973) Francis, J. R. D. (1973), Experiments on the motion of solitary grains along the bed of a water-stream, Philosophical Transactions of the Royal Society London A, 332, 443–471, 10.1098/rspa.1973.0037.
- Frey and Church (2009) Frey, P., and M. Church (2009), How river beds move, Science, 325(5947), 1509–1510, 10.1126/science.1178516.
- Frey and Church (2011) Frey, P., and M. Church (2011), Bedload: a granular phenomenon, Earth Surface Processes and Landforms, 36, 58–69, 10.1002/esp.2103.
- Gaudel and De Richter (2019) Gaudel, N., and S. K. De Richter (2019), Effect of vibrations on granular material flows down an inclined plane using DEM simulations, Powder Technology, 346, 256–264, 10.1016/j.powtec.2019.01.080.
- Gilbert (1914) Gilbert, G. K. (1914), The transportation of debris by running water, in US Geological Survey Professional Paper 86, U.S. Geological Survey, Washington, D.C, USA, 10.3133/pp86.
- Gillette et al. (1980) Gillette, D. A., J. Adams, A. Endo, D. Smith, and R. Kihl (1980), Threshold velocities for input of soil particles into the air by desert soils, Journal of Geophysical Research: Oceans, 85(C10), 5621–5630, 10.1029/JC085iC10p05621.
- Giménez-Curto and Corniero (2009) Giménez-Curto, L. A., and M. A. Corniero (2009), Entrainment threshold of cohesionless sediment grains under steady flow of air and water, Sedimentology, 56(2), 493–509, 10.1111/j.1365-3091.2008.00981.x.
- Gondret et al. (2002) Gondret, P., M. Lance, and L. Petit (2002), Bouncing motion of spherical particles in fluids, Physics of Fluids, 14, 643, 10.1063/1.1427920.
- González et al. (2017) González, C., D. H. Richter, D. Bolster, S. Bateman, J. Calantoni, and C. Escauriaza (2017), Characterization of bedload intermittency near the threshold of motion using a Lagrangian sediment transport model, Environmental Fluid Mechanics, 17(1), 111–137, 10.1007/s10652-016-9476-x.
- Gordon and McKenna Neuman (2009) Gordon, M., and C. McKenna Neuman (2009), A comparison of collisions of saltating grains with loose and consolidated silt surfaces, Journal of Geophysical Research: Earth Surface, 114, F04,015, 10.1029/2009JF001330.
- Gordon and McKenna Neuman (2011) Gordon, M., and C. McKenna Neuman (2011), A study of particle splash on developing ripple forms for two bed materials, Geomorphology, 129, 79–91, 10.1016/j.geomorph.2011.01.015.
- Govers (1987) Govers, G. (1987), Initiation of motion in overland flow, Sedimentology, 34, 1157–1164, 10.1111/j.1365-3091.1987.tb00598.x.
- Graf and Pazis (1977) Graf, W. H., and G. C. Pazis (1977), Desposition and erosion in an alluvial channel, Journal of Hydraulic Research, 15(2), 151–166, 10.1080/00221687709499653.
- Greeley and Marshall (1985) Greeley, R., and J. R. Marshall (1985), Transport of Venusian rolling ‘stones’ by wind?, Nature, 313, 771–773, 10.1038/313771a0.
- Greeley et al. (1976) Greeley, R., B. White, R. Leach, J. Iversen, and J. Pollack (1976), Mars: Wind friction speeds for particle movement, Geophysical Research Letters, 3(8), 417–420, 10.1029/GL003i008p00417.
- Greeley et al. (1980) Greeley, R., R. Leach, B. White, J. Iversen, and J. Pollack (1980), Threshold windspeeds for sand on mars: Wind tunnel simulations, Geophysical Research Letters, 7(2), 121–124, 10.1029/GL007i002p00121.
- Greeley et al. (1984) Greeley, R., J. Iversen, R. Leach, J. Marshall, B. White, and S. Williams (1984), Windblown sand on Venus: Preliminary results of laboratory simulations, Icarus, 57, 112–124, 10.1016/0019-1035(84)90013-7.
- Guazzelli and Pouliquen (2018) Guazzelli, E., and O. Pouliquen (2018), Rheology of dense granular suspensions, Journal of Fluid Mechanics, 852, P1, 10.1017/jfm.2018.548.
- Guo and Julien (2007) Guo, J., and P. Y. Julien (2007), Buffer law and transitional roughness effect in turbulent open-channel flows, in The Fifth International Symposium on Environmental Hydraulics (ISEH V), Tempe, Arizona, vol. Paper 5, pp. 1–6, University of Nebraska - Lincoln.
- Haff and Anderson (1993) Haff, P. K., and R. S. Anderson (1993), Grain scale simulations of loose sedimentary beds: the example of grain-bed impacts in aeolian saltation, Sedimentology, 40, 175–198, 10.1111/j.1365-3091.1993.tb01760.x.
- Hansen et al. (1990) Hansen, C. J., A. S. McEwen, A. P. Ingersoll, and R. J. Terrile (1990), Surface and airborne evidence for plumes and winds on triton, Science, 250(4979), 421–424, 10.1126/science.250.4979.421.
- He and Ohara (2017) He, S., and N. Ohara (2017), A new formula for estimating the threshold wind speed for snow movement, Journal of Advances in Modeling Earth Systems, 9, 2514–2525, 10.1002/2017MS000982.
- Heathershaw and Thorne (1985) Heathershaw, A. D., and P. D. Thorne (1985), Sea-bed noises reveal role of turbulent bursting phenomenon in sediment transport by tidal currents, Nature, 316, 339–342, 10.1038/316339a0.
- Helland-Hansen et al. (1974) Helland-Hansen, E., P. C. Klingeman, and R. T. Milhous (1974), Sediment transport at low shields-parameter values, Journal of the Hydraulics Division, 100(1), 261–265.
- Henann and Kamrin (2013) Henann, D. L., and K. Kamrin (2013), A predictive, size-dependent continuum model for dense granular flows, Proceedings of the National Academy of Sciences, 110(17), 6730–6735, 10.1073/pnas.1219153110.
- Herminghaus (2005) Herminghaus, S. (2005), Dynamics of wet granular matter, Advances in Physics, 54(3), 221–261, 10.1080/00018730500167855.
- Heyman et al. (2013) Heyman, J., F. Mettra, H. B. Ma, and C. Ancey (2013), Statistics of bedload transport over steep slopes: Separation of time scales and collective motion, Geophysical Research Letters, 40, 128–133, 10.1029/2012GL054280.
- Heyman et al. (2016) Heyman, J., P. Bohorquez, and C. Ancey (2016), Entrainment, motion, and deposition of coarse particles transported by water over a sloping mobile bed, Journal of Geophysical Research: Earth Surface, 121, 1931–1952, 10.1002/2015JF003672.
- Ho (2012) Ho, T. D. (2012), Etude expérimentale du transport de particules dans une couche limite turbulente, Ph.D. thesis, University of Rennes, Rennes, France.
- Ho et al. (2012) Ho, T. D., P. Dupont, A. Ould El Moctar, and A. Valance (2012), Particle velocity distribution in saltation transport, Physical Review E, 85, 052,301, 10.1103/PhysRevE.85.052301.
- Hofland (2005) Hofland, B. (2005), Rock & roll: Turbulence-induced damage to granular bed protections, Ph.D. thesis, Delft University of Technology, Delft, The Netherlands.
- Hofland et al. (2005) Hofland, B., R. Booij, and J. Battjes (2005), Measurement of fluctuating pressures on coarse bed material, Journal of Hydraulic Engineering, 131(9), 770–781, 10.1061/(ASCE)0733-9429(2005)131:9(770).
- Hong et al. (2015) Hong, A., M. Tao, and A. Kudrolli (2015), Onset of erosion of a granular bed in a channel driven by fluid flow, Physics of Fluids, 27(1), 013,301, 10.1063/1.4905146.
- Houssais and Jerolmack (2017) Houssais, M., and D. J. Jerolmack (2017), Toward a unifying constitutive relation for sediment transport across environments, Geomorphology, 277, 251–264, 10.1016/j.geomorph.2016.03.026.
- Houssais et al. (2015) Houssais, M., C. P. Ortiz, D. J. Durian, and D. J. Jerolmack (2015), Onset of sediment transport is a continuous transition driven by fluid shear and granular creep, Nature Communications, 6, 6527, 10.1038/ncomms7527.
- Houssais et al. (2016) Houssais, M., C. P. Ortiz, D. J. Durian, and D. J. Jerolmack (2016), Rheology of sediment transported by a laminar flow, Physical Review E, 94, 062,609, 10.1103/PhysRevE.94.062609.
- Huang et al. (2014) Huang, H. J., T. L. Bo, and X. J. Zheng (2014), Numerical modeling of wind-blown sand on Mars, The European Physical Journal E, 37(9), 80, 10.1140/epje/i2014-14080-7.
- Huang et al. (2017) Huang, H. J., T. L. Bo, and R. Zhang (2017), Exploration of splash function and lateral velocity based on three-dimensional mixed-size grain/bed collision, Granular Matter, 19, 73, 10.1007/s10035-017-0759-9.
- Iversen et al. (1987) Iversen, J., R. Greeley, J. R. Marshall, and J. B. Pollack (1987), Aeolian saltation threshold: the effect of density ratio, Sedimentology, 34, 699–706, 10.1111/j.1365-3091.1987.tb00795.x.
- Iversen and Rasmussen (1994) Iversen, J. D., and K. R. Rasmussen (1994), The effect of surface slope on saltation threshold, Sedimentology, 41, 721–728, 10.1111/j.1365-3091.1994.tb01419.x.
- Iversen and White (1982) Iversen, J. D., and B. R. White (1982), Saltation threshold on Earth, Mars and Venus, Sedimentology, 29, 111, 10.1111/j.1365-3091.1982.tb01713.x.
- Iversen et al. (1976) Iversen, J. D., J. B. Pollack, R. Greeley, and B. R. White (1976), Saltation threshold on Mars: The effect of interparticle force, surface-roughness, and low atmospheric density, Icarus, 29, 381–393, 10.1016/0019-1035(76)90140-8.
- Jenkins and Valance (2014) Jenkins, J. T., and A. Valance (2014), Periodic trajectories in aeolian sand transport, Physics of Fluids, 26(7), 073,301, 10.1063/1.4885576.
- Jenkins and Valance (2018) Jenkins, J. T., and A. Valance (2018), Two-phase continuum theory for windblown sand, Physical Review Fluids, 3, 034,305, 10.1103/PhysRevFluids.3.034305.
- Jenkins et al. (2010) Jenkins, J. T., I. Cantat, and A. Valance (2010), Continuum model for steady, fully developed saltation above a horizontal particle bed, Physical Review E, 82, 020,301(R), 10.1103/PhysRevE.82.020301.
- Jia et al. (2017) Jia, P., B. Andreotti, and P. Claudin (2017), Giant ripples on comet 67p/churyumov-gerasimenko sculpted by sunset thermal wind, Proceedings of the National Academy of Science, 114(10), 2509–2514, 10.1073/pnas.1612176114.
- Jia et al. (2011) Jia, X., T. Brunet, and J. Laurent (2011), Elastic weakening of a dense granular pack by acoustic fluidization: Slipping, compaction, and aging, Physical Review E, 84, 020,301, 10.1103/PhysRevE.84.020301.
- Jop (2015) Jop, P. (2015), Rheological properties of dense granular flows, Comptes Rendus Physique, 16(1), 62–72, 10.1016/j.crhy.2014.12.001.
- Jop et al. (2005) Jop, P., Y. Forterre, and O. Pouliquen (2005), Crucial role of sidewalls in granular surface flows: consequences for the rheology, Journal of Fluid Mechanics, 541, 167–192, 10.1017/S0022112005005987.
- Jop et al. (2006) Jop, P., Y. Forterre, and O. Pouliquen (2006), A constitutive law for dense granular flows, Nature, 441(7094), 727–730, 10.1038/nature04801.
- Kalinske (1947) Kalinske, A. A. (1947), Movement of sediment as bed load in rivers, Transactions of the American Geophysical Union, 28(4), 615–620, 10.1029/TR028i004p00615.
- Kamrin (2018) Kamrin, K. (2018), Quantitative rheological model for granular materials: The importance of particle size, Handbook of Materials Modeling: Applications: Current and Emerging Materials, pp. 1–24.
- Kamrin and Henann (2015) Kamrin, K., and D. L. Henann (2015), Nonlocal modeling of granular flows down inclines, Soft Matter, 11(1), 179–185, 10.1039/C4SM01838A.
- Kamrin and Koval (2012) Kamrin, K., and G. Koval (2012), Nonlocal constitutive relation for steady granular flow, Physical Review Letters, 108, 178,301, 10.1103/PhysRevLett.108.178301.
- Kamrin and Koval (2014) Kamrin, K., and G. Koval (2014), Effect of particle surface friction on nonlocal constitutive behavior of flowing granular media, Computational Particle Mechanics, 1, 169–176, 10.1007/s40571-014-0018-3.
- Kaufmann et al. (2006) Kaufmann, E., N. I. Kömle, and G. Kargl (2006), Laboratory simulation experiments on the solid-state greenhouse effect in planetary ices, Icarus, 185(1), 274–286, 10.1016/j.icarus.2006.07.009.
- Kirchner et al. (1990) Kirchner, J. W., W. E. Dietrich, F. Iseya, and H. Ikeda (1990), The variability of critical shear stress, friction angle, and grain protrusion in water‐worked sediments, Sedimentology, 37(4), 647–672, 10.1111/j.1365-3091.1990.tb00627.x.
- Knight et al. (1995) Knight, J. B., C. G. Fandrich, C. N. Lau, H. M. Jaeger, and S. R. Nagel (1995), Density relaxation in a vibrated granular material, Physical Review E, 51, 3957–3963, 10.1103/PhysRevE.51.3957.
- Kok (2010a) Kok, J. F. (2010a), An improved parametrization of wind blown sand flux on Mars that includes the effect of hysteresis, Geophysical Research Letters, 37, L12,202, 10.1029/2010GL043646.
- Kok (2010b) Kok, J. F. (2010b), Difference in the wind speeds required for initiation versus continuation of sand transport on Mars: Implications for dunes and dust storms, Physical Review Letters, 104, 074,502, 10.1103/PhysRevLett.104.074502.
- Kok and Renno (2006) Kok, J. F., and N. O. Renno (2006), Enhancement of the emission of mineral dust aerosols by electric forces, Physical Review Letters, 33, L19S10, 10.1029/2006GL026284.
- Kok and Renno (2009) Kok, J. F., and N. O. Renno (2009), A comprehensive numerical model of steady state saltation (comsalt), Journal of Geophysical Research: Atmospheres, 114, D17,204, 10.1029/2009JD011702.
- Kok et al. (2012) Kok, J. F., E. J. R. Parteli, T. I. Michaels, and D. B. Karam (2012), The physics of wind-blown sand and dust, Reports on Progress in Physics, 75, 106,901, 10.1088/0034-4885/75/10/106901.
- Komatsu et al. (2001) Komatsu, T. S., S. Inagaki, N. Nakagawa, and S. Nasuno (2001), Creep motion in a granular pile exhibiting steady surface flow, Physical Review Letters, 86, 1757–1760, 10.1103/PhysRevLett.86.1757.
- Koval et al. (2009) Koval, G., J. N. Roux, A. Corfdir, and F. Chevoir (2009), Annular shear of cohesionless granular materials: From the inertial to quasistatic regime, Physical Review E, 79, 021,306, 10.1103/PhysRevE.79.021306.
- Kramer (1935) Kramer, H. (1935), Sand mixtures and sand movement in fluvial models, Transactions of the American Society of Civil Engineers, 100, 798–838.
- Lacks and Sankaran (2011) Lacks, D. J., and R. M. Sankaran (2011), Contact electrification of insulating materials, Journal of Physics D: Applied Physics, 44(45), 453,001, 10.1088/0022-3727/44/45/453001.
- Lajeunesse et al. (2010) Lajeunesse, E., L. Malverti, and F. Charru (2010), Bed load transport in turbulent flow at the grain scale: Experiments and modeling, Journal of Geophysical Research: Earth Surface, 115(F4), F04,001, 10.1029/2009JF001628.
- Lämmel and Kroy (2017) Lämmel, M., and K. Kroy (2017), Analytical mesoscale modeling of aeolian sand transport, Physical Review E, 96, 052,906, 10.1103/PhysRevE.96.052906.
- Lämmel et al. (2012) Lämmel, M., D. Rings, and K. Kroy (2012), A two-species continuum model for aeolian sand transport, New Journal of Physics, 14, 093,037, 10.1088/1367-2630/14/9/093037.
- Lämmel et al. (2017) Lämmel, M., K. Dzikowski, K. Kroy, L. Oger, and A. Valance (2017), Grain-scale modeling and splash parametrization for aeolian sand transport, Physical Review E, 95, 022,902, 10.1103/PhysRevE.95.022902.
- Lätzel et al. (2003) Lätzel, M., S. Luding, H. J. Herrmann, D. W. Howell, and R. P. Behringer (2003), Comparing simulation and experiment of a 2d granular couette shear device, The European Physical Journal E, 11, 325–333, 10.1140/epje/i2002-10160-7.
- Lavelle and Mofjeld (1987) Lavelle, J. W., and H. O. Mofjeld (1987), Do critical stresses for incipient motion and erosion really exist?, Journal of Hydraulic Engineering, 113(3), 370–385, 10.1061/(ASCE)0733-9429(1987)113:3(370).
- Lebonnois et al. (2018) Lebonnois, S., G. Schubert, F. Forgeta, and A. Spiga (2018), Planetary boundary layer and slope winds on Venus, Icarus, 10.1016/j.icarus.2018.06.006.
- Lee and Jerolmack (2018) Lee, D. B., and D. Jerolmack (2018), Determining the scales of collective entrainment in collision-driven bed load, Earth Surface Dynamics, 6, 1089–1099, 10.5194/esurf-6-1089-2018.
- Lee et al. (2012) Lee, H., M. Y. Ha, and S. Balachandar (2012), Work-based criterion for particle motion and implication for turbulent bed-load transport, Physics of Fluids, 24, 116,604, 10.1063/1.4767541.
- Lehning et al. (2000) Lehning, M., J. Doorschot, and P. Bartelt (2000), A snowdrift index based on snowpack model calculations, Annals of Glaciology, 31, 382–386, 10.3189/172756400781819770.
- Li and McKenna Neuman (2012) Li, B., and C. McKenna Neuman (2012), Boundary-layer turbulence characteristics during aeolian saltation, Geophysical Research Letters, 39(11), L11,402, 10.1029/2012GL052234.
- Li and Henann (2019) Li, S., and D. L. Henann (2019), Material stability and instability in non-local continuum models for dense granular materials, Journal of Fluid Mechanics, 871, 799–830, 10.1017/jfm.2019.311.
- Ling (1995) Ling, C. H. (1995), Criteria for incipient motion of spherical sediment particles, Journal of Hydraulic Engineering, 121(6), 472–478, 10.1061/(ASCE)0733-9429(1995)121:6(472).
- Liu and Szlufarska (2012) Liu, Y., and I. Szlufarska (2012), Chemical origins of frictional aging, Physical Review Letters, 109, 186,102, 10.1103/PhysRevLett.109.186102.
- Lobkovsky et al. (2008) Lobkovsky, A. E., A. Orpe, R. Molloy, A. Kudrolli, and D. Rothman (2008), Erosion of a granular bed driven by laminar fluid flow, Journal of Fluid Mechanics, 605, 47–58, 10.1017/S0022112008001389.
- Loiseleux et al. (2005) Loiseleux, T., P. Gondret, M. Rabaud, and D. Doppler (2005), Onset of erosion and avalanche for an inclined granular bed sheared by a continuous laminar flow, Physics of Fluids, 17, 103,304, 10.1063/1.2109747.
- Lorenz (2014) Lorenz, R. D. (2014), Physics of saltation and sand transport on Titan: A brief review, Icarus, 230, 162–167, 10.1016/j.icarus.2013.06.023.
- Lorenz et al. (2010) Lorenz, R. D., P. Claudin, B. Andreotti, J. Radebaugh, and T. Tokanod (2010), A 3 km atmospheric boundary layer on Titan indicated by dune spacing and huygens data, Icarus, 205(2), 719–721, 10.1016/j.icarus.2009.08.002.
- Lu et al. (2005) Lu, H., M. R. Raupach, and K. S. Richards (2005), Modeling entrainment of sedimentary particles by wind and water: A generalized approach, Journal of Geophysical Research: Atmospheres, 110, D24,114, 10.1029/2005JD006418.
- Lyles and Krauss (1971) Lyles, L., and R. K. Krauss (1971), Threshold velocities and initial particle motion as influenced by air turbulence, in Transactions of the American Society of Agricultural Engineers, vol. 14, pp. 563–566, ASAE, Saint Joseph, Michigan, 10.13031/2013.38339.
- MacKenzie and Eaton (2017) MacKenzie, L. G., and B. C. Eaton (2017), Large grains matter: contrasting bed stability and morphodynamics during two nearly identical experiments, Earth Surface Processes and Landforms, 42, 1287–1295, 10.1002/esp.4122.
- MacKenzie et al. (2018) MacKenzie, L. G., B. C. Eaton, and M. Church (2018), Breaking from the average: Why large grains matter in gravel-bed streams, Earth Surface Processes and Landforms, 43, 3190–3196, 10.1002/esp.4465.
- Mantz (1977) Mantz, P. A. (1977), Incipient transport of fine grains and flakes by fluids-extended shield diagram, Journal of the Hydraulics division, 103(ASCE 12992).
- Martin and Kok (2017) Martin, R. L., and J. F. Kok (2017), Wind-invariant saltation heights imply linear scaling of aeolian saltation flux with shear stress, Science Advances, 3, e1602,569, 10.1126/sciadv.1602569.
- Martin and Kok (2018) Martin, R. L., and J. F. Kok (2018), Distinct thresholds for the initiation and cessation of aeolian saltation from field measurements, Journal of Geophysical Research: Earth Surface, 123(7), 1546–1565, 10.1029/2017JF004416.
- Martin and Kok (2019) Martin, R. L., and J. F. Kok (2019), Size‐independent susceptibility to transport in aeolian saltation, Journal of Geophysical Research: Earth Surface, 124(7), 1658–1674, 10.1029/2019JF005104.
- Martin et al. (2012) Martin, R. L., D. J. Jerolmack, and R. Schumer (2012), The physical basis for anomalous diffusion in bed load transport, Journal of Geophysical Research: Earth Surface, 117, F01,018, 10.1029/2011JF002075.
- Masteller and Finnegan (2017) Masteller, C. C., and N. J. Finnegan (2017), Interplay between grain protrusion and sediment entrainment in an experimental flume, Journal of Geophysical Research: Earth Surface, 122(1), 274–289, 10.1002/2016JF003943.
- Maurin et al. (2015) Maurin, R., J. Chauchat, B. Chareyre, and P. Frey (2015), A minimal coupled fluid-discrete element model for bedload transport, Physics of Fluids, 27(11), 113,302, 10.1063/1.4935703.
- Maurin et al. (2016) Maurin, R., J. Chauchat, and P. Frey (2016), Dense granular flow rheology in turbulent bedload transport, Journal of Fluid Mechanics, 804, 490–512, 10.1017/jfm.2016.520.
- Maurin et al. (2018) Maurin, R., J. Chauchat, and P. Frey (2018), Revisiting slope influence in turbulent bedload transport: consequences for vertical flow structure and transport rate scaling, Journal of Fluid Mechanics, 839, 135–156, 10.1017/jfm.2017.903.
- McElwaine et al. (2004) McElwaine, J. N., N. Maeno, and K. Sugiura (2004), The splash function for snow from wind-tunnel measurements, Annals of Glaciology, 38, 71–78, 10.3189/172756404781815356.
- McEwan et al. (1992) McEwan, I. K., B. B. Willetts, and M. A. Rice (1992), The grain/bed collision in sand transport by wind, Sedimentology, 39(6), 971–981, 10.1111/j.1365-3091.1992.tb01991.x.
- Merrison (2012) Merrison, J. P. (2012), Sand transport, erosion and granular electrification, Aeolian Research, 4, 1–16, 10.1016/j.aeolia.2011.12.003.
- Merrison et al. (2007) Merrison, J. P., H. P. Gunnlaugsson, P. Nørnberg, A. E. Jensen, and K. Rasmussen (2007), Determination of the wind induced detachment threshold for granular material on Mars using wind tunnel simulations, Icarus, 191, 568–580, 10.1016/j.icarus.2007.04.035.
- Meyer-Peter and Müller (1948) Meyer-Peter, E., and R. Müller (1948), Formulas for bedload transport, in Proceedings of the 2nd Meeting of the International Association for Hydraulic Structures Research, pp. 39–64, IAHR, Stockholm.
- MiDi (2004) MiDi, G. (2004), On dense granular flows, The European Physical Journal E, 14(4), 341–365, 10.1140/epje/i2003-10153-0.
- Miller et al. (1977) Miller, M. C., I. N. McCave, and P. D. Komar (1977), Threshold of sediment motion under unidirectional currents, Sedimentology, 24, 507–527, 10.1111/j.1365-3091.1977.tb00136.x.
- Mitha et al. (1986) Mitha, S., M. Q. Tran, B. T. Werner, and P. K. Haff (1986), The grain-bed impact process in aeolian saltation, Acta Mechanica, 63, 267–278, 10.1007/BF01182553.
- Mollinger and Nieuwstadt (1996) Mollinger, A. M., and F. T. M. Nieuwstadt (1996), Measurement of the lift force on a particle fixed to the wall in the viscous sublayer of a fully developed turbulent boundary layer, Journal of Fluid Mechanics, 316, 285–306, 10.1017/S0022112096000547.
- Moore and Iverson (2002) Moore, P. L., and N. R. Iverson (2002), Slow episodic shear of granular materials regulated by dilatant strengthening, Geology, 30(9), 843–846, 10.1130/0091-7613(2002)030¡0843:SESOGM¿2.0.CO;2.
- Moosavi et al. (2013) Moosavi, R., M. Reza Shaebani, M. Maleki, J. Török, D. E. Wolf, and W. Losert (2013), Coexistence and transition between shear zones in slow granular flows, Physical Review Letters, 111, 148,301, 10.1103/PhysRevLett.111.148301.
- Nalpanis et al. (1993) Nalpanis, P., J. C. R. Hunt, and C. F. Barrett (1993), Saltating particles over flat beds, Journal of Fluid Mechanics, 251, 661–685, 10.1017/S0022112093003568.
- Namikas (2006) Namikas, S. L. (2006), A conceptual model of energy partitioning in the collision of saltating grains with an unconsolidated sediment bed, Journal of Coastal Research, 22(5), 1250–1259, 10.2112/06A-0007.1.
- Nelson et al. (1995) Nelson, J. M., R. L. Shreve, S. R. McLean, and T. G. Drake (1995), Role of near‐bed turbulence structure in bed load transport and bed form mechanics, Water Resources Research, 31(8), 2071–2086, 10.1029/95WR00976.
- Ness and Sun (2015) Ness, C., and J. Sun (2015), Flow regime transitions in dense non-Brownian suspensions: Rheology, microstructural characterization, and constitutive modeling, Physical Review E, 91, 012,201, 10.1103/PhysRevE.91.012201.
- Ness and Sun (2016) Ness, C., and J. Sun (2016), Shear thickening regimes of dense non-Brownian suspensions, Soft Matter, 12, 914–924, 10.1039/c5sm02326b.
- Nichol et al. (2010) Nichol, K., A. Zanin, R. Bastien, E. Wandersman, and M. van Hecke (2010), Flow-induced agitations create a granular fluid, Physical Review Letters, 104, 078,302, 10.1103/PhysRevLett.104.078302.
- Nickling (1988) Nickling, W. G. (1988), The initiation of particle movement by wind, Sedimentology, 35(3), 499–511, 10.1111/j.1365-3091.1988.tb01000.x.
- Nishida et al. (2004) Nishida, M., K. Tanaka, and Y. Matsumoto (2004), Discrete element method simulation of the restitutive characteristics of a steel spherical projectile from a particulate aggregation, JSME International Journal Series A Solid Mechanics and Material Engineering, 47(3), 438–447, 10.1299/jsmea.47.438.
- no and García (1998) no, Y. N., and M. García (1998), Using Lagrangian particle saltation observations for bedload sediment transport modelling, Hydrological Processes, 12, 1197–1218, 10.1002/(SICI)1099-1085(19980630)12:8¡1197::AID-HYP612¿3.0.CO;2-U.
- Oger et al. (2005) Oger, L., M. Ammi, A. Valance, and D. Beladjine (2005), Discrete element method studies of the collision of one rapid sphere on 2d and 3d packings, The European Physical Journal E, 17, 467–476, 10.1140/epje/i2005-10022-x.
- Oger et al. (2008) Oger, L., M. Ammi, A. Valance, and D. Beladjine (2008), Study of the collision of one rapid sphere on 3d packings: Experimental and numerical results, Computers and Mathematics with Applications, 55, 132–148, 10.1016/j.camwa.2007.04.001.
- Ouriemi et al. (2007) Ouriemi, M., P. Aussillous, M. Medale, Y. Peysson, and E. Guazzelli (2007), Determination of the critical shields number for particle erosion in laminar flow, Physics of Fluids, 19(6), 061,706, 10.1063/1.2747677.
- Pähtz (2018) Pähtz, T. (2018), Comment on “Distinct thresholds for the initiation and cessation of aeolian saltation from field measurements” by Raleigh L. Martin and Jasper F. Kok: Alternative interpretation of measured thresholds as two distinct cessation thresholds, Journal of Geophysical Research: Earth Surface, 123(12), 3388–3391, 10.1029/2018JF004824.
- Pähtz and Durán (2017) Pähtz, T., and O. Durán (2017), Fluid forces or impacts: What governs the entrainment of soil particles in sediment transport mediated by a Newtonian fluid?, Physical Review Fluids, 2(7), 074,303, 10.1103/PhysRevFluids.2.074303.
- Pähtz and Durán (2018a) Pähtz, T., and O. Durán (2018a), The cessation threshold of nonsuspended sediment transport across aeolian and fluvial environments, Journal of Geophysical Research: Earth Surface, 123(8), 1638–1666, 10.1029/2017JF004580.
- Pähtz and Durán (2018b) Pähtz, T., and O. Durán (2018b), Universal friction law at granular solid-gas transition explains scaling of sediment transport load with excess fluid shear stress, Physical Review Fluids, 3(10), 104,302, 10.1103/PhysRevFluids.3.104302.
- Pähtz et al. (2012) Pähtz, T., J. F. Kok, and H. J. Herrmann (2012), The apparent roughness of a sand surface blown by wind from an analytical model of saltation, New Journal of Physics, 14(4), 043,035, 10.1088/1367-2630/14/4/043035.
- Pähtz et al. (2018) Pähtz, T., M. Valyrakis, X. H. Zhao, and Z. S. Li (2018), The critical role of the boundary layer thickness for the initiation of aeolian sediment transport, Geosciences, 8(9), 314, 10.3390/geosciences8090314.
- Pähtz et al. (2019) Pähtz, T., O. Durán, D. N. de Klerk, I. Govender, and M. Trulsson (2019), Local rheology relation with variable yield stress ratio across dry, wet, dense, and dilute granular flows, Physical Review Letters, 123(4), 048,001, 10.1103/PhysRevLett.123.048001.
- Pähtz et al. (2020) Pähtz, T., Y. Liu, P. Hu, and Z. He (2020), Bridging aeolian and fluvial sediment transport thresholds: A generalised shields curve from a periodic saltation model, https://arxiv.org/abs/1912.07208.
- Paintal (1971) Paintal, A. S. (1971), Concept of critical shear stress in loose boundary open channels, Journal of Hydraulic Research, 9, 91–113, 10.1080/00221687109500339.
- Papanicolaou et al. (2001) Papanicolaou, A., P. Diplas, C. L. Dancey, and M. Balakrishnan (2001), Surface roughness effects in near‐bed turbulence: Implications to sediment entrainment, Journal of Engineering Mechanics, 127(3), 211–218, 10.1061/(ASCE)0733-9399(2001)127:3(211).
- Paphitis (2001) Paphitis, D. (2001), Sediment movement under unidirectional flows: an assessment of empirical threshold curves, Coastal Engineering, 43(3-4), 227–245, 10.1016/S0378-3839(01)00015-1.
- Parker (1978) Parker, G. (1978), Self-formed straight rivers with equilibrium banks and mobile bed. Part 2. The gravel river, Journal of Fluid Mechanics, 89, 127–146, 10.1017/S0022112078002505.
- Parker and Klingeman (1982) Parker, G., and P. C. Klingeman (1982), On why gravel bed streams are paved, Water Resources Research, 18(5), 1409–1423, 10.1029/WR018i005p01409.
- Petrosyan et al. (2011) Petrosyan, A., B. Galperin, S. E. Larsen, S. R. Lewis, A. Määttänen, P. L. Read, N. Renno, L. P. H. T. Rogberg, H. Savijärvi, T. Siili, A. Spiga, A. Toigo, and L. Vázquez (2011), The Martian atmospheric boundary layer, Reviews of Geophysics, 49, RG3005, 10.1029/2010RG000351.
- Peyneau and Roux (2008a) Peyneau, P. E., and J. N. Roux (2008a), Frictionless bead packs have macroscopic friction, but no dilatancy, Physical Review E, 78, 011,307, 10.1103/PhysRevE.78.011307.
- Peyneau and Roux (2008b) Peyneau, P. E., and J. N. Roux (2008b), Solidlike behavior and anisotropy in rigid frictionless bead assemblies, Physical Review E, 78, 041,307, 10.1103/PhysRevE.78.041307.
- Phillips and Jerolmack (2016) Phillips, C. B., and D. J. Jerolmack (2016), Self-organization of river channels as a critical filter on climate signals, Science, 352(6286), 694–697, 10.1126/science.aad3348.
- Pierson et al. (1987) Pierson, T. C., J. E. Costa, and W. Vancouver (1987), A rheologic classification of subaerial sediment-water flows, Debris flows/avalanches: process, recognition, and mitigation. Reviews in Engineering Geology, 7, 1–12, 10.1130/REG7-p1.
- Pilotti and Menduni (2001) Pilotti, M., and G. Menduni (2001), Beginning of sediment transport of incoherent grains in shallow shear flows, Journal of Hydraulic Research, 39(2), 115–124, 10.1080/00221680109499812.
- Pons et al. (2016) Pons, A., T. Darnige, J. Crassous, E. Clément, and A. Amon (2016), Spatial repartition of local plastic processes in different creep regimes in a granular material, Europhysics Letters, 113(2), 843–846, 10.1209/0295-5075/113/28001.
- Pouliquen and Forterre (2009) Pouliquen, O., and Y. Forterre (2009), A non-local rheology for dense granular flows, Philosophical Transactions of the Royal Society A: Mathematical, Physical and Engineering Sciences, 367(1909), 5091–5107, 10.1098/rsta.2009.0171.
- Prancevic and Lamb (2015) Prancevic, J. P., and M. P. Lamb (2015), Unraveling bed slope from relative roughness in initial sediment motion, Journal of Geophysical Research: Earth Surface, 120, 474–489, 10.1002/2014JF003323.
- Prancevic et al. (2014) Prancevic, J. P., M. P. Lamb, and B. M. Fuller (2014), Incipient sediment motion across the river to debris-fl ow transition, Geology, 42(3), 191–194, 10.1130/G34927.1.
- Radjaï et al. (1998) Radjaï, F., D. E. Wolf, M. Jean, and J. J. Moreau (1998), Bimodal character of stress transmission in granular packings, Physical Review Letters, 80, 61–64, 10.1103/PhysRevLett.80.61.
- Raffaele et al. (2016) Raffaele, L., L. Bruno, F. Pellerey, and L. Preziosi (2016), Windblown sand saltation: A statistical approach to fluid threshold shear velocity, Aeolian Research, 23, 79–91, 10.1016/j.aeolia.2016.10.002.
- Rasmussen et al. (2015) Rasmussen, K. R., A. Valance, and J. Merrison (2015), Laboratory studies of aeolian sediment transport processes on planetary surfaces, Geomorphology, 244, 74–94, 10.1016/j.geomorph.2015.03.041.
- Recking (2010) Recking, A. (2010), A comparison between flume and field bed load transport data and consequences for surface‐based bed load transport prediction, Water Resources Research, 46, W03,518, 10.1029/2009WR008007.
- Recking et al. (2012) Recking, A., F. Liébault, C. Peteuil, and T. Jolimet (2012), Testing bedload transport equations with consideration of time scales, Earth Surface Processes and Landforms, 37, 774–789, 10.1002/esp.3213.
- Reid et al. (1985) Reid, I., L. E. Frostick, and J. T. Layman (1985), The incidence and nature of bedload transport during flood flows in coarse-grained alluvial channels, Earth Surface Processes and Landforms, 10(1), 33–44, 10.1002/esp.3290100107.
- Ribière et al. (2005) Ribière, P., P. Philippe, P. Richard, R. Delannay, and D. Bideau (2005), Slow compaction of granular systems, Journal of Physics: Condensed Matter, 17(24), S2743–S2754, 10.1088/0953-8984/17/24/024.
- Rice et al. (1995) Rice, M. A., B. B. Willetts, and I. K. McEwan (1995), An experimental study of multiple grain-size ejecta produced by collisions of saltating grains with a flat bed, Sedimentology, 42(4), 695–706, 10.1111/j.1365-3091.1995.tb00401.x.
- Rice et al. (1996) Rice, M. A., B. B. Willetts, and I. K. McEwan (1996), Observations of collisions of saltating grains with a granular bed from high-speed cine-film, Sedimentology, 43(1), 21–31, 10.1111/j.1365-3091.1996.tb01456.x.
- Rioual et al. (2000) Rioual, F., A. Valance, and D. Bideau (2000), Experimental study of the collision process of a grain on a two-dimensional granular bed, Physical Review E, 62, 2450, 10.1103/PhysRevE.62.2450.
- Rioual et al. (2003) Rioual, F., A. Valance, and D. Bideau (2003), Collision process of a bead on a two-dimensional bead packing: Importance of the inter-granular contacts, Europhysics Letters, 61(2), 194, 10.1209/epl/i2003-00212-8.
- Roering et al. (2001) Roering, J. J., J. W. Kirchner, L. S. Sklar, and W. E. Dietrich (2001), Hillslope evolution by nonlinear creep and landsliding: An experimental study, Geology, 29(2), 143–146, 10.1130/0091-7613(2002)030¡0481:HEBNCA¿2.0.CO;2.
- Salevan et al. (2017) Salevan, J. C., A. H. Clark, M. D. Shattuck, C. S. O’Hern, and N. T. Ouellette (2017), Determining the onset of hydrodynamic erosion in turbulent flow, Physical Review Fluids, 2, 114,302, 10.1103/PhysRevFluids.2.114302.
- Salim et al. (2017) Salim, S., C. Pattiaratchi, R. Tinoco, G. Coco, Y. Hetzel, S. Wijeratne, and R. Jayaratne (2017), The influence of turbulent bursting on sediment resuspension under unidirectional currents, Earth Surface Dynamics, 5, 399–415, 10.5194/esurf-5-399-2017.
- Salim et al. (2018) Salim, S., C. Pattiaratchi, R. O. Tinoco, and R. Jayaratne (2018), Sediment resuspension due to near-bed turbulent effects: A deep sea case study on the northwest continental slope of western australia, Journal of Geophysical Research: Oceans, 123(10), 7102–7119, 10.1029/2018JC013819.
- Savage (1984) Savage, S. B. (1984), The mechanics of rapid granular flows, in Advances in Applied Mechanics, vol. 24, pp. 289–366, Elsevier, San Diego, USA, 10.1016/S0065-2156(08)70047-4.
- Schmeeckle (2014) Schmeeckle, M. W. (2014), Numerical simulation of turbulence and sediment transport of medium sand, Journal of Geophysical Research: Earth Surface, 119(6), 1240–1262, 10.1002/2013JF002911.
- Schmeeckle et al. (2007) Schmeeckle, M. W., J. M. Nelson, and R. L. Shreve (2007), Forces on stationary particles in near‐bed turbulent flows, Journal of Geophysical Research: Earth Surface, 112, F02,003, 10.1029/2006JF000536.
- Schmidt (1980) Schmidt, R. A. (1980), Threshold wind-speeds and elastic impact in snow transport, Journal of Glaciology, 26(94), 453–467, 10.3189/S0022143000010972.
- Seizilles et al. (2014) Seizilles, G., E. Lajeunesse, O. Devauchelle, and M. Bak (2014), Cross-stream diffusion in bedload transport, Physics of Fluids, 26, 013,302, 10.1063/1.4861001.
- Shao and Lu (2000) Shao, Y., and H. Lu (2000), A simple expression for wind erosion threshold friction velocity, Journal of Geophysical Research: Atmospheres, 105(D17), 22,437–22,443, 10.1029/2000JD900304.
- Shields (1936) Shields, A. F. (1936), Application of Similarity Principles and Turbulence Research to Bedload Movement (English translation of the original German manuscript), 167, Hydrodynamics Laboratory, California Institute of Technology, Pasadena.
- Shih and Diplas (2018) Shih, W., and P. Diplas (2018), A unified approach to bed load transport description over a wide range of flow conditions via the use of conditional data treatment, Water Resources Research, 54, 3490–3509, 10.1029/2017WR022373.
- Shih and Diplas (2019) Shih, W., and P. Diplas (2019), Threshold of motion conditions under stokes flow regime and comparison with turbulent flow data, Water Resources Research, 55, 10,872–10,892, 10.1029/2019WR024836.
- Silvestro et al. (2013) Silvestro, S., D. A. Vaz, R. C. Ewing, A. P. Rossi, L. K. Fenton, T. I. Michaels, J. Flahaut, and P. E. Geissler (2013), Pervasive aeolian activity along rover Curiosity’s traverse in Gale Crater, Mars, Geology, 41(4), 483–486, 10.1130/G34162.1.
- Singh et al. (2009) Singh, A., K. Fienberg, D. J. Jerolmack, J. Marr, and E. Foufoula-Georgiou (2009), Experimental evidence for statistical scaling and intermittency in sediment transport rates, Journal of Geophysical Research: Earth Surface, 114, F01,025, 10.1029/2007JF000963.
- Smits et al. (2011) Smits, A. J., B. J. McKeon, and I. Marusic (2011), High-Reynolds number wall turbulence, Annual Review of Fluid Mechanics, 43, 353–375, 10.1146/annurev-fluid-122109-160753.
- Srivastava et al. (2019) Srivastava, I., L. E. Silbert, G. S. Grest, and J. B. Lechman (2019), Flow-arrest transitions in frictional granular matter, Physical Review Letters, 122, 048,003, 10.1103/PhysRevLett.122.048003.
- Stewart et al. (2001) Stewart, R. L., J. Bridgwater, Y. C. Zhou, and A. B. Yu (2001), Simulated and measured flow of granules in a bladed mixer–a detailed comparison, Chemical Engineering Science, 56(19), 5457–5471, 10.1016/S0009-2509(01)00190-7.
- Sullivan and Kok (2017) Sullivan, R., and J. F. Kok (2017), Aeolian saltation on Mars at low wind speeds, Journal of Geophysical Research: Planets, 122, 2111–2143, 10.1002/2017JE005275.
- Sumer et al. (2003) Sumer, B. M., L. H. C. Chua, N. S. Cheng, and J. Fredsøe (2003), Influence of turbulence on bed load sediment transport, Journal of Hydraulic Engineering, 129(8), 585–596, 10.1061/(ASCE)0733-9429(2003)129:8(585).
- Sutherland (1967) Sutherland, A. J. (1967), Proposed mechanism for sediment entrainment by turbulent flows, Journal of Geophysical Research, 72(24), 6183–6194, 10.1029/JZ072i024p06183.
- Swann et al. (2020) Swann, C., D. J. Sherman, and R. C. Ewing (2020), Experimentally derived thresholds for windblown sand on Mars, Geophysical Research Letters, 47, e2019GL084,484, 10.1029/2019GL084484.
- Takahashi (1978) Takahashi, T. (1978), Mechanical characteristics of debris flow, Journal of the Hydraulics Division of ASCE, 104, 1153–1169.
- Tanabe et al. (2017) Tanabe, T., T. Shimada, N. Ito, and H. Nishimori (2017), Splash detail due to a single grain incident on a granular bed, Physical Review E, 95, 022,906, 10.1103/PhysRevE.95.022906.
- Tanaka et al. (2002) Tanaka, K., M. Nishida, T. Kunimochi, and T. Takagi (2002), Discrete element simulation and experiment for dynamic response of two-dimensional granular matter to the impact of a spherical projectile, Powder Technology, 124, 160–173, 10.1016/S0032-5910(01)00489-2.
- Telfer et al. (2018) Telfer, M. W., E. J. R. Parteli, J. Radebaugh, R. A. Beyer, T. Bertrand, F. Forget, F. Nimmo, W. M. Grundy, J. M. Moore, S. A. Stern, J. Spencer, T. R. Lauer, A. M. Earle, R. P. Binzel, H. A. Weaver, C. B. Olkin, L. A. Young, K. Ennico, K. Runyon, and The New Horizons Geology, Geophysics and Imaging Science Theme Team (2018), Dunes on Pluto, Science, 360, 992–997, 10.1126/science.aao2975.
- Terzaghi (1951) Terzaghi, K. (1951), Theoretical soil mechanics, Chapman And Hall, Limited.; London.
- Thomas et al. (2015) Thomas, N., B. Davidsson, M. R. El-Maarry, S. Fornasier, L. Giacomini, A. G. Gracia-Berná, S. F. Hviid, W. H. Ip, L. Jorda, H. U. Keller, J. Knollenberg, E. Kührt, F. L. Forgia, I. L. Lai, Y. Liao, R. Marschall, M. Massironi, S. Mottola, M. Pajola, O. Poch, A. Pommerol, F. Preusker, F. Scholten, C. C. Su, J. S. Wu, J. B. Vincent, H. Sierks, C. Barbieri, P. L. Lamy, R. Rodrigo, D. Koschny, H. Rickman, M. F. A’Hearn, M. A. Barucci, J. L. Bertaux, I. Bertini, G. Cremonese, V. D. Deppo, S. Debei, M. de Cecco, M. Fulle, O. Groussin, P. J. Gutierrez, J. R. Kramm, M. Küppers, L. M. Lara, M. Lazzarin, J. J. L. Moreno, F. Marzari, H. Michalik, G. Naletto, J. Agarwal, C. Güttler, N. Oklay, , and C. Tubiana (2015), Redistribution of particles across the nucleus of comet 67p/churyumov-gerasimenko, Astronomy & Astrophysics, 583, A17, 10.1051/0004-6361/201526049.
- Thompson and Clark (2019) Thompson, J. D., and A. H. Clark (2019), Critical scaling for yield is independent of distance to isostaticity, Physical Review Research, 1, 012,002(R), 10.1103/PhysRevResearch.1.012002.
- Topic et al. (2019) Topic, N., S. Retzepoglu, M. Wensing, C. Illigmann, G. Luzi, J. R. Agudo, and A. Wierschem (2019), Effect of particle size ratio on shear-induced onset of particle motion at low particle Reynolds numbers: From high shielding to roughness, Physics of Fluids, 31, 063,305, 10.1063/1.5108800.
- Trulsson (2018) Trulsson, M. (2018), Rheology and shear jamming of frictional ellipses, Journal of Fluid Mechanics, 849, 718–740, 10.1017/jfm.2018.420.
- Trulsson et al. (2012) Trulsson, M., B. Andreotti, and P. Claudin (2012), Transition from the viscous to inertial regime in dense suspensions, Physical Review Letters, 109, 118,305, 10.1103/PhysRevLett.109.118305.
- Valance and Crassous (2009) Valance, A., and J. Crassous (2009), Granular medium impacted by a projectile: Experiment and model, The European Physical Journal E, 30, 43–54, 10.1140/epje/i2009-10504-9.
- Valance et al. (2015) Valance, A., K. R. Rasmussen, A. Ould El Moctar, and P. Dupont (2015), The physics of aeolian sand transport, Comptes Rendus Physique, 16, 105–117, 10.1016/j.crhy.2015.01.006.
- Valyrakis (2013) Valyrakis, M. (2013), Entrainment of coarse solid particles by energetic turbulent flow events, Nova Science Publishers, New York.
- Valyrakis et al. (2010) Valyrakis, M., P. Diplas, C. L. Dancey, K. Greer, and A. O. Celik (2010), Role of instantaneous force magnitude and duration on particle entrainment, Journal of Geophysical Research: Earth Surface, 115, F02,006, 10.1029/2008JF001247.
- Valyrakis et al. (2011) Valyrakis, M., P. Diplas, and C. L. Dancey (2011), Entrainment of coarse grains in turbulent flows: An extreme value theory approach, Water Resources Research, 47, W09,512, 10.1029/2010WR010236.
- Valyrakis et al. (2013) Valyrakis, M., P. Diplas, and C. L. Dancey (2013), Entrainment of coarse particles in turbulent flows: An energy approach, Journal of Geophysical Research: Earth Surface, 118, 42–53, 10.1029/2012JF002354.
- van Rijn (1984) van Rijn, L. C. (1984), Sediment transport, part I: Bed load transport, Journal of Hydraulic Engineering, 110, 1431–1456, 10.1061/(ASCE)0733-9429(1984)110:10(1431).
- Voivret et al. (2009) Voivret, C., F. Radjaï, J. Y. Delenne, and M. S. El Youssoufi (2009), Multiscale force networks in highly polydisperse granular media, Physical Review Letters, 102, 178,001, 10.1103/PhysRevLett.102.178001.
- Vollmer and Kleinhans (2007) Vollmer, S., and M. G. Kleinhans (2007), Predicting incipient motion, including the effect of turbulent pressure fluctuations in the bed, Water Resources Research, 43, W05,410, 10.1029/2006WR004919.
- Vowinckel et al. (2014) Vowinckel, B., T. Kempe, and J. Fröhlich (2014), Fluid-particle interaction in turbulent open channel flow with fully-resolved mobile beds, Advances in Water Resources, 72, 32–44, 10.1016/j.advwatres.2014.04.019.
- Vowinckel et al. (2016) Vowinckel, B., R. Jain, T. Kempe, and J. Fröhlich (2016), Entrainment of single particles in a turbulent open-channel flow: a numerical study, Journal of Hydraulic Research, 54(2), 158–171, 10.1080/00221686.2016.1140683.
- Wainwright et al. (2015) Wainwright, J., A. J. Parsons, J. R. Cooper, P. Gao, J. A. Gillies, L. Mao, J. D. Orford, and P. G. Knight (2015), The concept of transport capacity in geomorphology, Reviews of Geophysics, 53, 1155–1202, 10.1002/2014RG000474.
- Wang and Zheng (2014) Wang, P., and X. Zheng (2014), Saltation transport rate in unsteady wind variations, The European Physical Journal E, 37, 40, 10.1140/epje/i2014-14040-3.
- Wang and Zheng (2015) Wang, P., and X. Zheng (2015), Unsteady saltation on Mars, Icarus, 260, 161–166, 10.1016/j.icarus.2015.07.012.
- Ward (1969) Ward, B. D. (1969), Relative density effects on incipient bed movement, Water Resources Research, 5(5), 1090–1096, 10.1029/WR005i005p01090.
- Werner (1990) Werner, B. T. (1990), A steady-state model of wind-blown sand transport, The Journal of Geology, 98(1), 1–17.
- Werner and Haff (1988) Werner, B. T., and P. K. Haff (1988), The impact process in aeolian saltation: two‐dimensional simulations, Sedimentology, 35(2), 189–196, 10.1111/j.1365-3091.1988.tb00944.x.
- White and Schulz (1977) White, B. R., and J. C. Schulz (1977), Magnus effect in saltation, Journal of Fluid Mechanics, 81(3), 497–512, 10.1017/S0022112077002183.
- Wiberg and Smith (1987) Wiberg, P. L., and J. D. Smith (1987), Calculations of the critical shear stress for motion of uniform and heterogeneous sediments, Water Resources Research, 23(8), 1471–1480, 10.1029/WR023i008p01471.
- Wiggs et al. (2004) Wiggs, G. F. S., R. J. Atherton, and A. J. Baird (2004), Thresholds of aeolian sand transport: establishing suitable values, Sedimentology, 51, 95–108, 10.1046/j.1365-3091.2003.00613.x.
- Wilcock (1993) Wilcock, P. R. (1993), Critical shear stress of natural sediments, Journal of Hydraulic Engineering, 119(4), 491–505, 10.1061/(ASCE)0733-9429(1993)119:4(491).
- Willetts and Rice (1986) Willetts, B. B., and M. A. Rice (1986), Collisions in aeolian saltation, Acta Mechanica, 63, 255–265, 10.1007/BF01182552.
- Willetts and Rice (1989) Willetts, B. B., and M. A. Rice (1989), Collisions of quartz grains with a sand bed: The influence of incident angle, Earth Surface Processes and Landforms, 14(8), 719–730, 10.1002/esp.3290140806.
- Williams et al. (1994) Williams, J. J., G. R. Butterfield, and D. G. Clark (1994), Aerodynamic entrainment threshold: effects of boundary layer flow conditions, Sedimentology, 41, 309–328, 10.1111/j.1365-3091.1994.tb01408.x.
- Wong and Parker (2006) Wong, M., and G. Parker (2006), Reanalysis and correction of bed-load relation of Meyer-Peter and Müller using their own database, Journal of Hydraulic Engineering, 132(11), 1159–1168, 10.1061/(ASCE)0733-9429(2006)132:11(1159).
- Xing and He (2013) Xing, M., and C. He (2013), 3D ejection behavior of different sized particles in the grain-bed collision process, Geomorphology, 187, 94–100, 10.1016/j.geomorph.2013.01.002.
- Yager and Schmeeckle (2013) Yager, E. M., and M. W. Schmeeckle (2013), The influence of vegetation on turbulence and bed load transport, Journal of Geophysical Research: Earth Surface, 118, 1585–1601, 10.1002/jgrf.20085.
- Yager et al. (2018) Yager, E. M., M. W. Schmeeckle, and A. Badoux (2018), Resistance is not futile: Grain resistance controls on observed critical shields stress variations, Journal of Geophysical Research: Earth Surface, 123(12), 3308–3322, 10.1029/2018JF004817.
- Yalin (1977) Yalin, M. (1977), Mechanics of Sediment Transport, Pergamon Press, Oxford.
- Yalin and Karahan (1979) Yalin, M. S., and E. Karahan (1979), Inception of sediment transport, Journal of the Hydraulics Division, 105, 1433–1443.
- Yan et al. (2016) Yan, L., A. Barizien, and M. Wyart (2016), Model for the erosion onset of a granular bed sheared by a viscous fluid, Physical Review E, 93, 012,903, 10.1103/PhysRevE.93.012903.
- Yang and Hunt (2006) Yang, F. L., and M. L. Hunt (2006), Dynamics of particle-particle collisions in a viscous liquid, Physics of Fluids, 18, 121,506, 10.1063/1.2396925.
- Yang and Nepf (2018) Yang, J. Q., and H. M. Nepf (2018), A turbulence-based bed-load transport model for bare and vegetated channels, Geophysical Research Letters, 45, 10,428–10,436, 10.1029/2018GL079319.
- Yang and Nepf (2019) Yang, J. Q., and H. M. Nepf (2019), Impact of vegetation on bed load transport rate and bedform characteristics, Water Resources Research, 55, 6109–6124, 10.1029/2018WR024404.
- Yang et al. (2019) Yang, Y., S. Gao, Y. P. Wang, J. Jia, J. Xiong, and L. Zhou (2019), Revisiting the problem of sediment motion threshold, Continental Shelf Research, 187, 103,960, 10.1016/j.csr.2019.103960.
- Zanke (2003) Zanke, U. C. E. (2003), On the influence of turbulence on the initiation of sediment motion, International Journal of Sediment Research, 18(1), 17–31.
- Zhang and Kamrin (2017) Zhang, Q., and K. Kamrin (2017), Microscopic description of the granular fluidity field in nonlocal flow modeling, Physical Review Letters, 118, 058,001, 10.1103/PhysRevLett.118.058001.
- Zheng et al. (2008) Zheng, X., W. Zhu, and L. Xie (2008), A probability density function of liftoff velocities in mixed-size wind sand flux, Science in China Series G: Physics, Mechanics & Astronomy, 51(8), 976–985, 10.1007/s11433-008-0105-7.
- Zheng et al. (2005) Zheng, X. J., L. Xie, and Y. H. Zhou (2005), Exploration of probability distribution of velocities of saltating sand particles based on the stochastic particle-bed collisions, Physics Letters A, 341, 107–118, 10.1016/j.physleta.2005.04.084.
- Zhu et al. (2019) Zhu, W., X. Huo, J. Zhang, P. Wang, T. Pähtz, N. Huang, and Z. He (2019), Large effects of particle size heterogeneity on dynamic saltation threshold, Journal of Geophysical Research: Earth Surface, 124(8), 2311–2321, 10.1029/2019JF005094.