Automated Cardiothoracic Ratio Calculation and Cardiomegaly Detection using Deep Learning Approach
Abstract
We propose an algorithm for calculating the cardiothoracic ratio (CTR) from chest X-ray films. Our approach applies a deep learning model based on U-Net with VGG16 encoder [1] to extract lung and heart masks from chest X-ray images and calculate CTR from the extents of obtained masks. Human radiologists evaluated our CTR measurements, and were accepted to be included in medical reports without any need for adjustment. This result translates to a large amount of time and labor saved for radiologists using our automated tools.
Keywords Cardiothoracic Ratio Cardiomegaly Chest X-Ray Machine Learning Deep Learning Image Segmentation
1 Introduction
Chest X-ray, or CXR, is widely used in diagnosing abnormal conditions in the chest and nearby structure. Radiologists routinely perform cardiothoracic ratio (CTR) measurement on antero-posterior chest radiographs to diagnose Cardiomegaly, a condition that is strongly correlated with both congenital and congestive heart diseases. Although most Picture Archiving and Communication Systems (PACS) include drawing tools to aid the assessment of CTR, the process is still often labor intensive and time consuming. Manual labeling of organ boundaries and calculation of CTR is prone to error and can lead to faulty interpretations.
Recent advances in machine learning have introduced a wide variety of computer vision methods that can be used to aid this process. Deep learning is a growing trend in medical image analysis, and convolutional neural networks have been shown to yield competitive performances in automated detection of diseases in X-ray images.
In this work, we explore an automatic approach to calculate CTR from chest X-ray film utilizing deep learning models. Using an image segmentation network based on U-Net with VGG16 encoder [1], we extract lung and heart regions from the CXR film. The heart and lung diameters are then calculated from the segmented regions.
2 Background
2.1 Cardiothoracic Ratio
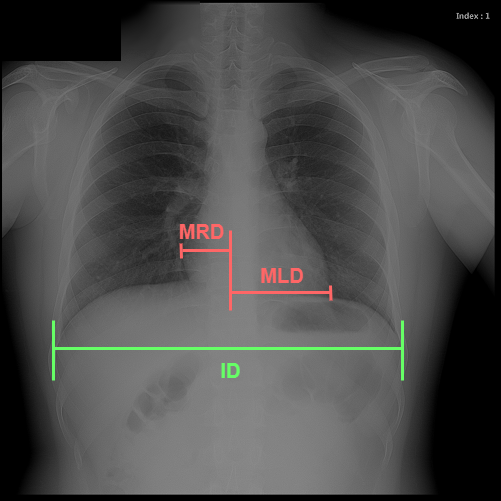
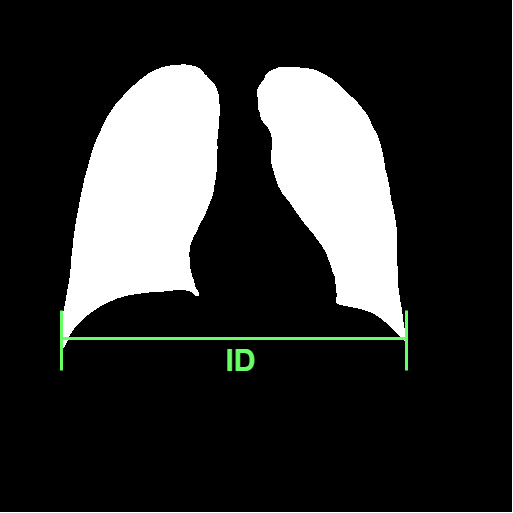
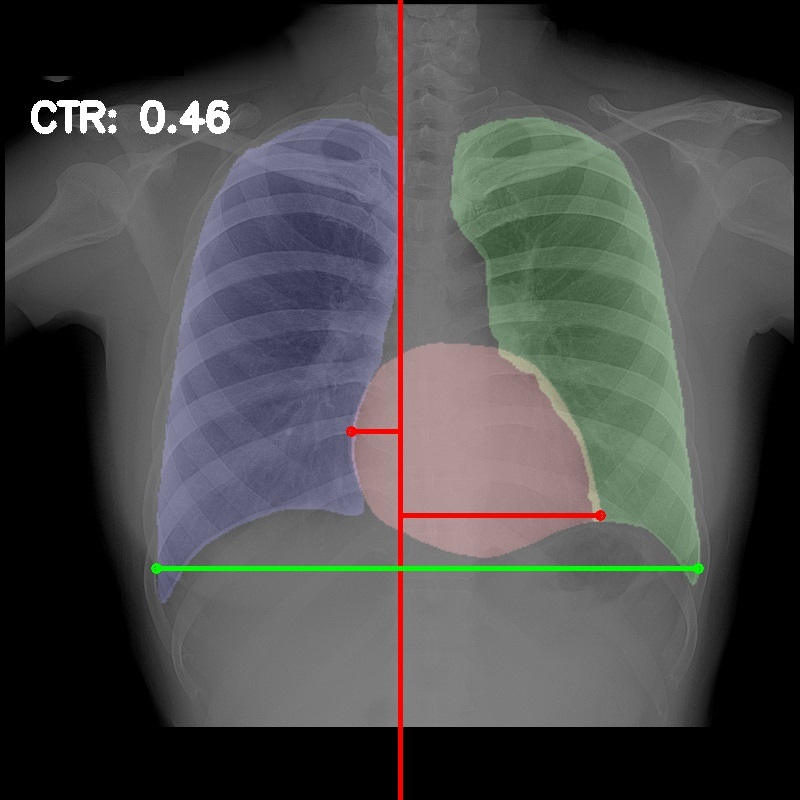
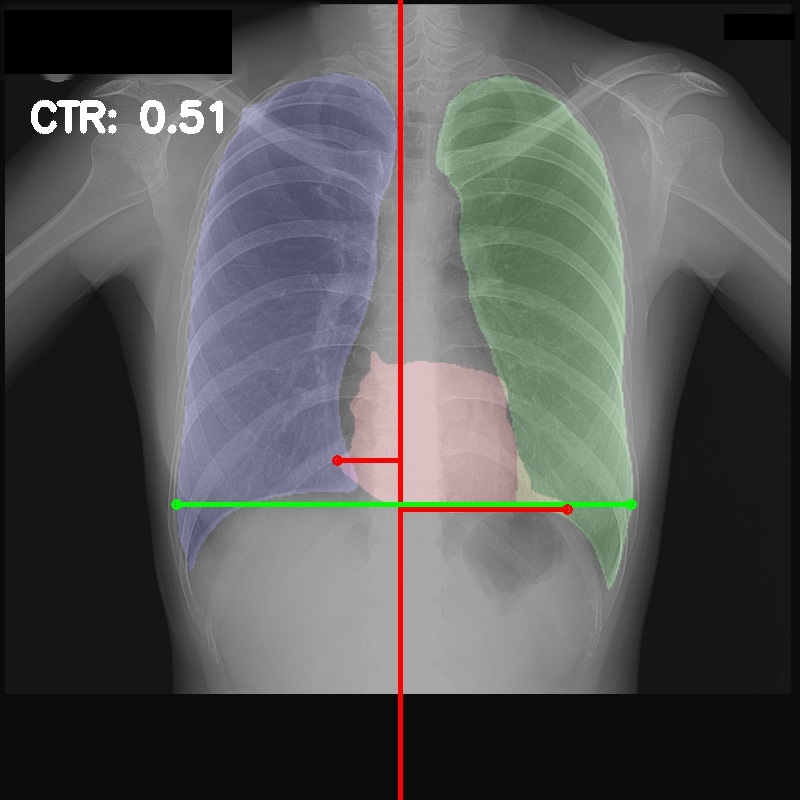
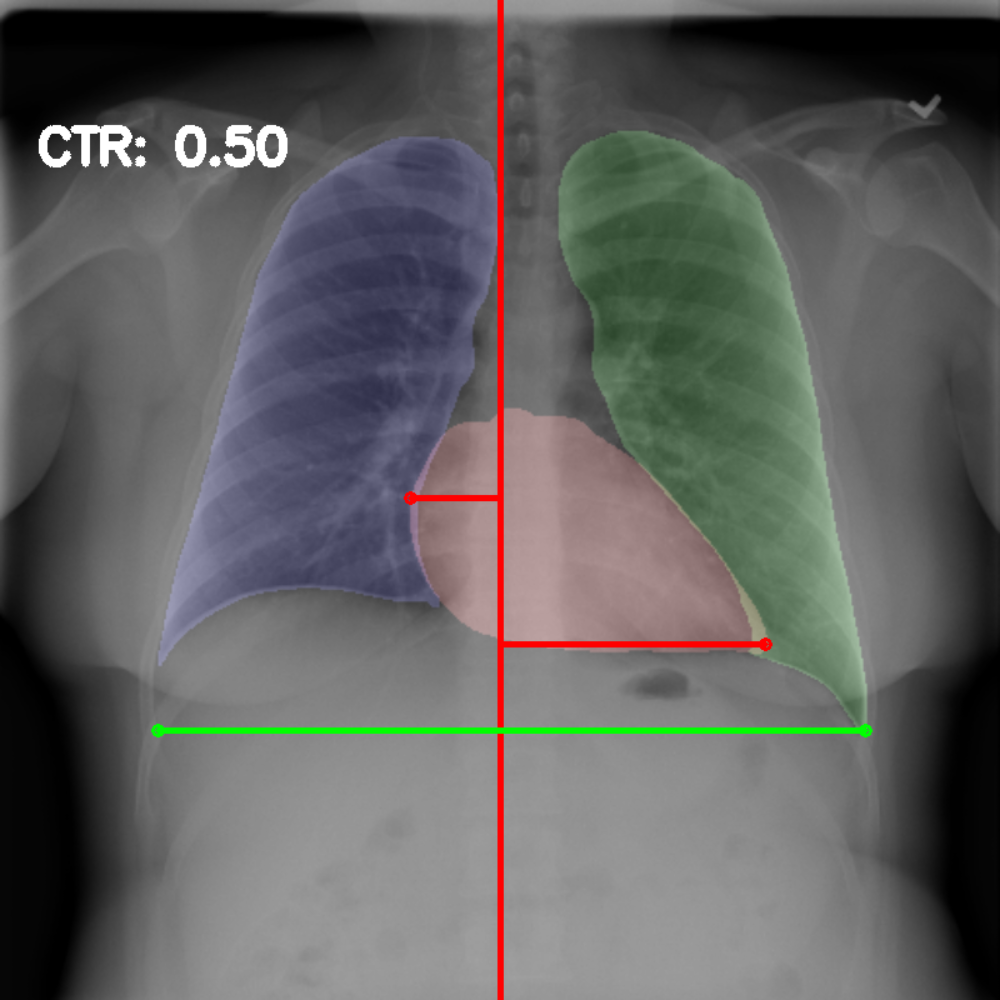
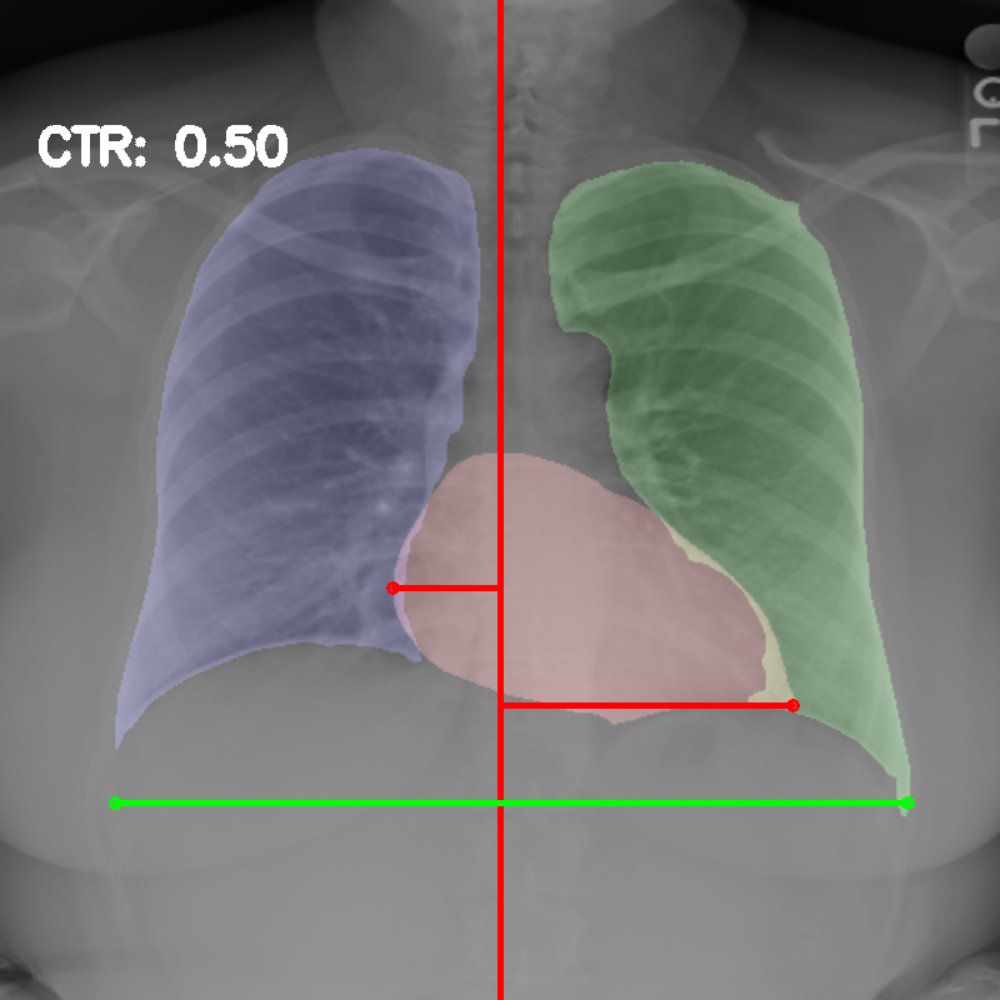
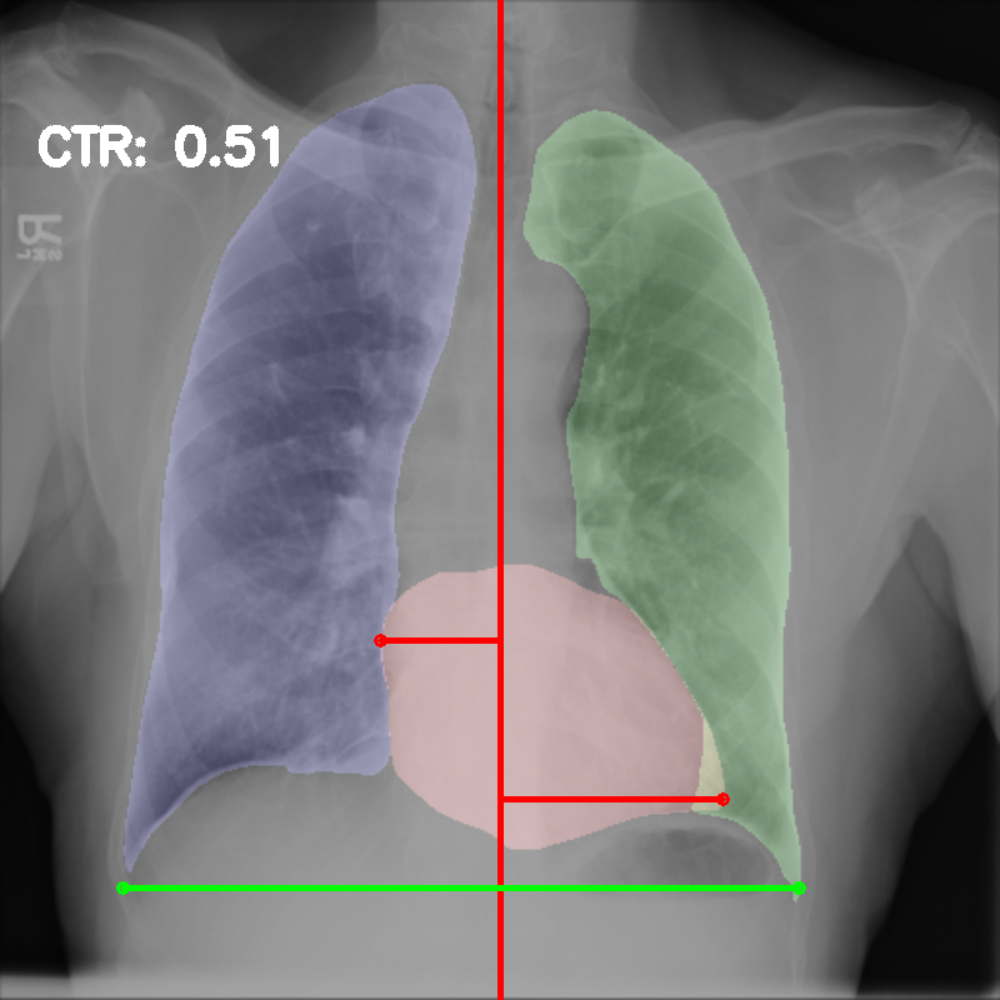
Chest radiography is the most common tool for detecting cardiomegaly due to the low cost and high availability of devices to obtain chest X-ray images. From chest X-ray images, radiologists employ CTR as one of the most important indicators of cardiomegaly due to the simplicity of the calculation. CTR of a chest X-ray image is calculated as cardiac diameter (the diameter of the heart) divided by the thoracic diameter (the diameter of the chest). Specifically, CTR can be calculated from three measurements, , the midline-to-right heart diameter, , the midline-to-left heart diameter, and , the internal diameter of chest [2, 3], as
| (1) |
where and is measured from the greatest perpendicular diameter from midline to right and left heart border, respectively. Figure 1 visualizes the details of CTR calculation. A CTR value of is generally considered to indicate the upper limit of normal.
Most Picture Archiving and Communication Systems (PACS) used by radiologists include tools akin to rulers to ease the process for obtaining these measurements. However, this manual process is labor and time consuming, and can be error-prone when radiologists need to assess hundreds of chest X-ray films a day.
2.2 Automated CTR Calculation
There have been several attempts on automatic measurements of cardiothoracic ratio. These approaches involve the calculation of lung and heart regions in the image and use extents of the masks to calculate CTR in a similar practice radiologists use to assess CTR from chest X-ray films.
For the automated segmentation of lung and heart, traditional image processing methods can achieve great results. In an early work, a reference image repository was searched for the nearest neighbor of the patient’s sample X-ray image, and a SIFT flow algorithm was used to align and transform lung boundary from the nearest neighbor image to the sample [4].
Ebenezer and Rao [5] applied a Euler number-based approach to find the best threshold that separates the two lungs from the background. After removing background regions from four corners of the image and applying dilation and erosion for image smoothing, thoracic diameter, , is then calculated by scanning for leftmost and rightmost points on the lung mask. and are then calculated from the widest point between two lung masks.
Candemir et al. [6] registers the input chest image with the most similar image in the model dataset. The similarity is measured by calculating Bhattacharyya distance of the X-ray intensity histograms. A correspondence map is then calculated using a SIFT flow algorithm to compute a transformation matrix, which is applied to the model mask to transform it into the input image space. CTR value is then calculated from the boundaries of lung and heart masks.
Recent works show excellent results by applying a deep learning approach called U-Net to extract lung and heart boundaries [7]. This approach obtained accuracy on cardiomegaly detection task, on the dataset of images from NIH Chest X-ray Dataset [8]. Li et al. [9] used U-Net to segment heart and lung masks. They applied a Conditional Random Field to the masks to smooth region boundaries and calculate CTR by measuring the cardio and thoracic diameters from the lung and heart masks. They performed the test on postero-anterior (PA) chest X-ray images from the Radiology Imaging Center in their hospital and obtained accuracy on cardiomegaly detection. Given the success of image segmentation on CTR calculation, we further explore image segmentation approaches using deep learning.
2.3 Image Segmentation with Deep Learning
Image segmentation has been one of the most active and sought-after fields of research due to its various applications such as scene understanding, content-based image retrieval, or medical imaging. In the early years, computer vision-based approaches were established for various image segmentation tasks. Although these techniques are accurate on their target tasks, many of them are not easy to train and adapt to new tasks. We refer readers to a comprehensive survey by Zaitoun [10] for further information on early approaches to image segmentation.
A major breakthrough in image segmentation was made by the introduction of the deep learning approach. U-Net [11] uses a deep learning model to tackle pixel-wise segmentation tasks accurately with great speed on various segmentation tasks. U-Net employs an end-to-end encoder-decoder network that contains the encoder that performs feature extraction from image input and the decoder that processes the features into output mask. U-Net also concatenates high-resolution features from encoder parts to the decoder network to improve model localization. Segnet [12] is an efficient multi-class segmentation deep learning architecture for scene understanding. Segnet improves computation time and memory usage with some trade-offs in segmentation accuracy. Segnet structure consists of encoder and decoder parts. The encoder includes a sequence of convolutional layers with batch normalization and relu activation function, and the decoder part mirrors the structure of the encoder.
3 Methodology
3.1 Dataset
To construct our heart mask and lung mask dataset, we obtained images annotated with heart and lung masks from JSRT dataset [14]. We obtained additional lung masks from Montgomery County X-ray dataset [15] and manually segmented additional heart masks by randomly selecting images with cardiomegaly label and images with cardiomegaly-negative labels from both the NIH Chest X-ray dataset [8] and the CheXpert dataset [16]. After filtering out images with poor quality, our manual segmentation of heart masks yielded additional heart masks. In total, our dataset contains lung masks and heart masks.
After applying histogram equalization to normalize the images (described below), we use image augmentation to increase the number of training data and improve training performance. Samples were augmented with a random to degree rotation and randomly apply Gaussian noise and Gaussian blur. We also apply the horizontal flip to lung samples. We obtained a total of heart samples and lung samples and applied a 90-10 train-validation split to divide the samples.
3.2 Data Preprocessing
Chest X-ray images in the dataset are taken with different machines across multiple hospitals, therefore, their image intensity varies and needs to be normalized before feeding into a deep learning model. We apply Histogram equalization to normalize images. Specifically, we modify the value of each pixel with the following function:
| (2) |
where is the output intensity at location , is the intensity of the original image at location , is the number of pixels with intensity n divided by total number of pixels, and is the maximum intensity of the image.
3.3 Segmentation Model Training
To select the best approach to obtain heart and lung segment, we compared the accuracy of three image segmentation models: the Segnet [12], the U-Net [11] and the U-Net with VGG16 encoder [1].
Segnet is a multi-class pixel-wise segmentation network. Segnet structure consists of encoder and decoder sections, and each includes a sequence of convolutional layers with batch normalization and relu activation function. The decoder part mirrors the structure of the encoder. Images are consecutively reduced in size by non-overlapping maxpooling layers through the encoder and gradually restored up to the original size by upsampling layers in the decoder, using maxpooling indices stored from the encoder part.
U-Net is a popular biomedical image segmentation network. Similarly to Segnet, U-Net consists of an encoder, using VGG11 architecture [17], and a decoder with upsampling layers. The output of each encoder layer is fed into the corresponding decoder layer by concatenating with the output from the previous decoder layer. We modified U-Net by using VGG16 architecture instead of VGG11. Figure 2 illustrates our model architecture. The input images to our model are 512 by 512 pixels in size.
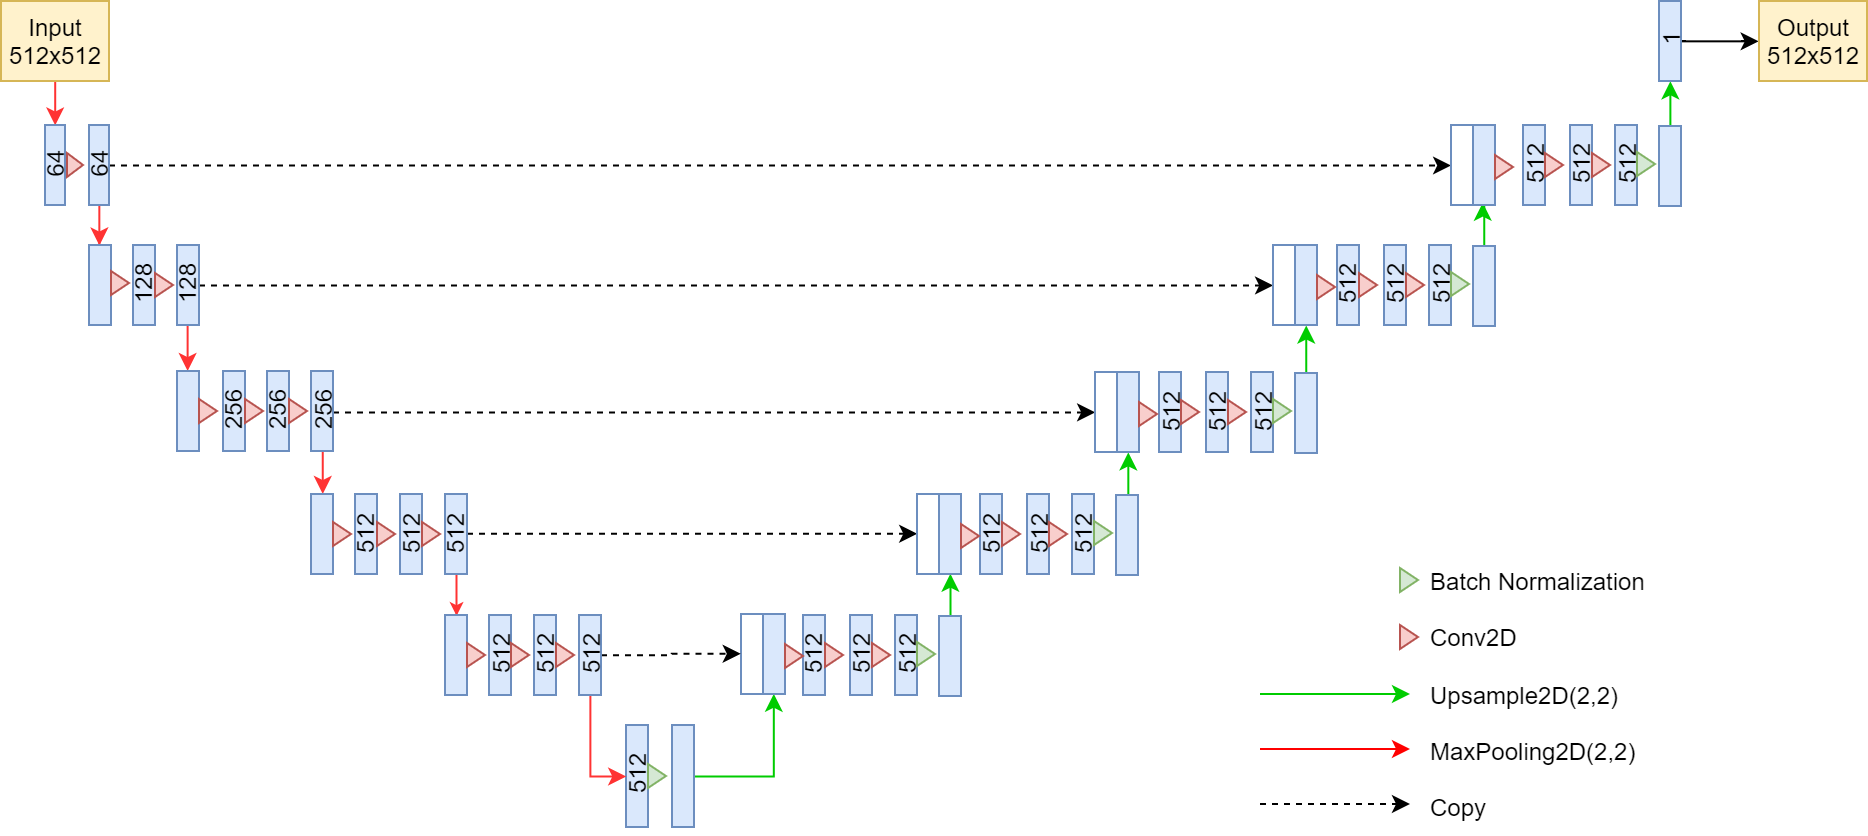
For loss function, we use a combination of soft dice and binary cross-entropy with logits loss.
3.3.1 Soft Dice Loss
Soft dice loss measures the overlap between two mask samples, ranging from 0, where two masks overlap completely, and 1, where there are no overlapping parts between the two masks. Soft dice loss function, , is written as follows:
| (3) |
where is the value of target mask at pixel , and is the value of prediction mask at pixel .
3.3.2 Binary Cross-Entropy With Logits Loss
Binary cross-entropy with logits loss combines a sigmoid layer and the binary cross-entropy loss to measure the difference between prediction mask and ground-truth mask. We first measure pixel-wise loss by:
| (4) |
where is the loss value of pixel .
The loss function is then calculated as a mean value of all pixels
| (5) |
Our loss function is a sum of the soft Dice loss and the binary cross-entropy with logits loss as
| (6) |
Heart mask and lung mask models are trained separately. We trained each model using Adam (Adaptive Moment Estimation) optimizer with a batch size of for epochs and an initial learning rate of . Training algorithm is implemented on Nvidia Tesla V100 GPU with 32GB memory.
3.4 Postprocessing
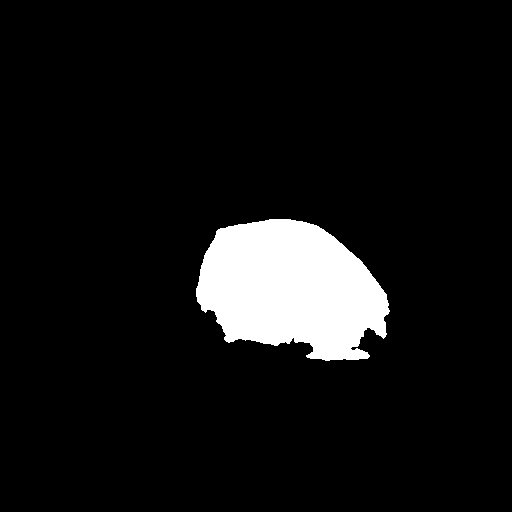
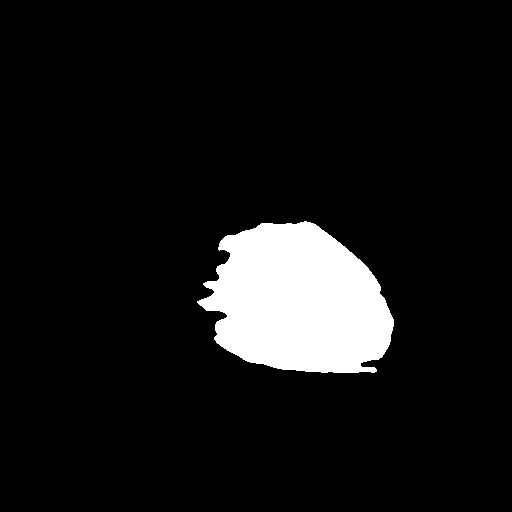
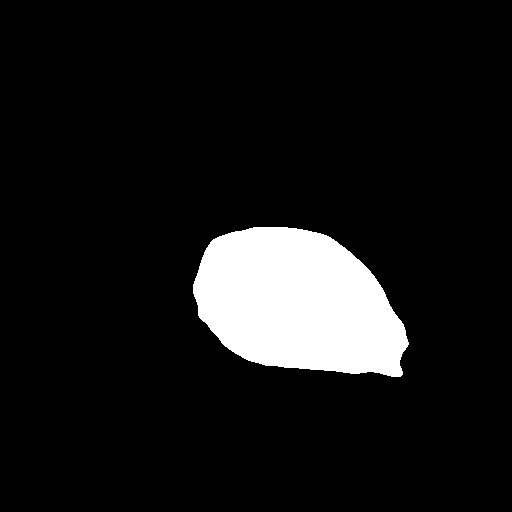
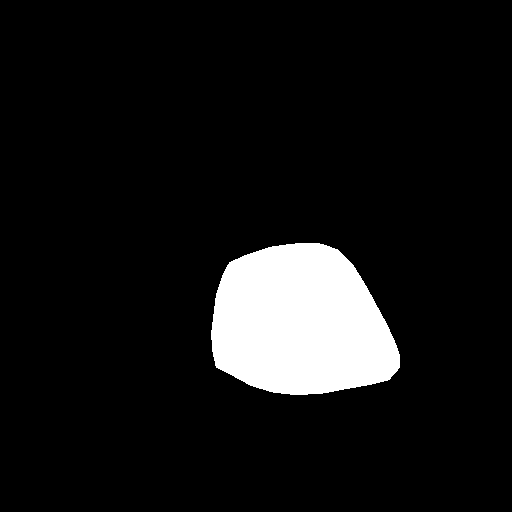
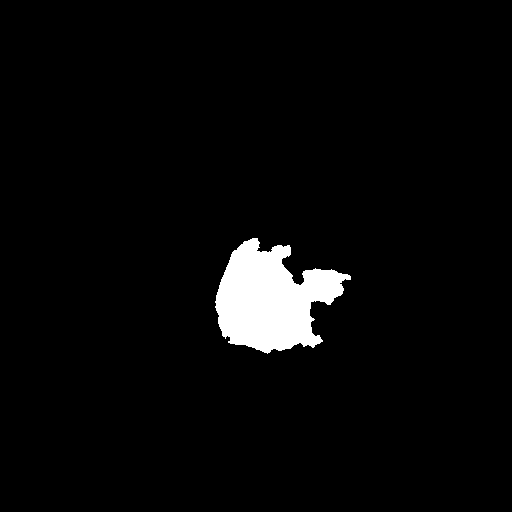
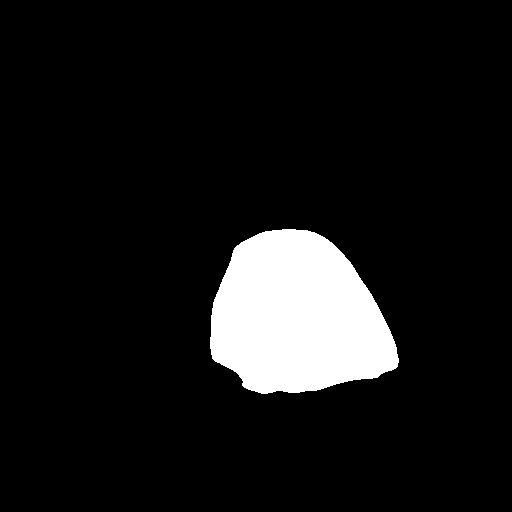
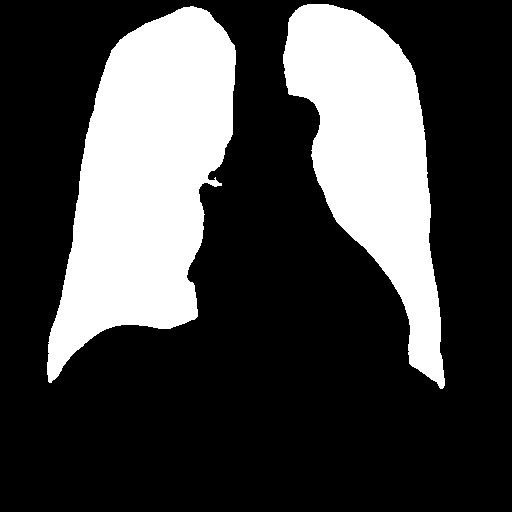
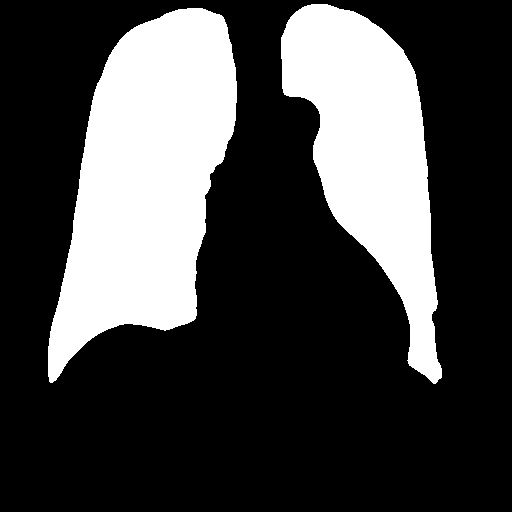
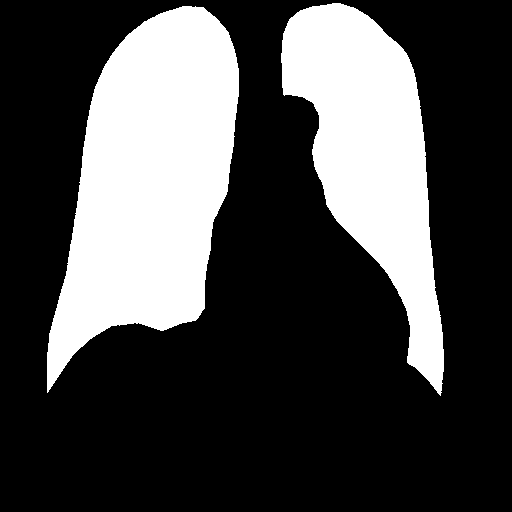
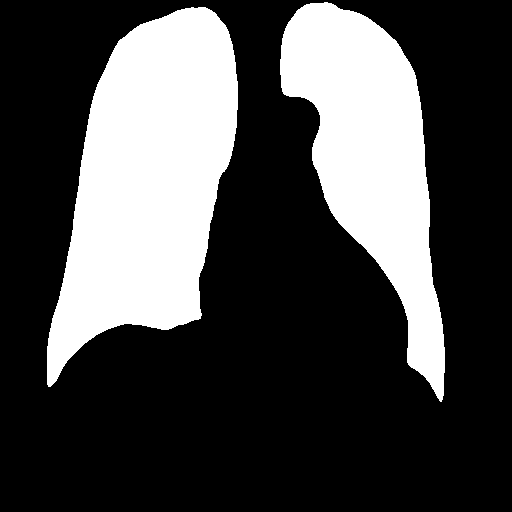
After heart and lung masks are computed, we performed dilation followed by erosion to fill holes in output mask [18], then we find the connected components of prediction masks (Figure 3).
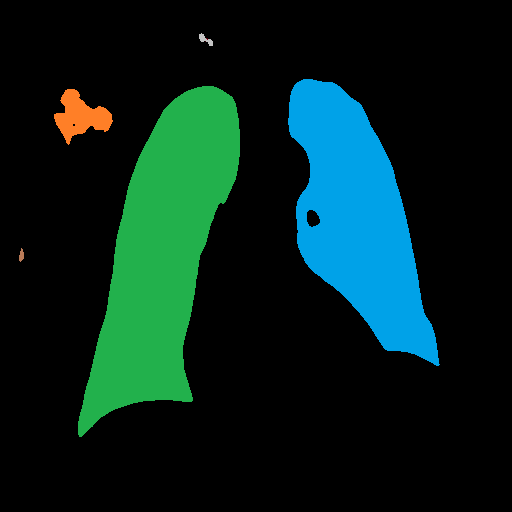
From the lung mask, we chose the two largest connected components and disregarded others as noise. The connected component with a lower x-axis coordinate is designated as the left lung mask and the other as the right lung mask. From the heart mask, we chose the connected component larger than a given threshold and closest to the center and designate it as the heart mask.
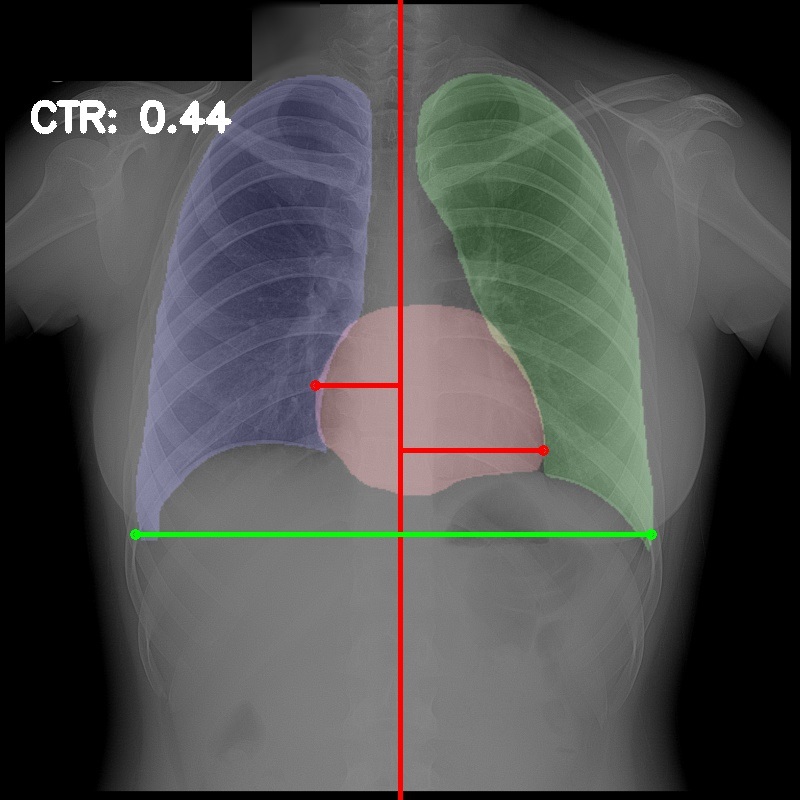
3.5 Cardiothoracic Ratio Calculation
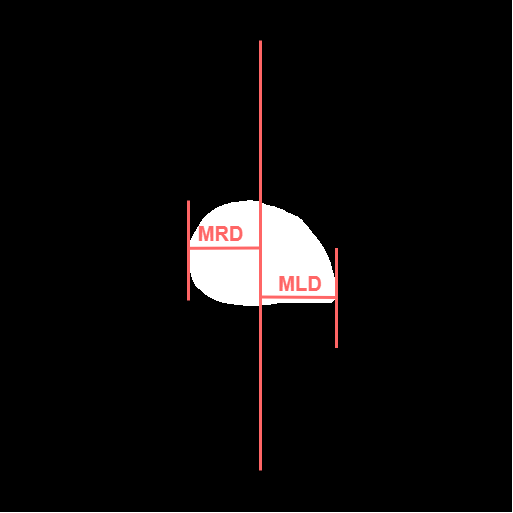
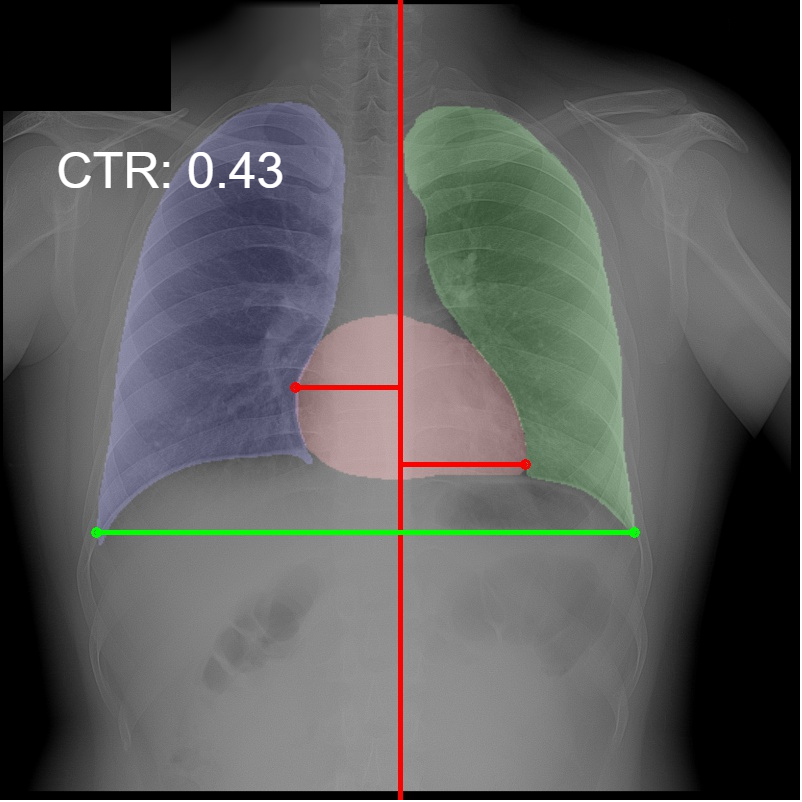
After obtaining the masks, we calculate CTR with equation 1. We calculate cardiac diameter, , by finding the extreme points on the x-axis of the heart mask and calculate their x-axis distance. Thoracic diameter, , is calculated from extreme points from the lung mask. Figure 4 demonstrates the calculation of each component.
3.6 Cardiomegaly Detection
In typical diagnostic practice, a normal measurement of CTR should be less than , with CTR of to regarded as mild cardiomegaly and CTR of more than regarded as cardiomegaly [19]. Since mild cardiomegaly is also mentioned in radiologist reports and is regarded as cardiomegaly, we use the ratio of as a cutoff value for the evaluation of cardiomegaly.
4 Experiments and Results
4.1 Chest X-Ray Segmentation
We compared our chest X-ray segmentation approach with Segnet [12] and U-Net [11] without VGG16 encoder trained with the same samples and hyper-parameters.
Table 1 shows the result of our segmentation algorithms. Average Intersection-over-Union (IoU) values are calculated for each model on validation sets. Our U-Net+VGG16 model outperformed other approaches on heart segmentation, while producing comparable result to U-Net on lung segmentation.
Our U-Net+VGG16 lung segmentation model yields DSC (Dice’s Coefficient) of 0.970, while the heart segmentation DSC was 0.892. Our lung and heart segmentation algorithm yields comparable results to studies performed on other data sets [20, 21, 22].
| Model | Heart Segmentation | Lung Segmentation |
|---|---|---|
| Segnet | ||
| U-Net | ||
| U-Net+VGG16 |
Figure 5 shows examples of heart and lung masks produced by each approach. U-Net with VGG16 encoder model provided the most consistent and smooth result.
| Lung Image | Ground Truth | Segnet | U-Net | U-Net+VGG16 |
 |
 |
 |
 |
 |
 |
 |
 |
 |
 |
 |
 |
 |
 |
 |
 |
 |
 |
 |
 |
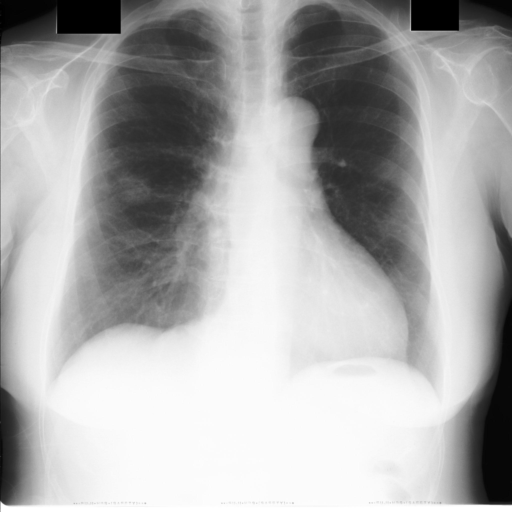
4.2 Cardiothoracic Ratio Calculation
After obtaining heart and lung segments, we calculated , , and and marked them on the image along with CTR value calculated from Equation 1.
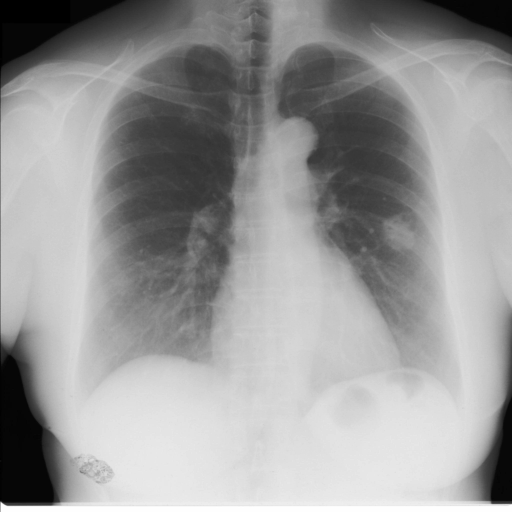
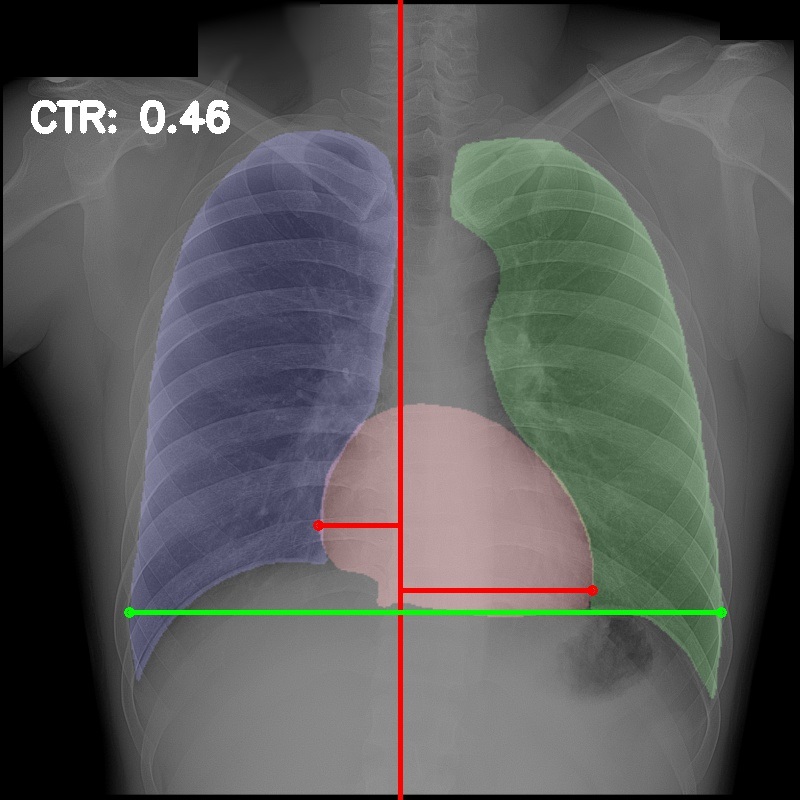
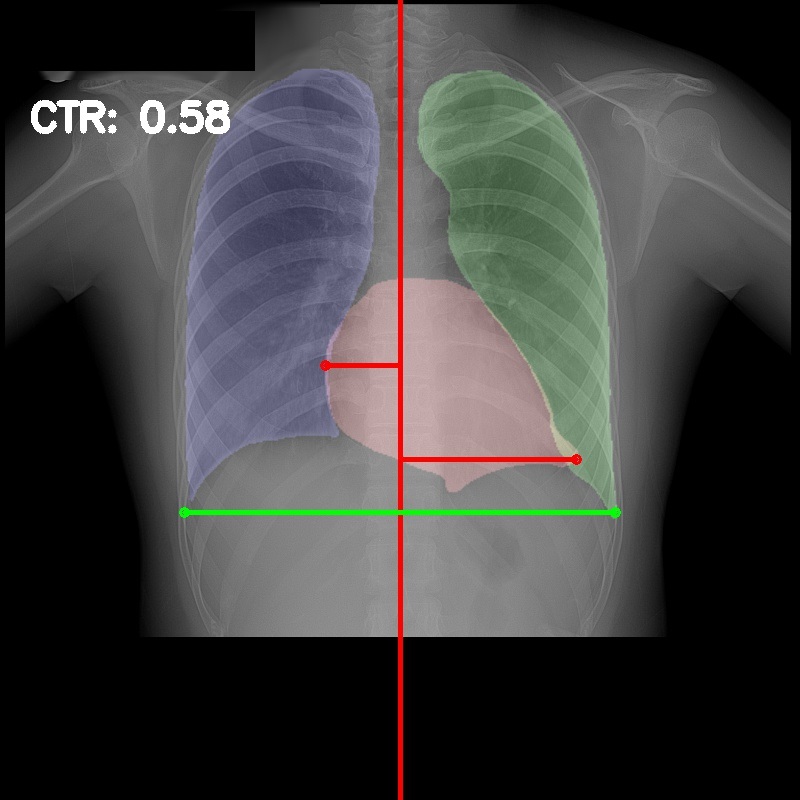
Figure 6 shows examples of our CTR calculation, where CTR values along with their , and measurement points are correctly identified. In this image, cardiomegaly is correctly detected by CTR value of .
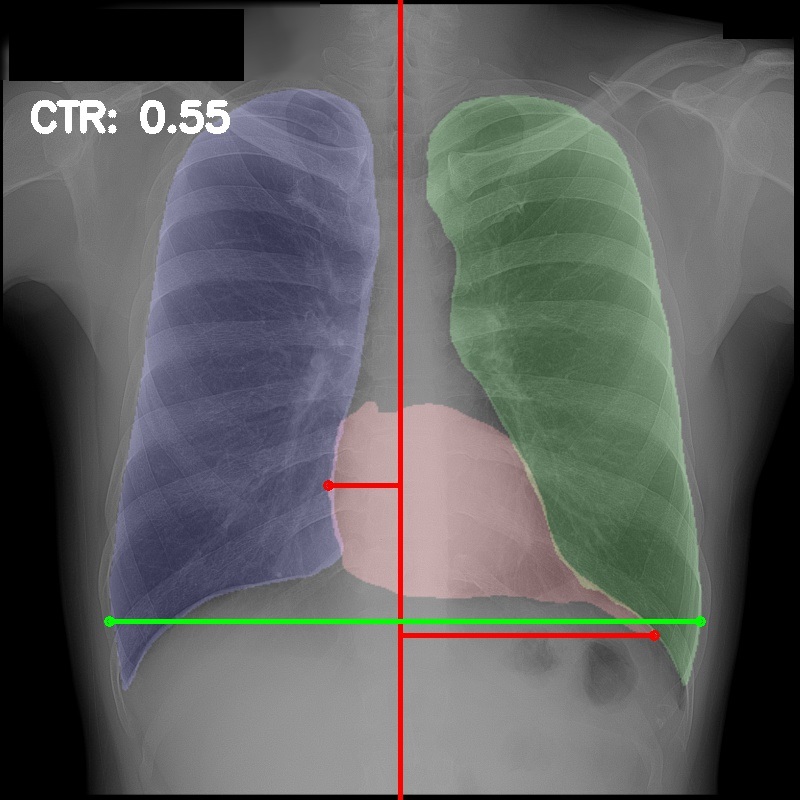
Figure 7 shows cases where our CTR calculation algorithm is incorrect due to failure to obtain accurate heart mask.
To measure the practical use of our CTR calculation, we asked human experts to verify if each of the measurements, , , and , are acceptable. We designate our result as correct if human experts indicate that our computer-generated measurements can be used in medical reports without any modification and designate them as incorrect otherwise.
We selected 600 images from NIH Chest X-ray and CheXpert datasets (total of 1,200 cases). For each dataset, we randomly sampled cases labeled with cardiomegaly positive and cases with no cardiomegaly. After filtering out images with technical issues and those in which human experts signify that the heart size cannot be accurately evaluated, we obtained a total of images, of which are with cardiomegaly label and are without cardiomegaly labels.
Table 2 shows the result of our experiment. Our approach can correctly measure , , and in of the cases. There was no significant difference in algorithm’s performance between cases with and without cardiomegaly conditions.
| Category | Correct | Incorrect | Accuracy |
|---|---|---|---|
| Cardiomegaly | |||
| No cardiomegaly | |||
| Total |
We also evaluated our CTR calculation approach in the degree to which its detection of cardiomegaly agrees with radiologist diagnosis of the condition. To this end, we selected frontal AP view samples from NIH Chest X-ray dataset [8] and the CheXpert dataset [16] with specific mention of the presence or the absence of cardiomegaly. Cases where there is no mention of cardiomegaly are excluded from the analysis. In accordance to radiologists’ practice, we predict that cardiomegaly is present if the CTR value is higher than the threshold of 0.5.
We measured the detection accuracy, sensitivity, and specificity of our approach. We obtained the accuracy of and from the NIH Chest X-ray dataset and the CheXpert dataset, respectively. Full results are presented in Table 3.
| Dataset | Accuracy | Sensitivity | Specificity |
|---|---|---|---|
| NIH Chest X-ray | |||
| CheXpert |
In practice, CTR values near threshold () are prone to produce diagnostic errors. Therefore we analyzed the distribution of images at different ranges of CTR values to confirm this hypothesis. Table 4 shows the distributions from NIH Chest X-Ray and CheXpert dataset. and of false positive samples in NIH Chest X-ray and CheXpert datasets, respectively, have CTR values between to , suggesting that machine-generated labels in this range need to be re-evaluated by human readers.
However, upon manual inspection of the images, we found a relatively high number of mild cardiomegaly cases that are not included in the dataset labels. Figure 8 shows sample chest X-ray images containing no-cardiomegaly labels with detected CTR values on range. This reflects the general sentiment that dataset labels are noisy and may contain errors, making it harder to analyze our algorithm. It also illustrates the value of an algorithmic "second opinion" to catch potential errors from both human and NLP algorithms used to generate the labels.
| Dataset | Distribution at Ranges of CTR Values | ||||||
| NIH Chest X-ray | Pos | ||||||
| Neg | |||||||
| CheXpert | Pos | ||||||
| Neg | |||||||
| Annotation | Dataset | CTR0.5 | CTR0.5 | Errors |
|---|---|---|---|---|
| NIH Chest X-ray | Cardiomegaly | |||
| No Cardiomegaly | ||||
| Average | ||||
| CheXpert | Cardiomegaly | |||
| No Cardiomegaly | ||||
| Average |
To demonstrate the mismatch between human expert and dataset labels, we performed analysis on samples where human experts accepted our , , and measurements. Table 5 shows the result of this analysis. It can be seen that and of the labels from NIH Chest X-ray and CheXpert dataset, respectively, did not agree with CTR values accepted by local experts.
The experiment also shows that there are more mismatches from cases with no-cardiomegaly labels, with and mismatches from NIH Chest X-ray dataset and CheXpert dataset, respectively, compared to cases with cardiomegaly labels, with and respectively. This suggested that computer algorithms can pick up mild cardiomegaly cases that were not indicated by dataset labels.
Conclusion
Our work presents a simple approach to evaluate CTR automatically from chest X-ray images. In this preliminary research, we were able to achieve acceptance rate in practical settings, which translates to the amount of the time saved for radiologists from measuring cardio and thoracic diameters and calculating CTR manually. Apart from saving a significant amount of time for radiologists, our approach has additional benefits in that it can alert radiologists on cases with cardiomegaly that are not obvious to the human eyes and thus provide an algorithmic "second opinion". Our simple approach can be integrated into a CTR assessment tool, which can display clear positions where , , and measurements are made, so that radiologists can confirm the results immediately. Our deep learning algorithm is able to achieve high accuracy on images obtained from different hospitals even when trained with less than labeled samples. With more samples, we are confident that the accuracy will improve.
References
- [1] Chirag Balakrishna, Sarshar Dadashzadeh, and Sara Soltaninejad. Automatic detection of lumen and media in the ivus images using u-net with vgg16 encoder. arXiv preprint arXiv:1806.07554, 2018.
- [2] YB Mensah, K Mensah, S Asiamah, H Gbadamosi, EA Idun, W Brakohiapa, and A Oddoye. Establishing the cardiothoracic ratio using chest radiographs in an indigenous ghanaian population: a simple tool for cardiomegaly screening. Ghana medical journal, 49(3):159–164, 2015.
- [3] Konstantinos Dimopoulos, Georgios Giannakoulas, Isaac Bendayan, Emmanouil Liodakis, Ricardo Petraco, Gerhard-Paul Diller, Massimo F Piepoli, Lorna Swan, Michael Mullen, Nicky Best, et al. Cardiothoracic ratio from postero-anterior chest radiographs: a simple, reproducible and independent marker of disease severity and outcome in adults with congenital heart disease. International journal of cardiology, 166(2):453–457, 2013.
- [4] Ahmed Dallal, Chirag Agarwal, Mohammad Arbabshirani, Aalpen Patel, and Gregory Moore. Automatic estimation of heart boundaries and cardiothoracic ratio from chest x-ray images. page 101340K, 03 2017.
- [5] J Ebenezer and ACS Rao. Computer aided analysis of chest x-ray images for early detection of cardiomegaly using euler numbers. 2017.
- [6] Sema Candemir, Stefan Jaeger, Wilson Lin, Zhiyun Xue, Sameer Antani, and George Thoma. Automatic heart localization and radiographic index computation in chest x-rays. In Georgia D. Tourassi and Samuel G. Armato III, editors, Medical Imaging 2016: Computer-Aided Diagnosis, volume 9785, pages 302 – 309. International Society for Optics and Photonics, SPIE, 2016.
- [7] Q. Que, Z. Tang, R. Wang, Z. Zeng, J. Wang, M. Chua, T. S. Gee, X. Yang, and B. Veeravalli. Cardioxnet: Automated detection for cardiomegaly based on deep learning. pages 612–615, July 2018.
- [8] Xiaosong Wang, Yifan Peng, Le Lu, Zhiyong Lu, Mohammadhadi Bagheri, and Ronald M. Summers. Chestx-ray8: Hospital-scale chest x-ray database and benchmarks on weakly-supervised classification and localization of common thorax diseases. 2017 IEEE Conference on Computer Vision and Pattern Recognition (CVPR), Jul 2017.
- [9] Zhennan Li, Zhihui Hou, Chen Chen, Zhi Hao, Yunqiang An, Sen Liang, and Bin Lu. Automatic cardiothoracic ratio calculation with deep learning. IEEE Access, 7:37749–37756, 2019.
- [10] Nida M. Zaitoun and Musbah J. Aqel. Survey on image segmentation techniques. Procedia Computer Science, 65:797 – 806, 2015. International Conference on Communications, management, and Information technology (ICCMIT’2015).
- [11] Olaf Ronneberger, Philipp Fischer, and Thomas Brox. U-net: Convolutional networks for biomedical image segmentation. CoRR, abs/1505.04597, 2015.
- [12] Vijay Badrinarayanan, Alex Kendall, and Roberto Cipolla. Segnet: A deep convolutional encoder-decoder architecture for image segmentation. IEEE transactions on pattern analysis and machine intelligence, 39(12):2481–2495, 2017.
- [13] Vladimir Iglovikov and Alexey Shvets. Ternausnet: U-net with vgg11 encoder pre-trained on imagenet for image segmentation. arXiv preprint arXiv:1801.05746, 2018.
- [14] Junji Shiraishi, Shigehiko Katsuragawa, Junpei Ikezoe, Tsuneo Matsumoto, Takeshi Kobayashi, Ken-ichi Komatsu, Mitate Matsui, Hiroshi Fujita, Yoshie Kodera, and Kunio Doi. Development of a digital image database for chest radiographs with and without a lung nodule: receiver operating characteristic analysis of radiologists’ detection of pulmonary nodules. American Journal of Roentgenology, 174(1):71–74, 2000.
- [15] Stefan Jaeger, Sema Candemir, Sameer Antani, Yì-Xiáng J Wáng, Pu-Xuan Lu, and George Thoma. Two public chest x-ray datasets for computer-aided screening of pulmonary diseases. Quantitative imaging in medicine and surgery, 4(6):475, 2014.
- [16] Jeremy Irvin, Pranav Rajpurkar, Michael Ko, Yifan Yu, Silviana Ciurea-Ilcus, Chris Chute, Henrik Marklund, Behzad Haghgoo, Robyn Ball, Katie Shpanskaya, and et al. Chexpert: A large chest radiograph dataset with uncertainty labels and expert comparison. Proceedings of the AAAI Conference on Artificial Intelligence, 33:590–597, Jul 2019.
- [17] Karen Simonyan and Andrew Zisserman. Very deep convolutional networks for large-scale image recognition. arXiv preprint arXiv:1409.1556, 2014.
- [18] Pierre Soille. Erosion and Dilation, pages 49–88. Springer Berlin Heidelberg, Berlin, Heidelberg, 1999.
- [19] Konstantinos Dimopoulos, George Giannakoulas, Isaac Bendayan, Emmanouil Liodakis, Ricardo Petraco, Gerhard-Paul Diller, Massimo Piepoli, Lorna Swan, Michael Mullen, Nicky Best, Philip Poole-Wilson, Darrel Francis, Michael Rubens, and Michael Gatzoulis. Cardiothoracic ratio from postero-anterior chest radiographs: A simple, reproducible and independent marker of disease severity and outcome in adults with congenital heart disease. International journal of cardiology, 166, 11 2011.
- [20] Ebenezer Jangam, Rahul Kumar, Rajesh Dwivedi, and Vishnu Kumar. Segmentation of lungs from chest x-rays using firefly optimized spatial fcm (fasfcm).
- [21] Sema Candemir, Stefan Jaeger, Kannappan Palaniappan, Jonathan P Musco, Rahul K Singh, Zhiyun Xue, Alexandros Karargyris, Sameer Antani, George Thoma, and Clement J McDonald. Lung segmentation in chest radiographs using anatomical atlases with nonrigid registration. IEEE transactions on medical imaging, 33(2):577–590, 2013.
- [22] Nanqing Dong Wei Dai B, Zeya Wang, Xiaodan Liang, Hao Zhang, and Eric P Xing. Scan: Structure correcting adversarial network for organ segmentation in chest x-rays. In Deep Learning in Medical Image Analysis and Multimodal Learning for Clinical Decision Support: 4th International Workshop, DLMIA 2018, and 8th International Workshop, ML-CDS 2018, Held in Conjunction with MICCAI 2018, Granada, Spain, September 20, 2018, Proceedings, volume 11045, page 263. Springer, 2018.