In this article we present preliminary results on the upper limits to the mass of a companion for 8 apparently single subdwarf B stars, derived from high-precision radial velocity measurements obtained from Harps-N spectra. These limits, corresponding to a few Jupiter masses, show that these stars do not have close companions and keep open the unresolved question of the mechanism that caused the almost complete loss of the envelope for the giant precursors of these stars. For 4 stars with a larger data coverage, it was also possible to set upper limits to the mass of a more massive companion in a wider orbit.
No close companions to a sample of bright sdB stars
1 Introduction
Hot subdwarf B (sdB) stars are core-helium-burning stars with a very thin H-rich envelope, located on the extreme horizontal branch (Heber, 2016). Their precursors lost almost all of their envelope near the tip of the red giant branch and such huge mass loss is compatible with a common envelope ejection if the sdB precursor was in a close binary. And indeed, of the sdB stars that are not obvious spectroscopic binaries, about half are found in close binaries, either with M-dwarf ore white dwarf companions.
However, for the remaining apparently single sdB stars, it is not clear how the envelope loss happened. This is why it is important to verify if these apparently single sdB stars have a low-mass companion or not. To search for close companions to sdB stars, including substellar objects, is the main motivation of this work.
The results presented in this article are preliminary in the sense that the Harps-N high-resolution spectra show a large number of metal absorption lines, many of which do not yet have a certain identification. The line identification work is in progress and therefore the results presented here, based on the cross correlation function (CCF) method, may undergo slight modifications when we will repeat our analysis using an updated set of well identified absorption lines.
2 Selection of the targets
The limiting magnitude to obtain a high S/N ratio (50) with Harps-N is around 12. When this project started a few years ago, the number of apparently single sdB stars brighter than 12 and well visible from La Palma was around 14 and therefore we selected all of them. Only 9 were observed with at least 3 spectra in different epochs and one of them seems to be in a binary system with an M dwarf and we are waiting for data to confirm that it is a binary. In this paper we show the results for the remaining 8 stars.
3 Radial velocities
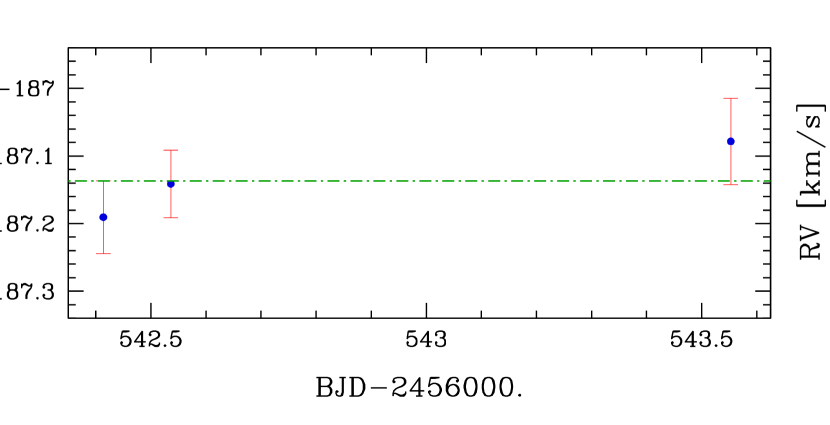
For each star we collected at least 3 Harps-N spectra at different random epochs, with exposure times ranging from 750 s for the brightest star (HD 149382) up to 1 hour (or 4200 s in one case) for the faintest objects. We obtained S/N ratios at 4700 Å between 30 and 140 with most values between 60 and 120. Target names, number of spectra, mean S/N ratios and mean radial velocities (RVs) are listed in Table 1. We note that one star, BD+48∘2721, is a high-velocity star with a mean RV of –187 km/s.
| Name | # of | mean S/N | mean RV |
|---|---|---|---|
| spectra | @ 4700 Å | (m/s) | |
| HD 4539 | 11 | 101.9 | –3 392.7 |
| PG 0342+026 | 4 | 71.3 | 14 073.0 |
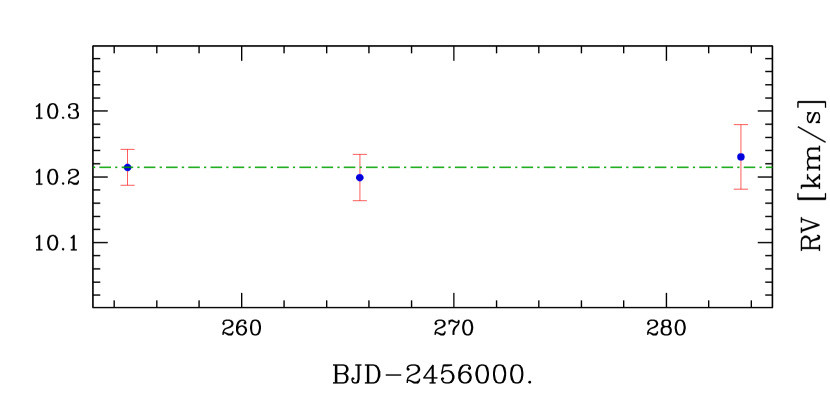
| UVO 0512-08 | 3 | 65.0 | 10 214.5 |
| PG 0909+276 | 7 | 31.6 | 18 610.7 |
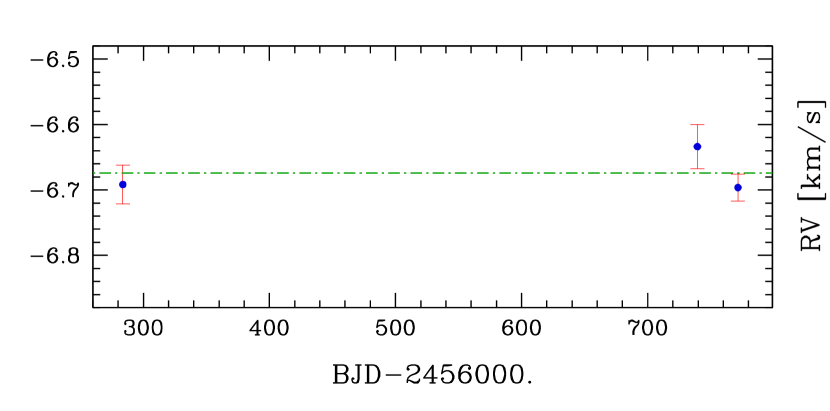
| PG 1234+253 | 3 | 110.8 | –6 674.0 |
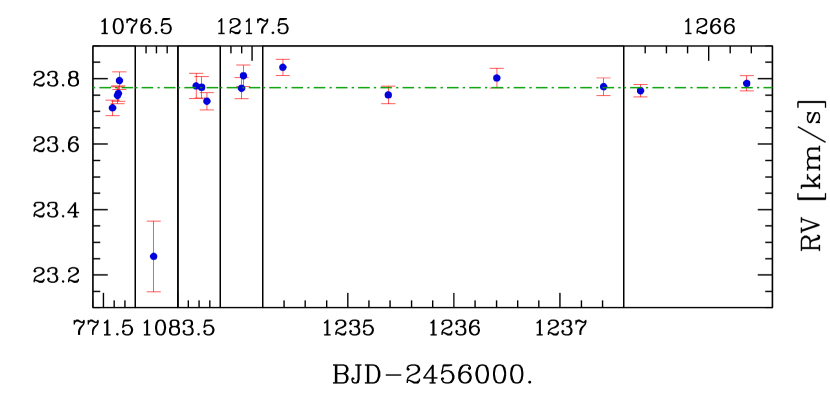
| HD 149382 | 16 | 106.5∗ | 23 772.3∗ |
| PG 1758+364 | 4 | 64.5 | –31 370.9 |
| BD 48∘2721 | 3 | 75.5 | –187 136.7 |
| ∗ excluding the outlier at BJD 2457076.67, see Fig. 6 | |||
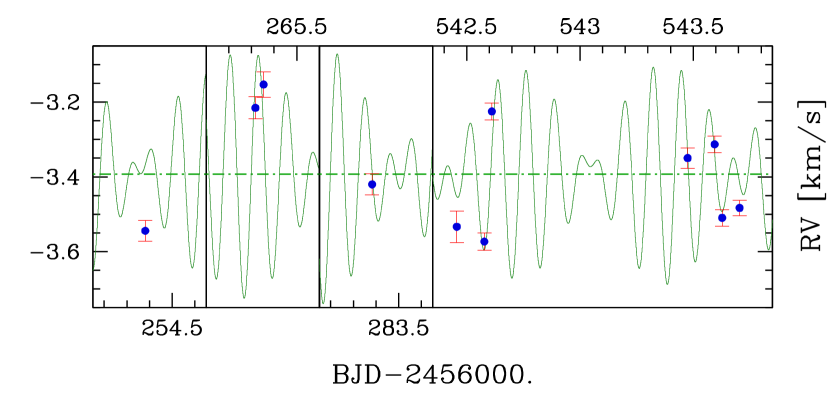
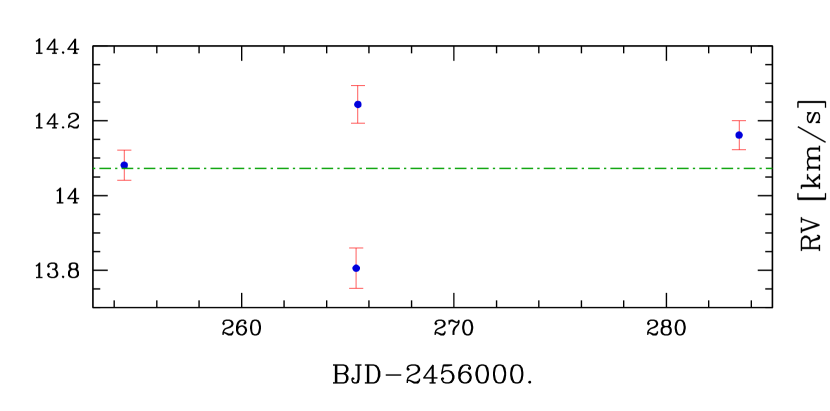
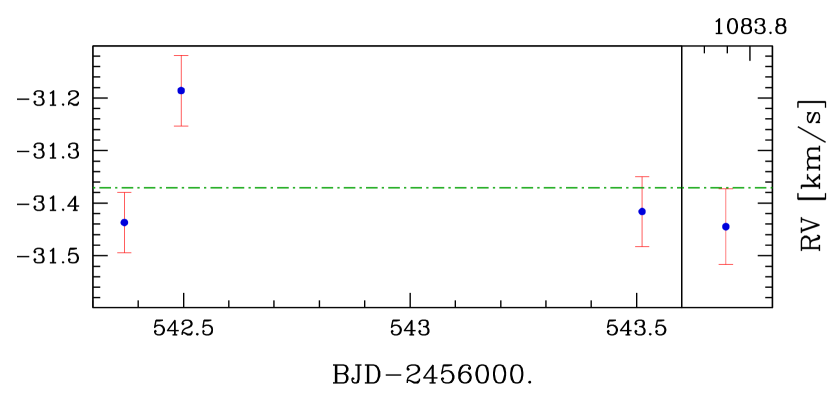
The spectra were reduced and wavelength-calibrated with the Harps-N pipeline. The pipeline includes also the possibility to compute automatically the radial velocities using the CCF. However, the pipeline selects the absorption lines to be used in the CCF computation by means of a mask corresponding to the spectral type. And currently available masks exist only for stars of spectral class G2, K0, K5, M2 and M4. Therefore we built ad hoc masks for sdB stars in order to select the good lines to be used for the CCF computation. Typically, we used 200 absorption lines for each star in the blue part of the spectrum obtaining typical RV errors of 20 to 70 m/s. A sample CCF is shown in Silvotti et al. (2014) while the RV curves are shown in the upper panels of Fig. 1–8. Two stars, HD 4539 and PG 0342+026 (Fig. 1 and 2) show significant RV variations and indeed, after the Harps-N observations, both were found to vary also photometrically from and observations respectively, due to g-mode pulsations (Silvotti et al., 2019; Sahoo et al., 2019).
4 Companion mass
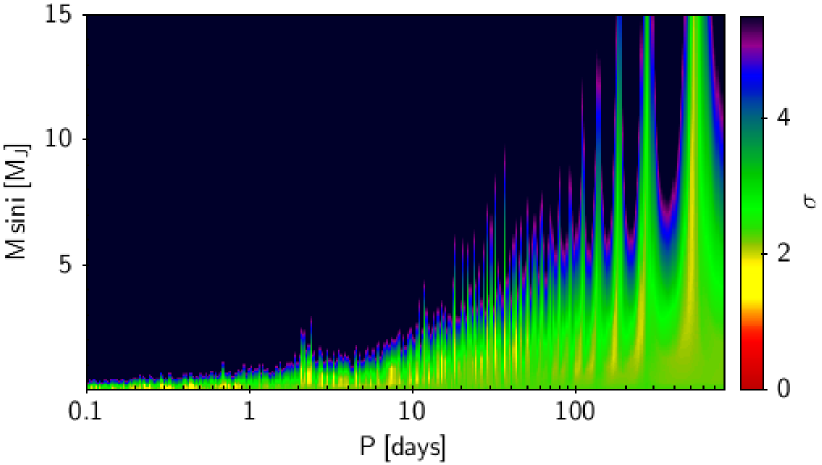
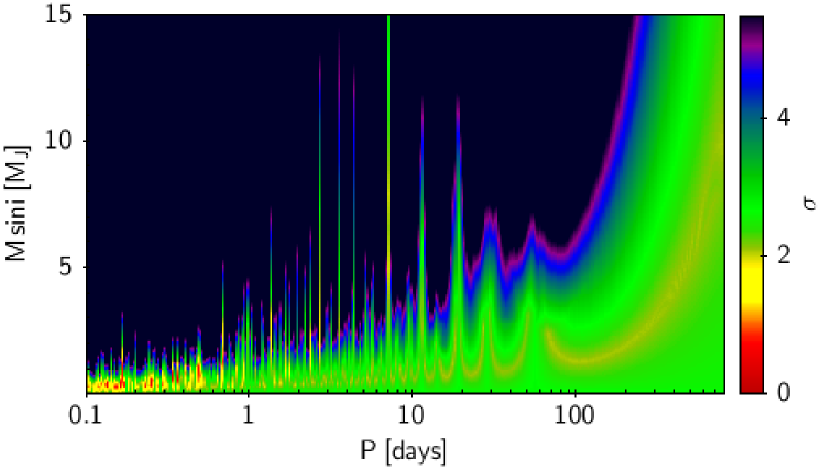
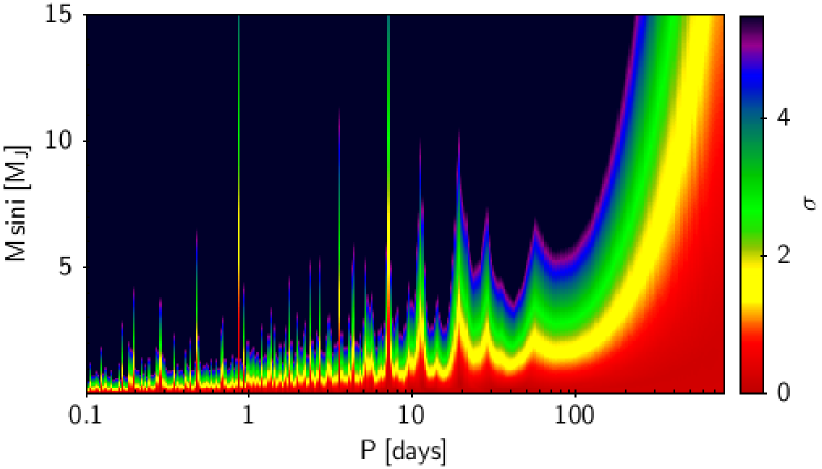
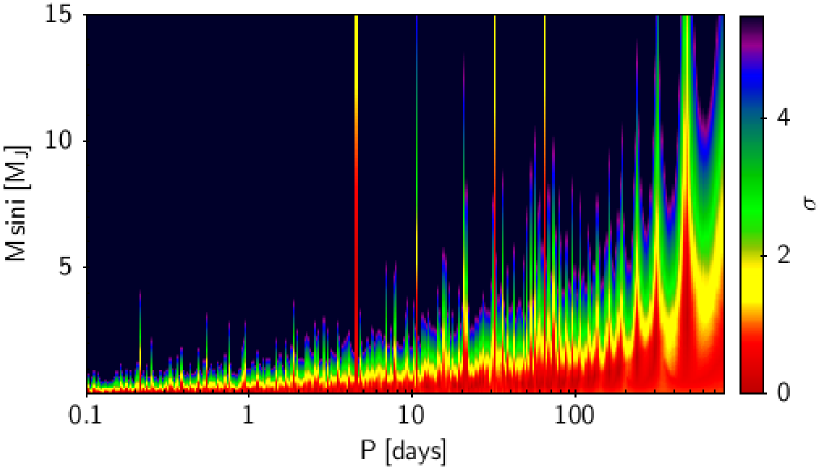
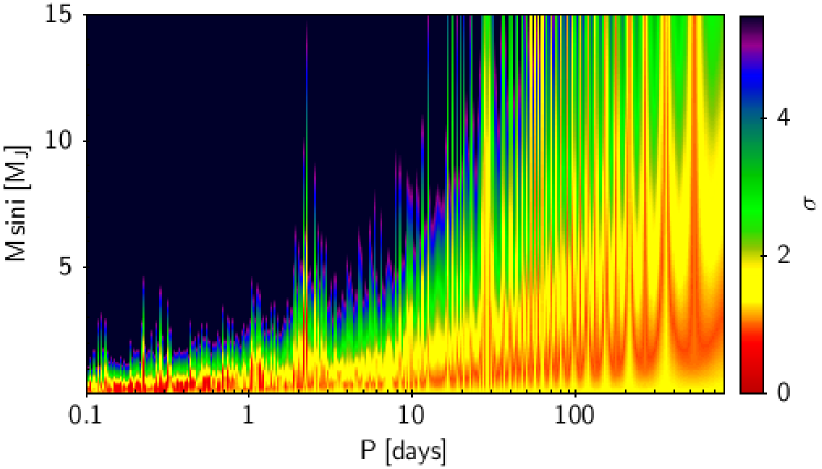
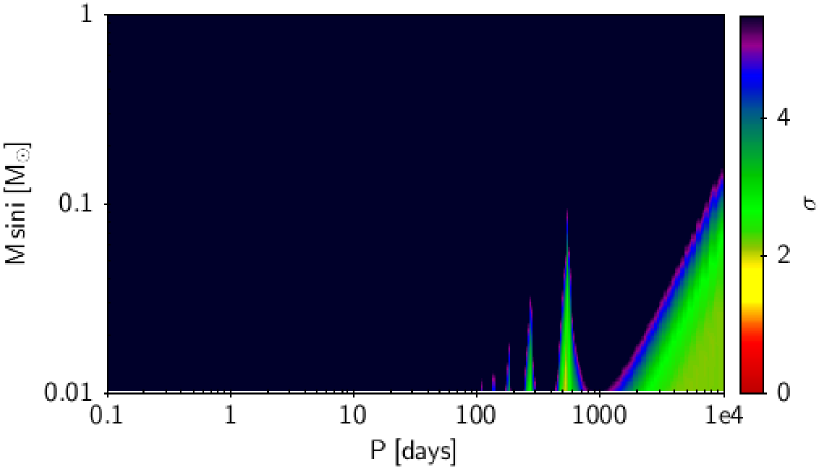
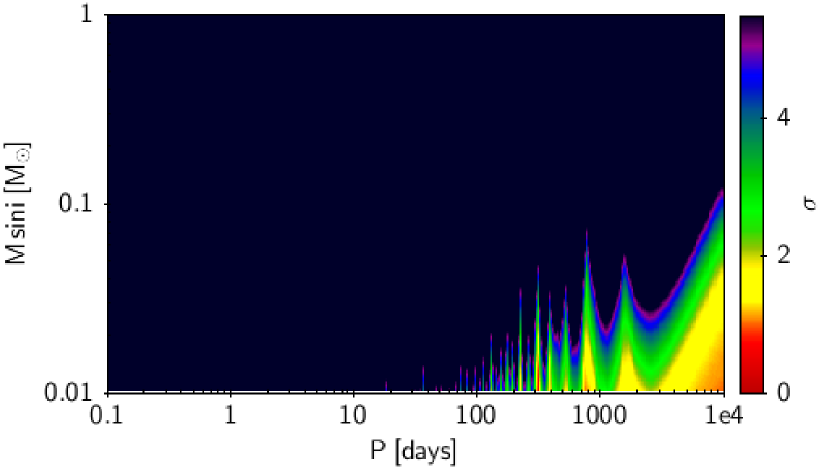
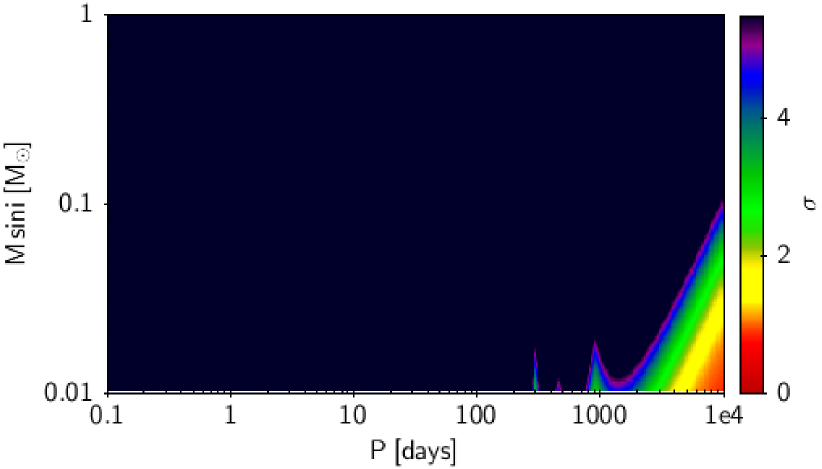
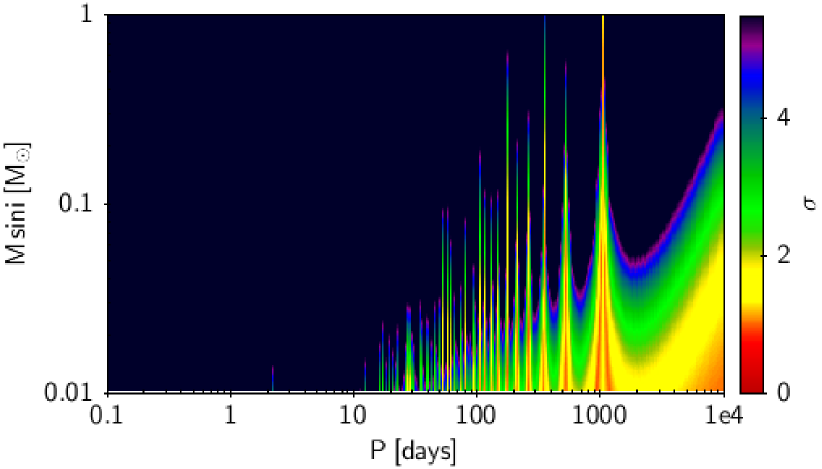
In order to set upper limits to the mass of a companion, we computed a series of synthetic RV curves for different orbital periods and companion masses, assuming circular orbits and a stellar mass of 0.47 (0.40 only for HD 4539, Silvotti et al. 2019), and compared these curves with the RV measurements.
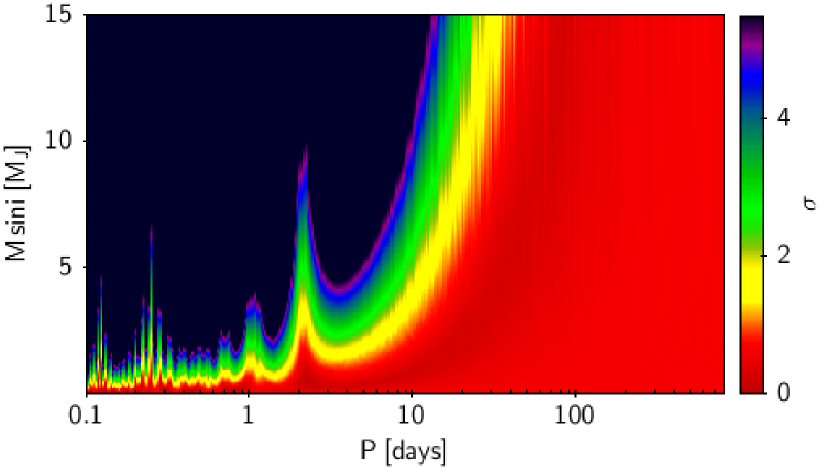
For each synthetic RV curve we selected the phase that gives the best fit to the data using a weighted least squares algorithm. For each observational point we computed the difference, in absolute value and in units (where is the RV error), between the radial velocity and the synthetic RV value. The color coding in Fig. 1–8 (lower panels) corresponds to the mean value of this difference in units. Note that the minima that we see in these plots do not mean that a real signal is there but rather that at those orbital periods the sampling of the data does not allow us to exclude a companion. For the two g-mode pulsators, HD 4539 and PG 0342+026, we should keep in mind that these upper limits to the mass of a companion are likely overestimated given that most if not all the variations that we see in Fig. 1 and 2 are caused by the pulsations. For HD 4539, with 11 RV measurements, it was possible to partially subtract the contribution due to the pulsations (see Fig. 1 and Silvotti et al. (2019) for more details).
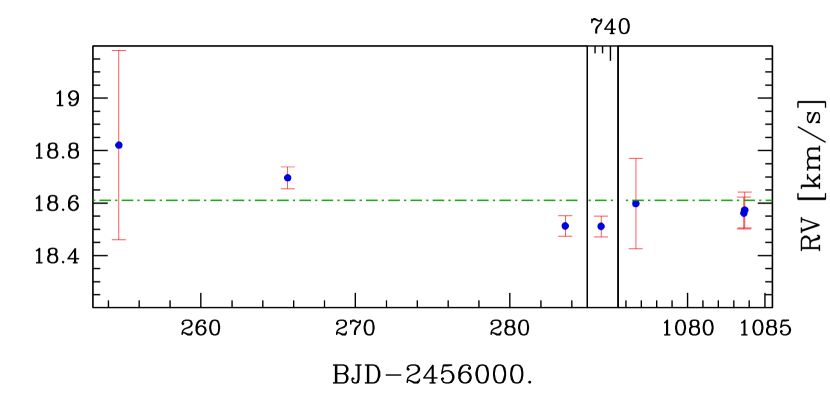
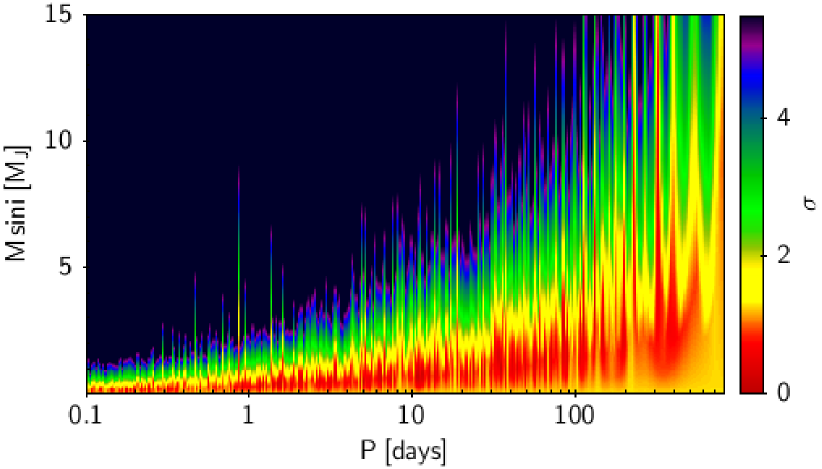
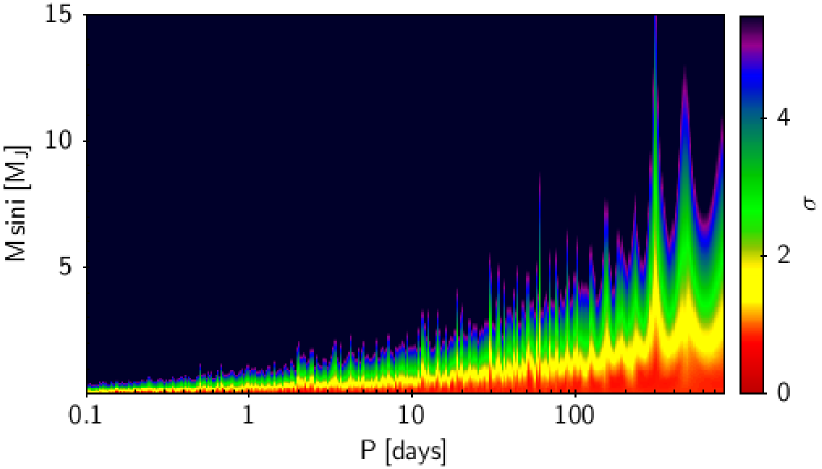
With the same method we computed also the upper limits for a more massive unseen companion in a larger orbit but this was possible only for the four stars that have a sufficiently long data coverage. We see in Fig. 9–12 that also for these wide binaries we can obtain good constraints.
5 data
In order to further exclude the presence of a close companion, it is very usefull to have also high-precision photometric time series, that can detect transits/eclipses or reflection effects (ellipsoidal deformations or Doppler beaming are very weak effects with a low-mass companion, see e.g. Esteves et al. (2015)). Apart from the two g-mode pulsators observed by or , another star, UVO0512-08, was observed by the mission in sector 5 (see next subsection), while all the other five stars will be observed by in the next months (sectors 21-26).
5.1 observation of UVO0512-08
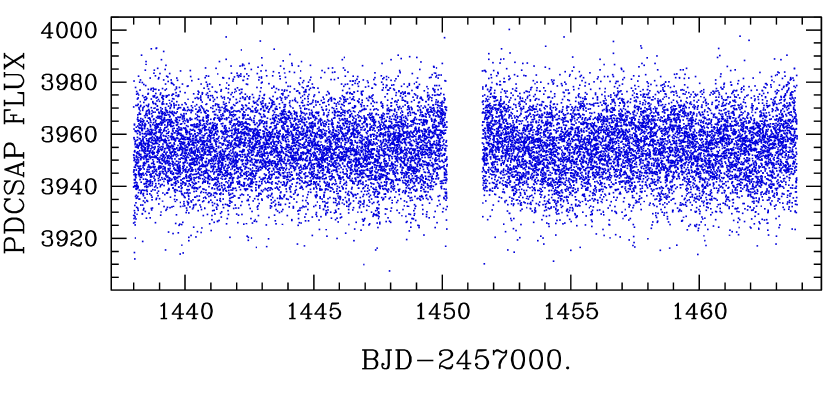
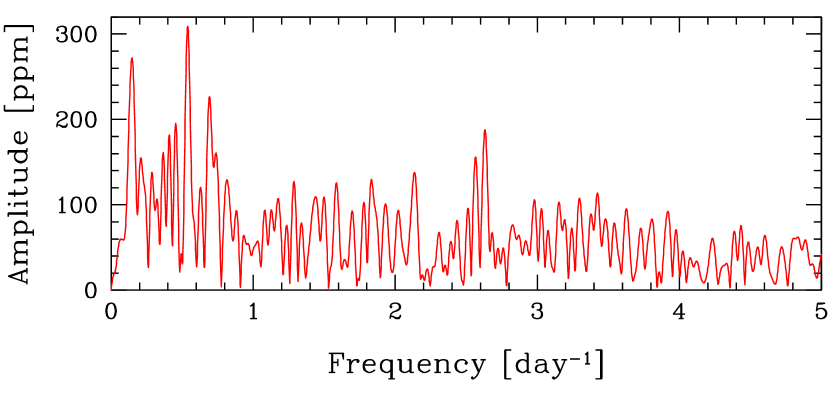
The data on UVO0512-08 are shown in the upper panel of Fig. 13. We used the PDCSAP (Pre-search Data Conditioning Single Aperture) flux removing a few outlayers and removing also the very last part of the run which is noisy. The amplitude spectrum shows only a few peaks at low frequency (lower panel of Fig. 13) and allows us to exclude at least one of the two main peaks that we see in the lower panel of Fig. 3, the one with a period of about 0.87 d. The other peak near 7.3 d, however, is partially compatible with a low-amplitude peak in Fig. 13 at 0.15 d-1. On the other hand, the main peak in the amplitude spectrum of Fig. 13, at about 0.54 d-1, does not have any counterpart in the lower panel of Fig. 3.
6 Conclusions
High resolution spectroscopy is a good way to set strong limits to the mass of a companion to sdB stars. To have also high-quality light curves such as those provided by / or make these limits even stronger. In particular, with , this will be possible for almost all the bright sdB stars in both emispheres. The present limits keep open the unresolved question of the mechanism that caused the loss of the envelope for the giant precursors of these stars. To obtain further data on these height stars and to extend this programme to a larger sample of bright, apparently single, sdB stars would help to make progress in understanding the evolution of these stars.
Acknowledgments
We thank the TNG staff for the great technical support, the TASOC WG8 people for the effort in proposing and organizing the TESS observations of many sdB stars including UVO0512-08, and Stéphane Charpinet and collaborators for organizing a wonderful sdOB meeting at Hendaye in June 2019.
References
- Heber (2016) Heber U., 2016, PASP, 128, 966
- Esteves et al. (2015) Esteves L.J., De Mooij E.J.W., Jayawardhana R., 2015, ApJ, 804, 150
- Silvotti et al. (2014) Silvotti R., Östensen R., Telting J., Lovis C., 2014, ASPC, 481, 13
- Silvotti et al. (2019) Silvotti R., Uzundag M., Baran A.S. et al., 2019, MNRAS, 489, 479
- Sahoo et al. (2019) Sahoo S.K. et al., 2019, in preparation