Continuous-Wave Cavity Ring-Down Polarimetry
Abstract
We present a new cavity-based polarimetric scheme for highly sensitive and time-resolved measurements of birefringence and dichroism, linear and circular, that employs rapidly-pulsed single-frequency CW laser sources and extends current cavity-based spectropolarimetric techniques. We demonstrate how the use of a CW laser source allows for gains in spectral resolution, signal intensity and data acquisition rate compared to traditional pulsed-based cavity ring-down polarimetry (CRDP). We discuss a particular CW-CRDP modality that is different from intensity-based cavity-enhanced polarimetric schemes as it relies on the determination of the polarization-rotation frequency during a ring-down event generated by large intracavity polarization anisotropies. We present the principles of CW-CRDP and validate the applicability of this technique for measurement of the non-resonant Faraday effect in solid SiO2 and CeF3 and gaseous butane. We give a general analysis of the fundamental sensitivity limits for CRDP techniques and show how the presented frequency-based methodology alleviates the requirement for high finesse cavities to achieve high polarimetric sensitivities, and, thus, allows for the extension of cavity-based polarimetric schemes into different spectral regimes but most importantly renders the CW-CRDP methodology particularly suitable for robust portable polarimetric instrumentations.
I Introduction
Polarimetry is one of the oldest research tools available to characterize the optical properties of a substance, and has been essential in scientific developments, such as, for identifying a molecule’s structure Eliel and Wilen (2008); Kelly, Jess, and Price (2005), in tests of fundamental symmetries of nature Fortson and Lewis (1984), in optical magnetometry Budker and Jackson K. (2013). Polarimetry is also used in industrial applications where it is routinely applied in quality and process control in the pharmaceutical, chemical, and agricultural industries Busch and Busch (2006). Despite their extensive use, the sensitivity limits of commercially available optical spectro-polarimeters are at the rad levels, which constrain the applicability of polarimetry in a wide range of important research and industrial applications, e.g., in chemical analysis and drug design and development where the relatively poor polarimetric sensitivities result in poor analyte concentration detection limits at the micromolar levels Kelly, Jess, and Price (2005); Argentine, Owens, and Olsen (2007), or in trace-gas detection and analysis.
Different techniques have been developed to push optical polarimetry to its limits that, in principle, are fundamentally constrained by the photon shot-noise of the light source used for the measurements, which for a mW of visible radiation are at the rad/ levels Budker, Kimball, and DeMille (2008). However, there exist different sources of noise (e.g. light-intensity noise and detector electronic noise) that are usually much larger than the photon shot noise and limit polarimetric sensitivities to the rad/ levels. Modulation techniques are typically employed to approach shot-noise limited polarimetric sensitivities, but even then these limits preclude broad application of polarimetry, especially in trace-gas detection and analysis. The most straightforward solution towards increased spectropolarimetric sensitivities is through the enhancement of the interaction path-length of the probing radiation in the substance under investigation. This can be achieved with the use of optical mirrors to create either multipass cells or optical cavities, where in both cases spectropolarimetric signals are enhanced by the average number of passes through the medium. Multipass cells Li et al. (2011); Tuzson et al. (2013), such as White cells White (1942) or Herriott cells Herriott, Kogelnik, and Kompfner (1964), are technically easy to construct and implement, and path-length enhancements as large as 500 have been demonstrated Das and Wilson (2011); Krzempek et al. (2013). However, multipass-based techniques are still limited by laser intensity fluctuations and the probing radiation travels along a different path for each pass, and, thus, relatively large substance volumes are typically required, making, for example, multipass cells hard to implement for measurements of liquid samples. Importantly, multipass techniques are suitable for absorption measurements and, in principle, can not be employed for the measurement of natural optical activity. On the contrary, using stable optical cavities one can achieve path-length enhancements of up to using state-of-the-art high quality mirrors, with effective path-lengths of up to several hundred km (compare this to the 10 cm interaction path-length of a single-pass commercial polarimeter), enabling record sensitivities for measurements of absorption and birefringence. Moreover, optical cavities can be easily made compact and allow for light-medium interactions in small volumes.
There exist several cavity-based polarimetric designs for the measurement of linear and circular, birefringence and dichroism. Although there are fundamental symmetry considerations for which type of cavity one employs for the measurement of reciprocal or non-reciprocal birefringent effects Barron (2004); Müller, Wiberg, and Vaccaro (2000); Bougas et al. (2012), in general, stable optical cavities consist of two to four optical mirrors, and all designs can be realized using (a) continuous-wave (CW) laser light or (b) short laser pulses. In the case of using CW laser sources, state-of-the-art polarimetric sensitivities of rad have been demonstrated Durand, Morville, and Romanini (2010). There exist several approaches for performing CW cavity-based polarimetric measurements, including modulation-based ones (e.g. Ref. Gianella et al. (2017)), or techniques developed in the field of frequency metrology Hall, Ye, and Ma (2000); Bailly, Thon, and Robilliard (2010). However, these CW-laser-based cavity-enhanced polarimetric techniques require complicated and extremely stable optomechanical setups together with state-of-the-art electronics to achieve this kind of sensitivity levels, precluding their translation into portable instrumentation and, therefore, for applicability in field studies.
In the case of using short laser pulses, cavity-based polarimetric techniques build upon the inherent sensitivity of cavity ring-down spectroscopy (CRDS) Wheeler et al. (1998); Berden and Engeln (2009), via the insertion of polarization-selective components into the preparation, interaction, and analysis stage of a conventional CRDS apparatus. Particularly, in CRDS a laser pulse is stored in a stable optical cavity containing a sample, and the pulse decay, characterized by the “ring-down” time , is monitored with the aid of a detector that measures the intensity of light transmitted through the mirrors. Sensitive detection of this decay time, which depends on the intracavity absorption losses, allows for highly sensitive absorption measurements that are inherently insensitive to the intensity noise originating from the light source. For the case of pulsed polarimetry we can distinguish up to date two distinct measurement approaches. The first is based on monitoring polarization-dependent changes in as the frequency of the laser source is scanned across a transition of the system under investigation that demonstrates dichroism (linear or circular). The system’s dichroism (and its associated birefringence) will transfer a fraction of the intra-cavity optical power from one of its eigenpolarization states to its orthogonal one, which thus becomes observable through the losses measured by the ring-down decays on two orthogonal polarization-sensitive detection channels. Such measurements are effectively intensity-based and can be categorized under the general term of polarization-dependent cavity ring-down spectroscopy (PD-CRDS), a terminology introduced in the first demonstration by Engeln and co-workers Engeln et al. (1997, 1998). PD-CRDS schemes have achieved near-shot-noise limited sensitivities at rad levels, and have been employed for measurements of linear and non-reciprocal circular birefringent effects, such as the measurement of residual or stress-induced linear birefringence of supermirrors Lee et al. (2000); Huang and Lehmann (2008); Dupré (2015); Fleisher et al. (2016), and the measurement of resonant Faraday optical rotation (otherwise known as FR-CRDS) as employed for the sensitive and selective detection of paramagnetic gaseous molecules and radicals (e.g. O2 Berden et al. (1998); Hayden et al. (2018); Patrick, Westberg, and Wysocki (2019); Gianella et al. (2019), HO2 Gianella et al. (2018, 2019)). However, PD-CRDS is specifically suitable for resonant effects and requires ultrahigh finesse optical cavities (as the sensitivity in the decay time is translated directly into polarimetric sensitivity), which effectively increases the cost of the apparatus and can limit its operational lifetime (degradation of the high quality optical mirrors results in reduced sensitivities), precluding this approach from being the most suitable one for portable instrumentations for field studies.
The second approach, alternative to PD-CRDS, relies on the use of an intracavity “bias” polarization anisotropy that introduces a large background polarization rotation and results in a rapid oscillating signal superimposed upon the ring-down signal as detected in a polarization-sensitive analysis stage. This polarization bias rotation offers two critical advantages. The first one is to provide an easily measured polarization beat frequency that is altered with the addition of an incremental anisotropy (i.e. an effect under investigation), transforming the polarimetric measurement into a frequency-based one. For this reason, we categorize these techniques under the general term of cavity ring-down polarimetry (CRDP). The second advantage is that the large bias polarization rotation can suppress intracavity anisotropies of opposite symmetry that might otherwise affect the desired measurement. This advantage becomes apparent in the case of chiral sensing, where CRDP approaches have been implemented for highly sensitive chiral polarimetry Müller, Wiberg, and Vaccaro (2000); Müller et al. (2002); Sofikitis et al. (2014); Bougas et al. (2015). Particularly, in the case of chiral sensing, any intracavity linear birefringence effect would otherwise inhibit the sensitive measurement of the expected weak chiroptical signals. The solution is to use a large intracavity circular birefringence, much larger than any residual linear birefringence present within the cavity, which introduces a large background polarization rotation and protects the measurement of the weak chiroptical signals. Despite the impressive successes of (chiral-sensitive) CRDP Sofikitis et al. (2014), the demonstrated sensitivities are still several orders of magnitude worse than their expected shot-noise limits.
Most of the PD-CRDS demonstrations have employed CW laser sources, while all CRDP demonstrations have employed thus far only pulsed laser sources. The extension in using CW laser sources in CRDS was first shown by Romanini and co-workers, who demonstrated how CW-based CRDS allows for gains in spectral resolution, signal intensity, and data acquisition rates Romanini et al. (1997). In CW-CRDS, the frequency of the CW laser is either locked into resonance with the CRD cavity or brought into resonance slowly (at rates sufficient slow to allow for maximum input coupling, constrained by the cavity lifetime), and a ring-down signal is observed after the laser beam is quickly interrupted (typically much faster than the cavity lifetime, i.e. ). This procedure guarantees a substantial buildup of the intracavity field leading to strong ring-down signals, as the signal intensity of the transmitted beam can reach close to the input intensity, enabling photon-shot-noise limited CRDS measurements. Several commercially available portable systems based on diode-laser CW-CRDS already exist 111Los Gatos Research, http://www.lgrinc.com; Picarro, https://www.picarro.com, however none yet for highly sensitive polarimetry.
In this article, we present the technique of CW-CRDP, a methodology that combines the strengths of all the aforementioned techniques and alleviates their weaknesses, and which we consider to be the ideal modality for highly sensitive, cost-effective, polarimetry, particularly suitable for portable and robust spectro-polarimetric instrumentation. CW-CRDP extends the operational principles of pulsed-based CRDP by employing CW-laser sources, enabling time-resolved shot-noise limited spectropolarimetric sensitivities.
We start by presenting the general principles of operation of CW-CRDP and discuss how these can be generally adapted for measurements of birefringence and dichroism, both circular and linear. Our proposed methodology relies on the practice of using a bias intracavity polarization anisotropy as a means of protection of weak polarimetric signals under investigation, and while this approach has already been applied several times in cavity-based polarimetry, particularly in the case of studying chirality Müller, Wiberg, and Vaccaro (2000); Müller et al. (2002); Sofikitis et al. (2014); Bougas et al. (2015), the fundamental measurement sensitivity benefits behind this methodology have not been explored in detail before, and we demonstrate here how CW-CRDP can reveal these.
In particular, in Sec. II we present the theory behind CW-CRD polarimetry, and its operational principles. In Sec. III, we present the details of a prototype setup that we employ for measurements of non-resonant Faraday optical rotation from solid and gaseous systems using CW-CRDP. In Sec. IV we present results for the Faraday effect in solid SiO2 and CeF3, and in gaseous butane, where we measure their Verdet constants to quantitatively validate our method. Finally, in Sec. V we discuss the fundamental sensitivity limits for any CW-CRD-based polarimetric scheme, which we employ to analyze the stability of our experimental results. Most importantly, we demonstrate how the introduction of an intracavity bias anisotropy, which enables frequency-based polarimetric measurements and is adaptable in all CRD-based polarimetric schemes, can effectively alleviate the necessity for high finesse optical cavities and, therefore, the need of ultrahigh-quality optics, which can be costly and not available at all optical spectral regions, a crucially important aspect for robust and versatile portable spectropolarimetric instrumentations.
II Theory
We start by discussing the theory of CW-CRDP. Although several extended analyses of the theory behind CW-based cavity-enhanced polarimetric schemes exist in the literature Nilsson, Gustafson, and Byer (1989); Vallet et al. (1999); Bougas et al. (2014); Gianella et al. (2019), we repeat here key theoretical aspects to clarify the necessary terminology and concepts required to understand the experimental principles of the CW-CRDP technique.
To examine the principles of operation of a CW-CRD polarimetric protocol we focus, for simplicity and without loss of generality, on linear optical cavities, consisting of two mirrors and, as a bias intracavity polarization anisotropy, a non-reciprocal circular birefringent effect (e.g. Faraday effect). However, we emphasize that the general theoretical approach we present here can be similarly applied for the case of reciprocal circular birefringence (e.g. for a four-mirror cavity for the study of chirality Bougas et al. (2014)) and linear birefringence (e.g. linear cavity for the study of Voigt effect, mirror-related birefringence) Engeln et al. (1997); Dupré (2015), and, when required, we discuss extensions to different designs. Furthermore, we assume that the laser beam is mode-matched into the TEM00 mode of the optical cavity and, therefore, we focus our analysis on the polarization properties of the cavity’s longitudinal modes. We also neglect any changes in the spatial profile of the laser beam, possibly introduced by the intracavity element(s).
We present an eigenpolarization theory for the cavity-based polarimeter based on the Jones matrix calculus that allows us to describe the full optical system and to incorporate a CW laser source and the ability to switch it on and off rapidly. Here, the full optical system includes the polarization-control optics before the cavity, the optical cavity including the intracavity anisotropy, and the polarization-analysis (detection) stage. In the Jones matrix formalism, the effect of any optical element on the polarization state vector of the laser light is described as a linear operator expressed by a matrix whose elements are in general complex. We denote each of these matrices by boldface letters . Most importantly, the direct incorporation of amplitude and phase information in the Jones matrices allows for the investigation of coherent phenomena.
II.1 Jones matrices for polarization optics
The Jones matrix representation of a mirror with a finite reflectivity () is given as:
| (1) |
where the index denotes each cavity mirror (in our case =). Since we focus on two-mirror cavities, with normal angle-of-incidence reflections, we set the Fresnel amplitude reflection coefficients for the s and p polarizations to be equal in magnitude (an assumption expressed by the common factor ). The differential - phase shift , represents the linear birefringence obtained upon mirror reflection. For normal incidence these - phase shifts can be of the order of rad at a specific design wavelength Huang and Lehmann (2008); Hall, Ye, and Ma (2000).
In the presence of a longitudinal magnetic field a medium becomes circular birefringent, an effect otherwise know as the Faraday effect Budker et al. (2002). The Faraday optical rotation is expressed as: , where B is the magnetic field strength along the direction of light propagation, is the path-length in the medium, and is the Verdet constant of the medium. The Jones matrix representation for the Faraday effect is an SU(2) rotation matrix with argument :
| (2) |
The physical direction of the polarization rotation is defined by the magnetic field orientation. Due to the non-reciprocal nature of the Faraday effect, when either the magnetic field or the direction of propagation of the light reverses, the sign of rotation reverses. This directional symmetry breaking, induced by the Faraday effect, has been essential for the implementation of crucial signal reversals in chiral cavity-based polarimetry Sofikitis et al. (2014); Bougas et al. (2015).
II.2 Frequencies and polarizations of the cavity spectrum
The Jones matrix representation of a round-trip in the optical cavity is obtained by the ordered multiplication of Jones matrices representing the independent optical elements (see Fig. 1),
| (3) |
where, again for simplicity, we assume that mirrors M1 and M2 have the same characteristics, i.e. and .
Using Eq. 3 we can determine the allowed polarizations of the cavity modes (eigenpolarizations) along with their respective frequencies. Considering that the Jones matrices are unitary matrices of rank two, each matrix has two eigenvalues and two eigenvectors; the eigenvectors are orthogonal, in general complex, vectors and represent the eigenpolarizations of each cavity mode. The eigenvalues can be written in the general form , and the phase of each eigenvalue, , is the round-trip optical phase shift obtained during light propagation, which, thus, yields the frequency splittings of the eigenmodes.
In the simple case of an isotropic cavity ( & ), the two eigenmodes are degenerate and any polarization state can couple into the cavity (i.e. becomes proportional to the identity matrix; Fig. 1, upper panel). The introduction of any polarization anisotropy lifts this degeneracy. In the most general case, the spectrum of the cavity is represented by two non-degenerate modes of elliptical polarization, whose frequencies lie above and below the degenerate frequency of the isotropic case. However, when the intracavity anisotropy is a circular birefringence ( & ), the two eigenpolarization modes are circular-polarization states, denoted hereafter as and modes, and, thus, the cavity spectrum is now represented by two modes split in frequency by 2 f, where FSR is the cavity’s free spectral range, with the speed of light and the round-trip cavity length (Fig. 1, lower panel). We note that this mode structure can be resolved in the case of a frequency splitting much larger than the cavity linewidth, which is the case when the polarization anisotropy (here a Faraday effect), obeys the relationship , where is the finesse of the optical cavity.
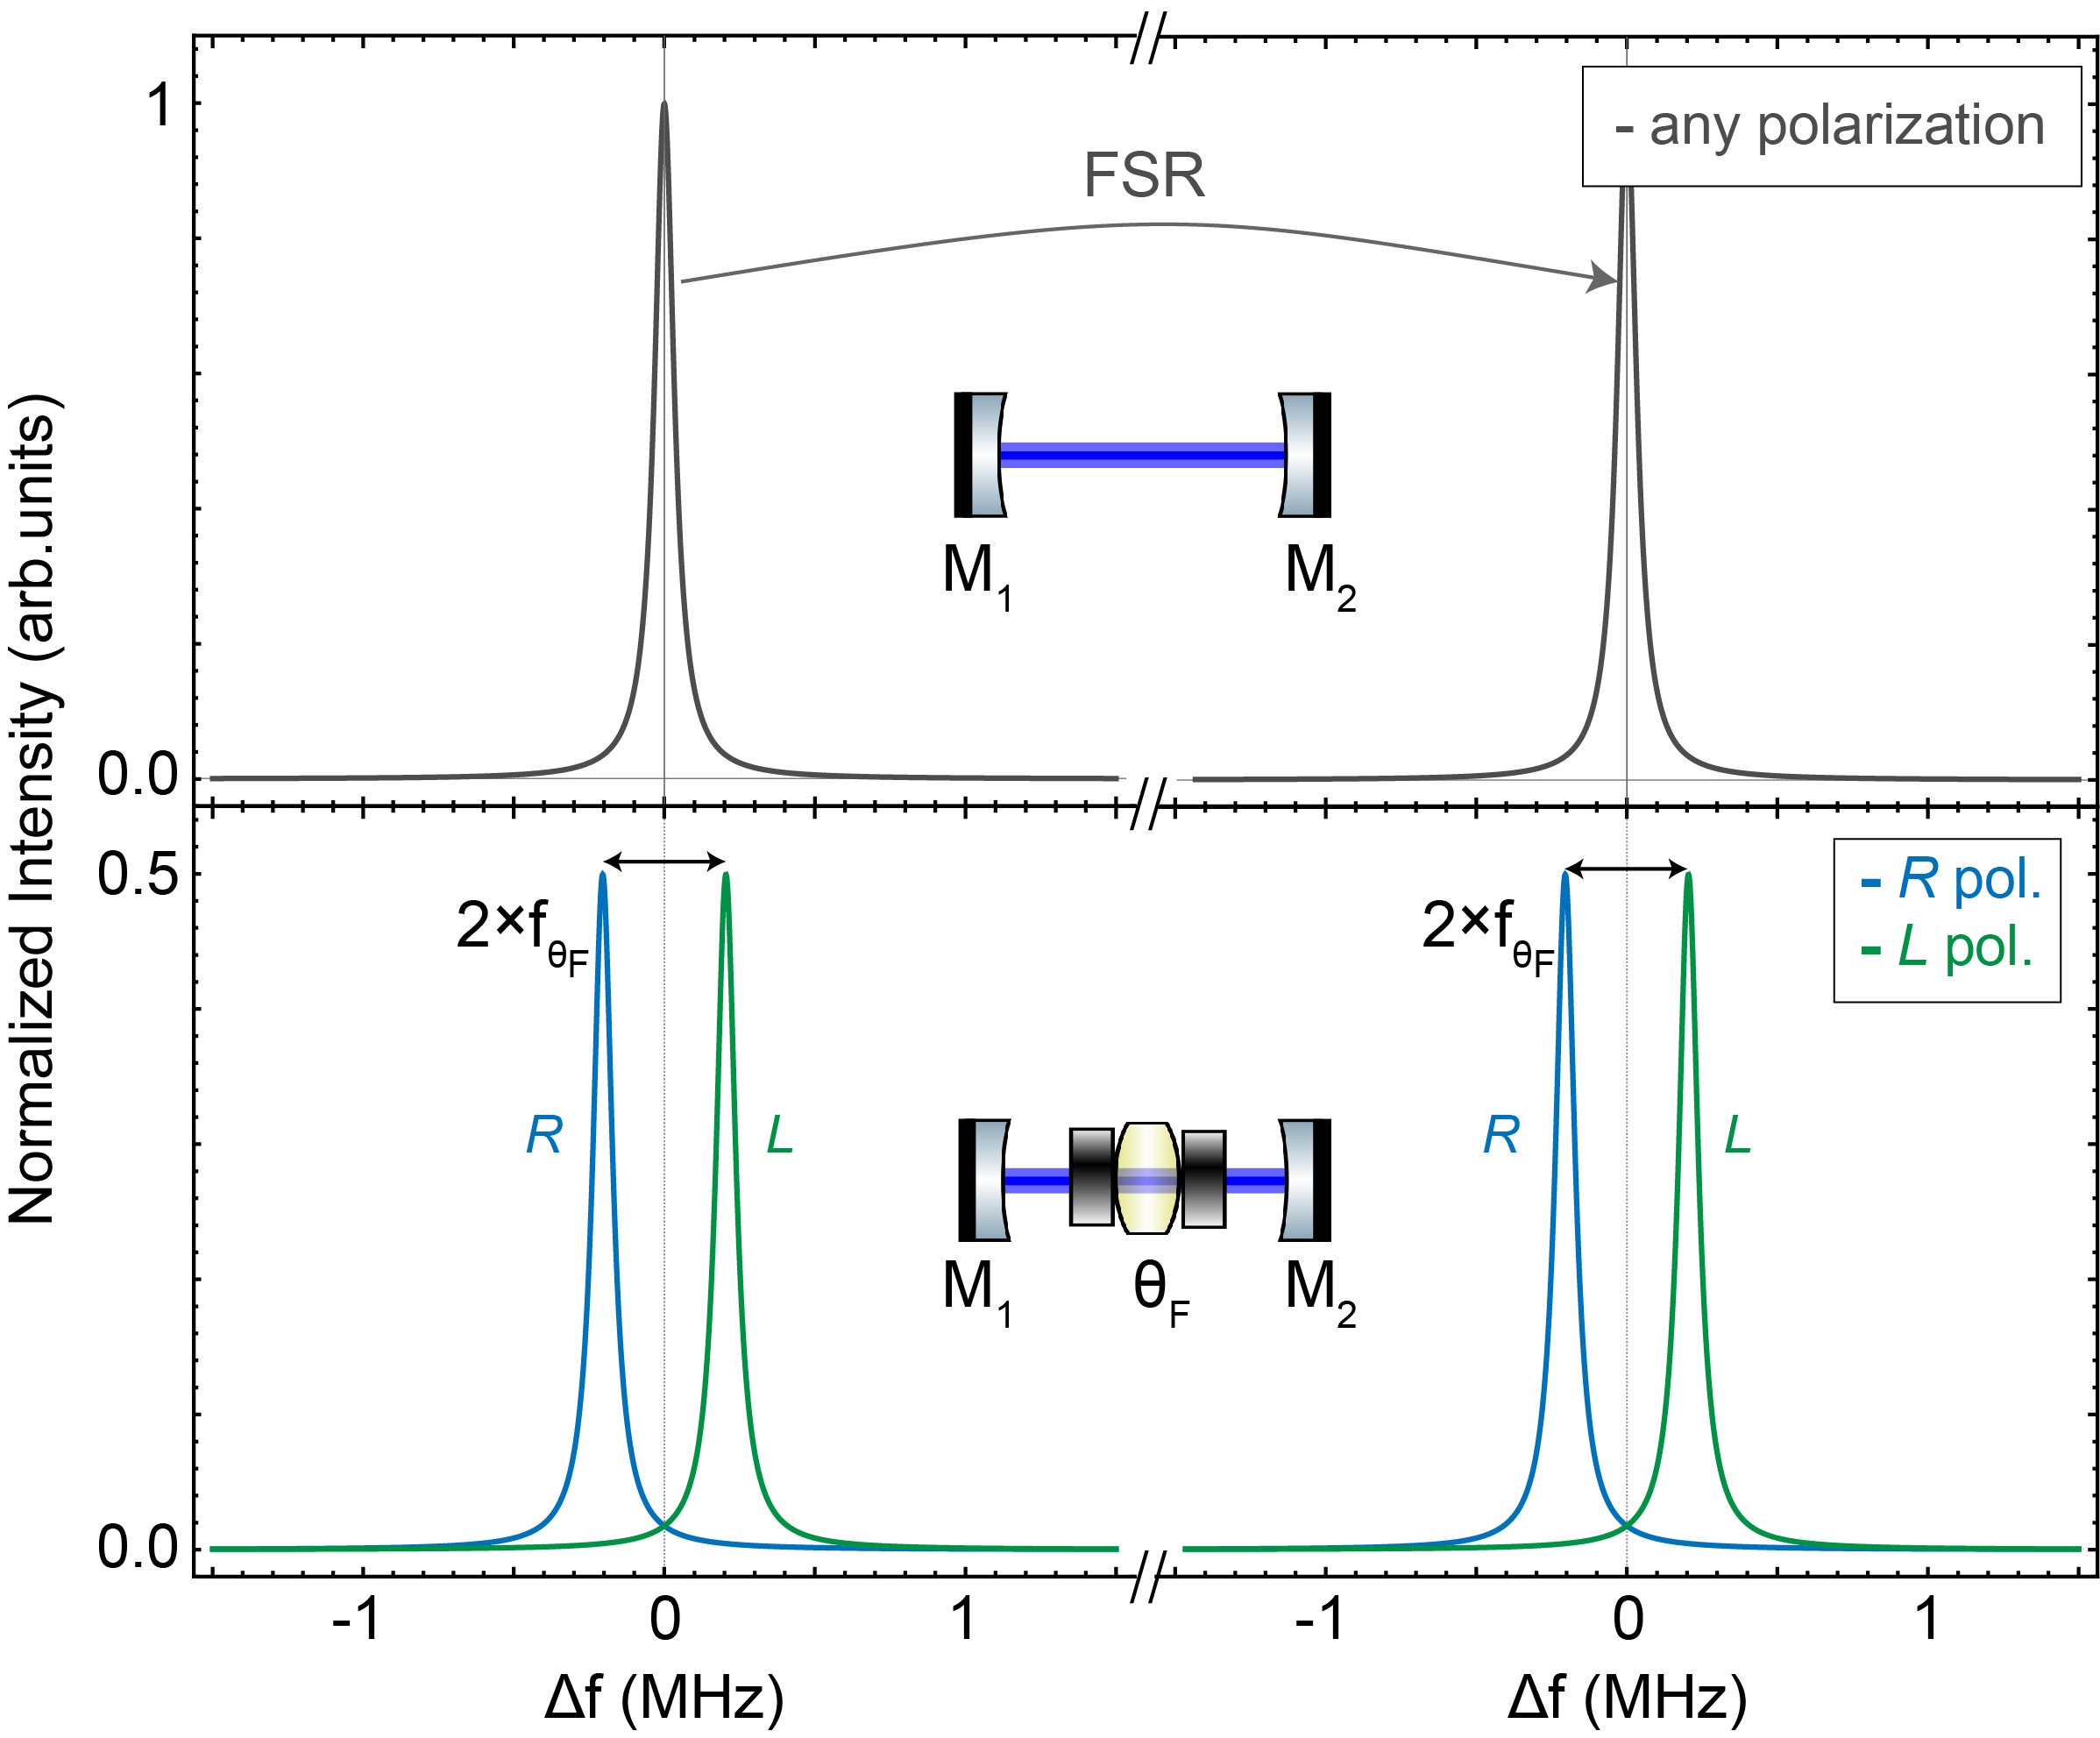
In the case of intracavity linear birefringence ( & ), which can also originate from thermal or mechanical stress in all intracavity optics apart from mirror-reflection-related phase shifts, the path-length-related enhancement of circular birefringence is inhibited through the transformation of the circularly polarized eigenmodes into linear ones. The equivalent time-domain explanation is that an incident linearly polarized light beam will oscillate between linear and circular polarization states, reducing the effective path-length enhancement and the sensitivity of the measurement. However, as long as the bias intracavity circular birefringence is much larger than linear birefringence, i.e. here , then the effects of linear birefringence will be averaged out and the cavity modes will maintain the circular polarization character. The physics behind this process has been extensively discussed within the context of chiral-sensitive CRDP Müller et al. (2002); Bougas et al. (2014); Sofikitis et al. (2018).
Finally, in the case of circular dichroism, the linewidths of the two cavity eigenpolarization modes become different, since the cavity finesse depends on the intracavity losses, which are in this case different for the two circular polarization states.
II.3 Principles of a CRDP measurement: pulsed vs. CW
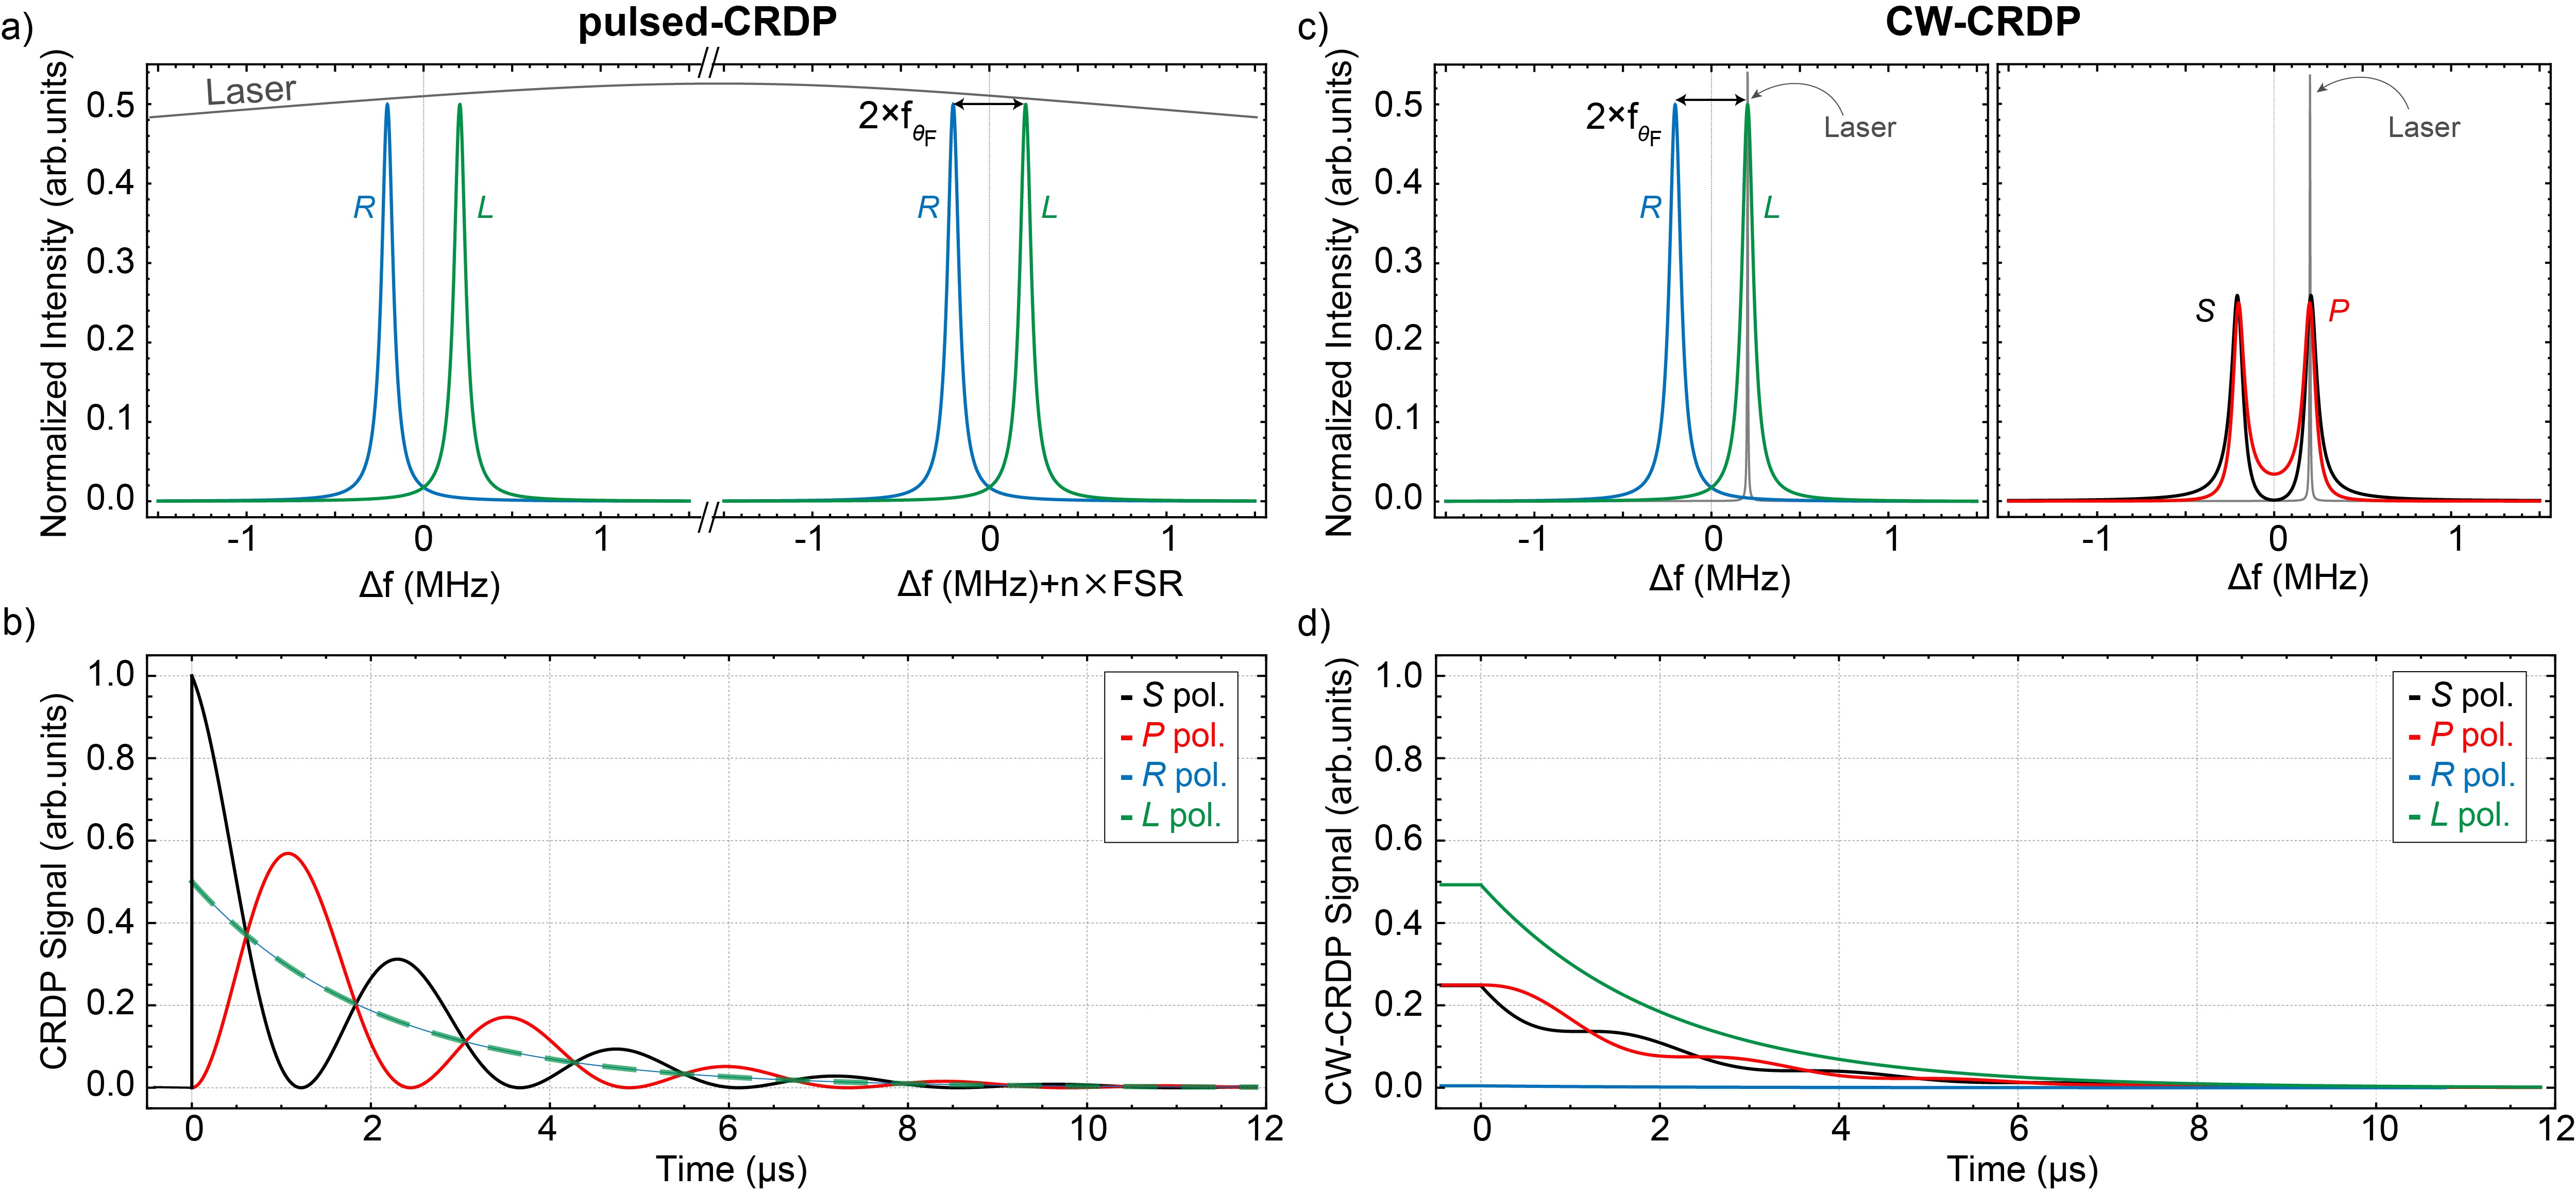
In traditional CRDP, laser pulses with linewidths much larger than a cavity FSR are used [Fig. 2 (a)]. For example, a gaussian-shaped Fourier-limited laser pulse of ps in duration has a spectral bandwidth of THz, which is much larger than the FSR of meter-long cavities. Typically, such a linearly polarized laser pulse is directly coupled into the cavity by coherently exciting multiple cavity (eigenpolarization) modes. The transmitted beam is also linearly polarized, and when analyzed using a linear-polarization detector, i.e. a balanced polarimeter that analyzes linear polarization components such as a Wollaston prism, the resulting ring-down signal is superimposed with the differential polarization beat frequency equal to the - frequency mode-splitting [CRDP trace: Fig. 2 (b); note that if we analyze the circular components we see pure exponentially decaying ring-down signals]. If there are no depolarization mechanisms, such as dichroic absorption losses and/or any residual intracavity linear birefringence, the modulation depth of this polarization beat frequency approaches unity.
In the case of CW-CRDP, the measurement principle is different. Incident radiation from a CW laser source with a linewidth that is significantly smaller than that of a cavity, can couple into and build-up within that cavity by exciting only one particular cavity mode at a time [Fig. 2 (c); note that here we show only one pair of & modes, instead of multiple mode pairs separated by several FSRs as in Fig. 2 (a)]. As shown in the previous section, for a linear cavity with a large intracavity circular birefringent anisotropy, the cavity eigenpolarization modes are frequency-separated circularly polarized modes ( and modes), and the polarization state of the incident radiation will be projected onto these. Therefore, depending on the frequency detuning of the incident radiation with respect to the - cavity eingepolarization modes, a different polarization state will be coupled into the cavity. For example, the frequency at which the and modes are equally excited [ MHz; Fig. 2 (c)] corresponds to a mode of linear polarization, as this is an equal coherent superposition of right and left circularly polarized states. Similarly, the central frequencies of the individual and cavity modes correspond to elliptical polarization states (since these are an unequal superposition of the and modes), and the degree of ellipticity of these states depends on the detuning but also on the - mode-splitting, i.e. on the value of the bias anisotropy (e.g. ), as the larger (smaller) the splitting, the larger the circular (linear) character of the coupled, and consequently of the transmitted, polarization state.
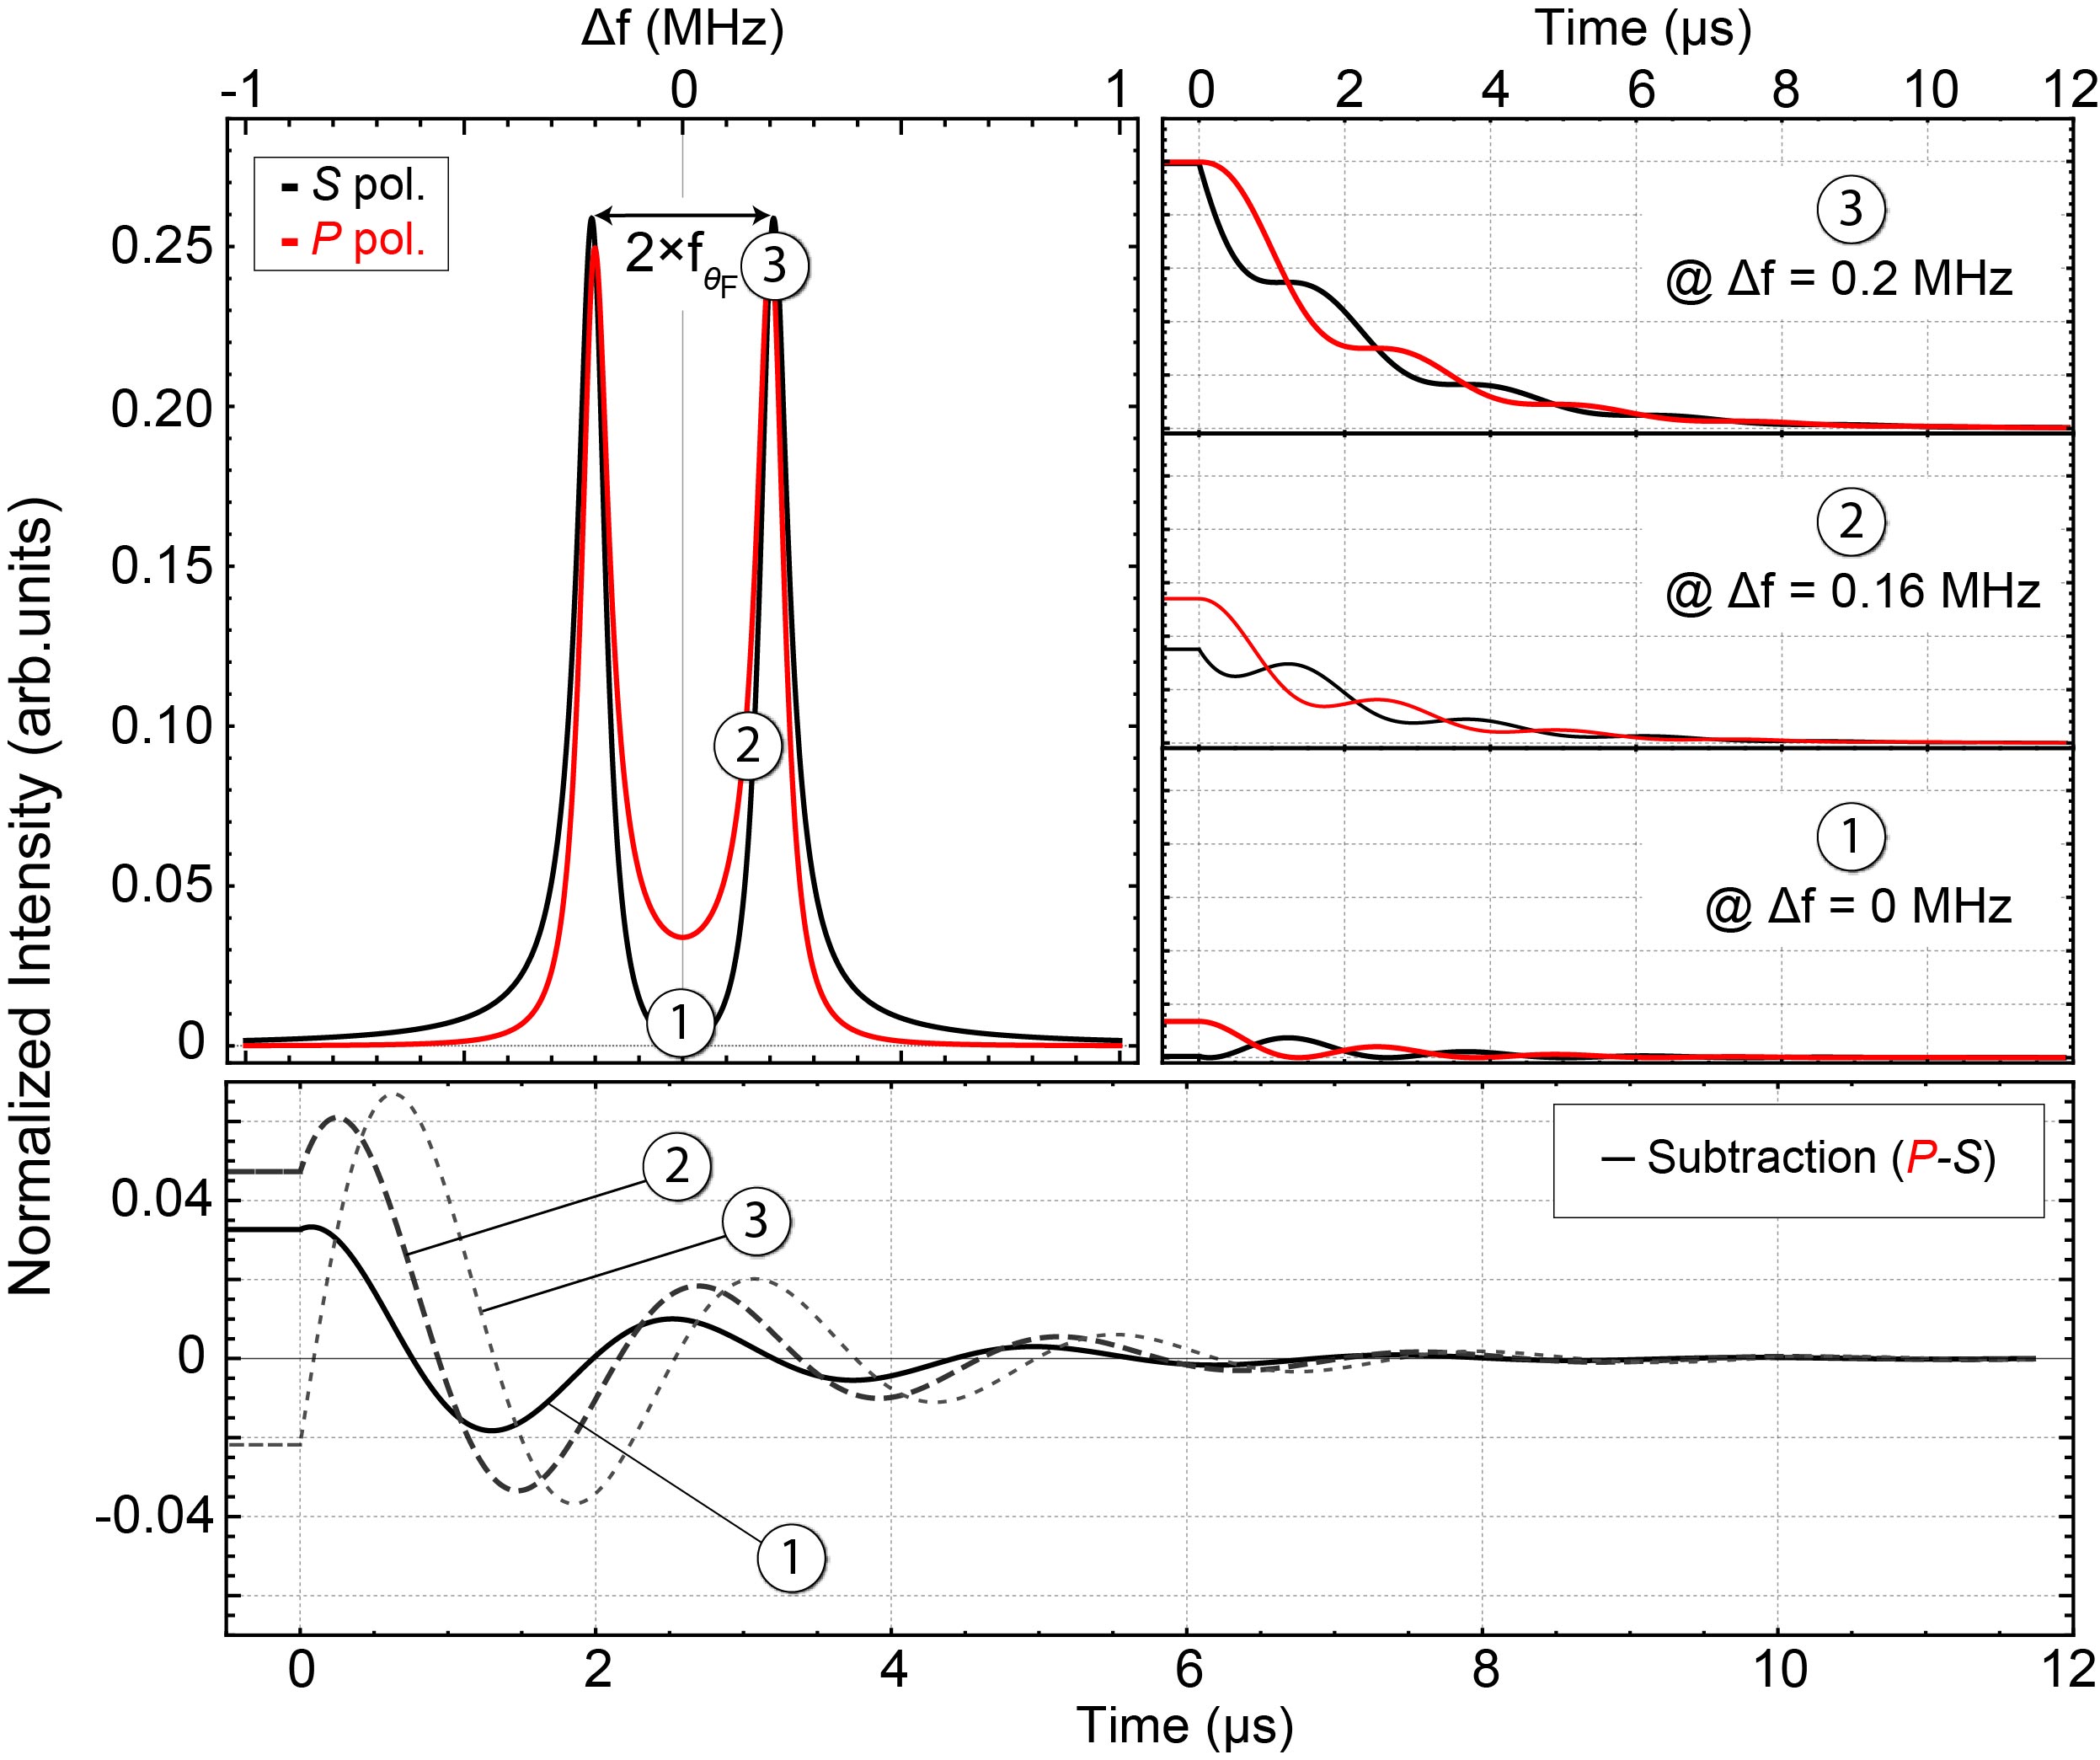
As in pulsed-CRDP, in CW-CRDP one analyzes the polarization state of the transmitted radiation using a linearly-sensitive balanced polarimeter, which appropriately mixes the circular polarization components of the transmitted radiation to produce two orthogonal, linearly polarized ( and ) waves incident upon separate photodetectors [Fig. 2 (c)]. However, in CW-CRDP, to initiate a ring-down event, the incident radiation which is coupled into and built-up within the cavity, is abruptly switched off (at time-scales much faster than the cavity lifetime). Since the frequency detuning of the incident radiation defines the coupled polarization state (which can vary continuously from linear to circular), once the incident radiation is switched off, this coupled (intracavity) polarization state freely evolves, resulting in a transmitted ring-down signal superimposed with a polarization beat frequency [CW-CRDP trace: Fig. 2 (d)]. For the case of incident radiation tuned to the central frequency point ( MHz), linearly polarized light couples to and is transmitted by the cavity, which results in a modulation depth that reaches unity, similarly to the case of pulsed-CRDP. However, in the CW case, the signal amplitude is reduced, and this reduction follows the value of the intracavity polarization anisotropy (i.e. the - mode-splitting). Similarly, the circularity of the coupled light increases as the incident radiation is detuned from this central frequency point, leading to a decrease in the modulation depth of the polarization beat frequency, though accompanied by an increase in amplitude. We demonstrate these cases in Fig. 3 where we present simulations of CW-CRDP traces for different possible frequency detunings of the incident radiation with respect to the - modes (Fig. 2). Overall, to perform CW-CRDP measurements using narrow-linewidth laser sources, an optimum frequency detuning of the incident radiation with respect to the cavity’s eigenpolarization modes exists that depends on the cavity linewidth (i.e. the cavity finesse) and the strength of the intracavity anisotropy (e.g. ). For example, if the strength of the intracavity anisotropy is large enough to result in a mode splitting much larger than a few cavity linewidths, the two modes are practically decoupled and it is not be possible to perform measurements using a narrow-linewidth laser (or, equivalently, if the finesse of the cavity is high enough to effectively lead to a substantially reduced mode overlap). On the other hand, if the mode splitting is much smaller than a cavity linewidth, then substantial overlap between the - modes is attained and one achieves optimum overlap for a large range of frequency detunings. However, is such case, the polarization beat frequency signal becomes small, which might lead to reduced polarimetric sensitivities (e.g. because the intracavity circular birefringence is comparable in strength to any residual intracavity linear birefringence). In Sec. V we discuss how one should appropriately select the experimental parameters of a CW-CRDP technique when we analyze the fundamental sensitivity limits of CRDP methods, and alternative experimental modalities that resolve issues related to the mode coupling of the incident radiation.
In Fig. 3 we also show that subtracting the and signals generates a pure damped sinusoidal signal which clearly exhibits the change in signal amplitude as a function of the frequency detuning of the incident radiation with respect to the cavity’s eigenpolarization mode-splitting. In a CW-CRDP protocol, a balanced detection scheme is advantageous as the signal subtraction suppresses common mode laser intensity noise measured by the two - and -wave photodetectors, resulting in improved signal-to-noise ratios. Furthermore, in addition to the amplitude change as a function of detuning, our simulations show an associated phase shift in the recorded beat frequency. This phase shift dependence on the frequency detuning is critical for a CW-CRDP protocol because it indicates that the performance of a frequency-stabilization scheme, which controls the frequency of the incident radiation with respect to the cavity-mode structure, directly impacts the measurement sensitivity (in pulsed-CRDP this is not an issue as the incident radiation couples fully with multiple modes). We discuss this in more detail when we analyze the fundamental sensitivity limits of the CW-CRDP method.
Here, we wish to emphasize a critical difference between pulsed-based and CW-based CRDP. In the case of CW-CRDP the initial signal amplitude is defined by the cavity transmission on resonance, which in theory can reach unity, so detected optical powers of 1-100 mW can be achieved, whereas for pulsed-CRDP typical detected optical powers are at the W levels at best Romanini et al. (1997); Sofikitis et al. (2014). Therefore, CW-CRDP can result in signals with significantly higher signal-to-noise ratio than pulsed techniques, while attaining much higher repetition rates through the use of fast optical switches, leading to improved (ideally shot-noise limited) statistics for a given integration time.
Finally, although this discussion focuses on measurements of circular birefringence, the same measurement principles are applicable in studies of linear birefringence. Moreover, the case of linear (circular) dichroism is studied by measuring the ring-down times as recorded by a linear (circular) balanced polarimeter.
III Experiment
III.1 CW-CRDP apparatus
In Fig. 4 we present a schematic diagram of the optical setup we use to demonstrate the experimental principles of the CW-CRDP technique. In this work we focus on studying the non-resonant Faraday effect from gaseous species. For this reason, we chose as our intracavity bias anisotropy a non-reciprocal Faraday optical rotation, i.e. , which can be generated with the use of a material that has low enough absorption losses and large enough magneto-optic response, to enable sensitive CW-CRDP measurements. We describe in the next section the different options we consider in this work.
The ring-down cavity we use has a total length of 0.60 m and consists of two highly reflective concave mirrors with radii of curvature of 1 m (FiveNine Optics; specified reflectivity R99.9% at 408 nm). The mirrors and intracavity optics are mounted on kinematic mounts. To be able to perform Faraday effect measurements of gaseous samples, we install an intracavity, 40 cm long, solenoid that generates uniform magnetic fields (with strengths of 40 G per ampere). The solenoid is driven by a DC power supply, and we switch the magnetic field using a relay circuit controlled with a digital-to-analog device (Labjack, U6). The whole cavity is housed within a custom stainless-steel enclosure, sealed with a Plexiglas lid. Anti-reflection (AR) coated flange viewports (Thorlabs, VPCH42-A) are mounted on the enclosure and allow for laser-light access into the cavity and for collecting the cavity reflection required for frequency locking. A rotary vane pump (Kurt J. Lesker, RV224) is connected to the enclosure and is used to pump down the system for measurements, and we monitor the pressure inside the enclosure using a vacuum gauge. We control the injection of gases into the cavity using a needle valve, which is connected directly to the enclosure.
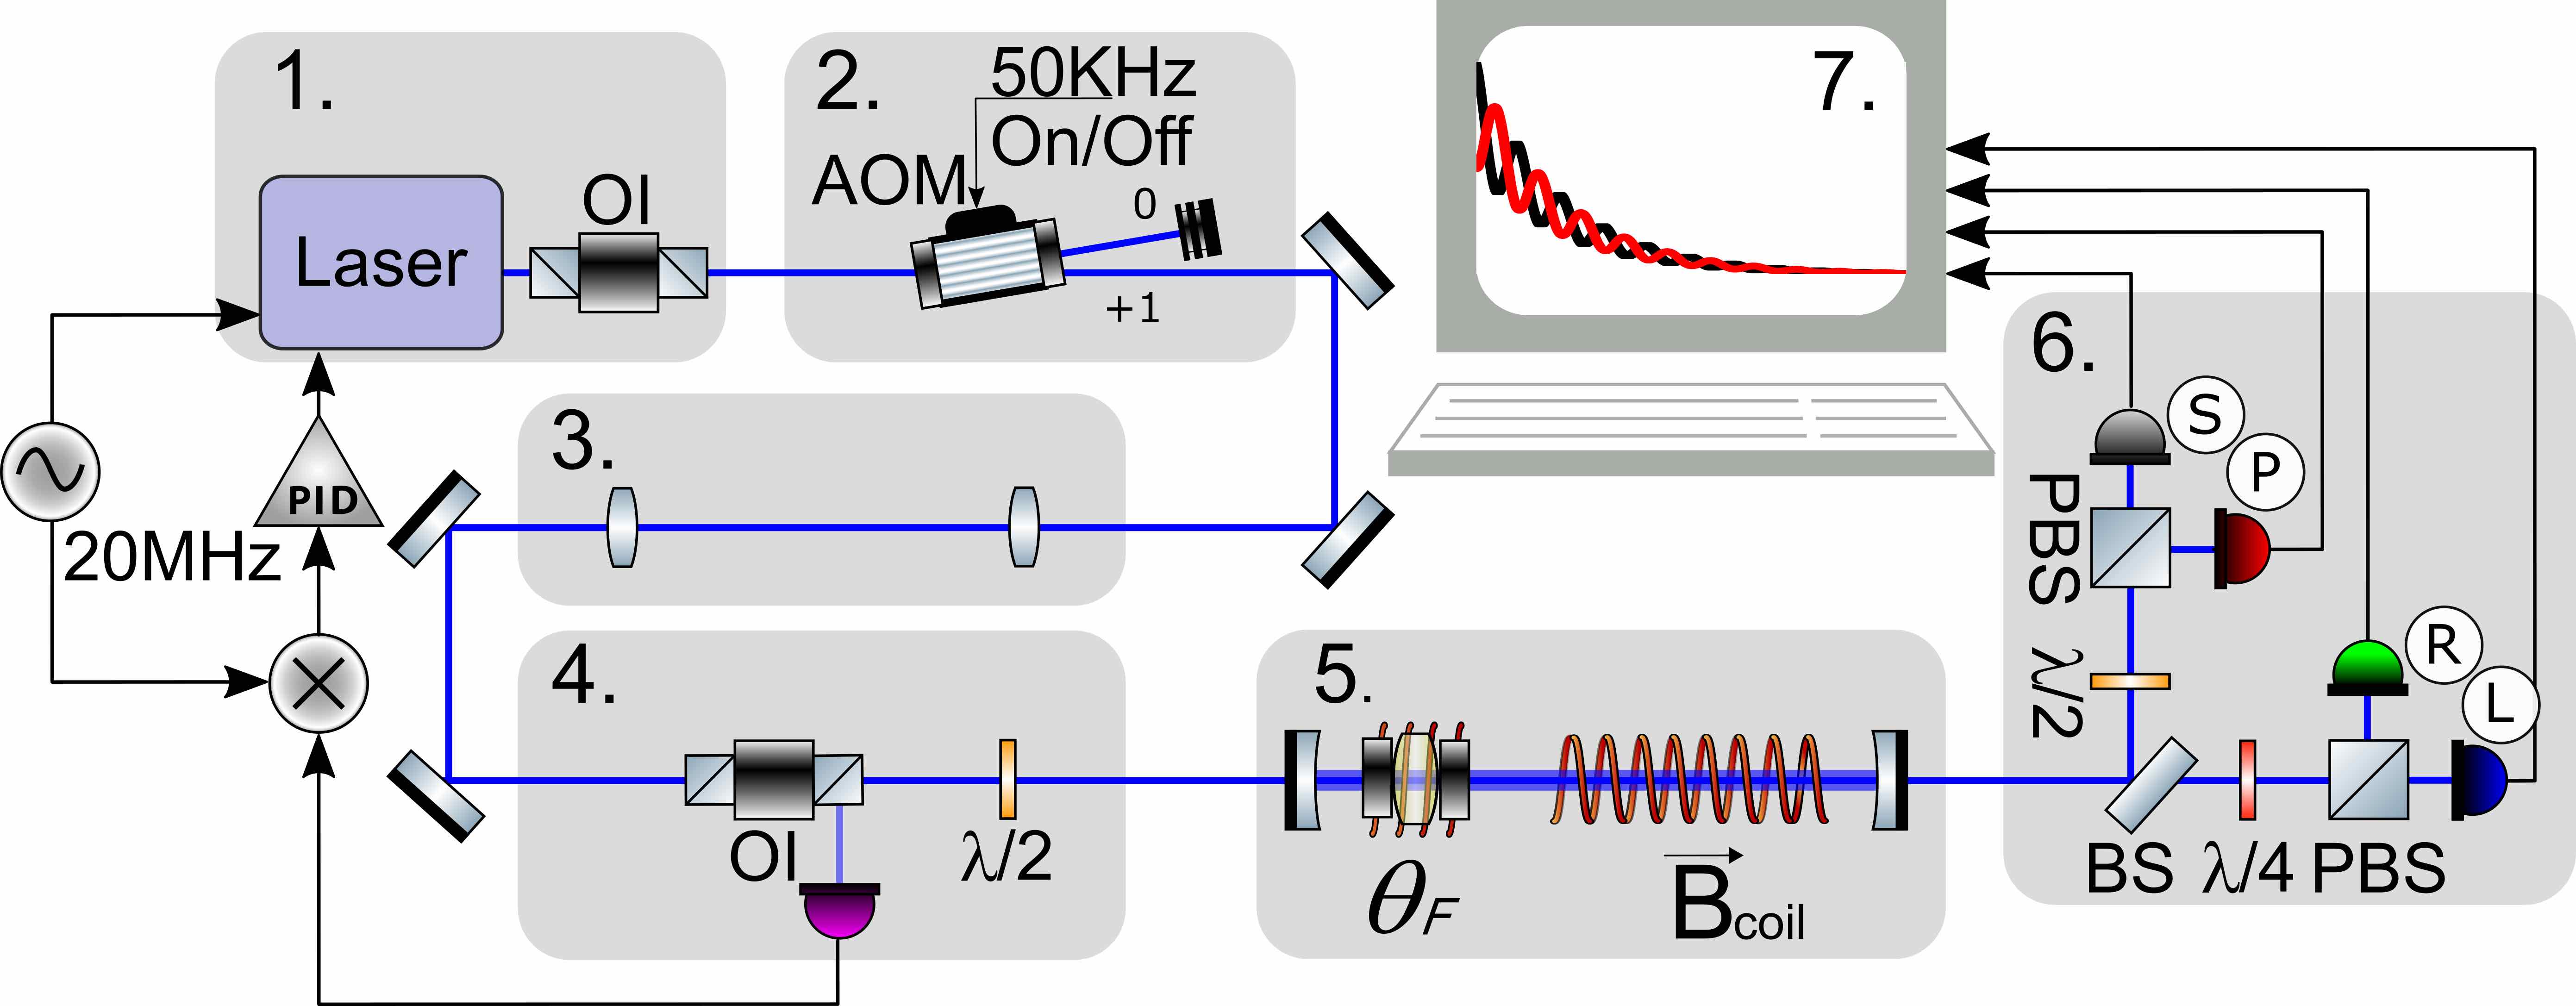
The laser source is an external cavity diode laser with a center wavelength of nm (Toptica DL-PRO), and we use a set of lenses to achieve spatial mode-matching of the laser beam to the fundamental transverse cavity mode. Our primary focus in this work is the study of non-resonant Faraday effects and, for this reason, we do not pre-stabilize the frequency of our laser to be resonant with a specific transition frequency. However, to establish a CW-CRDP protocol we lock the frequency of the laser to the cavity resonance using a Pound-Drever-Hall (PDH) scheme Black (2001). To prepare the polarization state of the input beam, and to collect the back-reflected one to a photodetector (Thorlabs, PDA10A-EC) for PDH-locking, we use an optical isolator that has side exit ports equipped with polarizing beam splitters (Thorlabs, IO-5-405-LP) followed by a half-wave plate. We generate the error signal using direct current modulation and a PDH module (Toptica, PDD 110). The error signal is then input to an analog PID controller (Toptica FALC 110) to provide a fast feedback to the laser-diode current, and to a second analog PID (SRS, SIM960) that creates a slower feedback that acts on the grating of the ECDL through a piezoactuator. The gain and bandwidths of the PID loops are different for low frequencies (10 Hz) to prevent accumulation of DC-offsets in the error signals that would otherwise prevent a stable lock. To initiate a ring-down event, we use an acousto-optic modulator (AOM; Gooch and Housego 3200-125) driven with a homebuilt AOM-driver, whose RF output can be controlled though a high-bandwidth switch. We analyze the light transmitted through the cavity using two balanced polarimeters: a linearly and a circularly sensitive one, which consist of a half-wave plate (Thorlabs, WPH10ME-405) followed by a Wollaston prism (Thorlabs, WP10), and a quarter-wave plate (Thorlabs, WPQ10ME-405) followed by a Wollaston prism, respectively. All wave-plates and prism are placed within rotation mounts. In each balanced polarimeter, we use short lenses ( mm) to focus the emerging radiation on separate silicon amplified photo-detectors (Thorlabs, PDA8A).
In Fig. 5 we show typical experimental CW-CRDP traces. With our optical setup and intracavity optics we can achieve ring-down times in the 0.7-1.5 s range, transmitted optical powers of approximately 20-100 W (we are primarily limited by the laser’s output power and the impedance mismatching between the reflectivity of the cavity mirrors and the intracavity losses), and with our feedback system and AOM electronics, we are able to generate CW-CRDP traces at repetition rates as high as 50 kHz.
III.2 Data acquisition and signal analysis
We record and digitize the ring-down traces (photo-detector signals) using two different acqusition modules: an oscilloscope (LeCroy, Wavesurfer 510), which has a maximum acquisition rate of approximately 200 Hz, an 8-bit resolution per channel, and permits on-board signal averaging; and a 14-bit digitizer (Teledyne, ADQ14DC-2X-PCIE, dual channel DC-coupled operation; sample rates of 2 GS/s per channel), which has a maximum acquisition rate of approximately 100 kHz (mainly limited by the data transfer rate), 14-bit resolution per channel, and permits on-board signal averaging. All collected data are transferred into a personal computer, and are processed by a custom Python program (SciPy 222https://www.scipy.org).
In this work we use time-domain analysis, based on nonlinear least-squares regression of the recorded time-traces, and all the data we present are the result of such an analysis. In particular, we record signals [] from both polarization channels (Fig. 4 & Fig. 5), and we fit the resulting CRDP-traces using the following model:
| (4) |
where is the amplitude of the trace, is the ring-down time, is the polarization beat frequency, represents a global phase offset, parameter takes into account any reduction in modulation depth, and is a global signal offset. With our acquisition systems and analysis process we can record and monitor in real-time the signal amplitude, ring-down time, frequency, and phase of both polarization channels independently. The subtraction of the signals, which yields a damped sinusoid, is performed through our computer-analysis software.
We wish to emphasize here that for CRDP-based portable spectropolarimetric instrumentations and, especially, experiments studying dynamics Sofikitis et al. (2015), online and fast, acquisition and analysis, are crucial. For the purposes of this work we focus on a post-processing time-domain analysis that allows us to thoroughly investigate the sensitivity limits of CW-CRDP experiments for total integration times ranging from a few ms to a few seconds. However, computational algorithms for time-domain analysis are typically slow (in our case we require 10-100 ms to fit a single trace) and might not be the appropriate methodology for rapid signal analysis (at time scales similar to a single ring-down event), particularly for spectropolarimetry where precision is the key criterion in choosing the appropriate analysis for CRDP techniques. A detailed investigation of the advantages and disadvantages of different signal analysis techniques, to the best of our knowledge, does not exist in the context of CRDP and we will address this in a follow-up work.
IV Results
As a proof-of-principle demonstration of the CW-CRDP technique we choose to study the non-resonant Faraday effect from a gaseous species, particularly butane. CW-CRDP relies on the implementation of a large intracavity bias anisotropy that assists in the measurement of the weak Faraday effect of butane (from studies in the literature we know that the expected Verdet constant of butane at 408 nm is approximately 30 nrad G-1 cm-1 bar-1, at 408 nm). For this reason, we start by investigating different optical materials that can allow for the generation of a large enough intracavity bias circular birefringence while having as low as possible absorption. We are interested in measurements at 408 nm where typical magneto-optic crystals are expected to have significant absorption losses ( cm-1). We focus our efforts on two optical elements, a SiO2 substrate and a CeF3 crystal, to investigate their magneto-optic response and the possibility of employing them for gas-phase measurements.
IV.1 SiO2 Faraday effect measurement
From studies available in the literature we find that the absorption coefficient for SiO2 is estimated to be cm-1 Kitamura, Pilon, and Jonasz (2007), while its Verdet constant is rad G-1 cm-1 Ramaseshan (1946); Ramaseshan and Sivaramakrishnan (1958), at 408 nm. Therefore, we expect that high quality SiO2 substrates and AR-coatings can allow for ultra high-finesse cavities, and the Verdet constant is large enough to allow for a sufficiently large - mode-splitting for applied magnetic fields of approximately a few kG (possible with the use of permanent magnets).
In Fig. 6 we present measurements of the (non-resonant) Faraday effect of a 6.35(1) mm thick, AR-coated SiO2 substrate (FiveNines Optics; AR coated by FiveNine Optics with specified R%), which is also the first demonstration of the CW-CRDP technique. To generate a large bias Faraday optical rotation we use permanent magnets (K&J Magnetics, Inc.) attached directly to the mount holder of the substrate. For measuring precisely the Verdet constant of the substrate we use an additional, homemade, solenoid [with a length of cm, and a diameter of cm], which we place around the SiO2 substrate. We calibrate the magnetic field of the solenoid using a Hall probe magnetometer (Hirst Magnetic Instruments GM05), and use a USB controlled digital-to-analog device (Labjack, U6) to drive the solenoid and scan the magnetic field it generates. The permanent magnets allows us to generate a large bias Faraday optical rotation, yielding a bias beat frequency of Hz, and using the smaller solenoid we are able to induce frequency shifts around this central beat frequency [Fig. 6 (a)]. For each magnetic field strength we collect 100 measurement points, each of which is the result of averaging 5000 CRDP traces corresponding to an integration time of 100 ms per measurement point. Using these, we obtain the resulting frequency shift [] as a function of magnetic field strength, which in turn yields the Faraday optical rotation for SiO2 [Fig. 6 (b)] that is directly proportional to the Verdet constant of the SiO2 substrate. Importantly, we observe in our measurements frequency drifts that can be associated with mechanical drifts, but our subtraction procedure removes these and allows us to observe a linear dependence of the measured optical rotation on the applied magnetic field. With this procedure, we measure the Verdet constant to be rad G-1 cm-1, at 408 nm, which is in accord with results available in the literature (Refs. Ramaseshan (1946); Ramaseshan and Sivaramakrishnan (1958)). The measurement error bars are derived through propagation of the errors ascribed to the measured polarization beat frequencies.
IV.2 CeF3 Faraday effect measurement
Garnet single crystals, such as yttrium-iron-garnet (YIG) and terbium-gallium-garnet (TGG), are magneto-optic materials typically used in Faraday rotators, due to their transparency in the visible and NIR optical ranges and their high Verdet-constant values. However, all these materials exhibit significant losses at wavelengths nm. Recent studies have reported on alternative materials suitable for Faraday rotators at near-UV optical wavelengths, such as CeF3 and PrF3 Shimamura et al. (2004); Molina et al. (2011). For CeF3, in particular, the absorption coefficient at 408 nm is predicted to be cm-1, and its Verdet constant is predicted to be approximately 390 rad G-1 cm-1 Molina et al. (2011). To verify these numbers and, therefore, investigate whether we can employ this crystal for inducing an intracavity bias anisotropy for CW-CRDP at 408 nm (and similar wavelengths), we use a 1.20(1) mm thick, AR-coated CeF3 crystal (E-Crystal Co., Ltd.; AR-coated by E-Crystal Co., Ltd. with specified R%).
In Fig. 7 we present measurements of the (non-resonant) Faraday effect of crystalline CeF3 as a function of magnetic field. Using the crystal, we observe ring-down times of approximately ns (compared to the attainable ring-down time of s for the empty cavity), which suggests overall losses of cm-1 at 408 nm. Although, these losses are the combined result of scattering losses from the AR-coatings and of material absorption, we attribute these to absorption. To measure precisely the material’s Verdet constant we follow a similar measurement approach as described above. A set of permanent magnets allows us to generate a large bias Faraday optical rotation frequency, yielding a bias beat frequency of Hz, and using the smaller solenoid we are able to induce frequency shifts around this central bias beating frequency. We measure the Verdet constant to be rad G-1 cm-1, at 408 nm. Our findings are in relative agreement with the results presented in Ref. Molina et al. (2011).
IV.3 Gaseous butane Faraday effect measurement
For the measurement of the Faraday effect in gaseous butane we induce an intracavity bias anisotropy with the SiO2 substrate (Fig. 6). We use a similar measurement procedure as described before and employ a homemade solenoid (40 cm) for the generation of adjustable magnetic fields (Fig. 4). We use an external power supply to control the current of the solenoid and a relay circuit to controllably switch the magnetic field on and off.
In Fig. 8 we present measurements of the (non-resonant) Faraday effect of butane (C4H) as a function of pressure. For each pressure, we perform approximately 10 magnetic field cycles, and for each magnetic field cycle we collect 100 measurement points, each of which is the result of averaging 5000 CRDP traces (corresponding to an integration time of 100 ms per measurement point). Using these, we obtain the frequency difference with respect to the bias Faraday beat frequency generated using a SiO2 substrate [, with Hz]. This process ensures that we remove any contribution to the signal originating from the permanent magnets used to create this large bias Faraday anisotropy. We verify the linear dependence between the observed Faraday optical rotation (per unit length) and butane’s vapor pressure, and we measure its Verdet constant to be nrad G-1 cm-1 bar-1, at 408 nm and 21 ∘C [Fig. 8 (b)]. Our measurements are in accord with results available in the literature (Refs. Ingersoll and Liebenberg (1954, 1956)).
V Sensitivity
V.1 Cramér-Rao Lower Bound: fundamental sensitivity limit in CRDP
The noise in any CRDP-based polarimetric measurement will contain contributions from both technical and intrinsic (fundamental) sources. For typical experimental setups, similar to the one we use for the measurements, technical noise sources are predominantly of mechanical and acoustic nature with non-white power noise spectral densities, and their associated frequency/phase drifts will effectively be the major limiting factor influencing high-sensitivity measurements. However, we wish to consider here the fundamental sensitivity of any CRDP scheme that is directly related to the measurement sensitivity of the polarization beat frequency. While we generally focus on time-domain analysis of the CRDP signals, nothing precludes us from using alternative analysis schemes, such as frequency-domain approaches. Notwithstanding, independent of which analysis methodology we choose, the fundamental limit for the statistical uncertainty of determining the beat frequency from a given CRDP trace will be given by the Cramér-Rao lower bound (CRLB) Ying-Xian Yao and Pandit (1995), which sets the lower limit on the variance of any frequency estimator. The CRLB condition for the frequency extracted from a discrete damped sinusoid - the CW-CRDP signal in our case as obtained from the balanced detection stage - is given by Ying-Xian Yao and Pandit (1995); Gemmel et al. (2010); Koch et al. (2015); Hunter et al. (2018),
| (5) |
where SNR is the measured signal-to-noise ratio, which is defined as the ratio between the signal amplitude and the standard deviation of the noise (effectively the electronic noise of the acquisition system); is the sampling-rate-limited bandwidth of the measurement; is the measurement time window; and is a corrective factor that takes into account the signal decay that is given by,
| (6) |
The factor in Eq. 5 is a compensation factor that penalizes measurement of the tails of the exponential decay when the signal has effectively died out. Importantly, Eq. 5 assumes that the period of the oscillation is much shorter than the decay constant of the envelope and that a sufficient number of oscillations occurs in the signal, without limiting the estimation accuracy. We emphasize here that Eq. 5 dictates that any noise sources affecting the experimental measurements are contributing to the fundamental CRLB limit through their effect on the SNR of the CRDP signal.
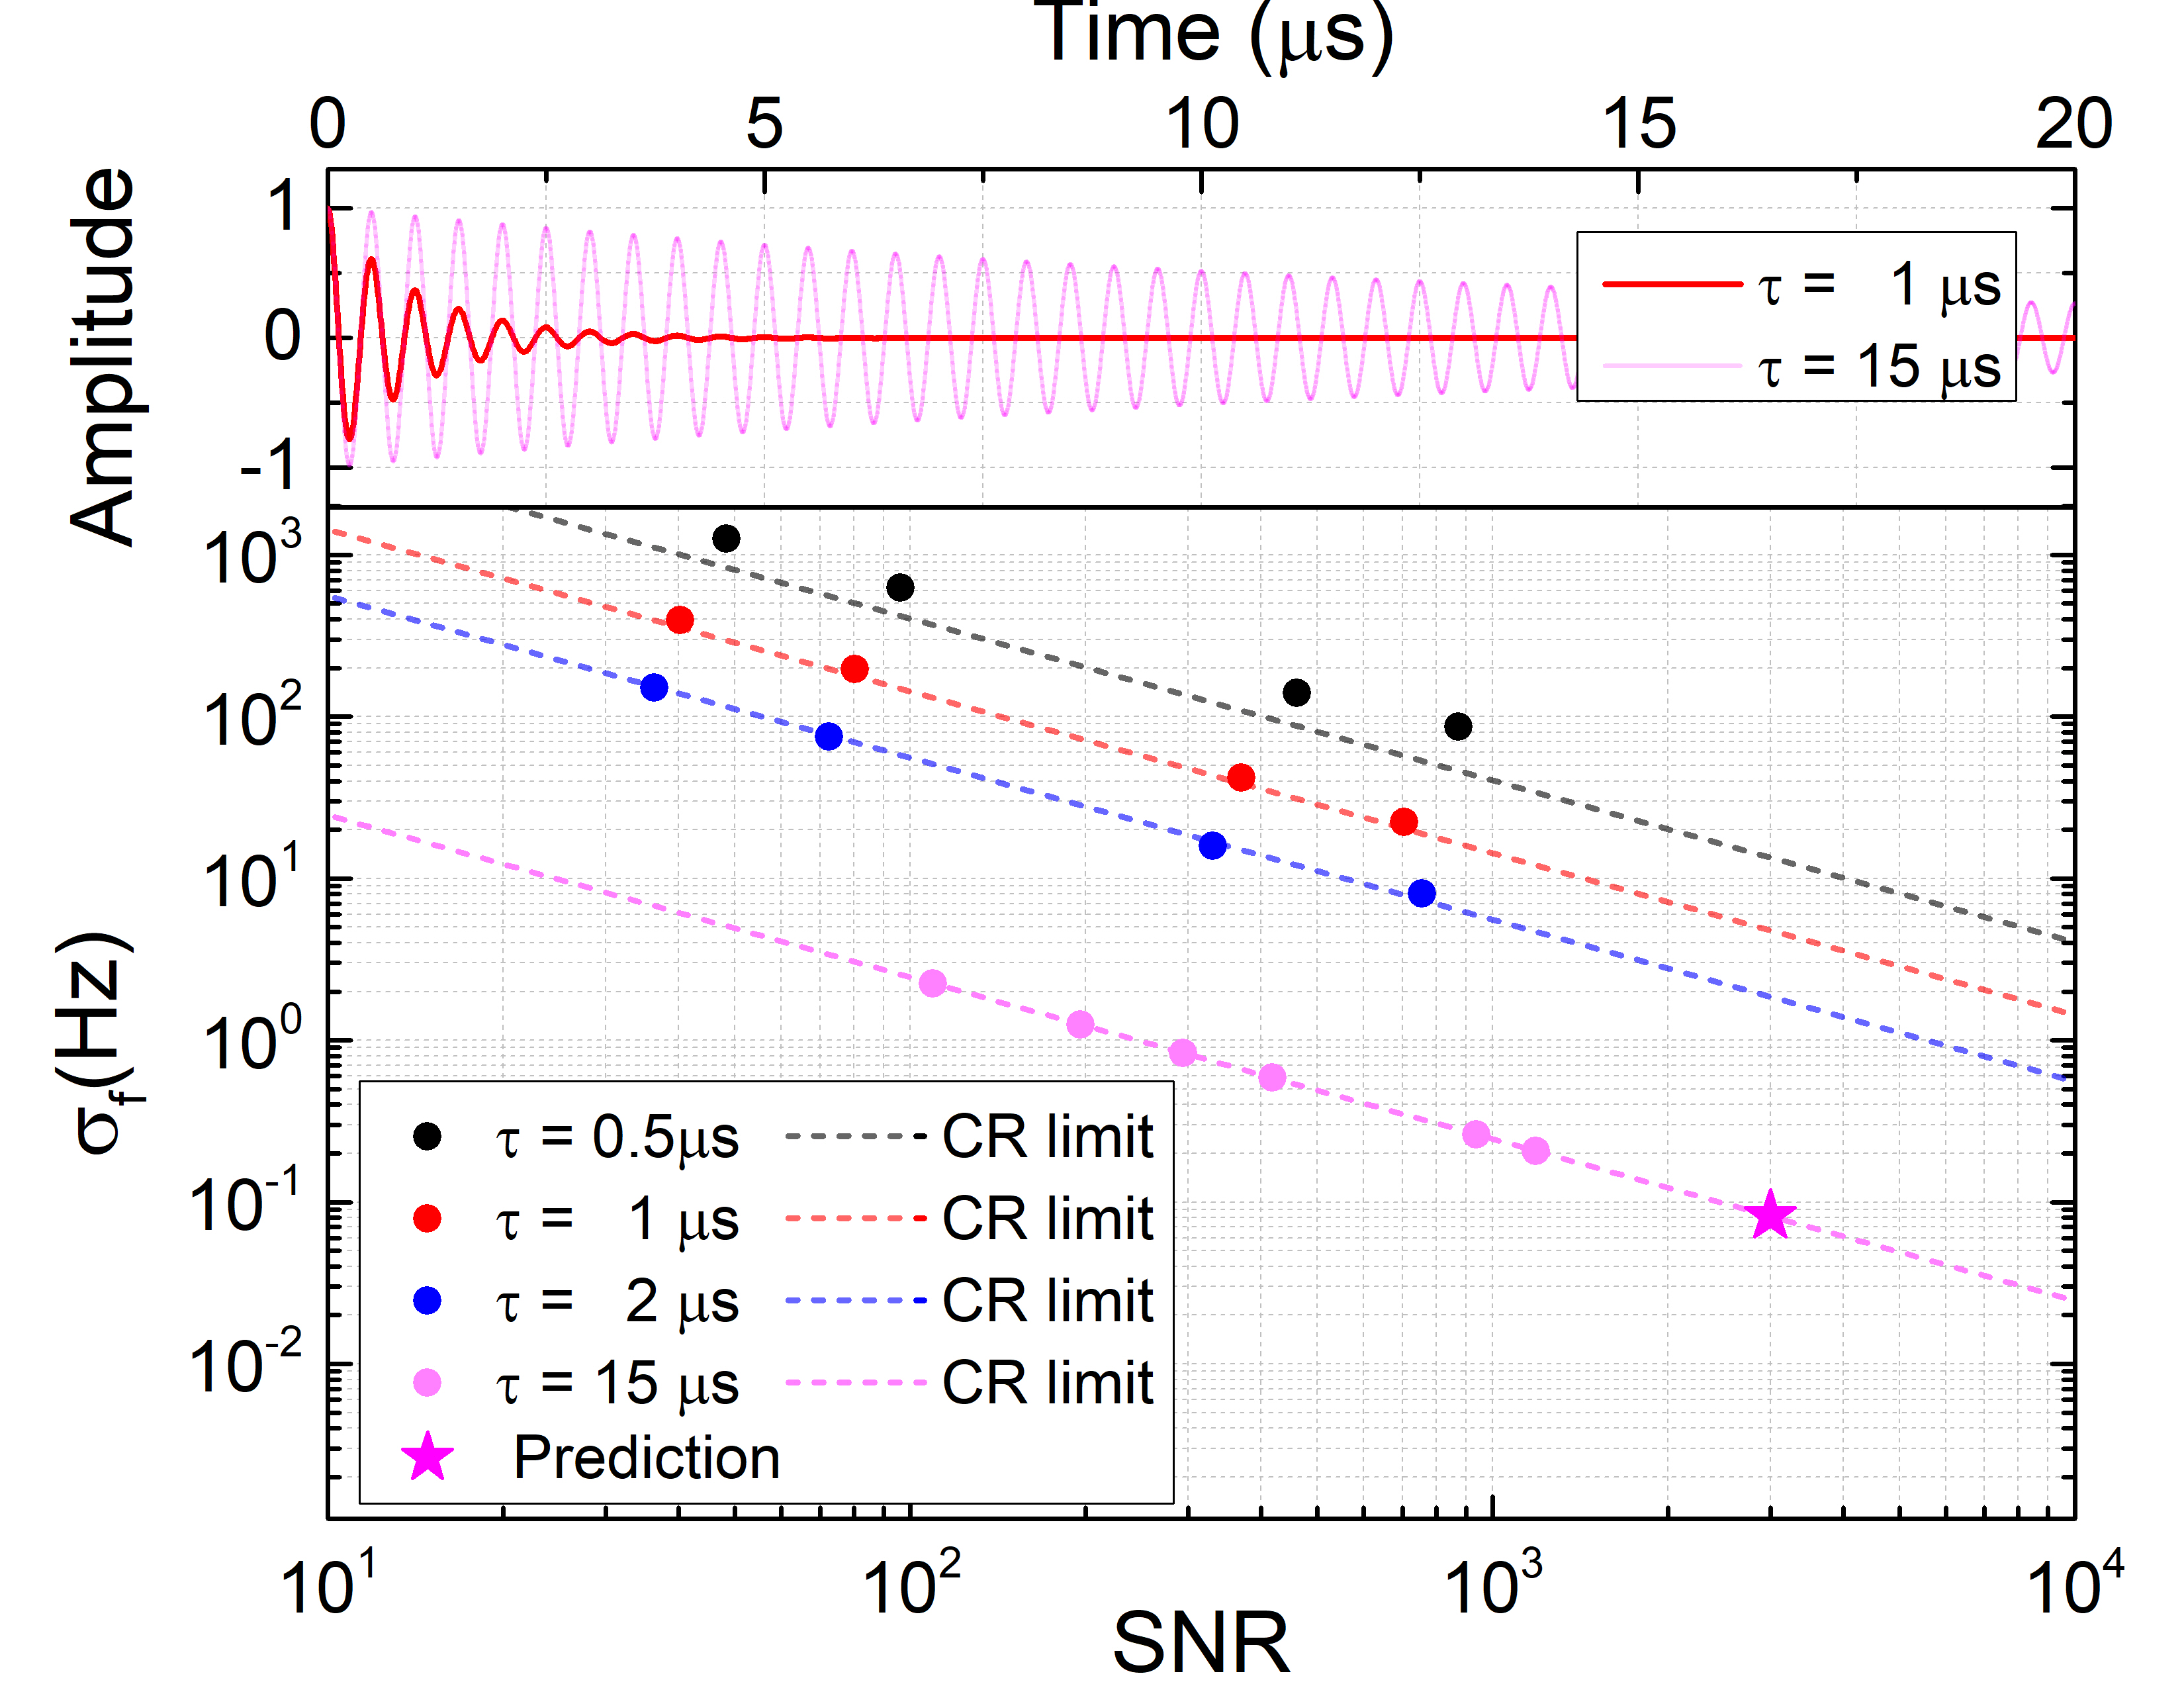
To test the validity of Eq. 5 as the appropriate estimator of the fundamental sensitivity for a frequency-based CRDP measurement, we use an arbitrary waveform generator (AWG; Tektronix AWG7122C, 10-bit resolution) to simulate CRDP signals and determine the sensitivity in measuring their beat frequency. In particular, we simulate CRDP signals with a constant beat frequency of 2 MHz and variable signal-to-noise ratios (SNR) and ring-down times. We use the 14-bit digitizer (Teledyne, ADQ14DC-2X-PCIE) to record (over a fixed time window of approximately ) and integrate AWG-generated CRDP traces, which are analyzed using a time-domain approach to obtain their amplitude, frequency and respective SNR. Although we vary the SNR of the simulated signals by the introduction of white gaussian noise through the AWG, we use the time domain analysis for the estimation of the SNR value we use in Eq. 5.
In Fig. 9 we show two special cases of the simulated CRDP traces together with the results of our analysis. We confirm that the frequency estimation errors coincide with the CRLB limit (Eq. 5) for a wide range of ring-down decay times and SNRs (for MHz). Most importantly, we simulate a CRDP trace with s, and confirm that the CRLB limit for a CRDP frequency measurement of such a trace with an SNR=3000 to be at the sub-Hz levels, corresponding to sub-ppm fractional uncertainties (i.e. a mHz uncertainty on a measurement of a 2 MHz beating frequency). We also verify that for CRDP signals with short ring-down times, e.g. 0.5 s, where one observes only a limited number of oscillations within the whole acquisition window of the ring-down signal, the results start to deviate from the CRLB limit.
Equation 5 sets the frequency detection limit and, therefore, the CRLB-related optical rotation sensitivity limit, , is equal to,
| (7) |
Thus, the CRLB limit can used as a guide for designing CW-CRDP experiments (i.e. choosing the appropriate finesse, the strength of intracavity anisotropy, the electronics and acquisition system), for a particular polarimetric application.
V.2 CW-CRDP experimental sensitivity limits
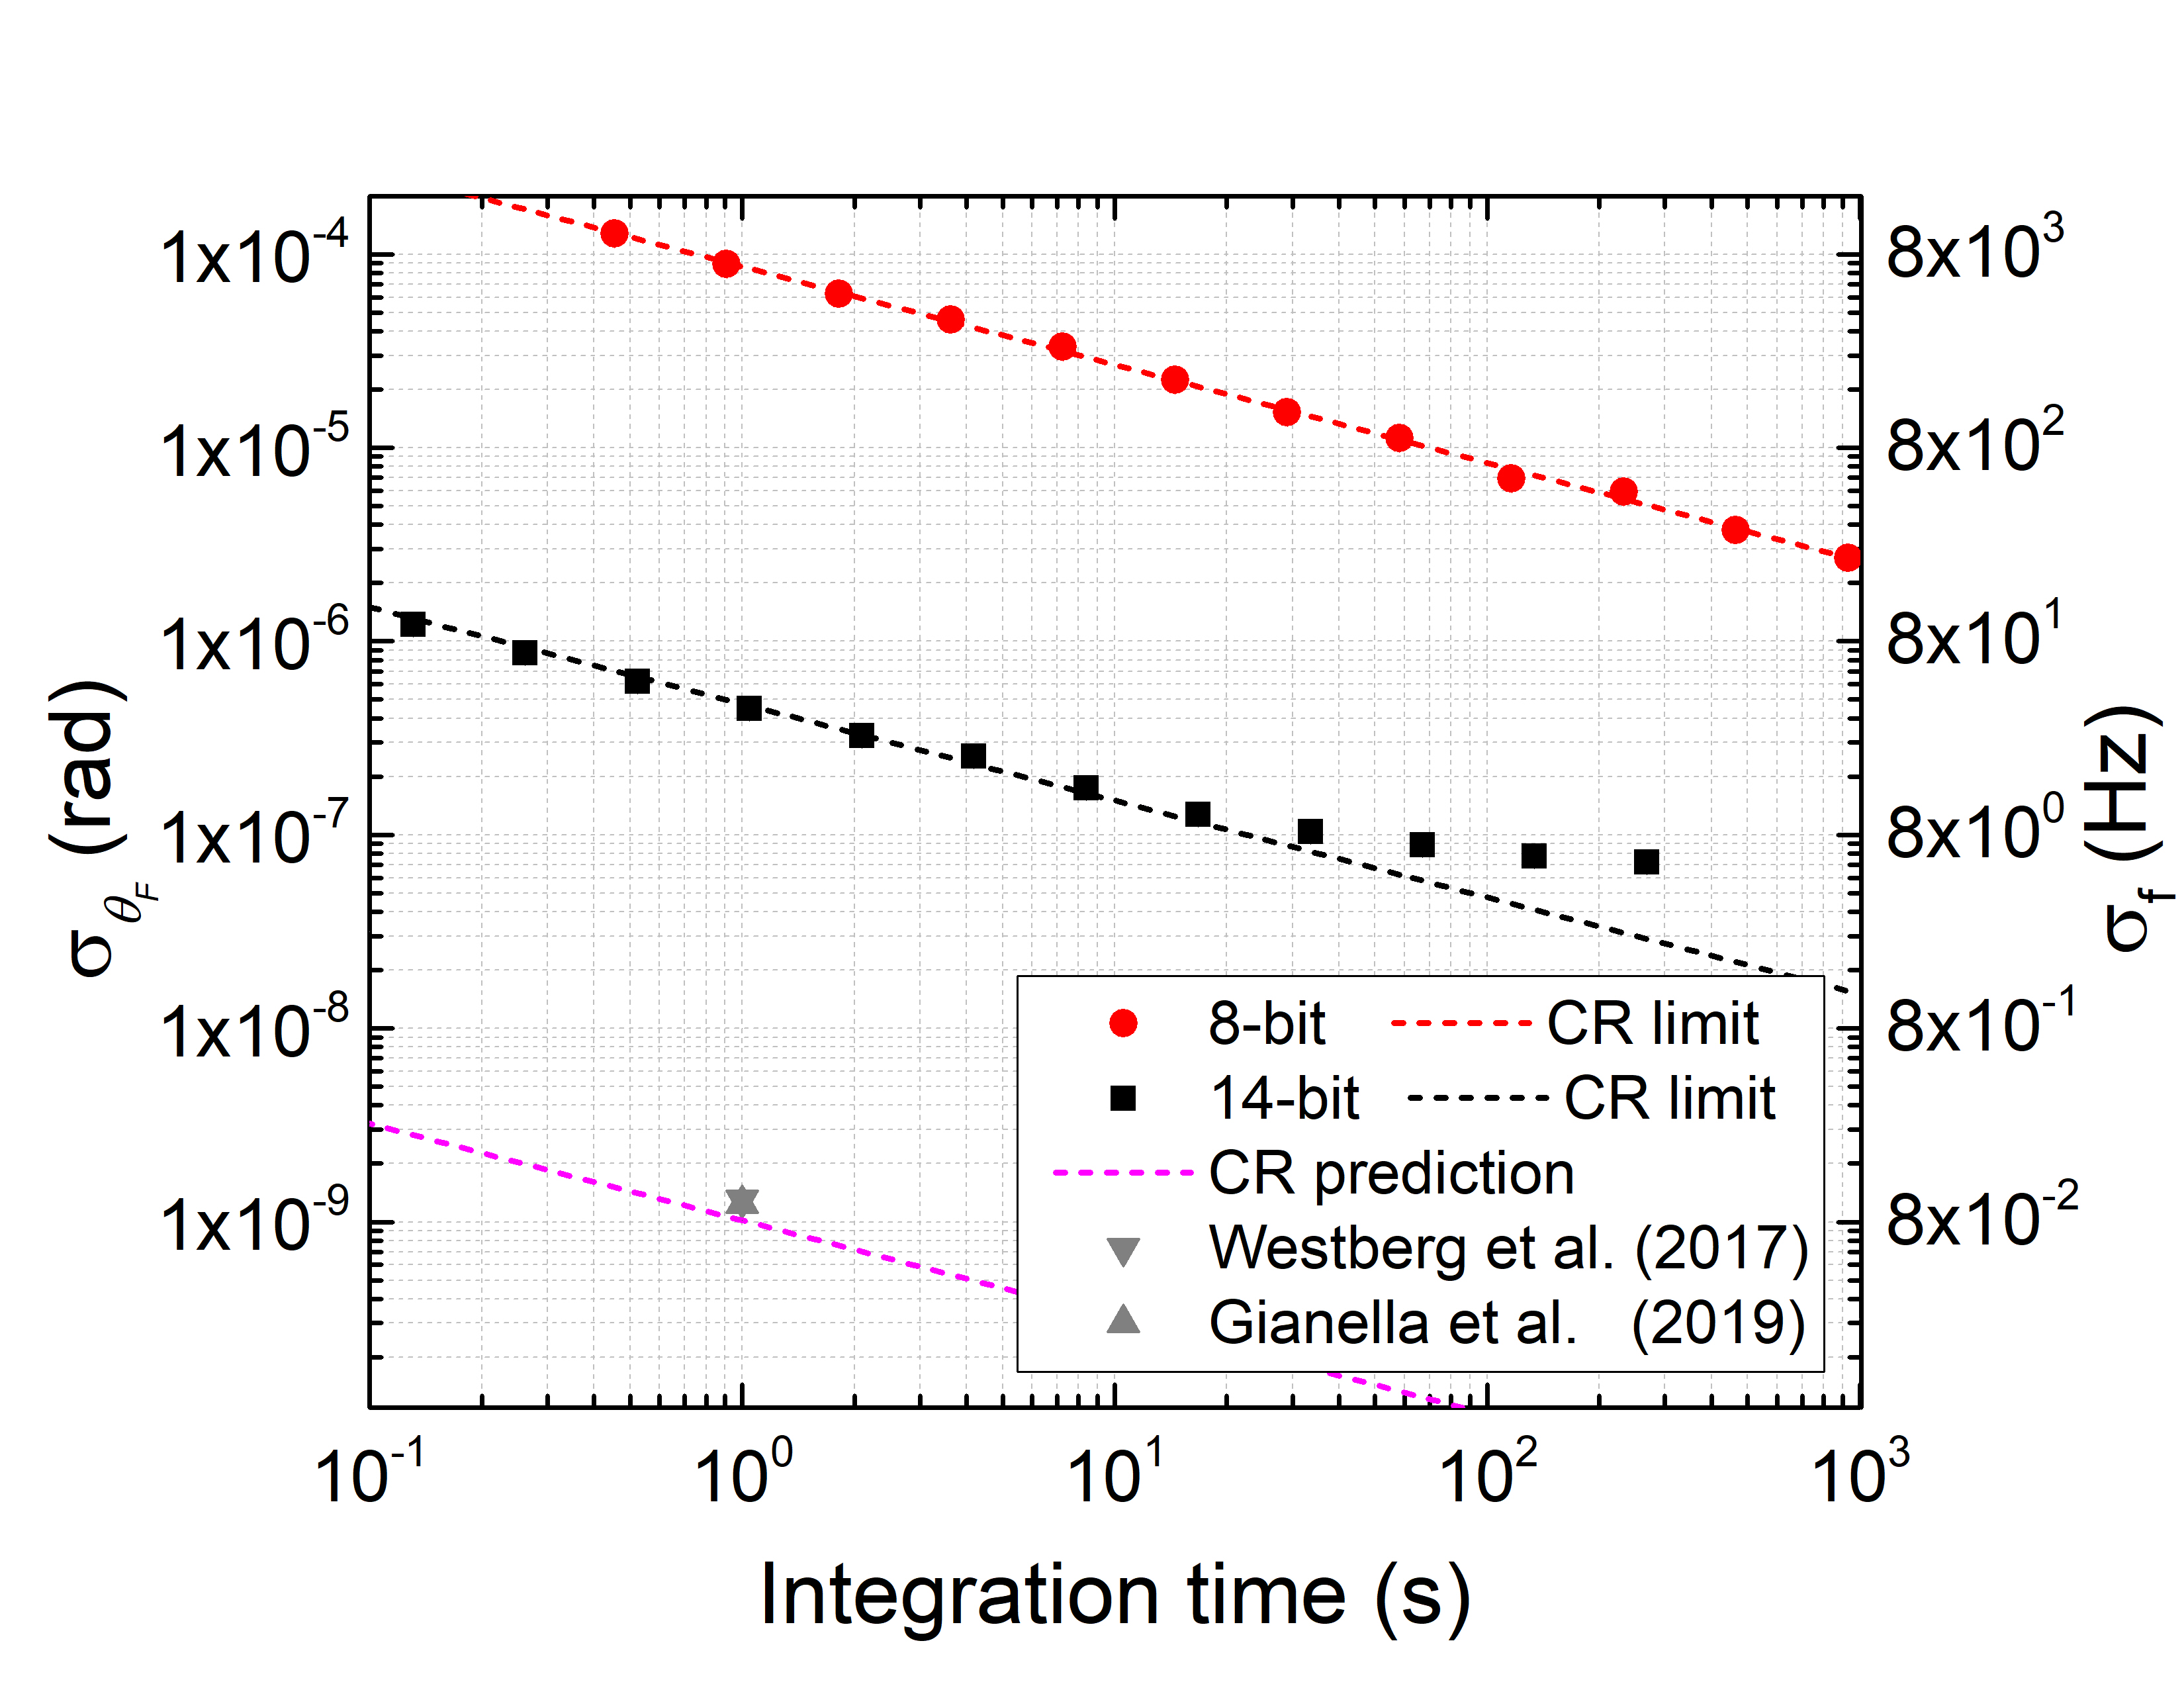
We proceed by analysing the sensitivity and stability of the experimental apparatus using an Allan-variance methodology, which allows us to study the temporal characteristics of the frequency measurements. In Fig. 10 we present an Allan plot of CW-CRDP measurements of the polarization beat frequency induced by the Faraday effect in the SiO2 substrate under the influence of a constant magnetic field (induced by a set of permanent magnets). We use two separate acquisition systems of different resolution and sampling rates to acquire and integrate CW-CRDP signals for over 1000 s, which enables us to examine the stability of our apparatus and the validity of the CRLB limit for the different acquisition conditions. Using time-domain analysis (Sec. III B), we estimate the uncertainty in our frequency measurements over a specific integration time. Using the high (14-bit) resolution acquisition system, we observe that our system exhibits a white-noise like behaviour with a slope of approximately , which corresponds to polarimetric sensitivities of approximately per round-trip (the cavity’s finesse is 1200), and this behaviour holds for integration times of up to 30 s, where drifts associated with our frequency stabilization system do not allow for further sensitivity improvements. Using the low (8-bit) resolution acquisition system we are unable to observe these drifts that fundamentally limit our measurements due to the low signal resolution, and, thus, sensitivity. However, for both acquisition conditions, we observe that our experimental results are in agreement with Eq. 5 (particularly, using the high resolution acquisition system we achieve a SNR within 1 s of integration time for repetition rates of 50 kHz). We note here that while our sampling bandwidth is 500 MHz (i.e. in Eq. 5), our photodetectors have a bandwidth of 50 MHz, and, therefore, consecutive sampling points are not statistically independent. However, this affects the attainable SNR from the time-domain analysis Huang and Lehmann (2013), as supported by our agreement with the CRLB prediction. As a comparison, we note here that pulsed-CRDP techniques have achieved polarimetric sensitivities at the rad levels for several minutes of integration time using optical cavities of similar finesse as the one we use here Müller et al. (2002); Sofikitis et al. (2014), clearly demonstrating the benefits of employing CW-laser sources. In addition, using our experimental conditions, we predict the photon shot-noise limit for our CRD-based polarimetric measurements to be per round-trip (for these measurements we collect approximately 20 W of optical power, and estimate this limit using the total number of photons available from all ring-down events within 1 s) Huang and Lehmann (2013).
To demonstrate the merits of CW-CRDP, in Fig. 10 we include for comparison the reported polarimetric sensitivities of two recent state-of-the-art PD-CRDS-related works. In particular, Westberg and Wysocki Westberg and Wysocki (2017) using an optical cavity with demonstrated Faraday optical rotation sensitivities of rad/ (per cavity round-trip, for 1 s of integration time), at 762 nm. Similarly, Gianella et al. Gianella et al. (2019) using an optical cavity with , demonstrated almost identical Faraday optical rotation sensitivities of rad/ (per cavity round-trip, for 1 s of integration time), at 1506 nm. Using our analysis on the fundamental frequency sensitivity limits of CRDP (“Prediction” point in Fig. 9), we predict that a CW-CRDP experiment realized using a 0.60 m long two-mirror optical cavity with , resulting in ring-down times of 15 s, and which yields signals with an SNR of 3000 within 1 s of integration time (we assume here only white noise), one can achieve Faraday optical rotation sensitivities of rad/ (we assume here a sampling-rate-limited bandwidth of 500 MHz). Therefore, one can achieve similar state-of-the-art sensitivities with a CW-CRDP polarimetric approach using cavities of significantly lower finesse, opening the possibility for highly sensitive polarimetry to spectral regimes where high quality optics might not be available and/or material losses can be higher. Finally, it is important to emphasize that for our prediction, where we consider a reasonably attainable SNR for 1 s of integration time, we do not consider the case of correlated noise cancellations as a result of the balanced detection scheme Westberg and Wysocki (2017); Gianella et al. (2019) or possible SNR improvements that arise from the application of rapid signal reversals Sofikitis et al. (2014); Bougas et al. (2015); Hayden et al. (2018). Moreover, the experimental parameters we choose for our prediction can be realized by several improvements in our current experimental setup (by improving the cavity finesse, increasing the transmitted optical power, using low-noise photodetectors, and improving our frequency-locking system), but these correspond to one set of possible parameters that can be selected to optimize the CRLB (Eq. 5) and yield state-of-the-art polarimetric sensitivities.
V.3 Alternative modalities for CW-CRDP
In the theory section (Sec. II) we discuss the principles of CW-CRDP for the case of a CW laser source with a linewidth that is significantly smaller than that of the optical cavity and of an intracavity anisotropy that results in a substantial overlap between the - cavity modes. Under these conditions we show how the incident radiation can couple into and build-up within that cavity by exciting only one particular cavity polarization eigenmode at a time, and how this in turn defines the amplitude, phase, and modulation depth of the resulting CW-CRDP signals. From Fig. 3 we see that these parameters can change significantly as a function of laser detuning with respect to the - mode splitting, and for this reason a robust frequency stabilization scheme is required to ensure minimal frequency deviations that result in signal phase and signal fluctuations, which in turn hinder the sensitivity of a CW-CRDP measurement. Furthermore, the signal parameters also depend on the strength of the intracavity anisotropy (e.g. ) and on the cavity linewidth; if the strength of the intracavity anisotropy is large enough to result in mode splittings larger than a few cavity linewidths (or, equivalently, if the cavity finesse is high enough to result in a narrow cavity linewidth), substantial mode overlap is not possible and, thus, CW-CRDP measurements are unrealistic using a narrow-linewidth laser source.
A possible solution towards highly sensitive CW-CRDP instrumentation that does not require complicated electronics and resolves the above-mentioned issues, is to use a single-frequency laser with a linewidth that is significantly broader than that of the cavity - mode-splitting. In this case, the incident radiation excites both modes coherently and the frequency-stabilization scheme can be replaced by an intensity threshold comparator-circuit that switches off the laser radiation once a transmission threshold is recorded, similarly to what has been done in CW-CRDS demonstrations Romanini et al. (1997). For example, for optical cavities as the one we present here and similar polarization mode-splittings of the order of 1-2 MHz, the laser light linewidth should be at least an order of magnitude larger (i.e. 10-20 MHz). Most importantly, using this approach one is not anymore limited by the finesse of the cavity and the desired mode-splitting can be significantly larger than the cavity linewidth, contrary to the case of a CW laser source with a narrow linewidth for which one must generate a mode-splitting of the order of the cavity linewidth for optimal mode coupling. Free-running diode and distributed-feedback lasers typically have linewidths of 5 MHz, while the design approach for commercially available external cavity diode lasers is to reduce the diode-laser linewidth as much as possible (with current linewidths at the sub-100 kHz range). A direct method to achieve the desired broad linewidth is to broaden the linewidth of the laser source in a controllable fashion by, e.g., modulating the laser current using white noise with high bandwidth. This method is, in principle, applicable with both diode and distributed-feedback lasers (however, diode-based lasers might face the problem of mode fragmentation due to the noise modulation). There exist several additional modulation approaches that are suitable for CW-CRDP, such as the case of modulating the laser current at the frequency of the mode-splitting, and we will explore these in future works. However, we consider the approach of broadening the linewidth of the laser source to be larger than the mode-splitting, as the most suitable one for portable spectropolarimetric instrumentations.
An alternative option is to implement an optical-feedback technique, whereby the circulating wave within the cavity is allowed to return to the laser source to injection-seed it, inducing, thus, a direct frequency-locking without the need for the generation of an error signal and the associated feedback electronics. This is the principle behind optical feedback cavity-enhanced absorption spectroscopy (OF-CEAS) Morville et al. (2005), which has already been employed in CRD-based spectroscopic Burkart, Romanini, and Kassi (2014) and polarimetric Gianella et al. (2017) measurements. In this case, the linewidth and central frequency of the laser source are effectively matched and (phase-)stabilised to that of the cavity, respectively, allowing for optimal injection and the reduction of phase-fluctuations related to frequency drifts of either the laser or the cavity.
VI Conclusions
In this paper, we present the general principles of CW-CRDP, a CRD-based polarimetric scheme that employs CW laser sources and benefits from the use of large intracavity polarization anisotropies for highly sensitive polarimetric measurements. Contrary to PD-CRDS polarimetric approaches that are effectively intensity-based measurement schemes (since these monitor changes in the ring-down decay time), CRDP schemes are frequency-based measurements where sensitive detection of shifts in their induced polarization beat frequency enables highly sensitive polarimetric measurements. CW-CRDP builds upon the measurement methodologies that have been developed within the context of chiral pulsed-CRDP Müller, Wiberg, and Vaccaro (2000); Sofikitis et al. (2014); Bougas et al. (2015), and we show how the use of CW laser sources allows for significant gains in signal intensity and data acquisition rates, enabling shot-noise limited measurements that are not easily attainable using pulsed laser sources. Furthermore, we discuss in depth the fundamental limits of CRDP protocols, and demonstrate how CW-CRDP instruments can perform highly sensitive measurements even with the use of optical cavities with modest finesse. We confirm the principles and merits of CW-CRDP by measuring non-resonant Faraday optical rotations from solid and gaseous samples using a prototype design.
In conclusion, CW-CRDP is a powerful and versatile technique suitable for the measurement of reciprocal and non-reciprocal birefringence and dichroism, linear and circular. We believe that CW-CRDP is the ideal modality for portable spectropolarimetric instrumentations as it allows for time-resolved, highly sensitive, and cost-effective operation at a broad spectral region. Future work will focus on improvements in system design and sensitivity, and on the possibility of coupling CW-CRDP with chromatographic techniques, towards the development of a portable instrument suitable for breath analysis and monitoring in clinical settings Wang et al. (2015); Henderson et al. (2018), and for trace gas analysis and monitoring of paramagnetic species in field settings Hayden et al. (2018).
VII Acknowledgments
This work was supported by the European Commission Horizon 2020, ULTRA-CHIRAL project (grant no. FETOPEN-737071), and by the European Union’s Seventh Framework Programme for Research, Technological Development, and Demonstration, under the project ERA.Net RUS Plus, grant agreement no.189 (EPOCHSE). L.B. is grateful to E. G. Víllora and her colleagues for the help and support in obtaining the CeF3 crystal, and specially thanks Geoffrey Iwata and Kevin Morby for insightful discussions.
Data Availability Statement
The data that support the findings of this study are available from the corresponding author upon reasonable request.
References
- Eliel and Wilen (2008) E. L. Eliel and S. Wilen, Stereochemistry of Organic Compounds (Wiley, 2008).
- Kelly, Jess, and Price (2005) S. M. Kelly, T. J. Jess, and N. C. Price, Biochim. Biophys. Acta 1751, 119 (2005).
- Fortson and Lewis (1984) E. Fortson and L. Lewis, Physics Reports 113, 289 (1984).
- Budker and Jackson K. (2013) D. Budker and D. Jackson K., Optical Magnetometry (Cambridge University Press, 2013).
- Busch and Busch (2006) K. W. Busch and M. A. Busch, Chiral Analysis (Elsevier, 2006).
- Argentine, Owens, and Olsen (2007) M. D. Argentine, P. K. Owens, and B. A. Olsen, Advanced Drug Delivery Reviews 59, 12 (2007), pharmaceutical Impurities: Analytical, Toxicological and Regulatory Perspectives.
- Budker, Kimball, and DeMille (2008) D. Budker, D. F. Kimball, and D. P. DeMille, Atomic physics : an exploration through problems and solutions, 2nd ed. (Oxford University Press, 2008).
- Li et al. (2011) S. Li, P. Vachaspati, D. Sheng, N. Dural, and M. V. Romalis, Phys. Rev. A 84, 061403 (2011).
- Tuzson et al. (2013) B. Tuzson, M. Mangold, H. Looser, A. Manninen, and L. Emmenegger, Opt. Lett. 38, 257 (2013).
- White (1942) J. U. White, J. Opt. Soc. Am. 32, 285 (1942).
- Herriott, Kogelnik, and Kompfner (1964) D. Herriott, H. Kogelnik, and R. Kompfner, Appl. Opt. 3, 523 (1964).
- Das and Wilson (2011) D. Das and A. C. Wilson, Applied Physics B 103, 749 (2011).
- Krzempek et al. (2013) K. Krzempek, M. Jahjah, R. Lewicki, P. Stefański, S. So, D. Thomazy, and F. K. Tittel, Applied Physics B 112, 461 (2013).
- Barron (2004) L. D. Barron, Molecular Light Scattering and Optical Activity, 2nd ed. (Cambridge University Press, 2004).
- Müller, Wiberg, and Vaccaro (2000) T. Müller, K. B. Wiberg, and P. H. Vaccaro, The Journal of Physical Chemistry A 104, 5959 (2000).
- Bougas et al. (2012) L. Bougas, G. E. Katsoprinakis, W. von Klitzing, J. Sapirstein, and T. P. Rakitzis, Phys. Rev. Lett. 108, 210801 (2012).
- Durand, Morville, and Romanini (2010) M. Durand, J. Morville, and D. Romanini, Phys. Rev. A 82, 031803 (2010).
- Gianella et al. (2017) M. Gianella, T. H. P. Pinto, X. Wu, and G. A. D. Ritchie, The Journal of Chemical Physics 147, 054201 (2017).
- Hall, Ye, and Ma (2000) J. L. Hall, J. Ye, and L.-S. Ma, Phys. Rev. A 62, 013815 (2000).
- Bailly, Thon, and Robilliard (2010) G. Bailly, R. Thon, and C. Robilliard, Review of Scientific Instruments 81, 033105 (2010).
- Wheeler et al. (1998) M. D. Wheeler, S. M. Newman, A. J. Orr-Ewing, and M. N. R. Ashfold, J. Chem. Soc., Faraday Trans. 94, 337 (1998).
- Berden and Engeln (2009) G. Berden and R. Engeln, Cavity Ring-Down Spectroscopy: Techniques and Applications (Wiley, 2009).
- Engeln et al. (1997) R. Engeln, G. Berden, E. van den Berg, and G. Meijer, The Journal of Chemical Physics 107, 4458 (1997).
- Engeln et al. (1998) R. Engeln, G. Berden, R. Peeters, and G. Meijer, Review of Scientific Instruments 69, 3763 (1998), https://doi.org/10.1063/1.1149176 .
- Lee et al. (2000) J. Y. Lee, H.-W. Lee, J. W. Kim, Y. S. Yoo, and J. W. Hahn, Appl. Opt. 39, 1941 (2000).
- Huang and Lehmann (2008) H. Huang and K. K. Lehmann, Appl. Opt. 47, 3817 (2008).
- Dupré (2015) P. Dupré, Phys. Rev. A 92, 053817 (2015).
- Fleisher et al. (2016) A. J. Fleisher, D. A. Long, Q. Liu, and J. T. Hodges, Phys. Rev. A 93, 013833 (2016).
- Berden et al. (1998) G. Berden, R. Engeln, P. C. M. Christianen, J. C. Maan, and G. Meijer, Phys. Rev. A 58, 3114 (1998).
- Hayden et al. (2018) J. Hayden, J. Westberg, C. L. Patrick, B. Lendl, and G. Wysocki, Opt. Lett. 43, 5046 (2018).
- Patrick, Westberg, and Wysocki (2019) C. L. Patrick, J. Westberg, and G. Wysocki, Analytical Chemistry 91, 1696 (2019).
- Gianella et al. (2019) M. Gianella, S. A. Press, K. M. Manfred, H. C. Norman, M. Islam, and G. A. D. Ritchie, The Journal of Chemical Physics 151, 124202 (2019).
- Gianella et al. (2018) M. Gianella, S. Reuter, S. A. Press, A. Schmidt-Bleker, J. H. van Helden, and G. A. D. Ritchie, Plasma Sources Science and Technology 27, 095013 (2018).
- Müller et al. (2002) T. Müller, K. B. Wiberg, P. H. Vaccaro, J. R. Cheeseman, and M. J. Frisch, J. Opt. Soc. Am. B 19, 125 (2002).
- Sofikitis et al. (2014) D. Sofikitis, L. Bougas, G. E. Katsoprinakis, A. K. Spiliotis, B. Loppinet, and T. P. Rakitzis, Nature 514, 76 (2014).
- Bougas et al. (2015) L. Bougas, D. Sofikitis, G. E. Katsoprinakis, A. K. Spiliotis, P. Tzallas, B. Loppinet, and T. P. Rakitzis, The Journal of Chemical Physics 143, 104202 (2015).
- Romanini et al. (1997) D. Romanini, A. Kachanov, N. Sadeghi, and F. Stoeckel, Chemical Physics Letters 264, 316 (1997).
- Note (1) Los Gatos Research, http://www.lgrinc.com; Picarro, https://www.picarro.com.
- Nilsson, Gustafson, and Byer (1989) A. C. Nilsson, E. K. Gustafson, and R. L. Byer, IEEE Journal of Quantum Electronics 25, 767 (1989).
- Vallet et al. (1999) M. Vallet, F. Bretenaker, A. L. Floch, R. L. Naour, and M. Oger, Optics Communications 168, 423 (1999).
- Bougas et al. (2014) L. Bougas, G. E. Katsoprinakis, W. von Klitzing, and T. P. Rakitzis, Phys. Rev. A 89, 052127 (2014).
- Budker et al. (2002) D. Budker, W. Gawlik, D. F. Kimball, S. M. Rochester, V. V. Yashchuk, and A. Weis, Rev. Mod. Phys. 74, 1153 (2002).
- Sofikitis et al. (2018) D. Sofikitis, G. E. Katsoprinakis, A. K. Spiliotis, and T. P. Rakitzis, in Chiral Analysis (Second Edition), edited by P. L. Polavarapu (Elsevier, 2018) second edition ed., pp. 649 – 678.
- Black (2001) E. D. Black, American Journal of Physics 69, 79 (2001).
- Note (2) Https://www.scipy.org.
- Sofikitis et al. (2015) D. Sofikitis, A. K. Spiliotis, K. Stamataki, G. E. Katsoprinakis, L. Bougas, P. C. Samartzis, B. Loppinet, T. P. Rakitzis, M. Surligas, and S. Papadakis, Appl. Opt. 54, 5861 (2015).
- Kitamura, Pilon, and Jonasz (2007) R. Kitamura, L. Pilon, and M. Jonasz, Appl. Opt. 46, 8118 (2007).
- Ramaseshan (1946) S. Ramaseshan, Proceedings Mathematical Sciences 24, 426 (1946).
- Ramaseshan and Sivaramakrishnan (1958) S. Ramaseshan and V. Sivaramakrishnan, Faraday effect in diamagnetic crystals, Vol. 1 (Interscience, New York, 1958).
- Shimamura et al. (2004) K. Shimamura, E. G. Vı́llora, S. Nakakita, M. Nikl, and N. Ichinose, Journal of Crystal Growth 264, 208 (2004).
- Molina et al. (2011) P. Molina, V. Vasyliev, E. G. Víllora, and K. Shimamura, Opt. Express 19, 11786 (2011).
- Ingersoll and Liebenberg (1954) L. Ingersoll and D. Liebenberg, JOSA 44, 566 (1954).
- Ingersoll and Liebenberg (1956) L. R. Ingersoll and D. H. Liebenberg, J. Opt. Soc. Am. 46, 538 (1956).
- Ying-Xian Yao and Pandit (1995) Ying-Xian Yao and S. M. Pandit, IEEE Transactions on Signal Processing 43, 878 (1995).
- Gemmel et al. (2010) C. Gemmel, W. Heil, S. Karpuk, K. Lenz, C. Ludwig, Y. Sobolev, K. Tullney, M. Burghoff, W. Kilian, S. Knappe-Grüneberg, W. Müller, A. Schnabel, F. Seifert, L. Trahms, and S. Baeßler, The European Physical Journal D 57, 303 (2010).
- Koch et al. (2015) H.-C. Koch, G. Bison, Z. D. Grujić, W. Heil, M. Kasprzak, P. Knowles, A. Kraft, A. Pazgalev, A. Schnabel, J. Voigt, and A. Weis, The European Physical Journal D 69, 202 (2015).
- Hunter et al. (2018) D. Hunter, S. Piccolomo, J. D. Pritchard, N. L. Brockie, T. E. Dyer, and E. Riis, Phys. Rev. Applied 10, 014002 (2018).
- Huang and Lehmann (2013) H. Huang and K. K. Lehmann, The Journal of Physical Chemistry A 117, 13399 (2013).
- Westberg and Wysocki (2017) J. Westberg and G. Wysocki, Applied Physics B 123, 168 (2017).
- Morville et al. (2005) J. Morville, S. Kassi, M. Chenevier, and D. Romanini, Applied Physics B 80, 1027 (2005).
- Burkart, Romanini, and Kassi (2014) J. Burkart, D. Romanini, and S. Kassi, Opt. Lett. 39, 4695 (2014).
- Wang et al. (2015) Y. Wang, M. Nikodem, E. Zhang, F. Cikach, J. Barnes, S. Comhair, R. A. Dweik, C. Kao, and G. Wysocki, Scientific Reports 5, 9096 (2015).
- Henderson et al. (2018) B. Henderson, A. Khodabakhsh, M. Metsälä, I. Ventrillard, F. M. Schmidt, D. Romanini, G. A. D. Ritchie, S. te Lintel Hekkert, R. Briot, T. Risby, N. Marczin, F. J. M. Harren, and S. M. Cristescu, Applied Physics B 124, 161 (2018).