Undulation instabilities in cholesteric liquid crystals induced by anchoring transitions
Abstract
Cholesteric liquid crystals (CLCs) have a characteristic length scale given by the pitch of the twisted stacking of their constituent rod-like molecules. Under homeotropic anchoring conditions where the molecules prefer to orient perpendicular to an interface, cholesteric interfaces exhibit striped phases with stripe widths commensurate with the pitch. Conversely, planar anchoring conditions have the molecules remain in the plane of the interface so that the CLC twists perpendicular to it. Recent work [L. Tran et al. Phys. Rev. X 7, 041029 (2017)] shows that varying the anchoring conditions dramatically rearranges the CLC stripe pattern, exchanging defects in the stripe pattern with defects in the molecular orientation of the liquid crystal molecules. We show with experiments and numerical simulations that the CLC stripes also undergo an undulation instability when we transition from homeotropic to planar anchoring conditions and vice versa. The undulation can be interpreted as a transient relaxation of the CLC resulting from a strain in the cholesteric layers due to a tilting pitch axis, with properties analogous to the classic Helfrich-Hurault instability. We focus on CLC shells in particular and show that the spherical topology of the shell also plays an important role in shaping the undulations.
I Introduction
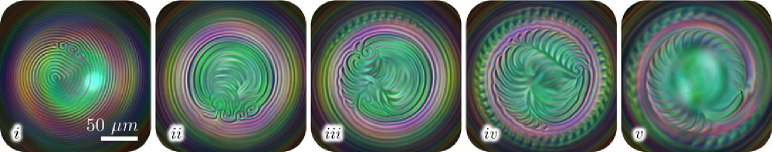
Striped patterns abound in nature, with lamellar features observable at the micron scale within the cell walls of fruits Vignolini et al. (2012), the chitinous exoskeleton of beetles Sharma et al. (2009), and the fruit fly embryo Johnston and Nüsslein-Volhard (1992), as well as at much larger scales, such as on the skin of zebras, tigers, and certain fish species Kondo and Asai (1995); Kondo et al. (2009). In the latter examples, the stripes arise from activating and inhibiting dynamics, characteristic of a Turing instability Kondo and Asai (1995); Kondo et al. (2009). Other patterns seen in living systems, such as those at the surfaces of chiral, liquid crystalline materials, arise due to a characteristic length scale, e.g., the cholesteric pitch Vignolini et al. (2012); Sharma et al. (2009); Bouligand (1972); Bouligand et al. (1968). Striped patterns can further be influenced by geometrical confinement. For instance, stripes decorating a sphere necessarily have defects where they must collide or terminate due to the system’s topology, seen in the presence of poles on a globe. Motivated by the ubiquity of curved, chiral materials, we study striped patterns at the free surfaces of cholesteric liquid crystal (CLC) shells. Using varying surfactant concentrations in the ambient aqueous medium, we show that the CLC shell surface develops transient, undulated stripe instabilities as the pitch axis reorients to accommodate changes in the anchoring conditions. The instabilities are recapitulated in numerical simulations and are generic features: the transient undulations occur under either homeotropic to planar anchoring transitions or under the reverse change. Fig. 1 illustrates this process for a cholesteric shell with diluting surfactant, triggering a homeotropic to planar anchoring transition. The initial striped, focal conic structure (double spiral, top row) unwinds and develops the secondary, bent stripes (bottom row).
Recent work Tran et al. (2017) has shown that when cholesteric shells are subjected to modifications in the anchoring conditions, the stripe pattern is altered dramatically. When the anchoring transforms from homeotropic to planar, the stripes unwind at the defects. The topologically required defects in the system evolve from being defects in the twisting direction ( pitch defect lines) to becoming defects in the molecular orientation of the liquid crystalline molecules (nematic defects with a total charge of ). Along with this conversion of the defect structure, the stripes themselves widen and develop an instability that generates a secondary periodicity, shown in the bottom row of Fig. 1. Our objective here is to understand this instability using numerical simulations and to describe the stripe undulations through the lens of the Helfrich-Hurault instability. We show that the secondary stripe periodicity is caused by strain in the cholesteric layers brought about by changes in the anchoring condition.
The paper is organized as follows: In the next section (Section II), we discuss the experimental setup and numerical simulations. Then, in Section III, we discuss our experimental and simulation results for both planar to homeotropic and homeotropic to planar anchoring transitions. In Section IV, we present an analysis of the undulating stripe patterns using the framework of the Helfrich-Hurault instability and predict a stripe periodicity with this model that matches those observed in experiments and simulations. We conclude with Section V by giving perspectives for future work.
II Methods
II.1 Cholesteric shell preparation
We use 4-cyano-4’-pentylbiphenyl (5CB, Kingston Chemicals Limited) doped with 2.8% wt (S)-4-cyano-4’-(2-methylbutyl)biphenyl (CB15, EMD Performance Materials) to obtain a CLC with a pitch of 5 m. The pitch is determined using a Grandjean-Cano wedge cell Grandjean (1921); Cano (1968). Briefly, two glass slides are coated with a unidirectionally rubbed polyvinyl alcohol (PVA, Sigma-Aldrich) film to give planar anchoring. The slides are then clamped and glued with rubbing directions parallel to one another and a Mylar spacer on one side of the cell to create the wedge angle. The distance between disclination lines in the cell is measured and used, along with the angle, to determine the pitch.
CLC shells are produced using a glass capillary microfluidic device to generate double emulsions, similar to methods described in past works Shah et al. (2008); Tran et al. (2017); Lopez-Leon et al. (2012); Urbanski et al. (2017). Briefly, three different fluid phases are used to generate shells of CLC: an inner aqueous phase, the middle CLC phase, and an outer aqueous phase. The tapered circular capillary of the inner water phase is fitted into a tapered square capillary for the middle CLC phase, which is subsequently fitted into a larger circular capillary for injection of the outer aqueous phase. The middle, square capillary is treated with octadecyltrimethoxysilane (OTS, Sigma-Aldrich) to improve CLC wetting of the capillary. Three syringe pumps (Harvard Apparatus) are used to control the flow rates of each phases, with 40 mL/hr, 500 L/hr, and 400 L/hr as the flow rates corresponding to the outer, middle and inner phases. Both aqueous phases have 1% wt polyvinyl alcohol (PVA, 87-89% hydrolyzed, average ) to stabilize the emulsions. After the double emulsions are collected from the microfluidic device, the shells are left to settle in the vial and equilibrate to the planar anchoring conditions induced by PVA and water.
We use sodium dodecyl sulfate as the surfactant (SDS, Sigma-Aldrich) in varying concentrations to induce homeotropic anchoring Tran et al. (2017); Lopez-Leon et al. (2012); Noh et al. (2015). For homeotropic anchoring of the inner shell surface, SDS is included in the inner aqueous phase during the microfluidic production of CLC double emulsions. To induce homeotropic anchoring on the outer surface of the CLC shell, the double emulsions are pipetted into vials containing aqueous solutions of 1% wt PVA, 0.1 M NaCl, and SDS with concentrations ranging from 7-10 mM Tran et al. (2017). The shells are either viewed immediately to observe the planar to homeotropic anchoring transition or can be left overnight to obtain relaxed shells with homeotropic anchoring as an initial condition. To induce the homeotropic to planar anchoring transition, these homeotropic shells are pipetted into another solution with only 1% wt PVA and 0.1 M NaCl, without SDS. After introducing shells to the appropriate outer aqueous phase for the desired anchoring transition, the sample vial is gently mixed before pipetting into a viewing chamber (Grace Bio-Labs). An upright microscope in transmission mode fitted with crossed polarizers (Zeiss AxioImager M1m) and a high-resolution color camera (Zeiss AxioCam HRc) is used to capture polarized micrographs of shells.
Sodium chloride (NaCl, Fisher Scientific) is added to aqueous phases, ranging in concentration from 0.1 to 1 M, in order to increase the SDS interfacial density Brake and Abbott (2002). In some samples, a higher concentration of NaCl in the inner aqueous phase compared to the outer phase can trigger osmotic swelling, in which water permeates through the CLC shell towards the inner aqueous droplet, increasing the inner droplet volume and thinning the shell over time Tu and Lee (2012); Darmon et al. (2016a); Tran et al. (2017). However, we found the osmotic swelling of CLC shells to occur over tens of hours, while stripe transformations from the introduction or removal of SDS occur over a span of tens of minutes. Therefore, we do not expect osmotic swelling to have an effect on the initial pattern formation that is the focus of this work. Indeed, the time and the manner of pattern formation for shells with and without osmotic swelling is comparable.
II.2 Landau-de Gennes modeling
The numerical simulations model the CLC molecular orientation via the Landau-de Gennes free energy where a symmetric, traceless matrix represents the nematic orientation order parameter and is defined at each site of a cubic lattice, with indices indicating the Cartesian directions Ravnik and Žumer (2009); Sussman and Beller (2019). The free energy in the bulk regions of the liquid crystal reads
| (1) |
with summation over repeated indices implied. The constants , , and are set by the thermodynamic properties of the liquid crystal. Note that the scalar order parameter is given in terms of these parameters as . We also have an elastic component in the bulk which incorporates the energy penalties associated with splay, twist, and bend distortions:
| (2) |
where is the Levi-Cevita symbol and are the partial derivatives along the three spatial directions. When we square the two terms in the first line of Eq. (2), we are left with a sum over the remaining free indices and . More details are given in, e.g., Fukuda and Žumer (2010). We include a splay-bend coefficient that is a total derivative term, but will be important in our system since we will be interested in interfacial phenomena.
At interfaces, we also have an anchoring energy that we model using a Rapini-Papoular surface potential Rapini and Papoular (1969). For homeotropic anchoring strength and planar anchoring strength , the total interface free energy reads:
| (3) |
where is the orientation tensor constructed from the interface’s surface normal vector and where . The tensor is the projection of onto the plane of the interface, so .
This free energy is then minimized over a computational domain using a conjugate gradient method in the ALGLIB package (http://www.alglib.net/). Note that the minimization here does not reflect the actual dynamics of a liquid crystalline system. In reality, the free energy would be minimized in a manner consistent with liquid crystal hydrodynamics. Nevertheless, we can obtain a qualitative idea about the evolution of various patterns by monitoring the states of the system during the minimization procedure from some specified initial condition while tracking any long-lived transient states. Often, the minimization procedure will end within local free energy minima (metastable states) which are also of interest.
In the experiments presented here, we consider 5CB mixed with a chiral dopant as our cholesteric liquid crystal. Therefore, we make use of some standard values for this compound in our simulations Ravnik and Žumer (2009). We set , as this can be set simply by choice of free energy units. We then utilized a one-constant approximation with , , and (Fig. 6), consistent with the parameters of 5CB and a lattice spacing close to the nematic correlation length (size of nematic defect core). These particular choices were not important for determining the qualitative features of the simulation, including the formation of the undulation instability that is the focus of this work. For the other shell simulations in Figs. 3 and 5, we used the two-constant approximation with , , , and . These latter two constants were chosen to correspond to and for the characteristic splay, bend, and twist elastic constants, respectively, for 5CB Karat and Madhusudana (1977). The choice of constants yields a large lattice spacing . Note that the bulk free energy constants and are not so important in this case because we simulate deep in the nematic phase (low temperature) with a large so that all the lattice sites retain the equilibrium value of the scalar order parameter. The minimization procedure essentially only minimizes the elastic component as the bulk remains at a uniaxial minimum. For the simulations with a deformable CLC shell interface in Fig. 8, we tuned the cholesteric to an isotropic-nematic phase transition by setting , , and , with the elastic constants . The various corresponding dimensions of the shell are given in the figure captions in SI units.
III Results
We now examine the undulation instability of CLC stripes on shells for both homeotropic and planar anchoring transitions, using experiments and simulations. At one end of an anchoring transition, the equilibrated planar state is absent of stripes, with director defects adding up to a topologically-required index of Darmon et al. (2016b, a). An example planar shell with four +1/2 defect points is shown in Fig. 2-i. In the planar state, the pitch axis is oriented radially, with the cholesteric layers forming concentric shells. At the other end of an anchoring transition, the homeotropic state of a CLC shell typically stabilizes focal conic domains, seen as double spirals at the shell surface, in which the cholesteric twists along the shell interface (top row of Fig. 1 and Fig. 7-i). The pitch axis in the homeotropic state is oriented parallel to the surface. When the CLC shell is left to equilibrate for a sufficiently long time, the stripes eventually arrange into lines of latitude on the shell, with stripes terminating at two focal conic domains, as forced in by the spherical topology Tran et al. (2017). Converting between these two states requires tilting the pitch axis orientation with respect to the surface, yielding undulating stripes that are featured in the bottom row of Fig. 1 and are the subjects of interest in this paper.
III.1 Planar to homeotropic transitions
We begin first with the planar to homeotropic anchoring transition, featured in Fig. 2. Homeotropic anchoring is induced on the outer shell surface experimentally through the addition of a surfactant (SDS, see Sec. II) to the outer aqueous phase. The onset of the stripe instability is shown in Fig. 2. Note that the undulated stripes do not conform to a discernible pattern, but run in different directions along the shell surface. The nematic defects in the planar to homeotropic transition do not appear to play a large role in ordering the undulating stripes, although the stripes can be observed terminating at the director defects, highlighted in Fig. 2-iv.
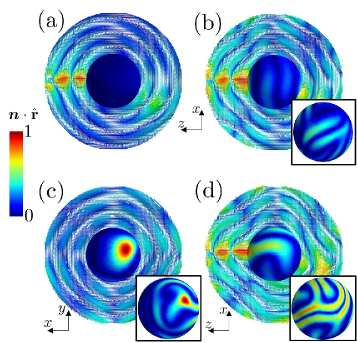
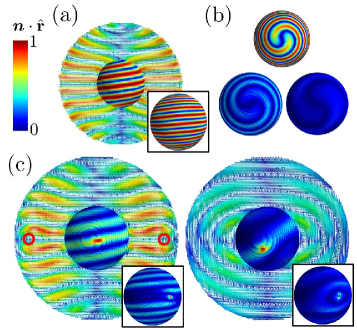
We turn to simulations to elucidate the bulk CLC layer arrangements that bring about the undulating stripe patterns. The stripe behavior is simulated by taking a planar CLC shell configuration as the initial condition [Fig. 3(a), left] and minimizing the free energy under homeotropic anchoring conditions. Large stripes are spawned at early stages of the transition [Fig. 3(b)], reminiscent of those seen in experiments. Cross sections of the shell reveal the source of the large stripes to be undulation of the concentric CLC layers, evident from comparing the cross sections in Fig. 3(a) and (b). During the minimization, homeotropic anchoring increases most significantly at the director defect, the area of highest distortion [red region in Fig. 3(c)]. Interestingly, far from the director defect, the CLC layers are not as undulated as they are near the defect, evident in the cross section of Fig. 3(c). That undulations are most pronounced near the director defect suggests that pitch axis reorientation occurs first at these local regions of disorder before propagating to the rest of the system. Eventually, the typical stripe pattern of homeotropic CLC shells develops on the surface, forming focal conic domains and indicating that the pitch axis completes its reorientation and becomes parallel to the shell surfaces. The simulation results further show that the distortions due to the changing anchoring are confined to regions closest to the shell interfaces, with the most bent and distorted cholesteric layers near the surface [Fig. 3(d)].
III.2 Homeotropic to planar transitions
A similar stripe instability also occurs for a homeotropic to planar anchoring transition. However, in contrast to the reverse transition, the onset of the stripe instability induced by imposing planar anchoring appears to be sensitive to the initial configuration of the system. We examine first the transition for an equilibrated, homeotropic CLC shell before turning to the transition for metastable, homeotropic states with the characteristic focal-conic-like domains decorating the CLC shell surface.
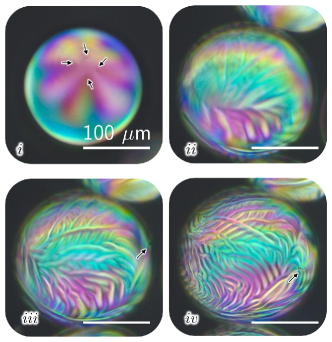
A CLC shell left to equilibrate in a solution with 7 mM SDS, 1% wt PVA, and 0.1 M NaCl for a month is shown in Fig. 4(i), first presented in Tran et al. (2017). It has two focal conic domains at it poles, with the pole in the thinnest region of the shell highlighted in Fig. 4(i). Transferring the shell to an aqueous solution without SDS, results in slow removal of surfactant from the interface and a reduction in the homeotropic anchoring strength. The double spirals of the polar focal conic domains unwind first, resulting in stripes of a larger periodicity at the poles, seen in Fig. 4(ii). As the stripes unwind, they also widen to accommodate greater regions of planar anchoring at the interface. At some point during the anchoring transition, stripes near the thinnest region of the shell begin to undulate with a periodicity of twice the pitch, shown in Fig. 4(iii) & (iv). The undulations extend along the stripes as the transition continues. Near the end of the transition to planar anchoring, most of the stripes have been removed from the system, with a few undulations remaining. One of the excess defects near the focal conic domain in Fig. 4(i) becomes the topologically required director defect in Fig. 4(v).
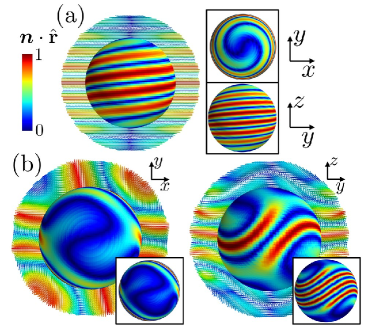
The absence of undulating stripes during the majority of the anchoring transition is captured through simulations, plotted in Fig. 5, where an equilibrated, homeotropically-anchored cholesteric shell relaxes to a planar-anchored state. The starting condition, shown in Fig. 5(a), has two characteristic double-spirals at both poles that correspond to the topologically-required, focal-conic-like domains where the pitch axis has a defect. During relaxation, these double spirals unwind as the pitch axis tilts toward the shell interior. We see a top view of the unwinding in Fig. 5(b). Meanwhile, the layers on the interior of the shell begin to undulate, shown on the left of Fig. 5(c). The layers near the equator undulate in opposite directions and pinch off, creating another pitch defect that eventually becomes the topologically-required nematic defect in the planar-anchored shell. Such a mechanism was conjectured in Tran et al. (2017), but is observed here explicitly in the simulation. Eventually, the pitch axis points radially, and we obtain a state close to the equilibrated planar configuration, seen on the right of Fig. 5(c). We can discern from the insets in Fig. 5(c) that one of the nematic defects (red spot on the outer surface) sits near the shell equator. Faint stripes are still observable near the director defect, shown through the inset of Fig. 5(c), right. Generally, a secondary stripe instability does not materialize, reminiscent of the experiment featured in Fig. 4, where stripes are capable of becoming wider and more planar without undulating in the majority of the system.
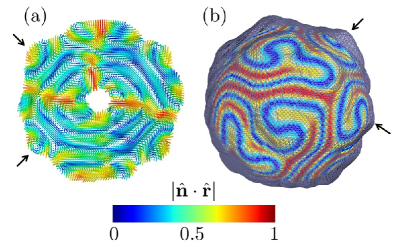
However, it is possible to observe the undulated stripe instability in simulations by using a thinner, smaller shell and slightly altering the initial equilibrium, homeotropic configuration, as shown in Fig. 6. Using a uniform CLC ground state with a vertical pitch axis as the initial shell configuration creates distortion of the polar focal conic domains, shown on the left of Fig. 6(a). The distorted focal conic domains are regions where deformation of the CLC is easiest, observed also in our prior work Tran et al. (2017). With tilting of the pitch axis beginning at these regions near the poles, the centers of the stretched double spirals are also where the undulations first appear. Under the anchoring transition, the stretched double spirals unwind and widen only in the double spiral region, leaving behind an undulated, planar stripe, shown in Fig. 6(b). The simulation is then trapped in this configuration, indicating a metastable state. Cross sections on the right of Fig. 6(b) reveal that the undulated stripes are a direct result of CLC layer undulations. The left panel of Fig. 6(b) further reveals that the stripe undulation appears on both the inner and outer surfaces of the shell. These modulations of the director, perpendicular to the initial stripes, mimic what is seen at the former focal conic domain of the experiment featured in Fig. 4i-ii Tran et al. (2017). As the shell adapts to planar anchoring in Fig. 4, the double spiral region also develops undulated stripes, matching the simulated behavior of the distorted focal conic domains in Fig. 6.
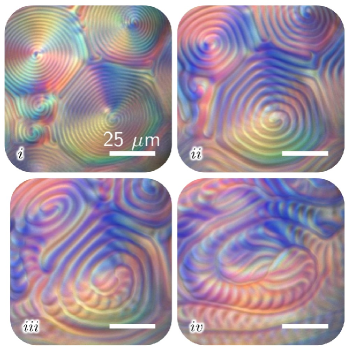
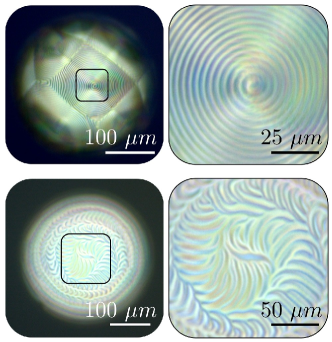
Curiously, undulating stripes in the homeotropic to planar anchoring transition are more pervasive in experimental systems where the initial homeotropic state is meta-stable and have many focal conic domains, exemplified in Fig. 1-i and Fig.7-i. As the surfactant is washed off, the stripes widen to accommodate larger regions of planar anchoring. When the stripes reach a width of approximately twice the pitch , the stripe interior becomes filled in with secondary, arch-like stripes of a periodicity that run along primary stripes, covering the entire shell surface (Fig. 1-iii-iv). Primary stripes being filled in with undulating, secondary stripes also matches the simulation results of Fig. 6. However, it remains unclear why stripes in metastable configurations more readily undulate than those in equilibrium configurations. The initial, seeded planar anchoring at the surface of the simulation in Fig. 6 allows for the undulated stripes to emerge during the anchoring transition. This implies that larger, local regions of planar anchoring may be necessary in experiments for secondary, undulated stripes to appear. This could possibly occur in experiments from the segregation of surfactants into regions of favorable anchoring, reported in Tran et al. (2018). Shell thickness heterogeneity in experiments may additionally play a role, as the local undulations of Fig. 4 occur near the thinnest region of the shell. Indeed, the simulated shell of Fig. 6, exhibiting pronounced, undulated stripes, is smaller and thinner than that of Fig. 5.
Despite slight differences between homeotropic and planar anchoring transitions, the emergence of undulating stripes with changes in anchoring is a general phenomenon, demonstrated through the above experiments and simulations of CLC shells. Simulation results reveal that the stripe instability is a consequence of CLC layer undulation, resulting from the pitch axis tilting to accommodate the new anchoring conditions. In the following section, we formulate a simple model through the lens of the Helfrich-Hurault instability to describe how incompatible anchoring can trigger undulations in the cholesteric bulk.
IV Analysis
A key feature of CLCs is that anchoring changes are confined to a small boundary layer near the interface, while retaining the overall layer structure of the cholesteric bulk, seen in the simulation results of Fig. 3. This is true even if the interface is allowed to deform, as would happen at the cholesteric-isotropic interface, simulated in Fig. 8. Here, a shell with concentrically-arranged cholesteric layers deforms the cholesteric-isotropic interfaces of the shell, with the layers bending most significantly near the interfaces. In larger systems, the bulk layers generally remain in their former configuration. A similar boundary layer may be found in cholesterics confined to hybrid-anchored cells Baudry et al. (1996).
The instabilities considered here result from cholesteric layer strain imposed by a change in anchoring conditions. The strain is relieved via a periodic modulation of the layers, which manifests in the stripe instability described in Sec. III. This phenomenon is reminiscent of the classic Helfrich-Hurault mechanism, in which cholesteric layers are strained via an applied magnetic field Helfrich (1971); Hurault (1973). We develop a similar analysis of the instability observed during anchoring transitions.
We begin by considering the Frank free energy density of the cholesteric:
| (4) | |||||
where , , and are the splay, twist, and bend elastic constants, respectively. This energy does not properly take into account defects in the nematic director, but it can describe the cholesteric layer structure. Minimization of the term yields the usual cholesteric ground state, characterized by a spiraling nematic director , with being the pitch direction and being two orthogonal basis vectors spanning the subspace perpendicular to the pitch. We also have , with being the pitch. The phases are the distortions of the cholesteric layers and for a perfect cholesteric helix. The field may be interpreted at large length scales as a displacement of the cholesteric layer spacings.
It can be shown that small deviations away from the cholesteric ground state have a free energy analogous to a smectic (layered) liquid crystal de Gennes and Prost (1995); Radzihovsky and Lubensky (2011):
| (5) |
where we integrate over the entire sample volume, is an effective layer bending modulus, and is an effective layer compression modulus Lubensky (1972); de Gennes and Prost (1995); Radzihovsky and Lubensky (2011). The gradient represents the derivatives perpendicular to the layer orientation. The free energy in Eq. (5) is consistent with a rotational invariance of the overall layer structure Kleman and Lavrentovich (2007).
In our experiments, we always apply an anchoring that favors a pitch axis tilting, either away from the interface normal for planar to homeotropic transitions, or toward the interface normal for homeotropic to planar transitions. In both cases, such an anchoring will introduce the following free energy contribution at the interface for small tilts :
| (6) |
where we integrate over the interface surface and is the strength of the tilt-inducing anchoring Smalyukh and Lavrentovich (2003). Much like an applied magnetic or electric field, this free energy contribution will break the rotational symmetry implicit in the layer free energy in Eq. (5), driving an undulation instability.
Let us now consider how the instability would work for a flat interface (i.e. a small patch of the CLC shell) located at the plane. We will assume that corresponds to the penetration depth of the deformations induced by the anchoring, so that there are no deformations at . The characteristic wave vector of the instability may be found by looking at the lowest harmonic of the field, which we assume corresponds to a modulation along the -direction: , where is a characteristic length over which the deformation occurs within the CLC bulk. For a CLC free interface, we expect the deformations to be confined to a length on the order of the cholesteric pitch or half-pitch Meister et al. (1996). Substituting in this ansatz and integrating Eq. (5) and (6), we find , a free energy per unit area of interface:
| (7) |
We find that when , the free energy in Eq. (7) is minimized for a non-zero (i.e., an undulated state). Moreover, the critical wave vector associated with the modulation is . Putting in typical elastic constants for 5CB, and assuming a 5 m pitch (setting equal to the pitch), we expect and a modulation wavelength . This is a relatively weak anchoring strength, so we do generically expect to see a modulation under the experimental conditions presented here.
A modulation wavelength of about twice the pitch is also consistent with our observations, detailed previously in Sec. III. However, we note that this spacing can be larger than , especially when the initial configuration of the layers does not correspond to a uniform cholesteric helix running either along or perpendicular to the interface. Indeed, aspects not captured by this simple argument are other, more complex arrangements of the cholesteric layers with initially homeotropic anchoring. For instance, the cholesteric layers can bend to form u-shapes near the interface, resulting in a distribution of defects Tran et al. (2017); Meister et al. (1996), leading to a stripe periodicity equal to the pitch, instead of a half-pitch as one would obtain for a uniform, undistorted helix oriented parallel to the interface.
V Discussion & Conclusion
We have now shown how undulation instabilities develop at free CLC interfaces when the anchoring changes from homeotropic to planar or vice-versa. The instability is driven by a strain in the layers due to the reorientation of the pitch axis near the interface. One typically finds that the modulations have a periodicity equal to twice the cholesteric pitch. We have shown that this instability is analogous to the Helfrich-Hurault mechanism, with the anchoring change playing the role of an “applied field”. A basic argument yields a reasonable estimate of the undulation instability periodicity and the critical anchoring strength at which we might expect to see the instability.
Confinement of the CLC within a spherical geometry necessitates the presence of defects that appear to influence the conformation of the stripe instabilities, with secondary stripes terminating at director defects for homeotropic transitions and extending along primary stripes for planar transitions. For the homeotropic anchoring transition, the initial director defects serve as favorable sites for cholesteric layer rearrangements and undulations. For the planar anchoring transition, the focal conic domains, pitch defects, also act as locations of initial pitch axis reorientation, evident from stripes becoming wider at double spirals first. We note that although the topologically-required defects serve as regions of easy deformation in the system, the presence of defects is not necessary for the onset of undulations. Indeed, the Helfrich-Hurault instability requires only a local geometric incompatibility, instead of a global frustration, for undulations to occur. The type of defect, whether director or pitch, merely reflects the cholesteric layer orientation with respect to the confining boundaries.
We hypothesize that the difference in the appearance and ordering of the stripe instability in homeotropic versus planar transitions lies in the shortest path for the pitch axis reorientation. For the homeotropic transition, the pitch axis is initially radial. To conform to the new homeotropic anchoring condition, the pitch axis must tilt to become tangent to the surface. However, every tilt direction from radial is equivalent. The disorder of the stripe instability for the homeotropic transition then lies in the degeneracy of the pitch-axis tilt direction. On the other hand, for the planar transition, the pitch axis is initially tangent to the spherical surface. Therefore, tilting the pitch axis along the direction of its initial orientation is the shortest path to pointing radially. This constraint prescribes a set direction for undulations to take place, along the initial (primary) stripes on the surface. We additionally note that the secondary, undulated stripes in the planar transition often have an arching shape in experiments, reminiscent of Bouligand arches that emerge when a surface cuts a CLC at an angle to the pitch axis Bouligand (1972); Bouligand et al. (1968); Bouligand and Livolant (1984). The exact connection between the stripe instability and Bouligand arches remains to be further explored.
It would be interesting to develop a more faithful simulation that takes into account the liquid crystal dynamics more properly. Our free energy minimization procedure assumed an over-simplified relaxation mechanism for the nematic director. In the real system, hydrodynamic effects may be important. Moreover, simulating a true free interface could also shed light on the role of the interface in triggering or stabilizing the stripe instability. We are currently limited to looking at interfaces between a cholesteric and isotropic phase, which has a fixed, weak homeotropic anchoring for the cholesteric. Furthermore, a description that takes into account heterogenous shell thicknesses and distributions of anchoring-inducing, surface-active agents may also be needed to fully capture the states observed in experiments.
Another unexplored aspect is the relationship of this instability to the stripe instability observed in nematic liquid crystals under hybrid anchoring Sparavigna et al. (1994); Delabre et al. (2008); Barbero and Lelidis (2015); Manyuhina et al. (2010); Manyuhina and Amar (2013). Our system is similar when we transition from a planar to a homeotropic shell configuration because most of the bulk cholesteric layers maintain a nematic director orientation parallel to the shell surface (i.e., a planar orientation) while the outer layers have homeotropic anchoring. A hybrid-anchored cholesteric is even more complicated than the nematic case, due to the interplay between the anchoring and the cholesteric twist Dozov and Penchev (1986). In the case of the hybrid-anchored nematic, boundary terms in the elastic free energy (e.g., the saddle splay) play an important role in determining the onset of modulations Sparavigna and Strigazzi (1992); Lavrentovich and Pergamenshchik (1994). Although we include such terms in our free energy, we do not study the effect of this term systematically. We do expect such terms to contribute to our CLC shell, as we also have a boundary-driven instability.
We have established how frustration between the surface and bulk ordering of a chiral material can drive an undulating instability, generating stripe patterns with a periodicity larger than that of the material itself. The Helfrich-Hurault model was expanded beyond applied fields and mechanical strains to encompass also changes in the surface anchoring as a source of the instability. This work lays the foundation for further study of the Helfrich-Hurault model in systems where boundary conditions can be freely adjusted and curved.
Acknowledgements.
We thank R. D. Kamien, F. Livolant, and T. Lopez-Leon for useful discussions. Computational support was provided by the University of Tennessee and Oak Ridge National Laboratory’s Joint Institute for Computational Sciences. M.O.L. gratefully acknowledges partial funding from the Neutron Sciences Directorate (Oak Ridge National Laboratory), sponsored by the U.S. Department of Energy, Office of Basic Energy Sciences. L.T. acknowledges support from the Simons Society of Fellows of the Simons Foundation.References
- Vignolini et al. (2012) S. Vignolini, P. J. Rudall, A. V. Rowland, A. Reed, E. Moyroud, R. B. Faden, J. J. Baumberg, B. J. Glover, and U. Steiner, Proc. Natl. Acad. Sci. 109, 15712 (2012).
- Sharma et al. (2009) V. Sharma, M. Crne, J. O. Park, and M. Srinivasarao, Science 325, 449 (2009).
- Johnston and Nüsslein-Volhard (1992) D. S. Johnston and C. Nüsslein-Volhard, Cell 68, 201 (1992).
- Kondo and Asai (1995) S. Kondo and R. Asai, Nature 376, 765 (1995).
- Kondo et al. (2009) S. Kondo, M. Iwashita, and M. Yamaguchi, Int. J. Dev. Biol. 53, 851 (2009).
- Bouligand (1972) Y. Bouligand, Tissue and Cell 4, 189 (1972).
- Bouligand et al. (1968) Y. Bouligand, M. O. Soyer, and S. Puiseux-Dao, Chromosoma 24, 251 (1968).
- Tran et al. (2017) L. Tran, M. O. Lavrentovich, G. Durey, A. Darmon, M. F. Haase, N. Li, D. Lee, K. J. Stebe, R. D. Kamien, and T. Lopez-Leon, Phys. Rev. X 7, 041029 (2017).
- Grandjean (1921) F. Grandjean, Comptes Rendus hebdomadaires des Seances de l’Académie des Sciences 172, 71 (1921).
- Cano (1968) R. Cano, Bull. Soc. Fr. Mineral. Cristallogr. 91, 20 (1968).
- Shah et al. (2008) R. K. Shah, H. C. Shum, A. C. Rowat, D. Lee, J. J. Agresti, A. S. Utada, L.-Y. Chu, J.-W. Kim, A. Fernandez-Nieves, C. J. Martinez, et al., Materials Today 11, 18 (2008).
- Lopez-Leon et al. (2012) T. Lopez-Leon, M. A. Bates, and A. Fernandez-Nieves, Phys. Rev. E 86, 030702(R) (2012).
- Urbanski et al. (2017) M. Urbanski, C. G. Reyes, J. H. Noh, A. Sharma, Y. Geng, V. Subba Rao Jampani, and J. P. F. Lagerwall, J. Phys. Condens. Mat. 29, 133003 (2017).
- Noh et al. (2015) J. Noh, K. Reguengo De Sousa, and J. P. F. Lagerwall, Soft Matter (2015).
- Brake and Abbott (2002) J. M. Brake and N. L. Abbott, Langmuir 18, 6101 (2002).
- Tu and Lee (2012) F. Tu and D. Lee, Langmuir 28, 9944 (2012).
- Darmon et al. (2016a) A. Darmon, M. Benzaquen, D. Seč, S. Čopar, O. Dauchot, and T. Lopez-Leon, Proc. Natl. Acad. Sci. 113, 9469 (2016a).
- Ravnik and Žumer (2009) M. Ravnik and S. Žumer, Liquid Crystals 36, 1201 (2009).
- Sussman and Beller (2019) D. M. Sussman and D. A. Beller, Frontiers in Physics 7, 204 (2019).
- Fukuda and Žumer (2010) J. Fukuda and S. Žumer, Liquid Crystals 37, 875 (2010).
- Rapini and Papoular (1969) A. Rapini and M. Papoular, J. Phys. Colloques 30, C4 (1969).
- Karat and Madhusudana (1977) P. P. Karat and N. V. Madhusudana, Mol. Cryst. Liq. Cryst. 40, 239 (1977).
- Darmon et al. (2016b) A. Darmon, M. Benzaquen, S. Čopar, O. Dauchot, and T. Lopez-Leon, Soft Matter 12, 9280 (2016b).
- Tran (2017) L. Tran, Nikon Small World in Motion Competition (2017), URL https://tinyurl.com/2017-5th-NikonSWiM.
- Tran et al. (2018) L. Tran, H.-N. Kim, N. Li, S. Yang, K. J. Stebe, R. D. Kamien, and M. F. Haase, Science Advances 4, eaat8597 (2018).
- Baudry et al. (1996) J. Baudry, M. Brazovskaia, L. Lejcek, P. Oswald, and S. Pirkl, Liquid Crystals 21, 893 (1996).
- Helfrich (1971) W. Helfrich, J. Chem. Phys. 55, 839 (1971).
- Hurault (1973) J. P. Hurault, J. Chem. Phys. 59, 2068 (1973).
- de Gennes and Prost (1995) P. G. de Gennes and J. Prost, Oxford University Press, USA 2, 4 (1995).
- Radzihovsky and Lubensky (2011) L. Radzihovsky and T. C. Lubensky, Phys. Rev. E 83, 051701 (2011).
- Lubensky (1972) T. C. Lubensky, Phys. Rev. A 6, 452 (1972).
- Kleman and Lavrentovich (2007) M. Kleman and O. D. Lavrentovich, Soft matter physics: an introduction (Springer Science & Business Media, 2007).
- Smalyukh and Lavrentovich (2003) I. I. Smalyukh and O. D. Lavrentovich, Phys. Rev. lett. 90, 085503 (2003).
- Meister et al. (1996) R. Meister, H. Dumoulin, M.-A. Hallé, and P. Pieranski, J. Phys. II France 6, 827 (1996).
- Bouligand and Livolant (1984) Y. Bouligand and F. Livolant, J. Phys. France 45, 1899 (1984).
- Sparavigna et al. (1994) A. Sparavigna, O. D. Lavrentovich, and A. Strigazzi, Phys. Rev. E 49, 1344 (1994).
- Delabre et al. (2008) U. Delabre, C. Richard, G. Guéna, J. Meunier, and A.-M. Cazabat, Langmuir 24, 3998 (2008).
- Barbero and Lelidis (2015) G. Barbero and I. Lelidis, Liquid Crystals 42, 1370 (2015).
- Manyuhina et al. (2010) O. V. Manyuhina, A.-M. Cazabat, and M. B. Amar, Europhys. Lett. 92, 16005 (2010).
- Manyuhina and Amar (2013) O. V. Manyuhina and M. B. Amar, Physics Letters A 377, 1003 (2013).
- Dozov and Penchev (1986) I. Dozov and I. Penchev, J. Phys. France 47, 373 (1986).
- Sparavigna and Strigazzi (1992) A. Sparavigna and A. Strigazzi, Molecular Crystals and Liquid Crystals 221, 109 (1992).
- Lavrentovich and Pergamenshchik (1994) O. D. Lavrentovich and V. M. Pergamenshchik, Phys. Rev. Lett. 73, 979 (1994).