Rapid grain growth in post-AGB disc systems from far-infrared and sub-millimetre photometry††thanks: Scripts to reproduce this analysis are available at http://github.com/pscicluna/GrainGrowthInPostAGBs. They are also available on figshare along with the data at https://figshare.com/account/home#/projects/75495
Abstract
The timescales on which astronomical dust grows remain poorly understood, with important consequences for our understanding of processes like circumstellar disk evolution and planet formation. A number of post-asymptotic giant branch stars are found to host optically thick, dust- and gas-rich circumstellar discs in Keplerian orbits. These discs exhibit evidence of dust evolution, similar to protoplanetary discs; however since post-AGB discs have substantially shorter lifetimes than protoplanetary discs they may provide new insights on the grain-growth process. We examine a sample of post-AGB stars with discs to determine the FIR and sub-mm spectral index by homogeneously fitting a sample of data from Herschel, the SMA and the literature. We find that grain growth to at least hundreds of micrometres is ubiquitous in these systems, and that the distribution of spectral indices is more similar to that of protoplanetary discs than debris discs. No correlation is found with the mid-infrared colours of the discs, implying that grain growth occurs independently of the disc structure in post-AGB discs. We infer that grain growth to mm sizes must occur on timescales yr, perhaps by orders of magnitude, as the lifetimes of these discs are expected to be yr and all objects have converged to the same state. This growth timescale is short compared to the results of models for protoplanetary discs including fragmentation, and may provide new constraints on the physics of grain growth.
keywords:
stars: AGB and post-AGB – circumstellar matter – dust, extinction1 Introduction
Understanding grain growth in a variety of environments remains an important outstanding challenge in understanding interstellar dust. Grains are inferred to evolve in a variety environments, such as the ISM, molecular clouds, circumstellar environments and AGN tori (e.g. Ossenkopf, 1993; Hirashita & Voshchinnikov, 2014; Juhász et al., 2010). These different environments correspond to very different regimes and mechanisms of dust processing, making them sensitive to different aspects of the physics. In planet formation, the growth of dust grains to millimetre sizes plays an important role, but the physics, primarily the timescale, of growth to these sizes is an area of open debate. A wide variety of observations show evidence for grain growth at the later stages of planet formation (e.g. Ricci et al., 2010), and the current generation of models tend to successfully explain observations of grain growth in more evolved YSOs (e.g. Birnstiel et al., 2010; Birnstiel & Andrews, 2014). Some observations of the earlier stages of planet formation have also suggested grain growth, in some cases in tension with the models (e.g. Miotello et al., 2014). However, these are not the only astrophysical objects where large grains are observed, suggesting that complementary studies of other classes of objects may provide new insights on the process; if grains grow on similar or shorter timescales under other comparable conditions this would provide new constraints on the physics.
The final stage of the evolution of single low- and intermediate mass stars () is heralded by the ejection of their envelope as they evolve off the Asymptotic Giant Branch (AGB), exposing the core of the star as a white dwarf, ionising the ejecta and producing a spectacular planetary nebula (PN). In particular, this phase is characterised by the development of strong asymmetries in the circumstellar medium. Many AGB envelopes are broadly spherical in shape, whereas a large fraction of PNe and pre-PNe host jets, tori, rings, or bipolar structures (e.g. Sahai et al., 2007). These asymmetries are, therefore, believed to develop either in the final phase of AGB evolution or in the initial post-AGB phase.
In many cases, post-AGB stars are found to have a spectral energy distribution (SED) with a stronger near-infrared (NIR) excess than would be expected for an expanding spherical shell; by analogy with protoplanetary discs (PPDs) it is assumed that these are host to a massive, dusty circumstellar disc that keeps dust in the hot, inner regions of the system (e.g. Van Winckel, 2003; de Ruyter et al., 2005, 2006; Hillen et al., 2014; Gezer et al., 2015; Kamath et al., 2014, 2015). For a small number of sources the disc nature has been confirmed by scattered-light imaging (Osterbart et al., 1997; Cohen et al., 2004; Ertel et al., 2019) or by observing gas in keplerian rotation in the sub-mm (e.g. Bujarrabal et al., 2005, 2015, 2017, and further work by the same authors). Many of these systems have been found to be binaries, suggesting that the presence of a companion may play a role in the formation of the disc (Van Winckel et al., 2006; Oomen et al., 2018).
As stated above, other types of circumstellar discs, such as protoplanetary and debris discs (e.g. Williams & Cieza, 2011; Wyatt et al., 2015; Matthews et al., 2014), are typically populated by dust grains at least up to mm sizes, as probed by the spectral index in the far-infrared (FIR) and (sub-)mm wavelength ranges (e.g. Roccatagliata et al., 2009; Gáspár et al., 2012; MacGregor et al., 2016; Marshall et al., 2017). In protoplanetary discs (PPDs), the existence of these large dust grains is believed to be linked to grain-growth processes which can take place in such dense, long-lived (typical lifetimes are several megayears, e.g. Fedele et al., 2010) discs. There is also evidence for the presence of grains of such sizes in the discs in post-AGBs (Molster et al., 1999) in spite of the large difference in lifetime compared to PPDs (a factor of , compare e.g. Fedele et al., 2010; Bujarrabal et al., 2017). It has also been noted that the SEDs of post-AGB discs have similar characteristics to PPDs (particularly Type II Herbig Ae/Be stars; de Ruyter et al., 2006) and that radiative-transfer models developed for PPDs also fit post-AGBs very effectively (Hillen et al., 2014; Hillen et al., 2015), suggesting that the two environments may experience similar processes. However, to date such studies have either been relatively small (e.g. de Ruyter et al., 2005), or the samples used have combined both post-AGBs with discs with pre-PNe and other objects (e.g. Sahai et al., 2011), making it difficult to evaluate the prevalence of grain growth. Since post-AGB discs are expected to have very short lifetimes, if large grains are common it could have significant consequences for our understanding of grain growth in circumstellar discs, placing strong constraints on the timescale of this process.
In this paper, we present a systematic analysis of the FIR and sub-mm emission of post-AGB stars with discs and the relationship to grain growth in these objects. We exploit archival Herschel/SPIRE photometry along with new SMA observations and literature fluxes of a sample of 45 post-AGBs with discs to derive the spectral index and hence infer whether significant grain growth may have occurred. Based on this, we explore how the unique environments of these systems can constrain the physics of dust growth and the implications for the initial conditions of planet formation. In Sect. 2 we describe the observational data employed, and Sect. 3 outlines the methods used to analyse the data. In Sect. 4 we discuss the implications of our results. Finally, in Sect. 5, we summarise our findings.
2 Observations
2.1 Sample selection
Our sample is selected from the sample of RV Tauris with IR excess and confirmed binary post-AGBs of de Ruyter et al. (2006). We select all sources in that sample that were observed with Herschel. In addition, we add the famous post-AGB binary the Red Rectangle, which has very deep ALMA photometry from Bujarrabal et al. (2013) and was also included in the de Ruyter et al. (2006) sample , although no Herschel data are available.
2.2 Herschel
We used data from the Herschel Space Observatory’s (Pilbratt et al., 2010) far-infrared and sub-millimetre instruments Photodetector Array Camera and Spectrograph (PACS; Poglitsch et al., 2010) (70/100/160 m) and Spectral and Photometric Imaging REceiver (SPIRE Griffin et al., 2010) (250/350/500 m). Imaging observations of the targets were obtained from the Herschel Science Archive111http://archives.esac.esa.int/hsa/whsa/ as either level 2.5 (mosaiced, pipeline-reduced) or level 3 (user-reduced) data products. In our analysis, we included data from the following observing programmes: KPOT_smolinar_1 (HiGAL - the Herschel Infrared Galactic Plane Survey; Molinari et al., 2010, 2016), OT2_smolinar_7, and OT2_cgielen_4.
Herschel data analysis was carried out in the Herschel Interactive Processing Environment (HIPE; Ott, 2010). The data were taken as science-ready products from the archive as described above. For the PACS wavebands we used the JScanamorphos image, as it is the most reliable for retaining complex background structure through the spatial filtering that occurs in the map-making process. For aperture photometry we adopted an aperture radius of 20″ and a sky annulus of 30–40″. Measured fluxes in each band were adjusted with the appropriate aperture correction factors from Balog et al. (2014). For the SPIRE wavebands we used the implementation of the sextractor tool provided in HIPE to measure the fluxes. This is due to the bright and structured nature of the backgrounds at sub-millimetre wavelengths making aperture photometry inadvisable. The beam area and full-width half-maxima for each band were taken from the SPIRE observer’s manual222http://herschel.esac.esa.int/Docs/SPIRE/html/spire_om.html. No colour corrections were applied to the fluxes. No frequency dependence was applied for the SPIRE maps (assumed dependence, Rayleigh-Jeans tail is ). A calibration uncertainty of 5 per cent is assumed for both PACS and SPIRE measurements.
2.3 Sub-Millimeter Array
Four of the science targets (RV Tau, AY Lep, PS Gem and AR Pup) were observed on a single night (or track) on 2017/01/03 with 8 antennae in compact configuration, giving baselines up to 77 m in length. The SMA can employ two receivers at the same time, to effectively double the bandwidth available. The track used this observing mode, with both receivers tuned to an LO frequency of 225 GHz (1.3 mm), with 6 GHz continuum bandwidth per receiver per sideband. However, technical problems resulted in the loss of all data for baselines involving one antenna for one spectral chunk (2 GHz wide; channel width 560 kHz). The remainder of the baselines for the affected chunk could still be used. Therefore, the fraction of data lost did not have a big impact in the final achieved sensitivity. Depending on elevation constraints, and some data lost during the calibration process, the final time on source was from 1.5 to 2 hours, per target. For the calibration, the SMA observed 3C273 for bandpass, Uranus and 2232+117 for flux, and five more quasars for temporal amplitude and phase gains, interleaved in a loop with the science targets.
The data was calibrated using mir333https://www.cfa.harvard.edu/sma/smaMIR/, following the standard procedures. The imaging was done with the aips (Wells, 1985) task IMAGR. The final rms varies across the continuum maps, and is between 0.5 and mJy beam-1. Only AR Pup and RV Tau were detected as unresolved continuum sources, with SNR values of 50 and 16, respectively.
The spectral setup was chosen to place the CO(2–1) line in the upper sideband. However, no line emission was detected towards any of the targets, even with re-binning up to 7 km s-1 and rms values down to 20 mJy.
2.4 Literature
To improve sampling at longer wavelengths we searched the literature for published sub-mm observations of the Herschel-observed sample. These fluxes are primarily taken from observations with SCUBA, but also include observations from ALMA and at 1.3 and 3 mm from other facilities. A full list of fluxes are given in Tab. 1 along with the Herschel and SMA observations described above.
| Source | IRAS PSC | 100 | 160 | 250 | 350 | 450 | 500 | 850 | 1300 | 3000 |
|---|---|---|---|---|---|---|---|---|---|---|
| TW Cam | 04166+5719 | – | – | 145 10 | 74 8 | – | 0 7 | 11 2.3a | – | – |
| DY Ori | 06034+1354 | 1431 72 | 571 32 | 223 14 | 114 9 | – | 0 7 | – | – | – |
| CT Ori | 06072+0953 | – | – | 50 8 | 0 79 | – | 0 56 | – | – | – |
| SU Gem | 06108+2743 | 819 41 | 358 22 | 166 9 | 8 6 | – | 0 32 | 7.5 2.5a | – | – |
| UY CMa | 06160-1701 | 162 11 | 87 23 | 22.5 6.7 | – | – | – | 2.4 2.1a | – | – |
| V382 Aur | 06338+5333 | 029 5 | 49 8 | 0 7 | – | – | – | – | – | – |
| ST Pup | 06472-3713 | 362 18 | 78 9 | 30 8 | 0 13 | – | – | – | – | – |
| V421 CMa | 07140-2321 | 201 11 | 29 9 | 31 8 | 0 7 | – | – | – | – | – |
| U Mon | 07284-0940 | 9120 456 | 4236 212 | 2009 104 | 1066 54 | – | 549 32 | 181.6 2.6a | 100 14b | 15 0.3b |
| V390 Vel | 08544-4431 | – | – | 4229 220 | 1863 97 | – | 588 34 | – | – | – |
| BZ Pyx | 09060-2807 | 242 13 | 126 11 | 0 9 | – | – | – | – | – | – |
| IRAS 09144-4933 | 09144-4933 | 1107 55 | 379 31 | 0 14 | – | – | – | – | – | – |
| IRAS 09400-4733 | 09400-4733 | 582 29 | 270 17 | 112 7 | 45 5 | – | 0 7 | – | – | – |
| GP Cha | 09538-7622 | 163 9 | 56 9 | 0 10 | – | – | – | – | – | – |
| AG Ant | 10158-2844 | 479 24 | 235 13 | 72 8 | 54 7 | – | 53 9 | 8.7 2.8c | – | – |
| HR 4226 | 10456-5712 | – | – | 2158 111 | 1093 58 | – | 530 30 | – | – | – |
| V802 Car | 11000-6153 | 1545 77 | 983 163 | 0 14 | – | – | – | – | – | – |
| GK Car | 11118-5726 | 169 11 | 109 14 | 0 36 | – | – | – | – | – | – |
| AF Crt | 11472-0800 | 321 17 | 80 10 | 29 8 | 24 8 | – | 0 7 | – | – | – |
| RU Cen | 12067-4508 | – | – | 589 31 | 319 18 | – | 149 12 | – | – | – |
| SX Cen | 12185-4856 | – | – | 83 9 | 45 8 | – | 0 7 | – | – | – |
| V1123 Cen | 12222-4652 | 2446 122 | 928 46 | 292 17 | 126 10 | – | 49 80 | – | – | – |
| IRAS 13258-8103 | 13258-8103 | 660 33 | 458 31 | 143 8 | 51 80 | – | 0 7 | – | – | – |
| EN TrA | 14524-6838 | 1459 73 | 625 33 | 266 16 | 139 10 | – | 75 11 | – | – | – |
| IRAS 15469-5311 | 15469-5311 | 3880 194 | 1441 75 | 0 49 | – | – | – | – | – | – |
| IRAS 15556-5444 | 15556-5444 | 2987 149 | 1363 72 | 660 35 | 319 18 | – | 169 013 | – | – | – |
| NSV 7708 | 16230-3410 | 254 13 | 75 8 | 41 80 | 0 11 | – | – | – | – | – |
| IRAS 17038-4815 | 17038-4815 | 1878 94 | 994 55 | 447 25 | 268 16 | – | 105 11 | – | – | – |
| LR Sco | 17243-4348 | 762 38 | 334 29 | 86 8 | 45 6 | – | 60 8 | – | – | – |
| 89 Her | 17534+2603 | – | – | 667 36 | 343 20 | – | 160 13 | 40.9 2.4c | 9.2 0.5d | 2.7 0.3d |
| AI Sco | 17530-3348 | 1424 71 | 631 32 | 301 17 | 14 9 | – | 68 8 | – | – | – |
| V2053 Oph | 18123+0511 | 1213 61 | 390 22 | 107 10 | 32 7 | – | 0 7 | – | – | – |
| IRAS 18158-3445 | 18158-3445 | 375 19 | 135 11 | 1328 66 | 655 33 | – | 314 16 | – | – | – |
| AC Her | 18281+2149 | – | – | 1572 83 | 817 44 | – | 380 22 | 99.4 3.8a | 38 1b | 4.6 0.4b |
| AD Aql | 18564-0814 | 156 12 | 93 8 | 35 8 | 0 7 | – | – | – | – | – |
| EP Lyr | 19163+2745 | 107 7 | 80 10 | 37 8 | 26 7 | – | 22 7 | – | – | – |
| BD-02 4931 | 19157-0247 | 823 41 | 408 22 | 151 11 | 93 9 | – | 41 8 | – | – | – |
| QY Sge | 20056+1834 | – | – | 372 22 | 191 13 | – | 108 14 | 218 1.8e | – | – |
| AR Pup | 08011-3627 | – | – | 1610 83 | 861 96 | – | 429 72 | – | 41.6 2.1f | – |
| RV Tau | 04440+2605 | 2414 121 | 987 49 | 512 28 | 263 18 | – | 135 16 | 50.3 3.6a | 15 0.8f | 3.9 0.2b |
| AY Lep | 05208-2035 | 680 34 | 244 12 | 102 12 | 31 10 | – | 0 7 | – | 0 1f | – |
| PS Gem | 07008+1050 | 338 17 | 143 12 | 75 16 | 63 15 | – | 24 7 | 2.8 1.9c | 0 1f | – |
| IRAS 17233-4330 | 17233-4330 | 1024 13 | 496 30 | 278 41 | 208 48 | – | 132 34 | – | – | – |
| BD+03 3950 | 19125+0343 | 2331 11 | 893 27 | 313 22 | 136 21 | – | 84 19 | – | – | – |
| IW Car | 09256-6324 | – | – | 2687 30 | 1415 27 | – | 685 26 | 200 20g | – | – |
| Red Rectangle | 06176-1036 | – | – | – | – | 3400 200h | – | 625 35h | – | – |
| References: SCUBA, de Ruyter et al. (2005); CARMA, Sahai et al. (2011); SCUBA, de Ruyter et al. (2006); PdBI, Bujarrabal et al. (2007); | ||||||||||
| SCUBA, Gledhill et al. (2002); SMA, this work; ALMA, Bujarrabal et al. (2017); ALMA, Bujarrabal et al. (2013) | ||||||||||
3 Results
The observing data described in the previous section was used to derive spectral indices in the FIR-sub-mm region for all sources with detections in two or more bands at wavelengths of 250 m or longer. To ensure that the results of the fitting are robust, and can directly integrate the existence of upper-limits on the fluxes in some filters, we employ the affine-invariant MCMC implementation emcee (Foreman-Mackey et al., 2013). Standard non-linear least-square minimisers are typically not able to handle censored data e.g. upper or lower limits. However, in many cases upper limits (left-censored data) on the flux provide important constraints on the spectral index, particularly for constraining non-detections at long wavelengths, and hence more advanced methods which are able to account for this are required. The treatment of upper limits is trivial in MCMC, allowing us to treat sources with different numbers of detections uniformly. The model being fitted is a straight forward power law, which becomes a straight line when fitted to the logarithm of the fluxes i.e.
| (1) |
where is the flux density in milli-Jansky, is the observing wavelength and is the spectral index. As the colour corrections for the filters in question are typically at most a few percent, we opt to work with this simple model as is rather than performing synthetic photometry. For a datum with our likelihood function is the familiar
| (2) |
where and are the observed and model fluxes, respectively and is the fractional uncertainty , which corresponds to the uncertainty on . For upper limits, this must be modified to correctly capture how well the limit constrains the model. In these cases it is necessary to integrate the pdf of the upper limit, i.e.
| (3) |
where is a Normal distribution with mean and standard deviation . In this case, models which do no violate or approach the upper limit have broadly similar likelihoods at that wavelength, while models which do are strongly penalised. The final log-likelihood of a given model is then
| (4) |
which is used as our objective function in the MCMC. This model naturally results in a tight anticorrelation between the slope and intercept of the line, but this is only significant for the sources with the most uncertain data.
To explore the influence of the choice of wavelength coverage, the fitting was repeated for different subsets of the data. The results of these fits are summarised in Tab. 2. Upon examining the results, it is clear that the inclusion of PACS fluxes biases the results toward shallower slopes. This is most likely a result of temperature effects – PACS samples wavelengths too close to the peak of the emission, and hence there is significant curvature in this region of the SED. As a result, we take the results for fits including all wavelengths m (labelled “No PACS” in Tab. 2) as our preferred set, and use these in all further analyses.
| Source | SPIRE only | Herschel | No Herschel | No PACS | All data |
|---|---|---|---|---|---|
| TW Cam | -3.05 | -3.03 | -2.54 | -2.50 | -2.49 |
| DY Ori | -3.33 | -2.36 | – | -3.30 | -2.36 |
| SU Gem | -2.20 | -1.81 | -2.55 | -2.19 | -1.81 |
| UY CMa | -2.56 | -1.94 | -2.46 | -3.10 | -2.19 |
| U Mon | -1.88 | -1.74 | -1.98 | -1.98 | -1.93 |
| V390 Vel | -2.83 | -2.83 | – | -2.84 | -2.84 |
| IRAS 09400-4733 | -3.12 | -2.03 | – | -3.11 | -2.03 |
| AG Ant∗ | -0.69 | -1.66 | -2.52 | -1.13 | -1.69 |
| HR 4226 | -2.03 | -2.03 | – | -2.03 | -2.02 |
| AF Crt | -2.36 | -2.54 | – | -2.42 | -2.54 |
| RU Cen | -1.95 | -1.96 | – | -1.97 | -1.95 |
| SX Cen | -2.85 | -2.86 | – | -2.87 | -2.83 |
| V1123 Cen | -2.51 | -2.36 | – | -2.50 | -2.36 |
| IRAS 13258-8103 | -3.91 | -2.02 | – | -3.91 | -2.02 |
| EN TrA | -1.87 | -1.87 | – | -1.86 | -1.87 |
| IRAS 15556-5444 | -1.99 | -1.78 | – | -1.99 | -1.78 |
| IRAS 17038-4815 | -1.95 | -1.66 | – | -1.94 | -1.65 |
| LR Sco | -0.71 | -1.95 | – | -0.72 | -1.95 |
| 89 Her | -2.01 | -2.04 | -2.31 | -2.45 | -2.45 |
| AI Sco | -2.18 | -1.83 | – | -2.21 | -1.84 |
| V2053 Oph | -3.63 | -2.74 | – | -3.71 | -2.74 |
| IRAS 18158-3445 | -2.08 | -0.03 | – | -2.08 | -0.03 |
| AC Her | -2.05 | -2.04 | -2.40 | -2.32 | -2.32 |
| EP Lyr | -1.22 | -1.02 | – | -1.23 | -1.03 |
| BD-02 4931 | -1.70 | -1.81 | – | -1.71 | -1.80 |
| QY Sge | -1.85 | -1.85 | -2.48 | -2.28 | -2.29 |
| AR Pup | -1.89 | -1.90 | -2.53 | -2.23 | -2.22 |
| RV Tau | -1.94 | -1.75 | -1.90 | -2.00 | -1.92 |
| AY Lep | -3.64 | -2.30 | -2.55 | -3.70 | -2.35 |
| PS Gem | -1.67 | -1.60 | -2.55 | -2.75 | -1.91 |
| IRAS 17233-4330 | -1.20 | -1.41 | – | -1.21 | -1.41 |
| BD+03 3950 | -2.07 | -2.12 | – | -2.08 | -2.12 |
| IW Car | -1.95 | -1.94 | -2.48 | -1.98 | -1.99 |
| Red Rectangle | – | – | -2.67 | -2.66 | -2.66 |
| Notes: | |||||
| ∗ SPIRE wavelengths are contaminated with background emission | |||||
| Source | 450 | 850 | 1.3 mm | 3 mm | |
|---|---|---|---|---|---|
| TW Cam | -2.50 | 33 | 6.8 | 2.4 | 0.29 |
| DY Ori | -3.30 | 36 | 4.4 | 1.1 | 0.068 |
| CT Ori | -2.46 | 12 | 2.4 | 0.9 | 0.1 |
| SU Gem | -2.19 | 46 | 11 | 4.5 | 0.72 |
| UY CMa | -3.10 | 3.7 | 0.52 | 0.14 | 0.010 |
| ST Pup | -2.82 | 5.5 | 0.9 | 0.27 | 0.026 |
| V421 CMa | -3.14 | 4.5 | 0.59 | 0.16 | 0.011 |
| U Mon | -1.98 | 640 | 182 | 79 | 15.1 |
| V390 Vel | -2.84 | 833 | 137 | 41 | 3.8 |
| IRAS 09400-4733 | -3.11 | 18 | 2.6 | 0.68 | 0.051 |
| AG Ant | -1.13 | 40 | 20 | 12 | 4.7 |
| HR 4226 | -2.03 | 655 | 180 | 76 | 14 |
| AF Crt | -2.42 | 8.4 | 1.8 | 0.65 | 0.086 |
| RU Cen | -1.97 | 188 | 54 | 23 | 4.5 |
| SX Cen | -2.87 | 17 | 2.7 | 0.80 | 0.073 |
| V1123 Cen | -2.50 | 67 | 14 | 4.7 | 0.59 |
| IRAS 13258-8103 | -3.91 | 14 | 1.2 | 0.23 | 0.086 |
| EN TrA | -1.86 | 88 | 27 | 12 | 2.6 |
| IRAS 15556-5444 | -1.99 | 201 | 57 | 24 | 4.6 |
| IRAS 17038-4815 | -1.94 | 149 | 43 | 19 | 3.7 |
| LR Sco | -0.72 | 52 | 33 | 24 | 13 |
| 89 Her | -2.45 | 171 | 36 | 13 | 1.6 |
| AI Sco | -2.21 | 82 | 20 | 7.9 | 1.2 |
| V2053 Oph | -3.71 | 12 | 1.2 | 0.24 | 0.011 |
| IRAS 18158-3445 | -2.08 | 392 | 105 | 43 | 7.6 |
| AC Her | -2.32 | 441 | 100 | 37 | 5.3 |
| AD Aql | -3.14 | 4.9 | 0.65 | 0.17 | 0.012 |
| EP Lyr | -1.23 | 19 | 8.8 | 5.2 | 1.9 |
| BD-02 4931 | -1.71 | 56 | 19 | 9.2 | 2.2 |
| QY Sge | -2.28 | 102 | 24 | 9.0 | 1.3 |
| AR Pup | -2.23 | 449 | 109 | 42 | 6.6 |
| RV Tau | -2.00 | 156 | 44 | 19 | 3.5 |
| AY Lep | -3.70 | 12 | 1.1 | 0.23 | 0.010 |
| PS Gem | -2.75 | 21 | 3.8 | 1.2 | 0.12 |
| IRAS 17233-4330 | -1.21 | 141 | 66 | 39 | 14 |
| BD+03 3950 | -2.08 | 91 | 24 | 10 | 1.8 |
| IW Car | -1.98 | 841 | 238 | 102 | 19 |
| Red Rectangle | -2.66 | 34 | 6.3 | 2.0 | 0.22 |
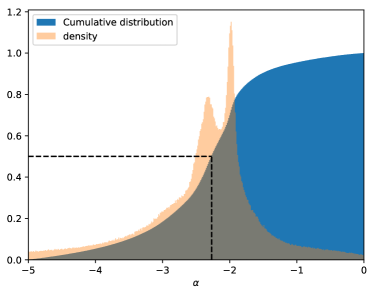
Using the full set of MCMC realisations (after an appropriate burn-in period), we construct an estimate of the distribution of spectral indices. The sharp peak at results from the group of sources with long-wavelength data and very well constrained spectral indices, and the broader bump describes the wider population, with long tails toward very steep and very shallow slopes. A second peak exists at , however it is unclear whether this reflects a genuine separation into two groups.
4 Discussion
The dataset shows a clear abundance of flat emission across the FIR–sub-mm range. The distributions of are clearly dominated by values close to 2, regardless of the choice of dataset. However, there are clear differences that depend on the choice of wavelengths used to derive .
4.1 Importance of long-wavelength photometry
![[Uncaptioned image]](/html/2002.03115/assets/floats/wave_alpha.png)
![[Uncaptioned image]](/html/2002.03115/assets/floats/num_alpha.png)
The choice of wavelength range over which to fit the spectral index has a significant effect on the outcome of the fit. Figure 3 shows the fitted value of as a function of the longest wavelength included in the fit. There is a clear reduction in the uncertainty on the spectral index as longer wavelengths are used. This is in part due to the increased number of points and partly a result of the larger separation in wavelength between the longest and shortest wavelengths. However, there is no real trend in the value of the spectral index.
The importance of the choice of wavelengths can also be explored by looking at the values of derived for the same object with different wavelengths. In particular, the 2nd and 4th columns of Tab. 2 can be compared for those objects with additional data. In general, the addition of longer-wavelength data tends to result in a steeper slope by up to roughly 25%. However, this trend results in a significant change444defined as only in the two cases of 89 Her and AC Her, which have a plethora of high-precision detections. There is one exception, TW Cam, where the slope becomes shallower, possibly because of the lack of 500 m detection, which warrants further investigation.
A further important consideration is whether these changes in spectral index are real or an artefact of biases. This factor is considered below in Sect 4.2, where we explore the role of confounding effects in detail.
4.2 Link between spectral index and grain growth
Although grain growth does cause shallow spectral indices, can we exclude other mechanisms that produce the same effect? These can broadly be divided into three cases:
-
1.
different emission mechanisms e.g. free-free emission;
-
2.
radiative-transfer effects arising from high optical depth or low dust temperatures; or
-
3.
changes in dust refractive indices.
The first of these can be easily examined through observations at cm wavelengths. Where this has been done (e.g. Sahai et al., 2011) it has been shown that the free-free contribution at wavelengths mm is negligible, and that the 0.3 – 3 mm emission is dominated by dust in post-AGB discs.
The role temperature and opacity effects can, to a certain extent, be seen in the change of as different wavelength ranges are included in the fit. In particular, the inclusion of PACS observations, which lie close to the peak of the Planck function for the temperatures expected for an optically thick circumstellar disc, biases the fit toward shallower spectral indices. As explored above, this trend does not continue for longer wavelengths, with the inclusion of millimetre wavelengths primarily reducing the uncertainties on rather than modifying the best-fitting value. While this can only be conclusively excluded by combining spatially-resolved multi-wavelength observations with detailed radiative-transfer modelling, the lack of any trend of the calculated values with wavelength suggests that it does not impact the findings of our analysis in any significant manner.
The final case could arise from changes in dust composition, or perhaps from a dependence of the optical constants on dust temperature (e.g. Mennella et al., 1998; Boudet et al., 2005; Zeidler et al., 2015). This is most difficult to exclude, as it may also introduce some wavelength-dependence of the spectral index. However, these effects typically introduce a change in the spectral index by at most 1. As the distribution of values is very sharply constrained to the region , it is clear that only a part of the difference from interstellar dust (expected to have based on Planck Collaboration et al., 2014) could come from changes in composition or temperature-dependent opacity.
It is therefore clear that a significant fraction of the sources in our sample have undergone grain growth to sizes sufficient to alter the spectral index, although whether this is the only effect at play requires further obseravations. Models of the variation of FIR/(sub-)mm dust opacity with grain size suggest that, in order to produce the values we observe, the grains must have grown to sizes at least mm (e.g. Fig. 4 in Testi et al., 2014a) if grain growth alone is responsible. Even assuming that 50% of the variation arises due to other effects (i.e. a change in of needs to be explained), the dust in these discs must have grown to m (Testi et al., 2014a).
4.3 Mid-IR – far-IR comparison
![[Uncaptioned image]](/html/2002.03115/assets/floats/w12_comparison.png)
![[Uncaptioned image]](/html/2002.03115/assets/floats/w24_comparison.png)
de Ruyter et al. (2006) showed that post-AGB disc sources are most similar to the Type II Herbig Ae/Be stars, rather than Type 1 HAeBe or T Tauri stars. As the distinction between Type I and II is believed to be related to the structure of the discs (e.g. Garufi et al., 2017), we also explore the relationship between the mid-infrared colours, which are expected to reflect the inner-disc structure, and the spectral index in Fig. 3. We obtain photometry of our targets at near- and mid-infrared wavelengths from the Wide-field Infrared Survey Explorer’s AllWISE catalogue (Wright et al., 2010). WISE covered the whole sky in four wavebands (denoted W1 to W4, respectively) with effective wavelengths of 3.4, 4.6, 12 and 22 m. The W1-W2 colour is sensitive to the hottest dust, and hence we expect it to probe how close the inner rim of the disc is to the sublimation radius: the redder the colour, the cooler the dust and hence the further it is from the sublimation radius. The W2-W4 colour, on the other hand, reflects the ratio of dust at 800 K and at 200 K; red colours indicate that the disc hosts a large gap or inner hole. However, neither plot shows a strong correlation with . A weak correlation is visible with the W1-W2 colour, but it is possible that this is attributable to a change in the mid-infrared properties of the dust with grain growth (larger grains tend to be cooler) rather than a trend in which discs with larger inner radii have larger grains. No correlation is apparent between the W1-W2 colour and the orbital period of the binary (where available), indicating that disc-binary interaction does not dominate the location of the warmest dust/disc inner edge.
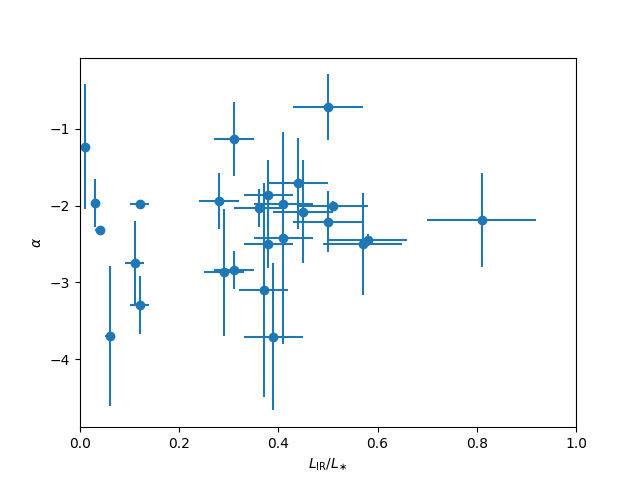
Another way of examining this comparison between grain growth and the mid-IR colours of the discs is to consider the fraction of stellar radiation reprocessed by the discs. Using the ratio of calculated by de Ruyter et al. (2006), we look for a correlation in Fig. 4. As above, this does not reveal any evidence for a trend, with roughly uniform scatter. We expect that the precision of the alpha determination must reach the 1% level (an improvement in precision of roughly two orders of magnitude, corresponding to our most precise alpha measurements with the longest lever-arm in wavelength) before it is useful to explore this relationship, or a factor of 10 more sources must be analysed with alpha at the 10% level.
It may also be interesting to compare growth from micron to millimetre size; with this in mind we compare our results with those from mid-infrared spectroscopy using the Galactic sample of Gielen et al. (2011). However, these methods trace very different regions of the discs in terms of temperature and optical depth; mid-IR spectroscopy is sensitive to micron-sized grains in the upper layers of the warm inner disc, while the FIR/sub-mm spectral index is sensitive to millimetre-sized grains throughout the disc, but particularly the cool midplane. Since these regions are not strongly connected, there is no reason to expect a meaningful correlation between these tracers.
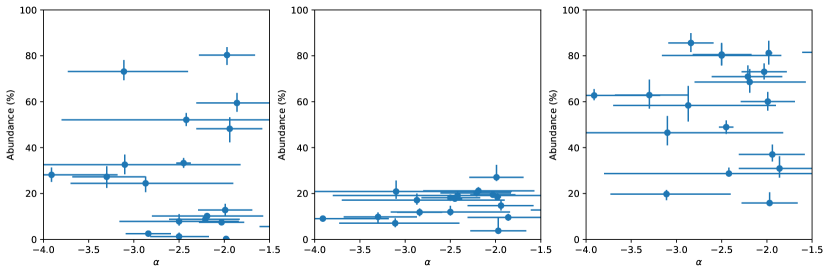
Our sample has 31 sources in common with Gielen et al. (2011), of which 21 have robust measurements of . For these sources, we compare to the mass-fraction of small, medium and large grains found by Gielen et al. (2011), by summing the fractions of each for each dust species, to leave the total mass-fraction of each grain size. Of these, the fraction of small grains can probably be considered the most robust, as a population of grains too large to display features may be hiding in the continuum fit. These results are shown in Fig. 5. If grain growth to micron sizes is linked to growth to mm sizes, one would expect to see a correlation between and the relative abundance of large grains seen in the mid-infrared, and an anticorrelation with the relative abundance of small grains.
It may also be interesting to consider the crystalline fraction, as an alternative proxy for dust evolution, and compare this with . Once again, using the Gielen et al. (2011) sample, we sum the total mass fractions of crystalline Forsterite and Ortho-enstatite, plotting this against in Fig. 6.
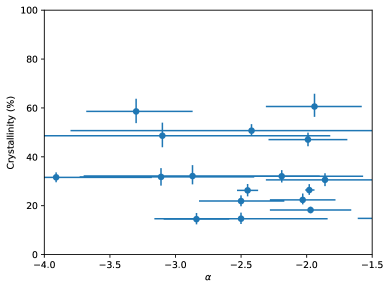
Unsurprisingly, given the weak connection between the regions of the disc that produce these observables, there is no evidence of any trends between grain size as probed by the mid-IR and by the far-IR. Similarly, the crystallinity does not correlate with the sub-mm spectral index. This is most likely a result of the disconnect between the regimes in question, as seen in PPDs (e.g. Ricci et al., 2010).
4.4 Comparison with other types of circumstellar discs
Having established that the presence of large dust grains is the most likely cause of the flat FIR/sub-mm spectra, it is interesting to compare this with other types of circumstellar discs. This may help to elucidate the formation mechanism of the large grains and hence the timescales on which grain-growth may be taking place.
![[Uncaptioned image]](/html/2002.03115/assets/x4.png)
The two most obvious comparison samples are the gas-rich, optically-thick discs around young pre-main-sequence stars (protoplanetary discs, PPDs), and the gas-poor, optically thin dust discs found around main sequence stars (debris discs, DDs). In protoplanetary discs, the presence of gas damps the relative velocities of grains, and so collisions result in grain growth, while the lack of gas in debris discs allows a collisional cascade to proceed unimpeded, resulting in the production of a large population of small grains. We select two samples: the Taurus protoplanetary disc sample of Andrews & Williams (2005), and a sample of field debris discs (MacGregor et al., 2016; Marshall et al., 2017). In order to make a distribution comparable to the histogram shown in Fig. 1, we sample from the distributions of published values assuming they are normally distributed with () respectively equal to the published value and uncertainty of alpha. We draw samples from these distributions until the number of samples for each group of literature data matches the total number of MCMC samples used to construct the histogram shown in Fig. 1. The results of this sampling are shown in Fig. 3.
The peak of our sample lies intermediate to the two literature samples, but the cumulative distribution function (CDF) is rather more similar to the PPD sample, with a longer tail of very low values of . We quantify this by examining the sum of the differences between the two other distributions and the post-AGB distribution; this is about 30% smaller for the PPD than the DD sample. This supports the expectation that these large grains are indeed formed in situ from material expelled and trapped in the circumstellar discs, rather than there being two populations of dust; newly-formed small grains, and larger grains produced by a population of parent bodies that somehow survived the post-MS evolution of the star. Furthermore, the sheer mass of dust would require an unfeasible amount of solid material to be present in the form of planetesimals at the end of the main sequence lifetime of these stars to produce the observed dust through a collisional cascade.
4.5 Post-AGB timescales
The lifetimes of post-AGB stars are dictated by the time it takes for the photosphere to heat up sufficiently to begin ionising the circumstellar envelope, creating a (pre-)planetary nebula. Single-star models predict that this timescale is a strong function of initial stellar mass, and while it can be as short as decades at high masses it is unlikely to be greater than 104 yr (Herwig, 2005; Miller Bertolami, 2016). However, as the accretion of material from the disc tends to inflate the star (leading to a cooler photosphere), this timescale is not likely to be directly applicable in the case of the systems under consideration here, and should be longer. Recent work by Oomen et al. (2019) that aims to explain the observed elemental depletions in post-AGBs through accretion shows that the increase in post-AGB lifetime is between a factor of 2 and 5, provided that the accretion rate is high enough (initially M⊙ yr-1) and enough mass exists in the disc ( M⊙) to fuel long-term accretion. Assuming that this can be multiplied by the single-star evolutionary timescale would give a range from 20 kyr to 50 kyr. Taking this at face value, and including an additional uncertainty of a factor of a few, we would infer that the lifetimes of the post-AGB disc systems, which we expect to come from stars with relatively low initial masses, is typically a few times 104 up to perhaps a few times 105 years.
A small selection of observational constraints also exist for objects in our sample. Bujarrabal et al. (2007); Bujarrabal et al. (2015, 2016, 2017) have resolved the discs of 4 objects in molecular lines (primarily 12CO and 13CO), revealing the Keplerian rotation of the discs, and detecting or placing stringent limits on outflows. Using line radiative-transfer models, they find disc masses of M⊙ and, based on the ratio of the disc mass to the outflow, disc lifetimes between 5000 and 20000 yr, toward the lower end of that expected based on the work of Oomen et al. (2019).
However, the uncertainties on these observational timescales are currently poorly known. The 12CO lines are typically optically thick, significantly increasing the uncertainty on mass determinations, and while in most cases they have simultaneously fitted 13CO, with only a single line this is still prone to uncertainty. In addition, the simplified modelling neglects a number of parameters that have been shown to play important roles in models of protoplanetary discs, such as the structure of the disc. For example, it has been shown that the amount of flaring in the disc can have a dramatic impact on the line fluxes (Woitke et al., 2010), and if this is not taken into account it will have a large impact on the mass determined for the disc. Given these limitations, the uncertainties on these models are difficult to quantify but may approach an order of magnitude, bringing them into better agreement with the results of Oomen et al. (2019).
4.6 Timescales for grain growth
Our sample of post-AGB stars all have disks with large dust grains, but it is very unlikely that they all have the estimated maximum post-AGB age. Not all stars will reach that maximum lifetime given a range of initial masses and binary/disk configurations. Furthermore, the sample likely covers a large range of post-AGB ages between zero and their maximum post-AGB lifetimes. The existence of a single population of grain sizes implies that either all members started from similar conditions, or they evolve toward similarity on a timescale much shorter than they are evolving555This is particularly true given that different sources will be evolving on different timescales due to their different masses.
Thus, the grain growth time scale is not constrained in our work by the maximum post-AGB lifetime; instead it must be close to the post-AGB age of the youngest star in the sample, at least for that particular system. This is almost certainly much less than the maximum post-AGB lifetime. Therefore, if we accept the post-AGB lifetime of years discussed in the previous section as an upper limit, the grain-growth timescale must be years and potentially as short as years.
More specifically, we infer that either dust grains had already grown to large sizes before the post-AGB phase began, or that the timescale for grain growth to mm sizes is effectively instantaneous compared to the post-AGB lifetime i.e., , so that all post-AGB discs rapidly converge to the same conditions , and hence it follows from the earlier discussion on lifetimes that yr, perhaps by orders of magnitude (i.e. yr). The first of these scenarios implies that a significant population of dust became trapped in a long-lived disc while the star was still on the AGB, as the sizes of grains that form in evolved-star winds are typically m in size depending on the chemistry of the source (Höfner, 2008; Norris et al., 2012; Scicluna et al., 2015; Nanni, 2018); these sources are believed to be binaries, and hence this is not implausible. Recent observations have shown that some massive, highly-evolved AGB stars do indeed host dense tori (Decin et al., 2019) but the high initial masses of these stars makes them unlikely to be the progenitors of the post-AGB disc systems under consideration. The majority of a star’s mass loss occurs at the end of the AGB in a superwind, meaning that the majority of the material to be trapped should have become so only shortly before the star evolved off the AGB. If interactions with the companion are responsible for truncating the AGB phase (Van Winckel, 2003) then the mass-loss episode could be even more constrained in time.
In the latter scenario, dust evolution is taking place in these systems on timescales of thousands of years. This makes them an extreme laboratory for studying the physics of dust growth and processing. In comparison, protoplanetary discs are expected to have lifetimes of several megayears. Models of dust evolution in PPDs are divided: Birnstiel et al. (2010) do not predict the formation of 100 m particles on timescales yr unless fragmentation is excluded, while Birnstiel et al. (2012) predict the efficient formation of mm-cm size particles in the inner disc on timescales of only 104 yr. However, given the difference in physical conditions between post-AGB and protoplanetary discs, it is not clear how easily this transfers from one to the other. New dust-evolution models tailored to post-AGB discs may help improve our understanding of grain growth by providing complementary constraints.
As the dust processing in molecular clouds and Class 0/Class 1 YSOs is poorly understood, the initial sizes of dust in PPDs is poorly known, but may be larger than in AGB outflows. Nevertheless, the short grain-growth timescale suggested by post-AGB discs challenge models of grain growth in discs in a similar manner to recent observations of polarised (sub-)mm observations of YSOs, which are sometimes interpreted as a result of strong self-scattering and hence the presence of mm size grains much earlier, in the Class 0/1 stage of pre-main-sequence evolution (e.g. Cox et al., 2015; Sadavoy et al., 2018). Similarly, radiative-transfer modelling has suggested the presence of mm or even cm-size grains in a sample of class I discs in Taurus (Sheehan & Eisner, 2017). If these short timescales are replicated in PPDs, it may explain the observational evidence of planet formation at the earlier Class 0/1 stages, as seen in e.g. HL Tau (ALMA Partnership et al., 2015) .
5 Conclusions
We present a consistent analysis of Herschel, SMA and literature FIR/(sub-)mm fluxes of a sample of 46 post-AGB discs. By fitting power laws to the emission in this wavelength range, we find that the spectral indices of these objects are concentrated in the range , indicating that the grain-size distribution in these discs extends to at least several hundred micron. The inclusion of long wavelength data is shown to be key to reducing the uncertainty in the determination of for any given source, and hence surveys of these sources at wavelengths longer than 500 m should be considered a priority to understand whether the multiple sharp peaks seen in the distribution of spectral indices are real, or if there is a single population of spectral indices in post-AGBs.
We compare our results with mid-infrared measurements of grain growth for a subset of sources. Tracers of grain processing in the mid-IR (fraction of micron-sized grains, crystalline fraction) do not correlate with . This probably reflects the fact that the two tracers are sensitive to dust in very different regions of the discs.
The large dust mass of these discs and similarity of the distribution of spectral indices to those of protoplanetary discs indicates that this difference in spectral slope from interstellar dust is a result of in-situ grain growth. Based on the expected sizes of newly formed dust grains around AGB stars, it is clear that a significant amount of grain growth has occurred; grain growth to sizes of at least several hundred micron is ubiquitous in post-AGB disc systems. The relatively short lifetimes of these discs, and the absence of any evolution of the observed values with stellar effective temperature (a measure of age), shows that all the discs must converge to the same state on a timescale much shorter than their post-AGB evolutionary timescale. Hence grain growth to these sizes is a rapid process ( yr), making them an extreme laboratory for studying dust growth, with important implications for dust in YSOs and PPDs.
Dust growth has been demonstrated up to millimetre sizes through mutual collisions, but the centimetre size barrier is insurmountable due to mutual velocities and low surface adhesion resulting in bouncing rather than sticking between the largest grains (Blum, 2010; Windmark et al., 2012b; Testi et al., 2014b). However, if larger grains are already present in the disc further growth of small dust grains beyond the centimetre size barrier is a rapid process (yrs; Windmark et al., 2012a). This barrier to growth can also be overcome by assuming some ‘stickier’ dust, which may provide pathways toward the formation of a second generation of planetesimals.
To further understand these enigmatic objects and the insights they can provide on the physics of grain growth, several avenues should be explored. Firstly, if the analogy with PPDs holds, we expect that different size grains will exist in different regions of the disc. In this case, the integrated spectral index is not sufficient, and resolved sub-mm imaging of the discs is required to reveal the importance and timescales of dust drift and settling. However, to understand whether post-AGB discs really are shorter-lived analogues of PPDs, we must understand their origins. Kervella et al. (2015) recently detected an edge-on disc around the nearby AGB star L2 Pup, although its relationship to post-AGB discs remains unclear. ALMA observations revealed a candidate sub-stellar object (Kervella et al., 2016) in the disc, which may be responsible for the recent and rapid formation of the disc. Continued monitoring of L2 Pup, and other evolved systems with discs such as BP Psc (de Boer et al., 2017), will be key to understanding the formation of these discs and whether the physics is indeed similar to PPDs.
Acknowledgements
The authors are grateful to Hans Van Winckel for useful comments and discussion on the topic, and to the anonymous referee whose feedback has helped improve this manuscript. In addition to the software explicitly cited above, this paper made use of Astropy (Astropy Collaboration et al., 2013; Greenfield et al., 2013) and Astroquery (Ginsburg et al., 2016).
The Sub-Millimeter Array is a joint project between the Smithsonian Astrophysical Observatory and the Academia Sinica Institute of Astronomy and Astrophysics and is funded by the Smithsonian Institution and the Academia Sinica.
Herschel is an ESA space observatory with science instruments provided by European-led Principal Investigator consortia and with important participation from NASA.
This research has made use of the SIMBAD database, operated at CDS, Strasbourg, France (Wenger et al., 2000).
This research has made use of NASA’s Astrophysics Data System.
This research has been supported by the Ministry of Science and Technology of Taiwan under grants MOST104-2628-M-001-004-MY3 and MOST107-2119-M-001-031-MY3, and by Academia Sinica under grant AS-IA-106-M03. This work benefited from the FEARLESS collaboration (FatE and AfteRLife of Evolved Solar Systems, PI: S. Ertel).
References
- ALMA Partnership et al. (2015) ALMA Partnership et al., 2015, ApJ, 808, L3
- Andrews & Williams (2005) Andrews S. M., Williams J. P., 2005, ApJ, 631, 1134
- Astropy Collaboration et al. (2013) Astropy Collaboration et al., 2013, A&A, 558, A33
- Balog et al. (2014) Balog Z., et al., 2014, Experimental Astronomy, 37, 129
- Birnstiel & Andrews (2014) Birnstiel T., Andrews S. M., 2014, ApJ, 780, 153
- Birnstiel et al. (2010) Birnstiel T., Dullemond C. P., Brauer F., 2010, A&A, 513, A79
- Birnstiel et al. (2012) Birnstiel T., Klahr H., Ercolano B., 2012, A&A, 539, A148
- Blum (2010) Blum J., 2010, Research in Astronomy and Astrophysics, 10, 1199
- Boudet et al. (2005) Boudet N., Mutschke H., Nayral C., Jäger C., Bernard J.-P., Henning T., Meny C., 2005, ApJ, 633, 272
- Bujarrabal et al. (2005) Bujarrabal V., Castro-Carrizo A., Alcolea J., Neri R., 2005, A&A, 441, 1031
- Bujarrabal et al. (2007) Bujarrabal V., Van Winckel H., Neri R., Alcolea J., Castro-Carrizo A., Deroo P., 2007, A&A, 468, L45
- Bujarrabal et al. (2013) Bujarrabal V., Castro-Carrizo A., Alcolea J., Van Winckel H., Sánchez Contreras C., Santander-García M., Neri R., Lucas R., 2013, A&A, 557, L11
- Bujarrabal et al. (2015) Bujarrabal V., Castro-Carrizo A., Alcolea J., Van Winckel H., 2015, A&A, 575, L7
- Bujarrabal et al. (2016) Bujarrabal V., Castro-Carrizo A., Alcolea J., Santander-García M., Van Winckel H., Sánchez Contreras C., 2016, A&A, 593, A92
- Bujarrabal et al. (2017) Bujarrabal V., Castro-Carrizo A., Alcolea J., Van Winckel H., Sánchez Contreras C., Santander-García M., 2017, A&A, 597, L5
- Cohen et al. (2004) Cohen M., Van Winckel H., Bond H. E., Gull T. R., 2004, AJ, 127, 2362
- Cox et al. (2015) Cox E. G., et al., 2015, ApJ, 814, L28
- Decin et al. (2019) Decin L., et al., 2019, Nature Astronomy, 3, 408
- Ertel et al. (2019) Ertel S., et al., 2019, AJ, 157, 110
- Fedele et al. (2010) Fedele D., van den Ancker M. E., Henning T., Jayawardhana R., Oliveira J. M., 2010, A&A, 510, A72
- Foreman-Mackey et al. (2013) Foreman-Mackey D., Hogg D. W., Lang D., Goodman J., 2013, PASP, 125, 306
- Garufi et al. (2017) Garufi A., et al., 2017, A&A, 603, A21
- Gáspár et al. (2012) Gáspár A., Psaltis D., Rieke G. H., Özel F., 2012, ApJ, 754, 74
- Gezer et al. (2015) Gezer I., Van Winckel H., Bozkurt Z., De Smedt K., Kamath D., Hillen M., Manick R., 2015, MNRAS, 453, 133
- Gielen et al. (2011) Gielen C., et al., 2011, A&A, 533, A99
- Ginsburg et al. (2016) Ginsburg A., et al., 2016, astroquery v0.3.1, doi:10.5281/zenodo.44961, https://doi.org/10.5281/zenodo.44961
- Gledhill et al. (2002) Gledhill T. M., Bains I., Yates J. A., 2002, MNRAS, 332, L55
- Greenfield et al. (2013) Greenfield P., et al., 2013, Astropy: Community Python library for astronomy, Astrophysics Source Code Library (ascl:1304.002)
- Griffin et al. (2010) Griffin M. J., et al., 2010, A&A, 518, L3
- Herwig (2005) Herwig F., 2005, ARA&A, 43, 435
- Hillen et al. (2014) Hillen M., et al., 2014, A&A, 568, A12
- Hillen et al. (2015) Hillen M., de Vries B. L., Menu J., Van Winckel H., Min M., Mulders G. D., 2015, A&A, 578, A40
- Hirashita & Voshchinnikov (2014) Hirashita H., Voshchinnikov N. V., 2014, MNRAS, 437, 1636
- Höfner (2008) Höfner S., 2008, A&A, 491, L1
- Juhász et al. (2010) Juhász A., et al., 2010, ApJ, 721, 431
- Kamath et al. (2014) Kamath D., Wood P. R., Van Winckel H., 2014, MNRAS, 439, 2211
- Kamath et al. (2015) Kamath D., Wood P. R., Van Winckel H., 2015, MNRAS, 454, 1468
- Kervella et al. (2015) Kervella P., et al., 2015, A&A, 578, A77
- Kervella et al. (2016) Kervella P., Homan W., Richards A. M. S., Decin L., McDonald I., Montargès M., Ohnaka K., 2016, A&A, 596, A92
- MacGregor et al. (2016) MacGregor M. A., et al., 2016, ApJ, 823, 79
- Marshall et al. (2017) Marshall J. P., Maddison S. T., Thilliez E., Matthews B. C., Wilner D. J., Greaves J. S., Holland W. S., 2017, MNRAS, 468, 2719
- Matthews et al. (2014) Matthews B. C., Krivov A. V., Wyatt M. C., Bryden G., Eiroa C., 2014, Protostars and Planets VI, pp 521–544
- Mennella et al. (1998) Mennella V., Brucato J. R., Colangeli L., Palumbo P., Rotundi A., Bussoletti E., 1998, ApJ, 496, 1058
- Miller Bertolami (2016) Miller Bertolami M. M., 2016, A&A, 588, A25
- Miotello et al. (2014) Miotello A., Testi L., Lodato G., Ricci L., Rosotti G., Brooks K., Maury A., Natta A., 2014, A&A, 567, A32
- Molinari et al. (2010) Molinari S., et al., 2010, A&A, 518, L100
- Molinari et al. (2016) Molinari S., et al., 2016, A&A, 591, A149
- Molster et al. (1999) Molster F. J., et al., 1999, Nature, 401, 563
- Nanni (2018) Nanni A., 2018, preprint, (arXiv:1811.02620)
- Norris et al. (2012) Norris B. R. M., et al., 2012, Nature, 484, 220
- Oomen et al. (2018) Oomen G.-M., Van Winckel H., Pols O., Nelemans G., Escorza A., Manick R., Kamath D., Waelkens C., 2018, A&A, 620, A85
- Oomen et al. (2019) Oomen G.-M., Van Winckel H., Pols O., Nelemans G., 2019, A&A, 629, A49
- Ossenkopf (1993) Ossenkopf V., 1993, A&A, 280, 617
- Osterbart et al. (1997) Osterbart R., Langer N., Weigelt G., 1997, A&A, 325, 609
- Ott (2010) Ott S., 2010, in Y. Mizumoto, K.-I. Morita, & M. Ohishi ed., Astronomical Society of the Pacific Conference Series Vol. 434, Astronomical Data Analysis Software and Systems XIX. pp 139–+ (arXiv:1011.1209)
- Pilbratt et al. (2010) Pilbratt G. L., et al., 2010, A&A, 518, L1
- Planck Collaboration et al. (2014) Planck Collaboration et al., 2014, A&A, 571, A11
- Poglitsch et al. (2010) Poglitsch A., et al., 2010, A&A, 518, L2
- Ricci et al. (2010) Ricci L., Testi L., Natta A., Brooks K. J., 2010, A&A, 521, A66
- Roccatagliata et al. (2009) Roccatagliata V., Henning T., Wolf S., Rodmann J., Corder S., Carpenter J. M., Meyer M. R., Dowell D., 2009, A&A, 497, 409
- Sadavoy et al. (2018) Sadavoy S. I., et al., 2018, ApJ, 859, 165
- Sahai et al. (2007) Sahai R., Morris M., Sánchez Contreras C., Claussen M., 2007, AJ, 134, 2200
- Sahai et al. (2011) Sahai R., Claussen M. J., Schnee S., Morris M. R., Sánchez Contreras C., 2011, ApJ, 739, L3
- Scicluna et al. (2015) Scicluna P., Siebenmorgen R., Wesson R., Blommaert J. A. D. L., Kasper M., Voshchinnikov N. V., Wolf S., 2015, A&A, 584, L10
- Sheehan & Eisner (2017) Sheehan P. D., Eisner J. A., 2017, ApJ, 851, 45
- Testi et al. (2014a) Testi L., et al., 2014a, Protostars and Planets VI, pp 339–361
- Testi et al. (2014b) Testi L., et al., 2014b, in Beuther H., Klessen R. S., Dullemond C. P., Henning T., eds, Protostars and Planets VI. p. 339 (arXiv:1402.1354), doi:10.2458/azu_uapress_9780816531240-ch015
- Van Winckel (2003) Van Winckel H., 2003, ARA&A, 41, 391
- Van Winckel et al. (2006) Van Winckel H., Lloyd Evans T., Reyniers M., Deroo P., Gielen C., 2006, Mem. Soc. Astron. Italiana, 77, 943
- Wells (1985) Wells D. C., 1985, Nrao’S Astronomical Image Processing System (AIPS). Springer US, Boston, MA, pp 195–209, doi:10.1007/978-1-4615-9433-8_18, https://doi.org/10.1007/978-1-4615-9433-8_18
- Wenger et al. (2000) Wenger M., et al., 2000, A&AS, 143, 9
- Williams & Cieza (2011) Williams J. P., Cieza L. A., 2011, ARA&A, 49, 67
- Windmark et al. (2012a) Windmark F., Birnstiel T., Güttler C., Blum J., Dullemond C. P., Henning T., 2012a, A&A, 540, A73
- Windmark et al. (2012b) Windmark F., Birnstiel T., Ormel C. W., Dullemond C. P., 2012b, A&A, 544, L16
- Woitke et al. (2010) Woitke P., Pinte C., Tilling I., Ménard F., Kamp I., Thi W. F., Duchêne G., Augereau J. C., 2010, MNRAS, 405, L26
- Wright et al. (2010) Wright E. L., et al., 2010, AJ, 140, 1868
- Wyatt et al. (2015) Wyatt M. C., Panić O., Kennedy G. M., Matrà L., 2015, Ap&SS, 357, 103
- Zeidler et al. (2015) Zeidler S., Mutschke H., Posch T., 2015, ApJ, 798, 125
- de Boer et al. (2017) de Boer J., et al., 2017, MNRAS, 466, L7
- de Ruyter et al. (2005) de Ruyter S., Van Winckel H., Dominik C., Waters L. B. F. M., Dejonghe H., 2005, A&A, 435, 161
- de Ruyter et al. (2006) de Ruyter S., Van Winckel H., Maas T., Lloyd Evans T., Waters L. B. F. M., Dejonghe H., 2006, A&A, 448, 641