∎
School of Engineering, Westlake University, 18 Shilongshan St., Hangzhou, China
22email: manteng@westlake.edu.cn 33institutetext: H. E. Huppert 44institutetext: Institute of Theoretical Geophysics, King’s College, University of Cambridge, King’s Parade, Cambridge, United Kingdom 55institutetext: L. Li 66institutetext: School of Engineering, Westlake University, 18 Shilongshan St., Hangzhou, China 77institutetext: S. A. Galindo-Torres 88institutetext: School of Engineering, Westlake University, 18 Shilongshan St., Hangzhou, China
88email: s.torres@westlake.edu.cn
Deposition Morphology of Granular Column Collapses
Abstract
Granular column collapses result in an array of flow phenomena and deposition morphologies, the understanding of which brings insights into studying granular flows in both natural and engineering systems. Guided by experiments, we carried out computational studies with the discrete element method (DEM) to identify fundamental links between the macro-scale behavior and micro-scale properties of granular columns. A dimensionless number combining particle and bulk properties of the column, , was found from dimensional analysis to determine three collapse regimes (quasi-static, inertial, and liquid-like), revealing universal trends of flow regimes and deposition morphologies under different conditions. This dimensionless number may represent physically the competing inertial and frictional effects that govern the behavior of the granular column collapse, including energy conversion and dissipation. The finding is important for understanding quantitatively the flow of granular materials and their deposits.
Keywords:
Granular materials Column collapses Discrete element method Regime transition1 Introduction
Granular materials are used widely and encountered frequently in a variety of areas of civil engineering, geophysics, pharmaceutical engineering, food processing, and chemical engineering man2019rheology ; Zhang2020coupling . They can behave like a solid, a liquid, or a gas in different circumstances midi2004dense . In recent decades, breakthroughs have been made to understand the basic governing principles, especially the constitutive relationships, of granular materials. Among these investigations, the proposal of the rheology jop2006constitutive and the relationship trulsson2012transition ; man2018rheology of granular materials opened a window for exploring the behavior of dense granular materials from a viewpoint of a competition among acting stresses, viscous stresses and inertial stresses pouliquen2006flow ; trulsson2012transition (or a competition among different time scales , , and cassar2005submarine , where is the shear rate, the average particle radius, the pressure, the particle density, and the dynamic viscosity of the interstitial fluid).
The collapse of granular columns has drawn continuous attention due to the potential link to the dynamics and deposition morphologies of various geophysical flows lube2005collapses ; lagree2011granular . Progress has been made, even though no universal relationship describing the collapse of granular columns has been concluded. Difficulties arise because such systems are highly dependent on inter-particle friction staron2007spreading and boundary conditions staron2005study ; lagree2011granular ; zhang2014particle , which were not fully captured by the rheological models previously mentioned. Some rigorous investigations lube2004axisymmetric ; lajeunesse2005granular ; lube2005collapses have been conducted to understand the behavior of granular column collapses. Lube et al. lube2004axisymmetric ; lube2005collapses and Lajeunesse et al. lajeunesse2005granular independently determined that relationships for both the normalized run-out distance (where is the final radius of the granular pile, and the initial radius of the granular column), and the halt time of a collapsed granular column scale with the initial aspect ratio, (where is the initial height) of the column, a parameter drawn from dimensional analysis. Lube et al. lube2004axisymmetric further concluded that inter-particle friction only plays an important role in the last instant of the flow when the collapse starts to halt.
Zenit zenit2005computer simulated the collapse of 2-D granular columns and found that the 2-D collapse is essentially similar to that of axisymmetric granular column collapse performed by Lube et al. The dimensionless number, working in the axisymmetric granular column collapse, also works for the 2-D case. Staron and Hinch staron2007spreading studied the effect of grain properties on the collapse of granular columns and suggested that the frictional coefficient could have a significant impact on the run-out distance and final mass distribution with 2-D granular column collapses, and found that, under certain circumstances, more particles may end up packing at the outer ring of the granular pile than packing in the center of it. Kermani et al. kermani2015simulation used the discrete element method (DEM) to investigate the relationship between deposition morphology and inter-particle rotational resistance as well as the initial porosity of the granular packing, based on which they linked the deposition morphology to the energy dissipation. Lai et al. lai2017collapse studied the collapse of granular column with various gain size distributions with experiments and simulations and show that particle flow mobility increases as the fractal dimension increases. The column collapse of more complex particles were also investigated rigorously that, e.g., Trepanier et al. trepanier2010column studied the behavior of the granular column collapse with rod-like particles of different particle aspect ratios and showed that, when particle aspect ratio and the initial solid fraction reached certain levels, the granular packing become completely solid-like.
However, previous research often lacked physical interpretation of the scaling parameters, i.e. the initial aspect ratio (which was derived from dimensional analysis lube2004axisymmetric ), and the universality of the transition point between the two determined relationships and lube2004axisymmetric ; lube2005collapses . Furthermore, previous studies did not quantitatively take the inter-granular friction and boundary conditions into consideration. In this paper, with the assistance of both experiments and DEM simulations, we aim to explore further the scaling of the final run-out distance of collapsed granular columns and link the scaling law with a theoretically derived dimensionless number. The deposition morphology and the correlation between initial height and deposition distance are carefully analyzed. Three different collapsing types are observed and further associated with the ratio between inertial stresses and frictional stresses during granular column collapses. With this work, the regime transition of the granular column collapse can be obtained for further investigation of geophysical flows, such as debris flows and landslides.
The paper is organized as follows. Section 2 introduces the numerical method we use in this study and provides an experimental validation to show that the Voronoi-based discrete element method is able to capture the behavior of the collapse of dry granular columns. Section 3 presents the simulation results and the corresponding analyses, within which we talked about the influence of inter-particle friction and particle/boundary friction on the run-out distance behavior as well as the deposition morphology of collapsed granular columns (Sect. 3.1 and 3.2). We then introduced a physics-based dimensionless number to describe the behavior of granular column collapses. Further discussions are then presented in Sect. 3.3, Sect. 3.4 and Sect. 3.5, before conclusions are drawn in Sect. 4.
2 Simulations and experimental validation
2.1 Discrete element method
In this study, we performed simulations with the discrete element method (DEM) cundall1979discrete ; galindo2009molecular ; galindo2010molecular to test the collapse of granular columns, which allowed us to extract particle-scale data from the system and calculate the dynamics of particles with Newton’s laws which are integrated numerically for both translational and rotational degrees of freedom. We use sphero-polyhedron particles in our simulations. The sphero-polyhedra method was initially introduced by Pourningpournin2005generalization for the simulation of complex-shaped DEM particles. Later, it was modified by Alonso Marroquinalonso2008spheropolygons , who introduced a multi-contact approach in 2D allowing the modelling of non-convex shapes and was extend to 3D by Galindo-Torres et. al.galindo2009molecular . A sphero-polyhedron is a polyhedron that has been eroded and then dilated by a sphere element. The result is a polyhedron of similar dimensions but with rounded corners.
The best advantage of the sphero-polyhedra technique is that it allows for an easy and efficient definition of contact laws between the particles. This is due to the smoothing of the edges of all geometric features by circles (in 2D) or spheres (in 3D). Regarding the contact between two generic particles and , first one has to consider the contact between each geometric feature of particle with all features of particle . In mathematical notation, both and have a set of vertices , edges , and faces . Thus, a particle is defined as a polyhedron, i.e. a set of vertices, edges and faces, where each one of these geometrical feature is dilated by a sphere.
For simplicity, We denominate the set of all the geometric features of a particle as . Now the function representing this topology can be defined as the distance function for two geometric features according to
| (1) |
where is a 3D vector that belongs to the set . This means that the distance for two geometric features is the minimum Euclidean distance assigned to two points belonging to them.
Since both particles are dilated by their sphero-radii and , it can be said that there is a complete contact when the distance between the two geometric features is less than the addition of the corresponding radii used in the sweeping stage, i.e.:
| (2) |
and the corresponding contact overlap can be calculated accordingly. Here, the advantage of the sphero-polyhedra technique becomes evident since this definition is similar to the one for the contact law of two spheresbelheine2009numerical . We note that, in our simulation, three types of contacts (vertex-vertex contact, edge-edge contact, and vertex-face contact, shown in Fig. 2.1) are considered. For these types of contacts, we implement a Hookean contact model with energy dissipation to calculate the interactions between particles. At each time step, the overlap between adjacent particles, , is checked and the normal contact force can be calculated using
| (3) |
where is the normal stiffness characterizing the deformation of the material, is defined as the normal unit vector at the plane of contact, is the relative normal velocity between particles, is the reduced mass of the contacting particle pair, and and are masses of contacting particles, respectively, and is the normal energy dissipation constant, which depends on the coefficient of restitution as alonso2013experimental ; galindo2018micromechanics ,
| (4) |
![[Uncaptioned image]](/html/2002.02146/assets/figure_add.png)
The tangential contact forces between contacting particles were calculated by keeping track of the tangential relative displacement . Thus, the tangential contact forces follow
| (5) |
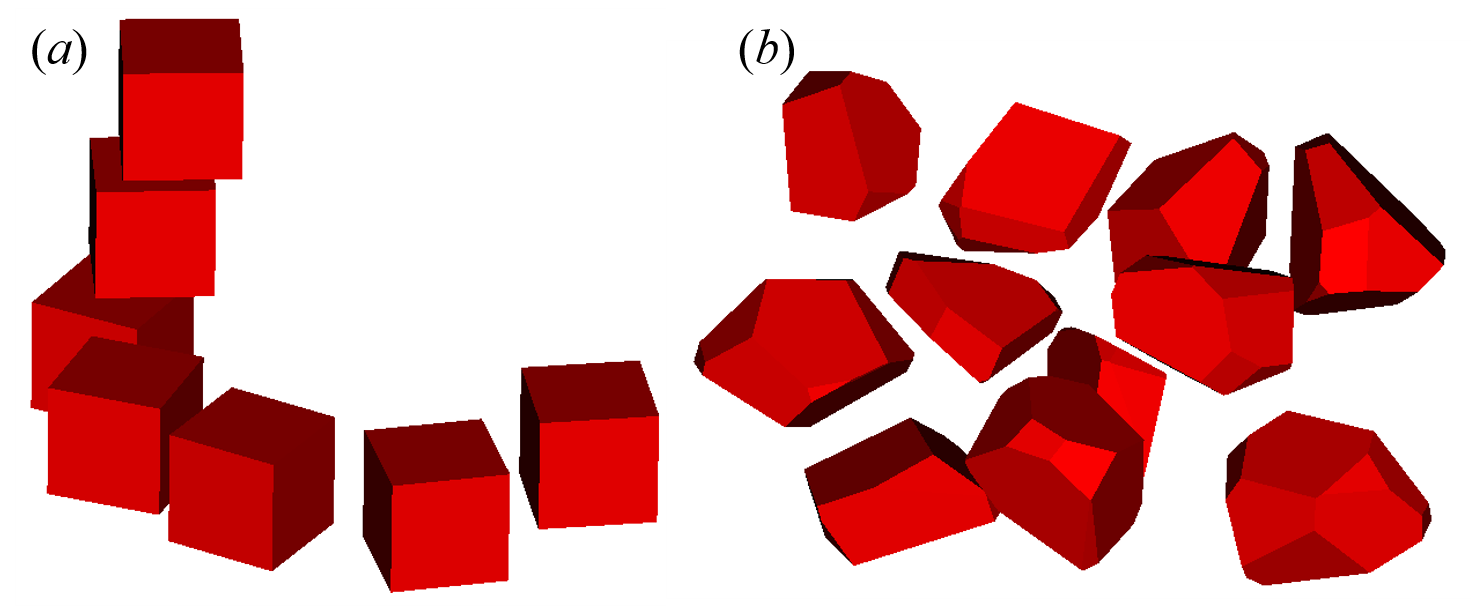
where is the tangential stiffness, is the tangential vector in the contact plane and parallel to the tangential relative velocity, , and is the frictional coefficient between contacting particles and can be replaced by the frictional coefficient between the particles and the bottom boundary, , while calculating the particle-boundary interactions. In this study, since we use either cubic particles or Voronoi-based particles, no rolling resistance is needed to be considered. The motion of particles is then calculated by step-wise resolution of Newton’s second law with the normal and contact forces mentioned before. The same neighbor detection and force calculation algorithms were already been discussed and validated in previous studies. The presented DEM formulation has been validated before with experimental data cabrejos2016assessment ; belheine2009numerical and is included in the MechSys open source multi-physics simulation library galindo2013coupled . In this study, we use two kinds of particles: (1) cubic particles [Fig. 1(a)] and (2) Voronoi-based sphero-poly-hedron particles [Fig. 1(b)]. The complex-shaped particles are modeled with the concept of sphero-polyhedron, which is the object resulting from dilating a polyhedron by a sphere. The overlap between contacting particles and contact force resulting from it can be then calculated galindo2009molecular ; galindo2010molecular .
2.2 Experimental validations
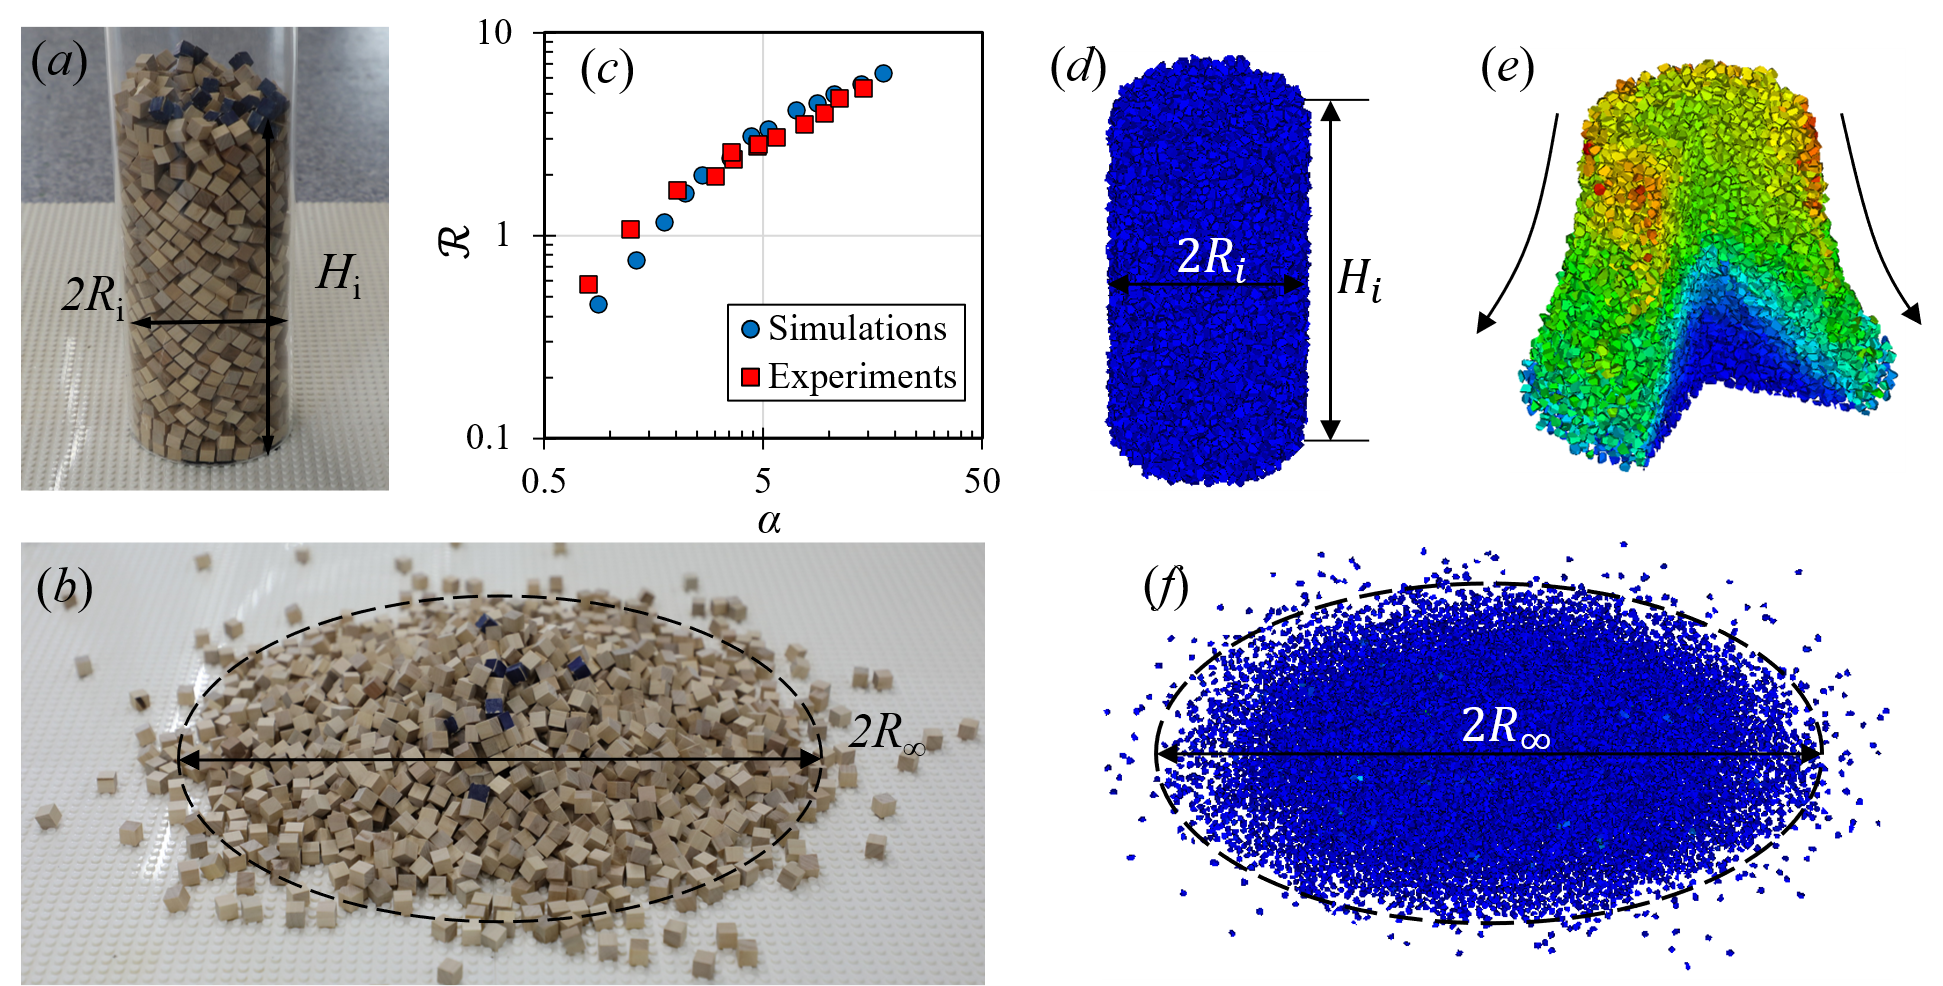
Before diving deeply into the simulation setup, we first validated our DEM model with experiments. We performed experiments on the collapse of granular columns with wooden dice [Fig. 2(a) and (b)] of length 1.0 cm. The density of the dice was 0.681 g/cm3. They were dropped randomly into a circular tube ( cm, where is the internal diameter of the cross-section of the plastic tube, and is the internal radius of the tube.). In the experiments, we used a LEGO board [Fig. 2(a)] as the bottom plate. The frictional coefficient between the board and the wooden dice was measured to be approximately 0.4, and the frictional coefficient between the wooden dice 0.84.
After placing the dice into the plastic tube [Fig. 2(a)], we measured the initial height of the granular packing, . Then, the tube was manually lifted to release all the particles to form a granular pile. The run-out distance was measured as shown in Fig. 2(b). Then, we could measure the final deposition radius, , of the granular pile and calculate the normalized run-out distance and the corresponding initial aspect ratio with the following equation,
| (6a) | ||||
| (6b) | ||||
Thus, as we vary the initial height, , of the granular column, the relationship between and was obtained [ in Fig. 2(c)]. Because the tube was lifted manually, a disturbance would be applied to the granular pile while lifting, thus giving a relatively higher run-out distance when the initial aspect ratio is small.
We then performed numerical simulations with the same set-up as in the experiments of wooden dice [the DEM elements are cubic particles, as shown in Fig. 1(a)], to make sure our simulation set-up could capture the behavior of granular column collapses well. We varied the initial height of the granular column between 5 cm and 100 cm while keeping the initial cross-section diameter constant at 11.4 cm. In both experiments and the corresponding simulations, the number of particles varied from approximately 200 (the shortest column) to approximately 4500. In this set of simulations, we set the inter-particle frictional coefficient , particle/boundary frictional coefficient , and restitution coefficient . Blue markers in Fig. 2(c) show the results of this set of simulations. This shows that our model with a simple contact law represents the experimental data well, especially when the initial aspect ratio is large. When the initial aspect ratio is small, the experimental results tend to be larger than the simulation results. This might be due to the disturbance generated while manually lifting the tube during experiments. when the aspect ratio is small, the effect of lifting the tube during the experiments had significant influence on the run-out distance. It could also be that the frictional coefficient of dice/board contact is more complex than being generalized as one frictional coefficient, and we may have overestimated the frictional coefficient when the aspect ratio is small, which results in smaller run-out distance.
2.3 Simulation setup
Then, to investigate the behavior of granular column collapses and the resulting run-out distances and deposition morphologies, we performed simulations of the granular column collapses with Voronoi-based sphero-polyhedragalindo2009molecular ; galindo2010molecular . We note that the shape of particles (Voronoi-based particles, dice, ellipsoids, spheres, particles with different thickness/length aspect ratios, etc.) could significantly influence of deposition morphology, in this study, we focus on using Voronoi-based particles to investigate a general behavior similar to that of sand particles. The detailed influence of particle shapes on the granular column collapses will be further explored in the future. The number of particles within unit length (1.0 cm) is 5, so the average particle size is mm. Particles were packed within a column of radius equal to 2.5 cm and varying heights leading to cases of different initial aspect ratio [Fig. 2(d)]. Then, 20% of the sphero-polyhedron particles were removed to form a packing with a solid fraction of 0.8. varies from 1 cm to 50 cm. In the simulations of Voronoi-based particles, the number of particles varied from approximately 1900 to approximately 98500. Then, we removed the cylindrical tube in the simulation and let grains flow downward freely with the gravitational acceleration. Figure 2(e) shows the behavior of a granular column in the middle of the collapse. We can see that, the inner part of the column remained stationary, while the outer part of the column started to flow downward and spread outward. In the end, a cone-like pile of granular material with packing height, , and average packing radius, , will form [Fig. 2(f)].
We implemented the Hookean contact model (elaborated in Sect. 2.1) with energy dissipation and restitution coefficient to calculate the interactions between particles as we have described in the above section. A relatively low value of was chosen to represent the rough surface of particles in real conditionsli2020surface . Simulations were conducted with varied initial aspect ratios, , between 0.4 and 20, varied inter-particle frictional coefficients, 0.1, 0.2, 0.3, 0.4, 0.6, 0.8, and particle/boundary frictional coefficients, 0.2, 0.3, 0.4, 0.6, 0.8. Based on these simulations we obtained the run-out behavior and deposition morphology for different conditions.
2.4 Measurement of the run-out distance
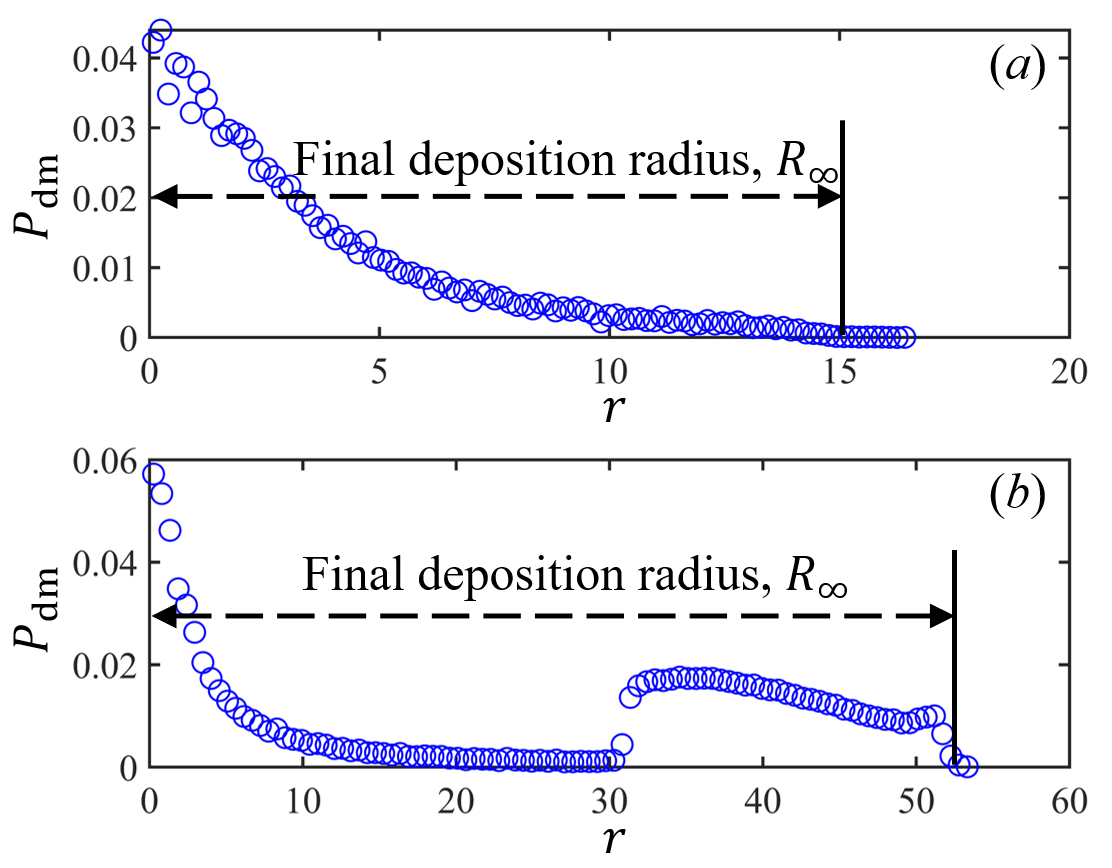
In experiments, since the particles used were wooden dice, the collapsed granular column could form a well-packed granular pile with an almost-circular boundary. We measured the diameters of the final pile along 4 different directions and took the average and divided it by 2 to obtain the final deposition radius. In simulations, the measurement of the final radius is more complicated than that in experiments. In cases with small particle/boundary and inter-particle frictional coefficients but large initial aspect ratios, the spread of particles is far-reaching and leads to sparse (single layer) coverage of the area, especially at the front edge. In these cases, it is difficult to determine the edge/boundary and hence the final run-out distance. Thus, we measured the final radius with a histogram of particle distribution for each simulation. The following figure (Fig. 3) gives us two examples of how we measured the run-out distance.
In this figure, the x-axis is the radial position , and the -axis is the percentage of number of particles located within divided by the radial position,
| (7) |
where is the bin width of the histogram, and is the number of particles located between and , and is the total number of particles in one simulation. Fig. 3(a) shows the normalized particle number distribution (i.e. deposition morphology) of a simulation with , , and cm. It shows that most particles locate within cm; thus, we take cm. Fig. 3(b) displays the particle distribution of a simulation with , , and cm. The results show that, besides particles located in the middle of the final granular pile, a large number of particles are located at the front, and when cm, became 0. Thus, the final radius of the collapsed granular column is 52 cm in this example.
3 Results and discussions
3.1 Run-out distance of granular column collapses
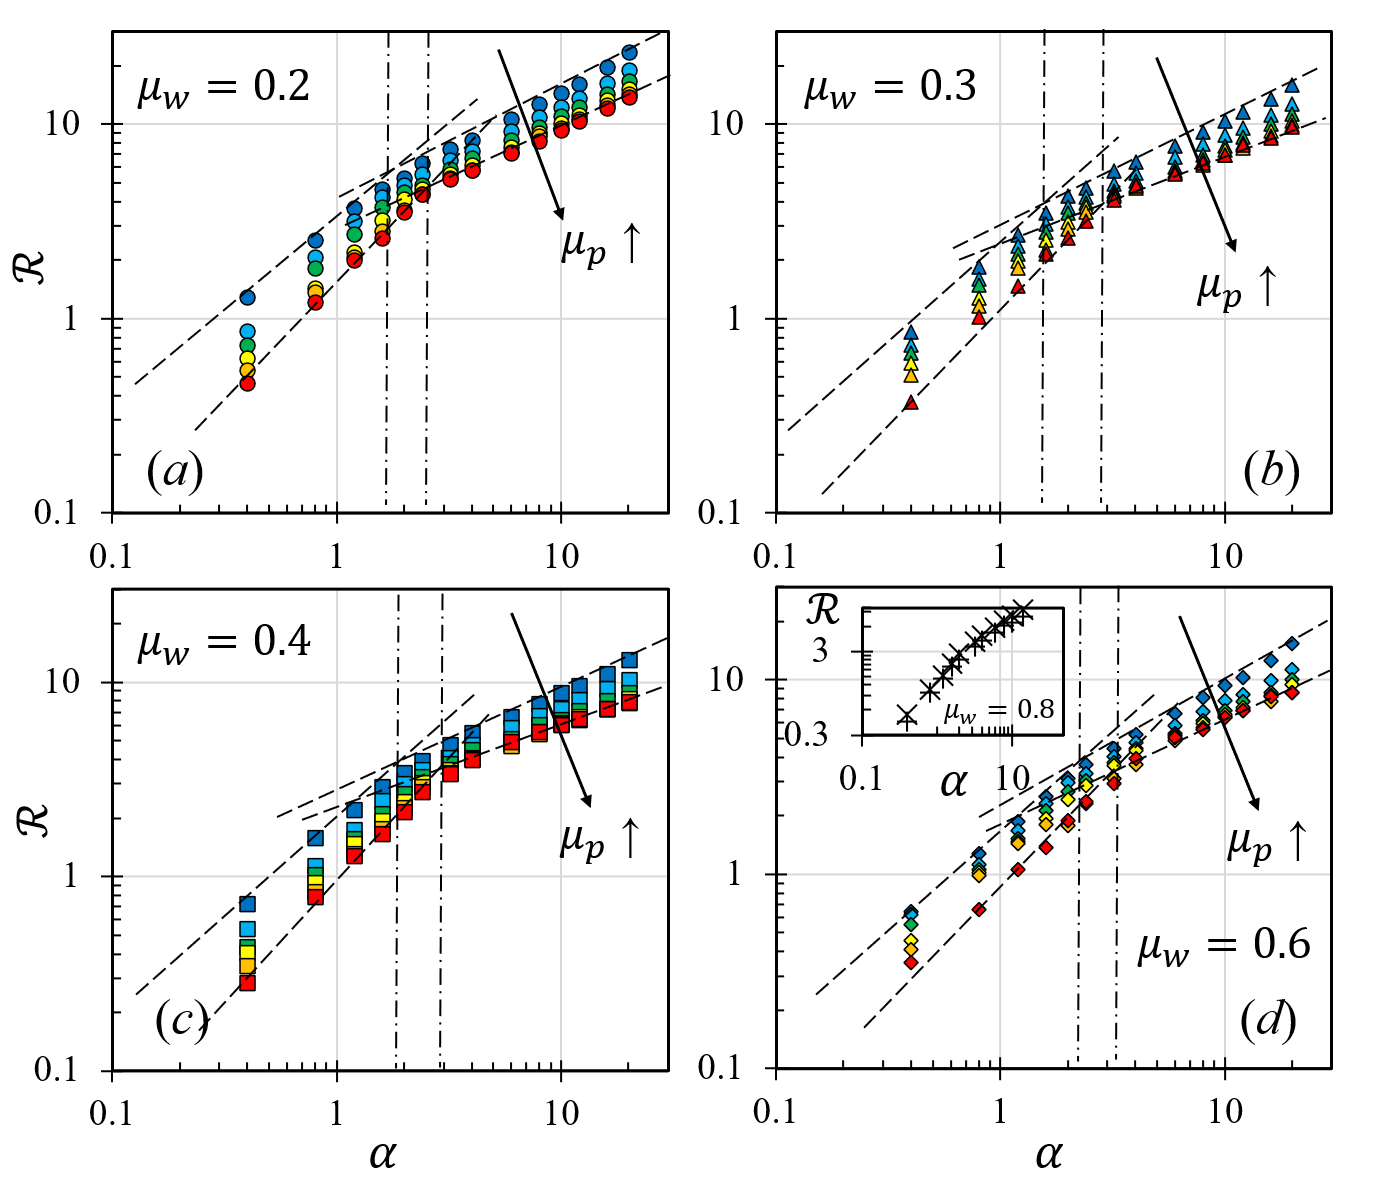
Figure 4 shows relationships between normalized run-out distance and the initial aspect ratio . It shows that both the inter-particle friction and the particle-boundary friction play important roles in the run-out behavior. Similar to results obtained by other research, when is sufficiently small, scales roughly proportional to (). When is larger than a threshold, scales approximately proportional to ().
In each of these figures, as we increase the inter-particle friction, the run-out distance decreases since the additional friction increases the energy dissipation during the collapse. Similar results can be obtained when we increase particle/boundary friction. Although qualitative observations have been witnessed by others, the quantitative influence of inter-particle and particle/boundary friction on the flowing behavior of collapsed granular columns has been absent from previous studies. Also, as we vary the frictional coefficient, the point where the slope changes in the log-log plot of the relationship shifts (dash-dot lines in Fig. 4), which indicates that the change of collapse regimes does not only depend on the of the granular column.
3.2 Deposition morphology
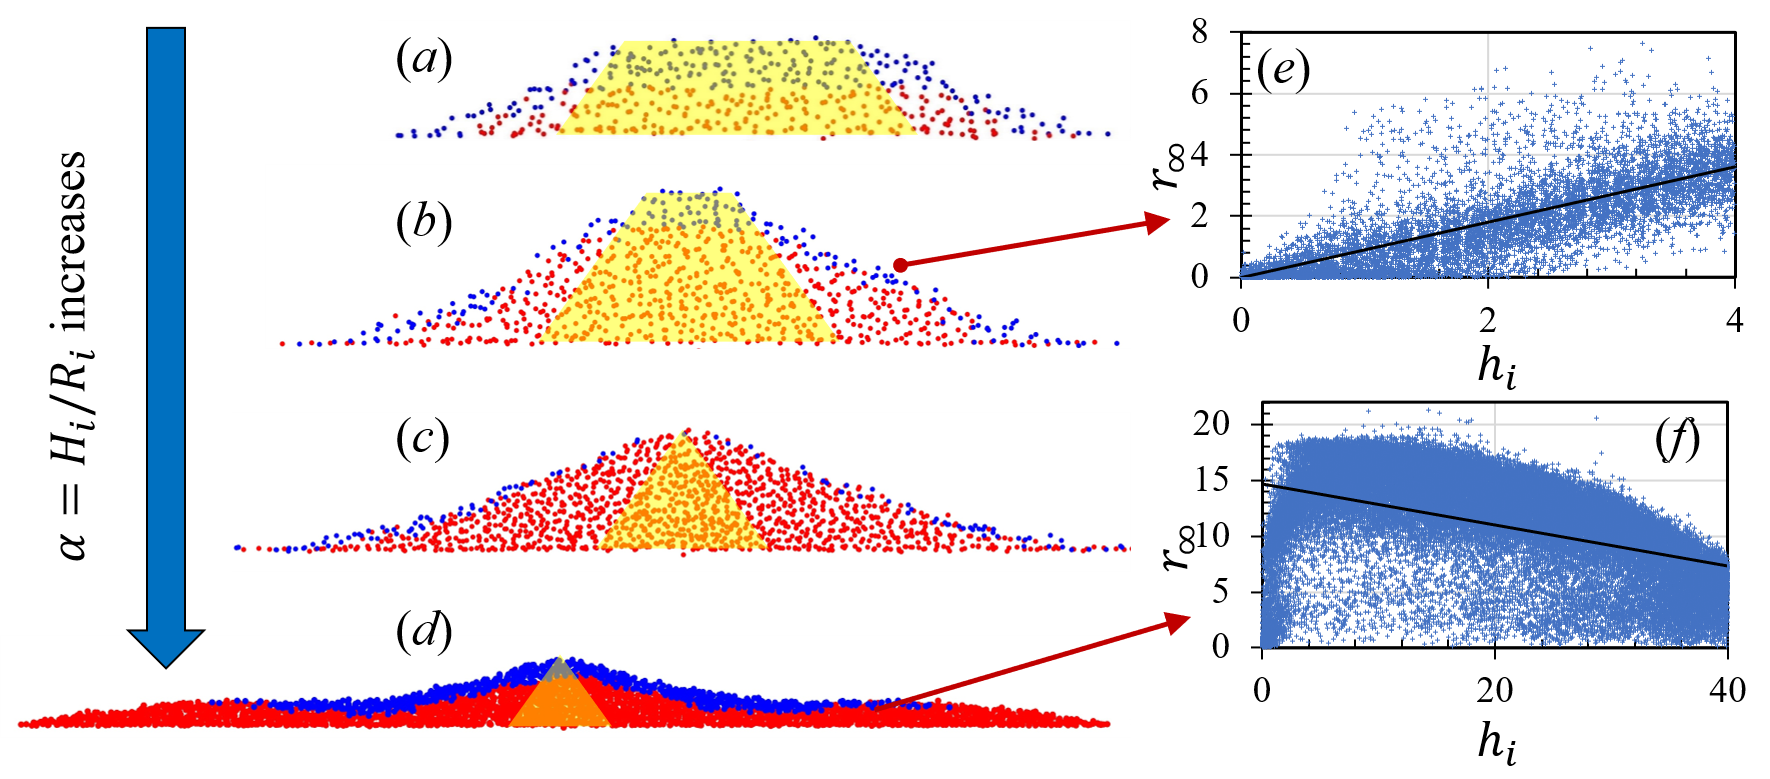
To reveal the deposition morphology, we plot in Fig. 5(a)-(d) the deposition shapes of collapsed granular col-umns with different initial aspect ratios. We also distinguish particles initially located on the top of the column (blue dots) from the rest (red dots), while shading relatively stationary areas in yellow. The results show three different types of deposition morphology. When is small [Fig. 5(a) and (b)], there is a plateau on top of the granular pile, and all blue dots present on top of red dots. In these cases, a large portion of particles remain stationary (yellow shaded area) during the collapse process, and the granular collapse behaves more like a yielded solid. Thus, we call it the quasi-static collapse. As we increase the initial aspect ratio [Fig. 5(c)], more particles flow down and spread out from the top of the column, and the inertial effect of particles starts to overtake the resistance of friction and become the dominating contribution. In these cases, top particles tend to rest at the foot of the final granular pile and during the collapse, surface granular flows (granular avalanches) dominate the behavior of the granular collapse. The final deposition morphology is similar to a typical sand pile. Thus, we name this type the inertial collapse, since inertial effects are dominating the macroscopic behavior. As we further increase , the deposition surface changes to Fig. 5(d). Particles initially on the top end up being in the center of the final granular pile, indicating that during the granular collapse, the top particles are flowing downward while pushing the lower particles out, and the flow behaves more like a liquid. We call this type of granular collapse a liquid-like collapse.
We can also see the transition in the plot of the relationship between the initial height and the final radial position of each particle [Fig. 5(e) and (f)]. When is small [Fig. 5(e)], particles initially on the top tend to collapse to the front. Thus, the two parameters have a positive correlation. When is large [Fig. 5(f)], particles initially on the top no longer reach the front of the final deposition. Thus, the two parameters have a negative correlation.
As we have described, these three morphologies correspond to three collapsing regimes:
-
•
a quasi-static regime, where most bulk materials remain relatively stationary, and a plateau can form after the collapse;
-
•
an inertial regime, where particles initially at the top end up flowing to the front of the final pile;
-
•
a liquid-like regime, where the collapsed granular materials flow like a liquid to form a much more complex morphology, where particles initially at lower height start to accumulate at the front of the flow due to the push-out effect from particles at higher initial heights.
We will elaborate the classification of three different collapse regimes of granular column collapses in following sections.
3.3 Dimensional analysis
We consider the governing equation of the dynamics of a single particle in a granular system to be
| (8) |
where is the particle mass, and are normal and tangential contact forces acting on a particle, is the unit vector in the direction of gravitational acceleration. We non-dimensionalize the governing equation with particle size , gravitational acceleration , column height , and column radius so that,
| (9) |
where , , and are dimensionless time, dimensionless velocity, and dimensionless position vector, respectively. The dimensionless mass is . The normal force acting on particles can be non-dimensionalized using,
| (10) |
where is a function of the solid fraction and we simplify the tangential force acting on particles as , thus, The combination of normal and tangential forces can be written in the following form,
| (11) |
where is a function of the frictional coefficient, is the unit vector along the summation vector of the normal and tangential forces, and the governing equation can be non-dimensionalized in the following way,
| (12) | ||||
We divide the governing equation by the parameter of the left-hand side of the equation and could obtain two dimensionless numbers in front of the two term on the right-hand side of the equation,
| (13a) | ||||
| (13b) | ||||
where coincides with the initial aspect ratio and combines the influence of the initial solid fraction, the friction properties, and the size effect . This implies that, in addition to , we may come up with another dimensionless number to describe the behavior of granular column collapses. It is noted that we do not consider the size effect in this study and remains constant. The detailed analysis of and the relatively optimal form of it is discussed in the following section.
3.4 Effective aspect ratio
In previous section, we find that the granular column collapse might be governed by both and , while previous research argued that the run-out distance of a collapsed dry granular column is controlled almost entirely by the initial aspect ratio with little qualitative influence of friction. The square root of can be seen as an effective aspect ratio. Since in this study we do not consider the size effect and the influence of the initial solid fraction, the effective aspect ratio, , can be reduced to the following form,
| (14) |
where is a general frictional coefficient of the granular system, which can be considered as a combination of both the inter-particle friction and the particle-boundary friction. We find that, to collapse all the data in the relationship between the normalized run-out distance and the effective aspect ratio, should take the form of
| (15) |
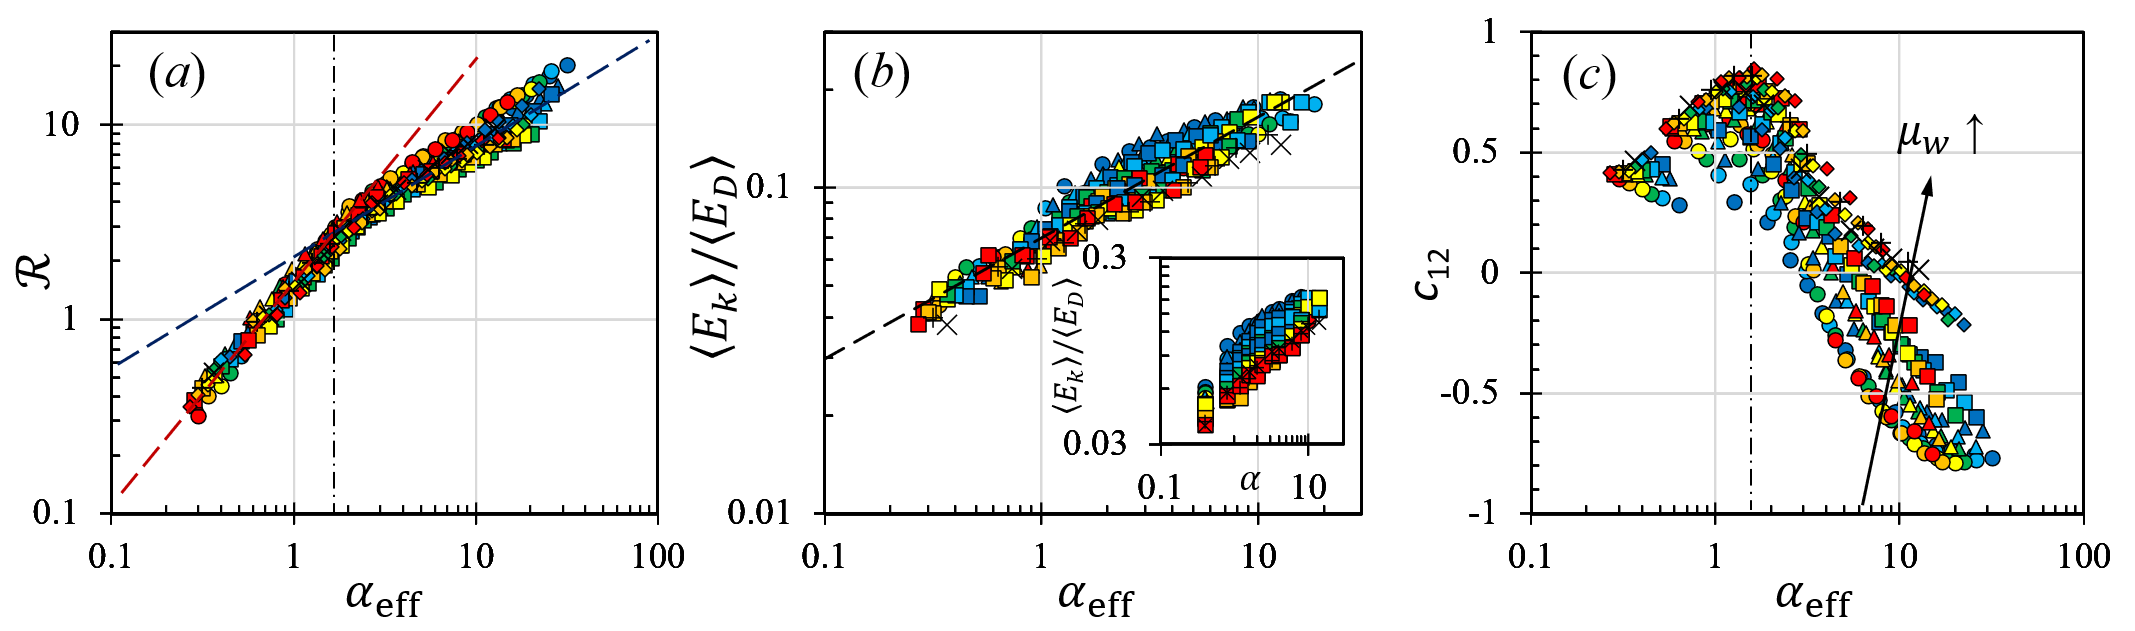
where is the frictional coefficient between particles and the bottom boundary, is the frictional coefficient between particles, and is a fitting parameter, and best fits the simulation data in Fig. 6(a) where we plot the relationship between the normalized run-out distance and the effective aspect ratio [thus, and the collapsed relationship is not sensitive to ]. The parameter can be roughly seen as a ratio between energy dissipated by inter-particle friction to that by particle/boundary friction. indicates that the particle/boundary friction-induced energy dissipation plays a lesser role in the frictional energy dissipation. With , simulation results with different inter-particle friction and particle/boundary friction almost all collapse onto a single master curve, except when and . In contrast to previous studies, for which is the only criterion to indicate a regime change [where the slope of changes] and no influence of frictional coefficient was quantitatively considered, we find that, as depicted in Fig. 6(a), the slope change in the relationship occurs at a unique value of for all cases. This indicates that is almost entirely controlled by , which includes the influence of both inter-particle and particle/boundary friction, rather than alone. The reason why run-out distances for deviate from other cases is that under low particle-boundary friction, granular columns tend to form only one layer of particles with few inter-particle contacts, thus increasing the scattering condition. In other cases, particles have a more resistant reaction with the boundary condition and adjacent particles, where the kinetic energy of particles can be quickly dissipated.
We also analyze the data from the viewpoint of energy consumption. For each simulation, we obtained the kinetic energy at time , and calculated the time averaged kinetic energy using
| (16) |
where is the terminating time of the granular column collapse. The kinetic energy can be seen as the trace of the inertial stress generated during the collapse of granular column. We then calculated the time averaged dissipated energy
| (17) |
where is the potential energy of the system at time and is the initial potential energy. We plot the ratio between and with respect to in Fig. 6(b), which shows that has a power-law correlation with , whereas the data points fail to collapse onto a power-law relation when we use as the -axis [inset of Fig. 6(b)]. This indicates that the effective aspect ratio is linked not only to the ratio between inertial stresses and frictional stresses, but also to the energy consumption ratio during the collapse.
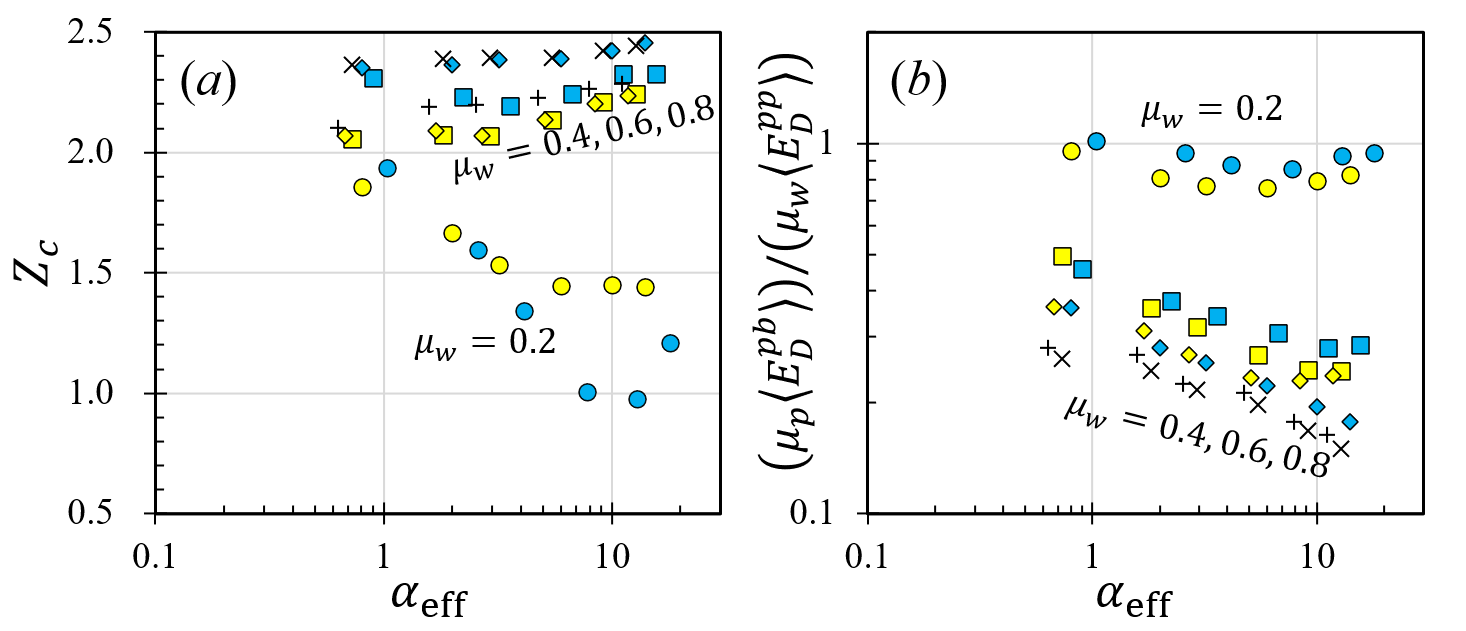
To analyze the influence of inter-particle friction and particle/boundary friction separately, in Fig. 7(a) we plot the relationship between the final coordination number, , and , where stands for the average number of inter-particle contacts one particle has inside a granular assembly. When , , which means that a cone-shape granular pile can be formed after the granular column collapse. However, when and is large, is decreased to between 1.0 and 1.5, which indicates that most particles are scattered on the plane with almost no inter-particle contacts. This fits our assumption that, when is small, the influence of particle/boundary interactions should be larger than other cases, hence, might be no longer valid.
We then studied the ratio of the contribution from particle-boundary friction and that from inter-particle friction, and then connected this ratio of contributions with the energy dissipated by those two kinds of frictions, , where is the time average of the energy dissipated by particle-boundary frictions, and stands for the time average of the energy dissipated by particle-particle frictions, so . We plotted against in Fig. 7(b). For most cases, this ratio remains less than 0.5, while for cases with , this ratio is much larger, which fits our assumption that the contribution of particle-boundary friction exceeds our expectation and the energy dissipation from particle-boundary friction becomes the major dissipation source when the particle-boundary frictional coefficient is sufficiently small. This also implies that, when particle/boundary friction is small, could not hold. More detailed analyses on particle-scale contact forces between particles and the boundary should be particularly investigated to verify this hypothesis in the future.
We also hypothesize that the effective aspect ratio might reflect the ratio between the inertial effect and the frictional effect during the collapse of granular columns. According to Bagnold bagnold1954experiments ; hill2011rheology , in a dry granular flow, the inertial stresses scale with , where was a function of the solid fraction and he took the distance between adjacent particles in the flowing (or shearing) direction as the characteristic length. We interpret as a rate change of unit deformation, and as a length scale in the flowing direction. In our case, we simplify as , which is the ratio between a characteristic velocity when particles fall over the length of and the length scale, , over which the deformation occurs. Meanwhile, is replaced with , giving the inertial stresses . Additionally, the frictional stress can be calculated as , where is the solid fraction at the initial state. Thus the ratio between the two stresses can be obtained as
| (18) |
If we regard the general frictional coefficient as a linear combination of the inter-particle frictional coefficient and the particle-boundary frictional coefficient, , with being a fitting parameter, and take the square root of this stress ratio, we can recover an effective aspect ratio with similar form as what we have obtained in Eq.14 and Eq.15,
| (19) |
which suggests that the effective aspect ratio may have a deeper origin than what we have discovered in the dimensional analysis and could reflect a competition between different forms of stresses during the collapse of granular columns.
3.5 Correlation analysis and regime transition
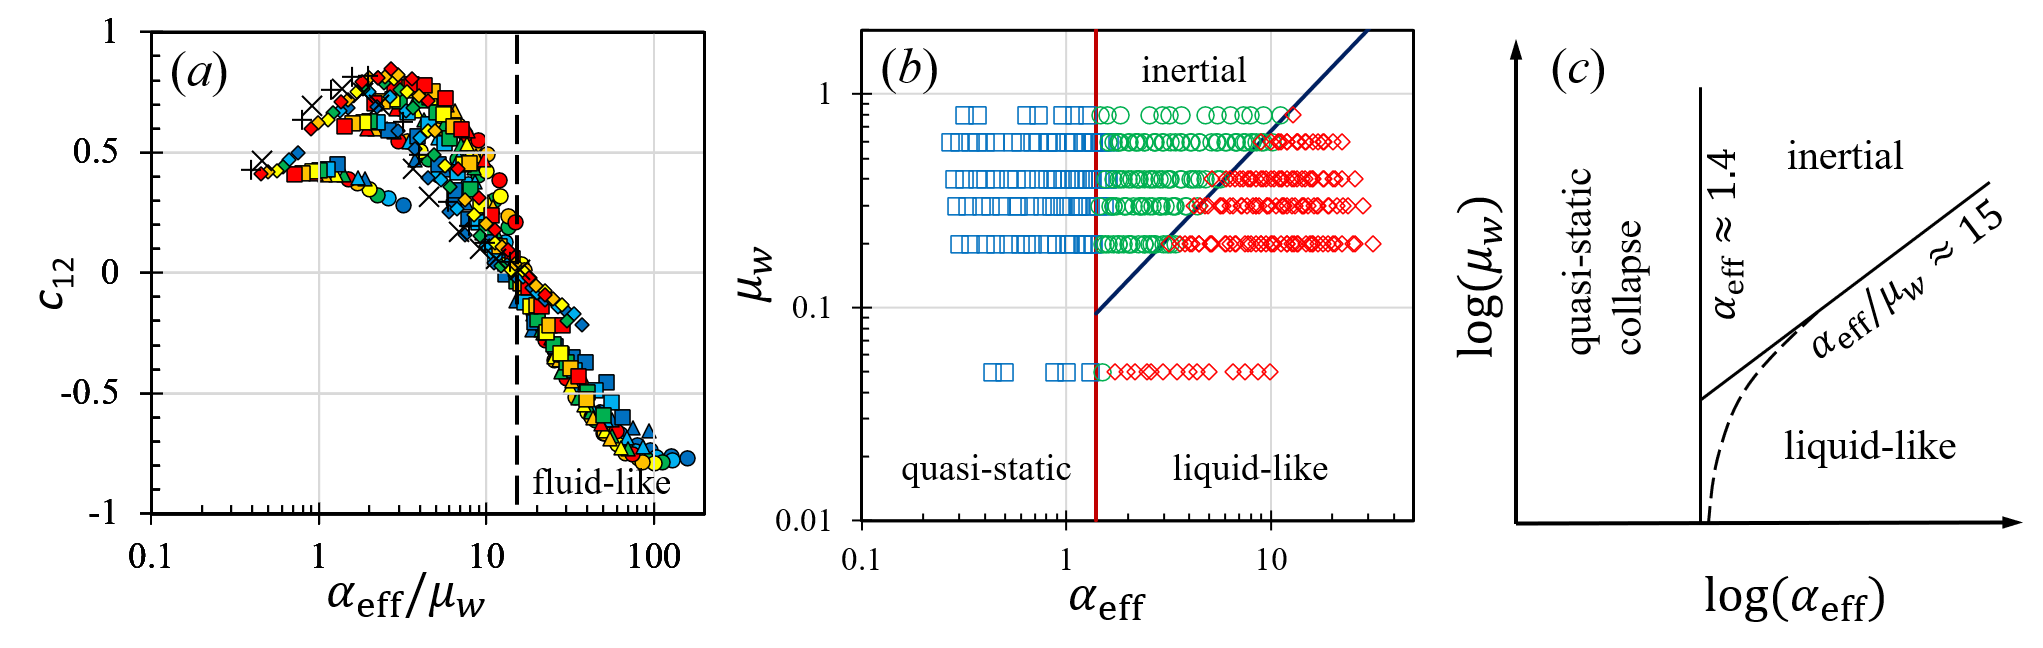
Figure 6(a) shows that the collapse of granular columns has two separate regimes based on the value of . However, according to the analysis of the deposition morphology, these granular flows should have three different regimes. To better investigate these regimes in connection to the deposition morphology, we analyze the relationship between the initial height, , and the final radial position, (or the run-out distance, ) of each particle. Such a relationship can help us better understand how particles end up being in different positions. The correlation coefficient between and can then be obtained as
| (20) |
where is the correlation coefficient between and of particles in a collapsed granular column, is the covariance functionfrangopol2008probability , is the standard deviation of all the initial height data in one system, and is the standard deviation of all the run-out distances of particles in one system. When is positive, more particles initially at the top of a granular column end up at the foot of the deposited pile, whereas when is negative, more particles initially at the top cannot even reach the foot and more frequently end in the interior of the deposited granular packing, in which case, the collapse of granular columns behaves more like a fluid where top layer particles push the bottom layer particles away as they fall downward.
Figure 6(c) plots the relationship between and . Both frictional coefficient and have great influence on how the evolves. When is small, is positive, and as we increase , increases accordingly and eventually reaches a maximum, which corresponds to the turning point in the relationship in Fig. 5(a). The value that corresponds to the maxima of is a threshold which divides the quasi-static collapse and the inertial collapse. When is larger than this threshold, starts to decrease, and, at a certain point, it becomes negative, where the collapse of a granular column is in the liquid-like regime.
However, the point when systems change from an inertial regime to a liquid-like regime depends not only on but also on other factors, as shown in Fig. 6(c), where the point of crossing the -axis is different for cases with different . Interestingly, if we plot against instead [Fig. 8(a)], the place where passes zero collapses onto one point, , which means that the transition from an inertial regime to a liquid-like regime depends on . Based on these analyses, a phase diagram of the collapse of granular columns can be obtained as Fig. 8(b), where the collapse regime depends on both and . More specifically, the transition between quasi-static collapse and inertial collapse or liquid-like collapse depends only on the value of . In contrast, the transition between the inertial regime and the liquid-like regime depends on the ratio between and . It shows that the slope change in the relationship (in log-log scale) corresponds to the regime change from quasi-static collapsing to the other two regimes. This change is solely governed by the effective aspect ratio. Physically, it indicates that the inertial force needs to be above a certain threshold to overcome the frictional force (linear combination of the inter-particle friction and particle-boundary friction).
On the other hand, the change from an inertial collapse to a liquid-like collapse is mainly governed by . When the granular column collapse is in a liquid-like regime, the curvature of the collapsed pile becomes non-monotonic and shows a more complex pattern. In this case, the initially top particles, instead of flowing to the front of the flow, end up flowing downward to push sub-layer particles to the front so that becomes negative. It should be noted that we also performed simulations with , and expected a direct change from quasi-static collapsing to liquid-like collapsing. However, there is still one case showing granular column collapse in the inertial regime [Fig. 8(b)]. Thus, we suspect that when is approaching , the regime change between an inertial regime and a liquid-like regime should follow the dashed curve in Fig. 8(c). It should also be noted that since our definition of includes the packing solid fraction, it can be potentially useful in describing the behavior of granular column collapse with different initial packing fractions. Details of the influence of packing fraction will be further investigated in future publications.
4 Conclusions
In this paper, we analyzed the scaling of the run-out distance and deposition morphology of collapsed granular columns with respect to the aspect ratio based on numerical simulations. A dimensionless number , which is derived from dimensional analysis and includes influences of the frictional coefficient (inter-particle and particle-boundary), the initial aspect ratio, and the initial solid fraction, is proposed. The can also be linked to the ratio between kinetic energy and collisionally dissipated energy. We showed that relationships collapsed onto one curve for cases with different inter-particle and particle/boundary frictions. However, when and is sufficiently large, the run-out distance is relatively larger than the prediction given by the mentioned collapsed curve. This is because when is small, particles tend to form a large area of one layer particles. During the formation of this one layer of particles, particle-boundary contacts dominate the sliding behavior of particles, while inter-particle contact becomes less frequent and less important.
Based on the correlation between the initial position and final position of particles, we further classify the collapse of granular columns into three regimes (quasi-static, inertial, and liquid-like), which are controlled by both and . This study shows that the boundary friction can be crucial to the final deposition of a collapsed granular column, which brings insight to the behavior of landslides or debris flows in future studies. The introduction of the solid fraction in , although it plays no role in this study, could bring opportunities to understand better in coming studies how the initial packing of granular materials influences the collapsing dynamics of granular materials in both sub-aerial and sub-aqueous environment. Additionally, the results of this paper have led us to further explore the intriguing collapsing behavior when the cross-section of the granular column is no longer axisymmetric. It should be noted that granular materials have size effect. We find that the relative size of a granular column, , could influence the run-out behavior (which was also observed by Warnett et al.warnett2014scalings and Cabrera et al.Cabrera2019Granular ) and regime transitions. The different and exciting new results related to the influence of column size, column cross-section shape, as well as particle shapes will be presented in another publication.
Acknowledgements.
The authors acknowledge the financial support from Westlake University and thank the Westlake University Supercomputer Center for computational resources and related assistance. T.M. would like to thank Prof. K. M. Hill from the University of Minnesota for helpful discussions. The authors specifically thank Prof. L. Staron for her helpful comments on an earlier version of this paper.Compliance with ethical standards
Conflict of interest
The authors declare that they have no conflict of interest.
References
- (1) Alonso-Marroquin, F.: Spheropolygons: A new method to simulate conservative and dissipative interactions between 2d complex-shaped rigid bodies. EPL (Europhysics Letters) 83(1), 14001 (2008)
- (2) Alonso-Marroquín, F., Ramírez-Gómez, Á., González-Montellano, C., Balaam, N., Hanaor, D.A., Flores-Johnson, E., Gan, Y., Chen, S., Shen, L.: Experimental and numerical determination of mechanical properties of polygonal wood particles and their flow analysis in silos. Granular Matter 15(6), 811–826 (2013)
- (3) Bagnold, R.A.: Experiments on a gravity-free dispersion of large solid spheres in a newtonian fluid under shear. Proceedings of the Royal Society of London. Series A. Mathematical and Physical Sciences 225(1160), 49–63 (1954)
- (4) Belheine, N., Plassiard, J.P., Donzé, F.V., Darve, F., Seridi, A.: Numerical simulation of drained triaxial test using 3d discrete element modeling. Computers and Geotechnics 36(1-2), 320–331 (2009)
- (5) Cabrejos-Hurtado, J., Galindo Torres, S., Pedroso, D.: Assessment of the mechanical behaviour of granular media by dem-based true triaxial tests. In: Applied Mechanics and Materials, vol. 846, pp. 428–433. Trans Tech Publ (2016)
- (6) Cabrera, M., Estrada, N.: Granular column collapse: Analysis of grain-size effects. Physical Review E 99(1) (2019). DOI 10.1103/PhysRevE.99.012905
- (7) Cassar, C., Nicolas, M., Pouliquen, O.: Submarine granular flows down inclined planes. Physics of Fluids 17(10), 103301 (2005)
- (8) Cundall, P.A., Strack, O.D.L.: A discrete numerical model for granular assemblies. Geotechnique 29(1), 47–65 (1979)
- (9) Frangopol, D.M.: Probability concepts in engineering: emphasis on applications to civil and environmental engineering (2008)
- (10) Galindo-Torres, S.: A coupled discrete element lattice boltzmann method for the simulation of fluid–solid interaction with particles of general shapes. Computer Methods in Applied Mechanics and Engineering 265, 107–119 (2013)
- (11) Galindo-Torres, S., Pedroso, D.: Molecular dynamics simulations of complex-shaped particles using voronoi-based spheropolyhedra. Physical Review E 81(6), 061303 (2010)
- (12) Galindo-Torres, S., Zhang, X., Krabbenhoft, K.: Micromechanics of liquefaction in granular materials. Physical Review Applied 10(6), 064017 (2018)
- (13) Galindo-Torres, S.A., Alonso-Marroquín, F., Wang, Y., Pedroso, D., Castano, J.M.: Molecular dynamics simulation of complex particles in three dimensions and the study of friction due to nonconvexity. Physical Review E 79(6), 060301 (2009). DOI https://doi.org/10.1103/PhysRevE.79.060301
- (14) Hill, K.M., Yohannes, B.: Rheology of dense granular mixtures: Boundary pressures. Physical Review Letter 106(5), 058302 (2011)
- (15) Jop, P., Forterre, Y., Pouliquen, O.: A constitutive law for dense granular flows. Nature 441(7094), 727 (2006)
- (16) Kermani, E., Qiu, T., Li, T.: Simulation of collapse of granular columns using the discrete element method. International Journal of Geomechanics 15(6), 04015004 (2015)
- (17) Lagrée, P.Y., Staron, L., Popinet, S.: The granular column collapse as a continuum: validity of a two-dimensional Navier–Stokes model with a (I)-rheology. Journal of Fluid Mechanics 686, 378–408 (2011)
- (18) Lai, Z., Vallejo, L.E., Zhou, W., Ma, G., Espitia, J.M., Caicedo, B., Chang, X.: Collapse of granular columns with fractal particle size distribution: Implications for understanding the role of small particles in granular flows. Geophysical Research Letters 44(24), 12–181 (2017)
- (19) Lajeunesse, E., Monnier, J., Homsy, G.: Granular slumping on a horizontal surface. Physics of Fluids 17(10), 103302 (2005)
- (20) Li, X., Dong, M., Jiang, D., Li, S., Shang, Y.: The effect of surface roughness on normal restitution coefficient, adhesion force and friction coefficient of the particle-wall collision. Powder Technology 362, 17–25 (2020)
- (21) Lube, G., Huppert, H.E., Sparks, R.S.J., Freundt, A.: Collapses of two-dimensional granular columns. Physical Review E 72(4), 041301 (2005)
- (22) Lube, G., Huppert, H.E., Sparks, R.S.J., Hallworth, M.A.: Axisymmetric collapses of granular columns. Journal of Fluid Mechanics 508, 175–199 (2004)
- (23) Man, T.: Rheology of granular-fluid systems and its application in the compaction of asphalt mixtures. Ph.D. thesis, University of Minnesota (2019)
- (24) Man, T., Feng, Q., Hill, K.M.: Rheology of thickly-coated granular-fluid systems. arXiv preprint arXiv:1812.07083 (2018)
- (25) MiDi, G.D.R.: On dense granular flows. The European Physical Journal E 14(4), 341–365 (2004)
- (26) Pouliquen, O., Cassar, C., Jop, P., Forterre, Y., Nicolas, M.: Flow of dense granular material: towards simple constitutive laws. Journal of Statistical Mechanics: Theory and Experiment 2006(07), P07020 (2006)
- (27) Pournin, L., Liebling, T.M.: A generalization of distinct element method to tridimensional particles with complex shapes. Tech. rep., AA Balkema Publishers (2005)
- (28) Staron, L., Hinch, E.: Study of the collapse of granular columns using two-dimensional discrete-grain simulation. Journal of Fluid Mechanics 545, 1–27 (2005)
- (29) Staron, L., Hinch, E.: The spreading of a granular mass: role of grain properties and initial conditions. Granular Matter 9(3-4), 205 (2007)
- (30) Trepanier, M., Franklin, S.V.: Column collapse of granular rods. Physical Review E 82(1), 011308 (2010)
- (31) Trulsson, M., Andreotti, B., Claudin, P.: Transition from the viscous to inertial regime in dense suspensions. Physical Review Letter 109(11), 118305 (2012)
- (32) Warnett, J., Denissenko, P., Thomas, P., Kiraci, E., Williams, M.: Scalings of axisymmetric granular column collapse. Granular Matter 16(1), 115–124 (2014)
- (33) Zenit, R.: Computer simulations of the collapse of a granular column. Physics of Fluids 17(3), 031703 (2005)
- (34) Zhang, X., Krabbenhoft, K., Sheng, D.: Particle finite element analysis of the granular column collapse problem. Granular Matter 16(4), 609–619 (2014)
- (35) Zhang, X., Wu, Y., Zhai, E., Ye, P.: Coupling analysis of the heat-water dynamics and frozen depth in a seasonally frozen zone. Journal of Hydrology p. 125603 (2020). DOI https://doi.org/10.1016/j.jhydrol.2020.125603