The TRIMS Collaboration
Beta decay of molecular tritium
Abstract
The beta decay of tritium in the form of molecular TT is the basis of sensitive experiments to measure neutrino mass. The final-state electronic, vibrational, and rotational excitations modify the beta spectrum significantly, and are obtained from theory. We report measurements of the branching ratios to specific ionization states for the isotopolog HT. Two earlier, concordant measurements gave branching ratios of HT to the bound ion of 89.5% and 93.2%, in sharp disagreement with the theoretical prediction of 55-57%, raising concerns about the theory’s reliability in neutrino mass experiments. Our result, 56.5(6)%, is compatible with the theoretical expectation and disagrees strongly with the previous measurements.
The discovery of neutrino oscillations and mass Fukuda et al. (1998); Ahmad et al. (2001) signals a contradiction to a prediction of the minimal standard model, and opens a window to the physics that lies beyond. Oscillations link the squares of the masses via their differences, but do not give values for the masses themselves. The recent KATRIN result from tritium beta decay gives an upper limit of 1.1 eV on each mass Aker et al. (2019). An intensive effort continues to determine the masses experimentally Drexlin et al. (2013). A laboratory measurement will constrain rates for the hypothesized neutrinoless double beta decay process and help disentangle correlated parameters in cosmological models Choudhury and Choubey (2018).
The most sensitive direct method for probing the neutrino mass is by examining the beta spectrum of tritium near the end point. The shape of the beta spectrum there is affected by molecular excitations, which must be calculated with great precision in order to be confident in the additional contribution of a non-zero neutrino mass Bodine et al. (2015). While these ‘final-state’ calculations can in principle be taken to arbitrary accuracy since the force is known, in practice approximations are necessary. Indeed, the first precision experiments with TT Robertson et al. (1991); Stoeffl and Decman (1995) produced apparently negative values of , a result that has been traced Bodine et al. (2015) to inadequacies in the final-state theory in use at the time (for brevity we write H for 1H, T for 3H, and He for 3He). Those shortcomings have been eliminated in the work of Saenz, Jonsell, and Froehlich Jonsell et al. (1999); Saenz et al. (2000) using overlap integrals and a geminal basis for the parent and daughter molecules. Even so, the root-mean-square spread of final states in the region of interest must be known to 1% in order for KATRIN Aker et al. (2019) to meet its 0.2-eV sensitivity goal.
One puzzling discrepancy remains. In the 1950s, two experimental studies of the molecular ions made in the beta decay of HT and TT were carried out using mass spectrometers Snell et al. (1957); Wexler (1959); Wexler and Porter (1969), and both indicated that 90 to 95% of decays lead to the bound molecular ion or . Theory, however, predicts the fraction to be at most 57% (Table 1). The electronic ground state of and is bound by 2 eV, but lepton recoil can excite rotational-vibrational states that are energetically unbound. Most of the latter states are hindered from dissociation by their angular momentum, and thus quasibound.
| Snell et al. | Wexler | Theory | |||
| Snell et al. (1957) | Wexler (1959) | Jonsell et al. (1999); Saenz et al. (2000) | |||
| Molecule | Quasibound | Bound | Total | ||
| HT | 0.932(19) | 0.895(11) | 0.02 | 0.55 | 0.57 |
| TT | – | 0.945(6) | 0.18 | 0.39 | 0.57 |
The theory might indeed be in error, one of many hypotheses advanced Bodine et al. (2015) to explain the disagreement. Strictly, the theory applies to the endpoint whereas the experiments integrate over the entire beta spectrum. Unidentified systematic errors may have affected the measurements. However, none of these explanations seems likely to accommodate such a large disagreement.
We present new measurements of the branching ratios for HT and TT with a novel time-of-flight mass spectrometer, TRIMS (Tritium Recoil Ion Mass Spectrometer). Modern neutrino mass experiments rely on TT, but the underlying theory for HT and TT decay is the same, predicting a fraction of 0.57 (the distinction between bound and quasibound is immaterial for neutrino mass experiments). The heteronuclear parent HT permits clear separation of all ionic final states, and the quasibound fraction is smaller, making HT the better choice for a decisive experimental test of the theory.
The beta decay of tritium in the form of HT gas produces the positively charged ions , , , and . The negative ion can also be produced but is expected to be rare. When TT is also present, and are produced. Electrons produced include the beta itself and 0, 1, or 2 shakeoff electrons.
In TRIMS, ions and electrons move under the influence of collinear, uniform magnetic and electric fields toward silicon detectors located at either end of a decay chamber (Fig. 1). The start time is set by the arrival of an electron in the ‘beta’ detector at the anode end, and the position in the chamber where the decay occurred is determined by the energy acquired by a positive ion en route to the ‘ion’ detector at the cathode end. The ion mass-to-charge-squared ratio is then given by
| (1) |
where is the ion’s flight time and is the uniform electric field in the chamber. Not shown, but included in the analysis, is a correction for a drift space in front of the ion detector.
A Monte Carlo simulation using the GEANT4 toolkit Agostinelli et al. (2003); Allison et al. (2016) was developed to guide design and study the influence of various systematics. The simulated energy and timing at the detectors are smeared by measured detector resolutions. Also incorporated in the simulation are electron backscattering Dondero et al. (2018) and the deposited ion energy predicted by SRIM Ziegler et al. (2010).

The apparatus Bodine (2015) at the University of Washington consists of a metal-sealed ultra-high-vacuum system with an ion pump, two SAES getter pumps with ST-101 alloy, a liquid nitrogen cold trap, and a turbomolecular pump. After baking, it reaches a base pressure of mbar.
The decay chamber (Fig. 1) is a National Electrostatics acceleration column, made of alternating Kovar alloy and alumina rings brazed together. Shaped aluminum rings mounted to the Kovar rings and biased by a chain of 76 1-G 1% resistors establish a uniform voltage gradient of 281 V/mm. Four external magnet coils produce a 0.236-T magnetic field uniform to % throughout the decay chamber. COMSOL calculations Sjodin and Kan (2015) showed that the field was not significantly affected by the Kovar rings.
At the anode end is a stainless-steel disk, gold-plated to reduce emission of secondary ions, with a circular opening for the beta detector to look through. At the cathode end is an 85%-transmitting stainless-steel mesh mounted under tension on a metal ring. It is electrically isolated and held 100 V below ground to suppress secondary electrons from the ion detector, located 29 mm behind the mesh.
With the chamber isolated, commercially supplied gaseous tritium is introduced through a leak valve to a partial pressure of mbar in normal operation. The total pressure, mostly H2, is monitored via a spinning-rotor gauge to avoid pumping of the gas by ionization gauges, and rises mbar/hr. Slow-control data from devices are sent to a PostgreSQL database on a remote server.
Silicon detectors with 50-mm2 area and 0.5-mm thickness (Canberra PD50-11-500AM), are mounted on movable re-entrant arms containing custom, low-noise, miniature preamplifiers mounted directly on the feedthrough pin for minimal connection capacitance, and cooled to C with CO2 Joule-Thomson coolers. By means of two translation stages, the ion detector can be moved up to 25 mm off-axis in any direction to measure radial distributions. The detector signals, transmitted through fiber optics, are digitized with a 12-bit 250-MHz digitizer that is triggered when either signal is above a discriminator threshold. The digitizer outputs are read out with the ORCA data acquisition software Howe et al. (2004) and translated into ROOT Brun and Rademakers (1997) format. To obtain the signal amplitudes, two consecutive trapezoidal filters are applied on each waveform Jordanov and Knoll (1994); Amsbaugh et al. (2015). The trigger time for each waveform is obtained by fitting a Woods-Saxon (or logistic) function Woods and Saxon (1954) to the waveform. The fit reduces the effect of electronic noise at low pulse amplitudes. The large-signal (90 keV) timing resolution is 4 ns FWHM, which is broadened by noise to 35 ns for signals at 10 keV.
Calibrated with 241Am gammas, the beta and ion detector energy resolutions were 2.46 and 2.05 keV FWHM, respectively. The ionization-yield energy calibration of the detectors is established with gammas, accelerated secondary electrons, and electronic pulser signals. Unlike gammas, ions lose energy in semiconductor detectors in the dead layer and to nuclear scattering. To account for these effects, the stopping power tables of SRIM Ziegler et al. (2010) are numerically integrated to derive the ionization yield, or ‘detected energy’, as a function of incident energy for each particle type. The yields are fitted with cubic polynomials to give the detected energy for a given true incident energy over the range of interest. The converse gives the corrected, true energy for each ion species, with fitting errors keV. The ion detector gain was monitored in situ from two-ion H++He+ events wherein the initial beta is not detected and the strikes the mesh, dislodging a secondary electron that is detected. The protons passing through to the detector form a continuous energy band terminating at true energies of 59.7 keV, the acceleration potential across the chamber. That constraint also yields the dead layer thickness, 75(20) nm.
For the purposes of calculating charge and mass spectra (Fig. 2) for He was used. Once events had been grouped by charge and mass, the effective fiducial ‘volume’ (FV) for each species was determined from the range of true energies accepted from the acceleration chamber, which depends (slightly) on the particular ion because the energy cut, 20 to 40 keV, is placed on detected, rather than true, energy. Ions can be backscattered and lost, effects also modeled with the aid of SRIM. The loss percentages and fiducial volumes are included in Table 2.
During a typical 1-hr HT data run, TT was introduced to the desired count rate, limited to s-1 to avoid deadtime and pileup. HT is created by exchange between the introduced TT and the HH outgassing from the walls, catalyzed by platinum-group metals present in vacuum-gauge filaments Norton and Richards (1974). The gauges could be valved off from the rest of the system, allowing measurements to be taken with predominantly HT or predominantly TT. Catalytic conversion proceeded with a time constant of 8 min to an asymptotic HT activity fraction of 95%.
The decay channels for HT are listed in Table 2. Most decays lead to the single-charge ‘main’ branches, 2, 3, and 4. In cases where two positive ions and two or more electrons are produced in the final state, the different detectable configurations are listed under the primary channel responsible for producing them (e.g., 6a, 6b, etc.). These combinatorial situations are treated in analysis. Only charged-particle final states are included: for the bound-state beta decay branch, 1, Bahcall Bahcall (1961) calculates 0.69% in the case of a bare tritium ion.
Fundamentally, the branching ratio is the fraction of coincidence events with a beta that lead to a specific final channel (see Table 2). Details of the multistep extraction of branching ratios are given in Lin (2019).
| Channel | (%) | FV (keV) | |
|---|---|---|---|
| Zero electron (bound-state beta decay) | |||
| 1. | |||
| One electron | |||
| 2. | 3.2 | 20.74 | |
| 3. | 1.1 | 20.11 | |
| 4. | 0.3 | 18.12 | |
| 5. | 1.1, 0.3 | 20.11/2 | |
| Two electrons (one shakeoff) | |||
| 6. | |||
| a | 1.1, 0.3 | 20.23/2 | |
| b | 1.1, 0.3 | 20.23/2 | |
| c | 1.1 | 20.11 | |
| d | 0.3 | 18.12 | |
| e | 1.1 | 20.11 | |
| f | 0.3 | 18.12 | |
| 7. | |||
| a | 1.1 | 20.11/2 | |
| b | 1.1 | 20.11/2 | |
| Three electrons (two shakeoff) | |||
| 8. | |||
| a | 1.7, 1.5 | 20.11/3 | |
| +11 combinations | |||
The most significant correction arises from initial ion momentum, which causes the radial distribution in the ion-detector plane to depend on the specific decay channel. These distributions are not known a priori: the coincidence rates are therefore measured by scanning the ion detector radially from the axis. The measured distributions are termed Raw Count Functions (RCF). Because the ion detector is of non-negligible size, a point-spread function (PSF) is calculated from the geometry in order to deconvolve the underlying radial distributions. The integrals of those distributions are the corrected quantities needed to form the branching ratios. Other corrections are noted below.
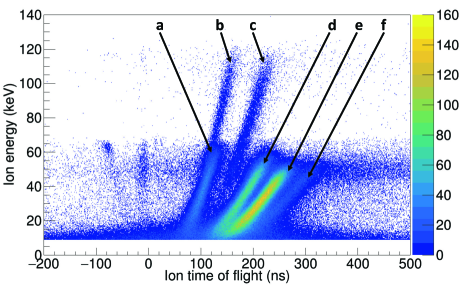
Coincidence data from TRIMS are shown in Fig. 2. Bands produced by the decay channels shown in Table 2, particularly from the singly charged ions with mass 1, 3 and 4 amu, may be seen. In addition, minor bands from charge-2 decays marked and , a mass-6 band from residual TT, marked , and secondary-emission bands to the left of time zero can be seen. The diffuse horizontal bands with ion energies keV or keV are from decays that occur in the non-accelerating regions near the detectors. Such events are filtered out via the 20-40 keV ion-energy FV cut. Some runs were affected by intermittent data-acquisition problems. Affected periods were removed in analysis.
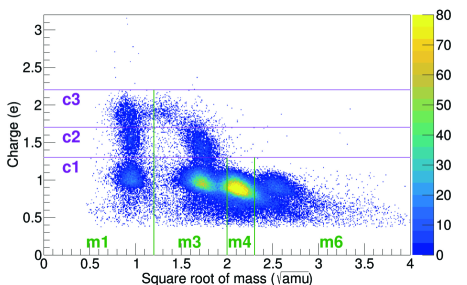
Charge-mass spectra (Fig. 2, center) were then generated with Eqs. 2 and 1. The effective charge is:
| (2) |
where is the detected electron energy and the acceleration voltage (59.7 kV). The unknown initial beta kinetic energy broadens the charge distribution, but separation into charge groups is still possible. For sorting events, is fixed at 3 keV.
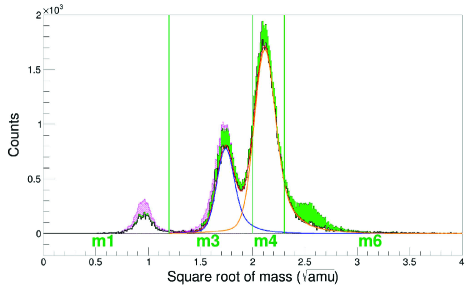
The plane is subdivided into cells within which the events are predominantly from single decay channels. Cross-contamination between neighboring cells is corrected on the charge axis according to the Geant4 simulation and on the mass axis by the Gaussian fits to the main peaks.
In the charge-mass plane one sees groups with and 2, but also 1.5. The latter are from two-electron branches 6 and 7 where one ion or one electron is missed. For branch 6 with two ions and two electrons the branching ratio is quantified by treating one of the ions (either one) as though it were a neutral spectator, like the main branch examples 3 and 4. For example, the He+ is detected either by itself or in the company of the spectator H+, and the branch numerator is the sum of those detection channels. Similarly, if both electrons are detected, we are assured that one is a beta. When only one is detected, either because the other backscattered and was lost, or because near the detector edge, one or the other missed the detector, only half of those events have a valid beta. The electron-loss corrections are determined by simulation. When one ion and one electron are both lost, the event becomes indistinguishable experimentally from a main-band event. In this case, the corrections, which are scan-position dependent, are calculated from one-ion and two-ion data where both electrons are detected, coupled with electron-loss simulations.
We take data with different mixtures of HT and TT. By subtraction of the appropriately normalized contribution of one mixture from the other mixture, pure HT and pure TT spectra are obtained. The relative normalization is determined from unique spectral features, namely the two-ion branches + and + from HT and TT, respectively, that produce a secondary electron at the mesh from the impact of one ion. Events of this kind form unique, completely isolated groups on the time-of-flight axis that do not require analysis beyond the numbers of events in each group. Pure HT or TT spectra result when the normalization completely removes two-ion events unique to the other isotopolog. The elimination of the mass-6 peak in the bottom spectrum of Fig. 2 gives confirmation.
Events with only the secondary electron detected yield “beta”-ion times that are small or even negative (Fig. 2, top). These events are not to be included in the branching ratios because they lack a beta.
The branching ratios obtained are listed in Table 3. The upper limits for branches 5 and 8 represent the numbers of events in the appropriate charge-mass cells, here deemed to be background rather than signal. Statistical uncertainties are listed in column 3. RCF uncertainties are additional aggregated uncertainties prior to deconvolution, and include contributions from random coincidences, TT spectrum subtraction, the cross-contamination of neighboring cells by charge and mass peaks, modeling of electron backscattering and losses, and manual scan-position setting. Point-spread function uncertainties encompass the dimensionality, scan step size, and zero offsets of the deconvolution matrix. The FV for each branch (Table 2) is subject to energy calibration uncertainties. For charge-2 branches FV is half as large as for charge-1 branches (indicated by “/2” in Table 2).
| Channel | Uncertainties (absolute %) | Branch | ||||||
|---|---|---|---|---|---|---|---|---|
| Stat. | RCF | PSF | FV | DT | Total | (%) | ||
| One electron | ||||||||
| 2. | 0.1 | 0.39 | 0.14 | 0.35 | 0.08 | 0.55 | 56.51(55) | |
| 3. | 0.1 | 0.27 | 0.05 | 0.28 | 0.05 | 0.41 | 24.98(41) | |
| 4. | 0.09 | 0.4 | 0.17 | 0.09 | 0.01 | 0.45 | 5.64(45) | |
| 5. | ||||||||
| Two electrons | ||||||||
| 6. | ||||||||
| from | 0.19 | 0.41 | 0.09 | 0.15 | 0.02 | 0.49 | 11.01(49) | |
| from | 0.17 | 0.37 | 0.09 | 0.13 | 0.02 | 0.44 | 10.43(44) | |
| 7. | 0.12 | 0.07 | 0.16 | 0.05 | 0 | 0.21 | 2.16(21) | |
| Three electrons | ||||||||
| 8. | ||||||||
Misalignment of the electric and magnetic fields would cause a departure from rotational symmetry, but was measured to be negligibly small, 4.7(7) mrad. Ion backscattering corrections and small corrections for the dependence on scan position of the scan step size, magnetic field, dead-layer loss, and detector acceptance were applied and did not contribute significant uncertainties. A search for 2H+ ions yielded 0.3(2)% of H+, and representative uncertainties are listed under DT in Table 3. Loss of ions to charge exchange was estimated to be less than 0.25%.
For TT decay, the measured branch to mass-6 ions is 50.3(15)%, which, like HT, disagrees strongly with the measurement of Wexler Wexler (1959), and agrees with the theoretical range of 39 to 57% (Table 1). We see clear evidence for dissociation in flight of mass-6 ions from quasibound states as will be described in a forthcoming paper, but theory does not predict their lifetimes, only the range.
In conclusion, the mass spectroscopic measurements of Snell et al. (1957); Wexler (1959) have for 60 years been the only data on the branching ratio of HT and TT to bound and unbound molecular ions. The profound discrepancy of those experiments with theory would imply either a dramatic and unexpected failure of the sudden approximation Migdal (1941) at relatively high beta energies, or some hindrance of dissociation by 5 orders of magnitude so that radiative decays from highly excited transient molecular states could dominate.
We have measured the branching ratios over the entire beta spectrum, as did Snell et al. Snell et al. (1957) and Wexler Wexler (1959), and find strong disagreement with the results of both experiments. In contrast, our results are in accord with theory even over this full range of beta energy. The source of the disagreement is not known. It may be due to the momentum acceptance of the instruments as Wexler himself suggested Wexler (1959).
With the present results, the last known disagreement between experiment and the theory of the final-state distribution in tritium beta decay is removed, providing support for the theoretical analysis of neutrino mass experiments such as KATRIN Aker et al. (2019) and Project 8 Asner et al. (2015) that make use of molecular tritium.
Acknowledgements.
The authors wish to thank Alejandro Saenz and Sanshiro Enomoto for valuable discussions. This material is based upon work supported by the U.S. Department of Energy Office of Science, Office of Nuclear Physics under Award Numbers DE-FG02-97ER41020 and DE-SC0019304. We further acknowledge support from the PRISMA Cluster of Excellence at the University of Mainz, the ‘Helmholtz Alliance for Astroparticle Physics HAP’ funded by the Initiative and Networking Fund of the Helmholtz Association, the Institute of Experimental Particle Physics at the Karlsruhe Institute of Technology (the Research University in the Helmholtz Association), and the German Academic Exchange Service.References
- Fukuda et al. (1998) Y. Fukuda et al. (Super-Kamiokande), Phys. Rev. Lett. 81, 1562 (1998), eprint hep-ex/9807003.
- Ahmad et al. (2001) Q. R. Ahmad et al. (SNO), Phys. Rev. Lett. 87, 071301 (2001), eprint nucl-ex/0106015.
- Aker et al. (2019) M. Aker, K. Altenmüller, M. Arenz, M. Babutzka, J. Barrett, S. Bauer, M. Beck, A. Beglarian, J. Behrens, T. Bergmann, et al. (KATRIN Collaboration), Phys. Rev. Lett. 123, 221802 (2019).
- Drexlin et al. (2013) G. Drexlin, V. Hannen, S. Mertens, and C. Weinheimer, Adv. High Energy Phys. 2013, 293986 (2013).
- Choudhury and Choubey (2018) S. R. Choudhury and S. Choubey, J. Cosmol. Astrop. Phys. 2018, 017 (2018), ISSN 1475-7516, URL http://dx.doi.org/10.1088/1475-7516/2018/09/017.
- Bodine et al. (2015) L. I. Bodine, D. S. Parno, and R. G. H. Robertson, Phys. Rev. C 91, 035505 (2015), eprint 1502.03497.
- Robertson et al. (1991) R. G. H. Robertson, T. J. Bowles, G. J. Stephenson, D. L. Wark, J. F. Wilkerson, and D. A. Knapp, Phys. Rev. Lett. 67, 957 (1991).
- Stoeffl and Decman (1995) W. Stoeffl and D. J. Decman, Phys. Rev. Lett. 75, 3237 (1995).
- Jonsell et al. (1999) S. Jonsell, A. Saenz, and P. Froelich, Phys. Rev. C 60, 034601 (1999).
- Saenz et al. (2000) A. Saenz, S. Jonsell, and P. Froelich, Phys. Rev. Lett. 84, 242 (2000).
- Snell et al. (1957) A. H. Snell, F. Pleasanton, and H. E. Leming, J. Inorg. Nucl. Chem. 5, 112 (1957).
- Wexler (1959) S. Wexler, J. Inorg. Nucl. Chem. 10, 8 (1959).
- Wexler and Porter (1969) S. Wexler and F. T. Porter, J. Chem. Phys. 50, 5428 (1969).
- Agostinelli et al. (2003) S. Agostinelli et al. (GEANT4), Nucl. Instrum. Meth. A 506, 250 (2003).
- Allison et al. (2016) J. Allison et al., Nucl. Instrum. Meth. A 835, 186 (2016).
- Dondero et al. (2018) P. Dondero, A. Mantero, V. Ivanchencko, S. Lotti, T. Mineo, and V. Fioretti, Nucl. Instrum. Meth. B 425, 18 (2018).
- Ziegler et al. (2010) J. Ziegler, M. Ziegler, and J. Biersack, Nucl. Instrum. Meth. B 268, 1823 (2010).
- Bodine (2015) L. I. Bodine, Ph.D. thesis, University of Washington, Seattle WA (2015), URL http://hdl.handle.net/1773/4956.
- Sjodin and Kan (2015) B. Sjodin and D. Kan, Introduction to COMSOL Multiphysics, Version: COMSOL 5.2, COMSOL AB (2015).
- Howe et al. (2004) M. A. Howe et al., IEEE Trans. Nucl. Sci. 51, 878 (2004), see also http://orca.physics.unc.edu/.
- Brun and Rademakers (1997) R. Brun and F. Rademakers, Nucl. Instrum. Meth. A 389, 81 (1997), see also http://root.cern.ch.
- Jordanov and Knoll (1994) V. T. Jordanov and G. F. Knoll, Nucl. Instrum. Meth. A 345, 337 (1994).
- Amsbaugh et al. (2015) J. Amsbaugh et al., Nucl. Instrum. Meth. A 778, 40 (2015).
- Woods and Saxon (1954) R. D. Woods and D. S. Saxon, Phys. Rev. 95, 577 (1954).
- Norton and Richards (1974) P. R. Norton and P. J. Richards, Surf. Sci. 41, 293 (1974).
- Bahcall (1961) J. N. Bahcall, Phys. Rev. 124, 495 (1961).
- Lin (2019) Y.-T. Lin, Ph.D. thesis, University of Washington, Seattle WA (2019), URL http://hdl.handle.net/1773/45253.
- Migdal (1941) A. B. Migdal, J. Phys. (USSR) 4, 449 (1941).
- Asner et al. (2015) D. M. Asner, R. F. Bradley, L. de Viveiros, P. J. Doe, J. L. Fernandes, M. Fertl, et al. (Project 8), Phys. Rev. Lett. 114, 162501 (2015), eprint 1408.5362.