Effects of symmetry energy on equation of state for simulations of core-collapse supernovae and neutron-star mergers
Abstract
We construct a new equation of state (EOS) for numerical simulations of core-collapse supernovae and neutron-star mergers based on an extended relativistic mean-field model with a small symmetry energy slope , which is compatible with both experimental nuclear data and recent observations of neutron stars. The new EOS table (EOS4) based on the extended TM1 (TM1e) model with MeV is designed in the same tabular form and compared with the commonly used Shen EOS (EOS2) based on the original TM1 model with MeV. This is convenient and useful for performing numerical simulations and examining the influences of symmetry energy and its density dependence on astrophysical phenomena. In comparison with the TM1 model used in EOS2, the TM1e model provides a similar maximum neutron-star mass but smaller radius and tidal deformability for a neutron star, which is more consistent with current constraints. By comparing the phase diagram and thermodynamic quantities between EOS4 and EOS2, it is found that the TM1e model predicts relatively larger region of nonuniform matter and softer EOS for neutron-rich matter. Significant differences between EOS4 and EOS2 are observed in the case with low proton fraction, while the properties of symmetric matter remain unchanged.
1 Introduction
The equation of state (EOS) is a critical input for astrophysical simulations such as core-collapse supernovae and neutron-star mergers, which require information over wide ranges of temperature, proton fraction, and baryon density. The EOS should include reasonable descriptions for both nonuniform matter at subsaturation densities and uniform matter at high densities. Due to the complex phase structure of stellar matter, it is not an easy task to construct the EOS covering the full range of thermodynamic conditions. Currently, there are a set of EOSs available for supernova simulations, which have been summarized in the review by Oertel et al. (Oertel et al., 2017). One of the most commonly used EOSs is that of Lattimer and Swesty (Lattimer & Swesty, 1991), which was based on the compressible liquid-drop model with a Skyrme force. Another commonly used EOS is often referred to as Shen EOS (Shen et al., 1998a, b, 2011), which used a relativistic mean-field (RMF) model and Thomas-Fermi approximation with a parameterized nucleon distribution for the description of nonuniform matter. Both EOSs employed the so-called single nucleus approximation (SNA), where only a single representative nucleus was considered instead of an ensemble of nuclei. It was shown that SNA could adequately describe the thermodynamics of the system (Burrows et al., 1984). Recently, EOS tables were developed beyond the SNA by including multiple nuclei in nuclear statistical equilibrium (NSE) based on some RMF or Skyrme parameterizations (Hempel & Schaffner-Bielich, 2010; Furusawa et al., 2011, 2013, 2017a; Steiner et al., 2013; Schneider et al., 2017). In Shen et al. (2011a, b), the authors employed a hybrid approach for constructing EOS tables, where NSE was used at low densities and SNA was adopted at intermediate densities near the transition to uniform matter. It is known that considering detailed nuclear composition plays an important role in determining the electron-capture rates and neutrino-matter interactions, but it has less influence on thermodynamic quantities of dense matter. In addition, microscopic approaches based on realistic nuclear forces have been also applied to construct the EOS tables for astrophysical simulations (Togashi et al., 2017; Furusawa et al., 2017b). In Schneider et al. (2019), the authors developed the EOS tables based on the Skyrme-type parameterization of the nuclear force, where the parameters were tuned to reproduce the Akmal, Pandharipande, and Ravenhall (APR) EOS.
The recent developments in astrophysical observations provide quantitative constraints on the EOS of dense matter. One strong constraint comes from the mass measurements of massive pulsars, PSR J1614-2230 (Demorest et al., 2010; Fonseca et al., 2016), PSR J0348+0432 (Antoniadis et al., 2013), and PSR J0740+6620 (Cromartie et al., 2019), which requires the maximum neutron-star mass to be larger than . Another constraint is provided by the radius estimations from quiescent low-mass X-ray binaries and objects with photospheric radius expansion bursts, which suggest small neutron-star radii, but it has much larger uncertainties than the mass measurements (Fortin et al., 2015). Furthermore, the first detection of gravitational waves from a binary neutron-star merger, known as GW170817, provides an upper limit on the tidal deformability of neutron stars (Abbott et al., 2017, 2018), which implies small neutron-star radii also (Fattoyev et al., 2018; Most et al., 2018). More recently, the second detection of gravitational waves, GW190425, was reported by LIGO and Virgo Collaborations (Abbott et al., 2019), which implies a rather large total mass of the binary system of and may offer valuable information for the EOS at high densities. The recent observations by Neutron Star Interior Composition Explorer (NICER) for PSR J0030+0451 provided a simultaneous measurement of the mass and radius of a neutron star. From independent analyses of the NICER data on PSR J0030+0451, Riley et al. (Riley et al., 2019) reported a mass of with an equatorial radius of km, while Miller et al. (Miller et al., 2019) reported a mass of with a radius of km. It is interesting to notice that constraints on the neutron-star radii from various observations are consistent with each other.
At present, some available EOS tables for supernova simulations are inconsistent with these constraints. The EOS based on the FSU parametrization predicts a maximum neutron-star mass of only , which was improved by introducing an additional phenomenological pressure at high densities (Shen et al., 2011b). The RMF parametrizations, NL3 and TM1, lead to too large neutron-star radii in comparison with the extracted values from astrophysical observations (Oertel et al., 2017). In our previous work (Shen et al., 2011), the EOS tables (EOS2 and EOS3) were constructed by employing the TM1 model, while the nonuniform matter was described in the Thomas–Fermi approximation with a parameterized nucleon distribution. In EOS2, only nucleonic degrees of freedom were taken into account, while additional contributions from hyperons were included at high densities in EOS3. The TM1 model can provide a satisfactory description for finite nuclei and a maximum neutron-star mass of with nucleonic degrees of freedom only, but the resulting neutron-star radii seem to be too large (Sugahara & Toki, 1994; Shen et al., 1998a). Therefore, we would like to improve our EOS table in order to be consistent with all available constraints from astrophysical observations.
It is well known that the neutron-star radius is closely related to the density dependence of nuclear symmetry energy (Horowitz & Piekarewicz, 2001). There exists a positive correlation between the slope parameter of the symmetry energy and the neutron-star radius (Alam et al., 2016). Since the TM1 model has a rather large slope parameter MeV, it predicts too large radii for neutron stars as compared to the estimations from astrophysical observations. In the present work, we prefer to employ an extended version of the TM1 model with MeV (hereafter referred to as the TM1e model), where an additional - coupling term is introduced to modify the density dependence of the symmetry energy (Bao et al., 2014b). By adjusting simultaneously two parameters associated to the meson in the TM1e model, we achieve the slope parameter MeV at saturation density and the same symmetry energy as the original TM1 model at a density of 0.11 fm-3. It is noteworthy that the TM1e and original TM1 models have the same isoscalar properties and fixed symmetry energy at , so that both models can provide very similar descriptions of stable nuclei. There are also other extended TM1 models for varying the symmetry energy slope by including - or - coupling term (Providência & Rabhi, 2013; Pais & Providência, 2016), where the coupling constants associated to the meson are adjusted to yield the same symmetry energy as the original TM1 model at a density of 0.1 fm-3. In our TM1e model, we prefer to fix the symmetry energy at the density of , since this choice can provide almost unchanged binding energy of 208Pb for different (see Figure 1 of Bao et al. (2014b)). Furthermore, the TM1e model predicts much smaller neutron-star radii than the original TM1 model due to the difference in the slope parameter . It is found that the TM1e model yields a radius of 13.1 km for a canonical neutron star, while the corresponding value of the original TM1 model is as large as 14.2 km (Ji et al., 2019). According to the constraints based on astrophysical observations and terrestrial nuclear experiments (Oertel et al., 2017; Tews et al., 2017; Birkhan et al., 2017), the slope parameter MeV of the TM1e model is more favored than MeV of the original TM1 model. Moreover, the neutron-star radius in the TM1e model is well within the new observational data by NICER.
We have two aims in this article. The first is to construct a new EOS table (hereafter referred to as EOS4) for numerical simulations of core-collapse supernovae and neutron-star mergers based on the TM1e model, which is compatible with both experimental nuclear data and recent observations of neutron stars. The second is to make a detailed comparison between the new EOS4 and previous EOS2 in Shen et al. (2011), so that we can examine the influences of symmetry energy and its slope on various aspects of the EOS for astrophysical simulations. We emphasize that both EOS4 and EOS2 are constructed using the same treatment for nonuniform matter and uniform matter with nucleonic degrees of freedom, but employ different RMF models for nuclear interaction. Since the TM1e and TM1 models have the same properties of symmetric nuclear matter but different behavior of symmetry energy, the differences between these two EOS tables are solely due to different density dependence of symmetry energy. For convenience in use and comparison, the new EOS4 is designed in the same tabular form covering the full range of temperature, proton fraction, and baryon density as described in Shen et al. (2011). For simplicity, only nucleonic degrees of freedom are taken into account in EOS4, while the appearance of hyperons and/or quarks at high densities is neglected. By applying the new EOS4 together with EOS2 in astrophysical simulations, it is possible to estimate the effects of symmetry energy and its density dependence on core-collapse supernovae, black hole formation, and binary neutron-star merger.
2 Formalism
For making the article self-contained, we give a brief description of the RMF model and Thomas–Fermi approximation used for constructing the EOS table.
2.1 RMF model
We employ the RMF model with an extended TM1 parametrization, namely the TM1e model, to describe the nuclear system, where nucleons interact through the exchange of various mesons including the isoscalar-scalar meson , isoscalar-vector meson , and isovector-vector meson (Bao & Shen, 2014a; Bao et al., 2014b). The nucleonic Lagrangian density reads
| (1) | |||||
where and denote the antisymmetric field tensors for and , respectively111 Note that the coupling constant for isovector-vector meson, , is different by a factor of 2 from the one in Shen et al. (2011). We follow here the convention of Bao & Shen (2014a). . Under the mean-field approximation, the meson fields are treated as classical fields and the field operators are replaced by their expectation values. In a static uniform system, the nonzero components are , , and . We derive the equations of motion for mesons and the Dirac equation for nucleons, which are coupled with each other and could be solved self-consistently.
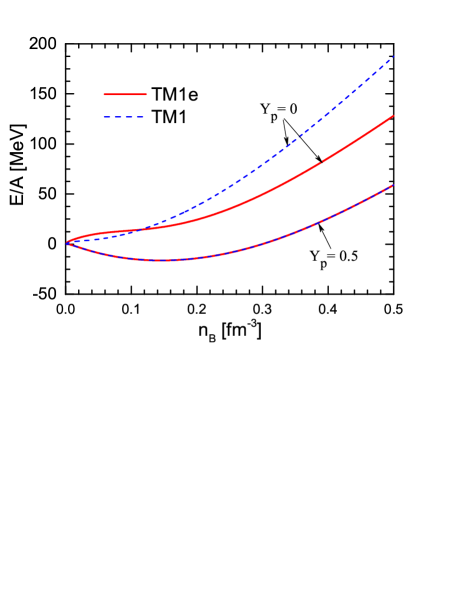
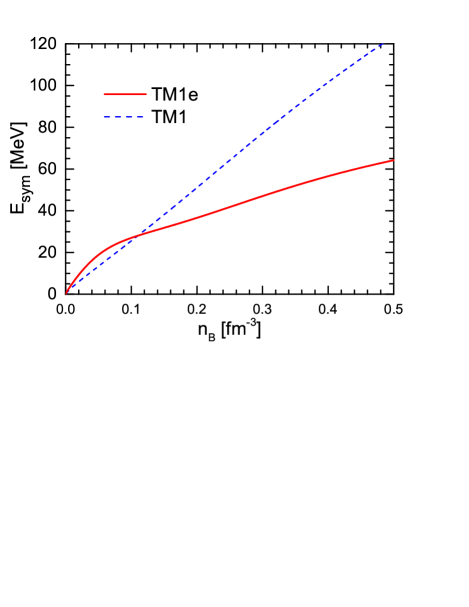
Compared with the original TM1 model adopted in Shen et al. (2011), an additional - coupling term is introduced in the Lagrangian density (1), which plays a crucial role in determining the density dependence of the symmetry energy (Horowitz & Piekarewicz, 2001; Cavagnoli et al., 2011; Providência & Rabhi, 2013; Bao & Shen, 2014a; Bao et al., 2014b). By adjusting the coupling constants, and , it is possible to control the behavior of symmetry energy and its density dependence. In the TM1e model, the slope parameter MeV and the symmetry energy MeV at saturation density are obtained, which fall well within the constraints from various observations (Oertel et al., 2017). The corresponding values in the original TM1 model are MeV and MeV, which are rather large and disfavored by recent astrophysical observations. In Table 1, we present the coupling constants of the TM1e and TM1 models for completeness. It is shown that only and related to isovector parts are different, while all other parameters remain the same. It is noteworthy that the TM1e model provides the same isoscalar saturation properties and similar binding energies of finite nuclei as the original TM1 model, whereas the density dependence of symmetry energy is very different. In Figure 1, we plot the energy per baryon of symmetric nuclear matter and neutron matter as a function of the baryon number density . It is shown that the behavior of symmetric nuclear matter is exactly the same between the TM1e and TM1 models, while significant differences are observed in neutron matter. This is related to different density dependence of symmetry energy between these two models, which is displayed in Figure 2. One can see that the symmetry energy in the TM1e model is slightly larger at low densities and much smaller at high densities than that in the original TM1 model. It is interesting and convenient to explore the influence of symmetry energy and its density dependence on the properties of the EOS for supernova simulations by using these two models.
For the Thomas–Fermi calculations of nonuniform matter, we need to input the energy density and entropy density of uniform nuclear matter, which are given in the TM1e model by
| (2) | |||||
and
| (3) | |||||
Here is the effective nucleon mass. and () denote, respectively, the occupation probabilities of nucleon and antinucleon at momentum , which are given by the Fermi-Dirac distribution,
| (4) |
with the kinetic part of the chemical potential related to the chemical potential as
| (5) |
The number density of protons () or neutrons () is calculated by
| (6) |
Using the results of the TM1e model as input in the Thomas–Fermi calculation, we compute the average free energy density of nonuniform matter, and compare it with the one of uniform matter. At a given temperature , proton fraction , and baryon mass density , the thermodynamically stable state is the one having the lowest free energy density. We determine the stable state and the phase transition between nonuniform matter and uniform matter by minimizing the free energy density.
| Model | [fm-1] | ||||||
|---|---|---|---|---|---|---|---|
| TM1e | 10.0289 | 12.6139 | 13.9714 | 7.2325 | 0.6183 | 71.3075 | 0.0429 |
| TM1 | 10.0289 | 12.6139 | 9.2644 | 7.2325 | 0.6183 | 71.3075 | 0.0000 |
2.2 Thomas–Fermi approximation
At low temperature and subnuclear density region, heavy nuclei are formed in order to lower the free energy of the system. For the description of nonuniform matter, we employ the Thomas–Fermi approximation with a parameterized nucleon distribution, which was developed by Oyamatsu (1993) and used in our previous works (Shen et al., 1998b, 2011). The nonuniform matter is modeled as a mixture of a single species of heavy nuclei, alpha particles, and free nucleons outside nuclei, while the leptons are approximated as an ideal relativistic gas separately. The spherical nuclei are arranged in a body-centered-cubic (BCC) lattice to minimize the Coulomb lattice energy (Oyamatsu, 1993), while the Wigner–Seitz cell is introduced to simplify the calculation of free energy. It is likely that nonspherical nuclei, known as pasta phases, may appear as the density approaches the phase transition to uniform matter (Avancini et al., 2010; Pais & Stone, 2012; Okamoto et al., 2013; Bao & Shen, 2015). The appearance of pasta phases can smooth the transition to uniform matter (see, e.g., Furusawa et al. (2013)), but the effects on thermodynamic quantities in the EOS table are rather small. For simplicity, we consider only spherical configuration in constructing the EOS table.
In the Wigner–Seitz cell, a spherical heavy nucleus is located at the center, while free nucleons and alpha particles exist outside the nucleus. Each cell is assumed to be charge neutral and the background electron gas is uniform. The density distribution of particle (, , or ) in the cell is assumed to have the form
| (7) |
where denotes the distance from the center of the cell. is the radius of the cell, which is related to the cell volume and the lattice constant by with and being the baryon number per cell and the average baryon number density, respectively. The baryon mass density is defined as with MeV being the atomic mass unit. For nonuniform matter at given temperature , proton fraction , and baryon mass density , the thermodynamically stable state is the one with the lowest free energy density, . The free energy per cell is given by
| (8) |
where the bulk energy and entropy are computed by performing integrations over the cell. The local energy and entropy densities can be expressed as the sum of contributions from nucleons and alpha particles. We use the RMF results of the TM1e model for the contributions of nucleons, while the alpha particles are treated as an ideal Boltzmann gas. To describe the dissolution of alpha particles at high densities, the excluded-volume correction is taken into account as described in Shen et al. (2011). For performing numerical integrations of and , we use the tabulated results of the TM1e model given by Equations (2) and (3) as input in the Thomas–Fermi calculation, and then the corresponding local densities contributed by nucleons are computed from the input table using a linear interpolation procedure. The input table is designed to include 871 grid points for the baryon number density and 1001 grid points for the proton fraction , so that the linear interpolation can be used with good accuracy. As for the contribution of alpha particles, it is calculated within the ideal-gas approximation, where the alpha-particle binding energy MeV is taken into account (Lattimer & Swesty, 1991; Shen et al., 2011). Generally, the number density of alpha particles is rather small, and therefore, the ideal-gas approximation can provide a reasonable description for alpha particles.
In Equation (8), represents the surface energy due to the inhomogeneity of nucleon distributions. We use the simple form as
| (9) |
where the parameter is the same as that adopted in Shen EOS with the original TM1 model, which was determined in Shen et al. (1998a) by performing the Thomas–Fermi calculation for finite nuclei so as to reproduce the gross properties of nuclear masses and charge radii, as described in the Appendix of Oyamatsu (1993). The reason why we use the same value of in the new EOS4 is because the TM1e model can predict very similar properties of finite nuclei as the original TM1 model (see Table 2 below), and hence the Thomas–Fermi calculation in the TM1e model with is able to reproduce similar gross properties of nuclear masses and charge radii. The Coulomb energy per cell is given by
| (10) |
where denotes the electrostatic potential calculated in the Wigner–Seitz approximation and is the correction term for the BCC lattice (Oyamatsu, 1993; Shen et al., 2011).
At given temperature , proton fraction , and baryon mass density , we perform the minimization of the free energy density with respect to independent variables in the parameterized Thomas–Fermi approximation. To avoid the presence of too many parameters in the minimization procedure, we use the same parameters and for both proton and alpha-particle distribution functions. Furthermore, is adopted, so that alpha particles disappear at the center of the nucleus. In principle, the nucleon distribution in the Wigner–Seitz cell can be determined in a self-consistently Thomas–Fermi approximation, where the set of coupled equations is solved by the iteration method in coordinate space (Zhang & Shen, 2014). However, the self-consistent Thomas–Fermi calculation requires much more computational effort than the parameterized Thomas–Fermi approximation. In our previous work (Zhang & Shen, 2014), we made a detailed comparison between the self-consistent Thomas–Fermi approximation and the parameterized Thomas–Fermi approximation, which showed that the differences in thermodynamic quantities between these two methods are negligible and would not affect the general behavior of the EOS. Therefore, we prefer to employ the parameterized Thomas–Fermi approximation in the present calculation. Furthermore, it is also helpful for examining the effects of symmetry energy by comparing EOS4 with EOS2 based on the same method.
After the thermodynamically favorable state is determined in the minimization procedure, we calculate the thermodynamic quantities like the pressure and chemical potentials from the free energy per baryon over the full range of the EOS table by the thermodynamic relations:
| (11) | |||||
| (12) | |||||
| (13) |
where and are the average number densities of protons and neutrons, respectively. The final EOS table contains not only thermodynamic quantities but also compositions of matter and other information. For convenience in use and comparison, the new EOS4 is designed to have the same tabular form as EOS2, while the definitions of the physical quantities in the EOS table have been given in Appendix A of Shen et al. (2011).
Compared to the treatment of nonuniform matter in Shen et al. (2011), the results of the TM1e model are used as input in the Thomas–Fermi calculation of EOS4, instead of the original TM1 model used in EOS2. The different density dependence of symmetry energy between TM1e ( MeV) and TM1 ( MeV) would lead to more significant effects in low region. It is interesting to make a detailed comparison between EOS4 and EOS2, so that we can explore the influences of symmetry energy and its density dependence on properties of the EOS for astrophysical simulations.
3 Results
We construct the new EOS4 based on the TM1e model with MeV covering a wide range of temperature , proton fraction , and baryon mass density for numerical simulations of core-collapse supernovae and neutron-star mergers. For convenience in practical use, we provide the new EOS4 in the same tabular form within the ranges as given in Table 1 of Shen et al. (2011). All physical quantities included in the EOS table have been defined in Appendix A of Shen et al. (2011). Compared to the EOS2 based on the original TM1 model in Shen et al. (2011), the new EOS4 is more compatible with both experimental nuclear data and recent observations of neutron stars. In Table 2, we present some properties of nuclear symmetry energy, finite nuclei, and neutron stars, so as to examine the compatibility of the models with current constraints and experimental data. It is shown that the results of finite nuclei in the TM1e and TM1 models are very similar to each other and in good agreement with experimental data. On the other hand, the TM1e model provides much smaller radius and tidal deformability for a neutron star, which is more consistent with the current constraints. It is reasonable that different behaviors of the symmetry energy between these two models have more pronounced effects for neutron-rich objects like neutron stars. More detailed properties of neutron stars obtained in the TM1e model have been reported in our recent study (Ji et al., 2019).
| EOS4(TM1e) | EOS2(TM1) | constraints | ||
| symmetry energy | [MeV] | 31.38 | 36.89 | (Oertel et al., 2017) |
| [MeV] | 40 | 110.8 | (Oertel et al., 2017) | |
| finite nuclei (RMF) | (208Pb) [MeV] | 7.88 | 7.88 | 7.87 (Audi et al., 2003) |
| (208Pb) [fm] | 5.56 | 5.54 | 5.50 (Angeli & Marinova, 2013) | |
| (208Pb) [fm] | 0.16 | 0.27 | (Abrahamyan et al., 2012) | |
| finite nuclei (TF) | (208Pb) [MeV] | 8.05 | 8.08 | 7.87 (Audi et al., 2003) |
| (208Pb) [fm] | 5.68 | 5.65 | 5.50 (Angeli & Marinova, 2013) | |
| (208Pb) [fm] | 0.10 | 0.21 | (Abrahamyan et al., 2012) | |
| neutron stars | [] | 2.12 | 2.18 | (Fonseca et al., 2016) |
| (Antoniadis et al., 2013) | ||||
| (Cromartie et al., 2019) | ||||
| [km] | 13.1 | 14.2 | (Abbott et al., 2018) | |
| (Most et al., 2018) | ||||
| 652 | 1047 | (Abbott et al., 2017) | ||
| (Abbott et al., 2018) |
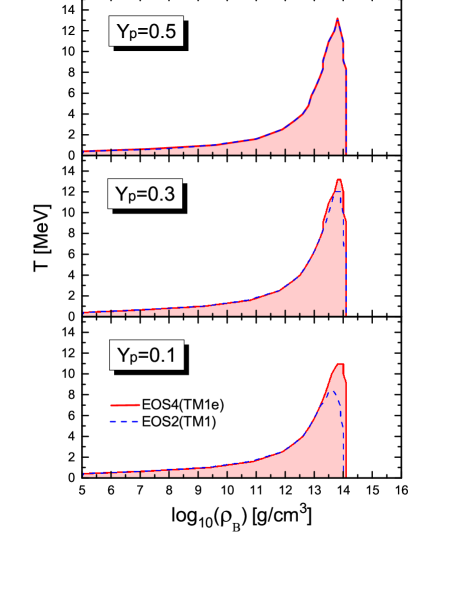
To build the EOS table for astrophysical simulations, we perform the free energy minimization at each , , and for both nonuniform matter and uniform matter. The thermodynamically favorable state is the one with the lowest free energy density among all configurations considered. The phase transition is determined by comparing the free energy density between nonuniform matter and uniform matter. In Figure 3, we show the phase diagram in the – plane for , , and obtained in EOS4 (red solid lines) which is compared with that of EOS2 (blue dashed lines). One can see that the nonuniform matter phase with heavy nuclei can exist only at low temperature and subnuclear density region. At low densities, the uniform matter consists of a free nucleon gas together with a small fraction of alpha particles. As the density increases, heavy nuclei are formed in the nonuniform matter phase to lower the free energy. When the density is beyond , heavy nuclei dissolve and the favorable state becomes the uniform nuclear matter. The density range of the nonuniform matter phase depends on both and . As the temperature increases, the onset density of nonuniform matter increases significantly, while the transition from nonuniform matter to uniform matter is almost independent of . When the temperature reaches the critical value , the nonuniform matter phase disappears completely, i.e. heavy nuclei cannot be formed at .
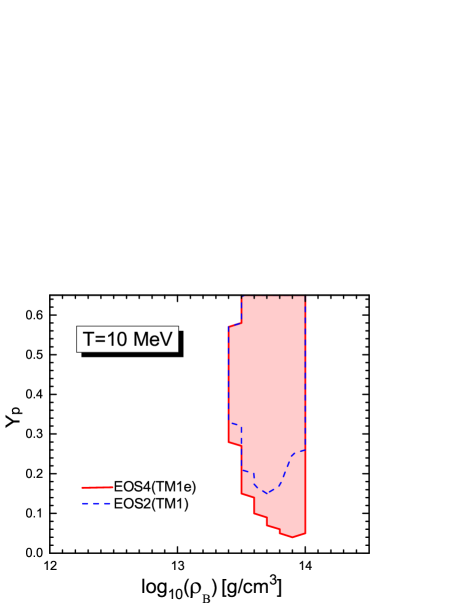
It is interesting to note the effects of symmetry energy on the boundary of nonuniform matter. For the case of shown in the top panel of Figure 3, there is no visible difference between EOS4(TM1e) and EOS2(TM1) due to the same isoscalar properties in the two models. For the case of shown in the bottom panel, the critical temperature in EOS4(TM1e) is significantly higher than the one obtained in EOS2(TM1). Furthermore, the transition density to uniform matter in EOS4(TM1e) is slightly larger than that in EOS2(TM1). This is consistent with the correlation between the symmetry energy slope and the crust-core transition density of neutron stars (Bao & Shen, 2015). In Figure 4, we show the density range of nonuniform matter as a function of at MeV. It is seen that there is clear difference between EOS4(TM1e) and EOS2(TM1) in low region, where the behavior of symmetry energy plays an important role in determining the properties of neutron-rich matter. One can see that heavy nuclei do not appear in EOS2(TM1) at MeV for , whereas the nonuniform matter phase exists until in EOS4(TM1e). Similar effects of the symmetry energy and its slope on the phase diagram were also observed in Togashi et al. (2017), where the authors constructed the EOS table using a non-relativistic variational method based on realistic nuclear forces. It is interesting to find this similarity for both non-relativistic and relativistic many-body frameworks with small values.
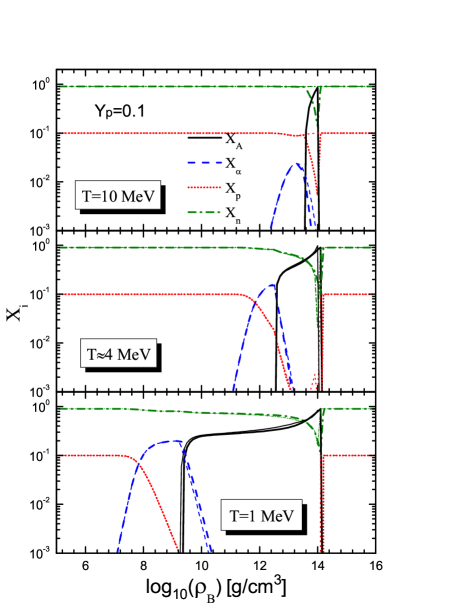
In Figure 5, we show the fractions of neutrons, protons, alpha particles, and heavy nuclei as a function of the baryon mass density for at , , and MeV. At low densities, the matter is a uniform gas of neutrons and protons together with a small fraction of alpha particles. The alpha-particle fraction increases with increasing before the formation of heavy nuclei, but it rapidly decreases in the nonuniform matter where heavy nuclei use up most of the nucleons. When the density increases beyond , heavy nuclei dissolve and the matter is composed of uniform neutrons and protons. In general, the results of EOS2 (thin lines) are just slightly different from those of EOS4 (thick lines). In the case of MeV (top panel), heavy nuclei do not appear in EOS2 with the TM1 model, but alpha particles exist at intermediate densities. This is different from the results of EOS4, where heavy nuclei are formed in the density range with the TM1e model. Due to the formation of heavy nuclei, and in this density range are much different between EOS4 and EOS2.
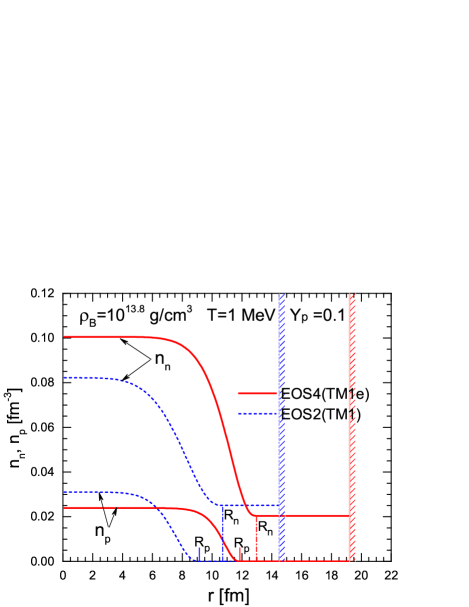
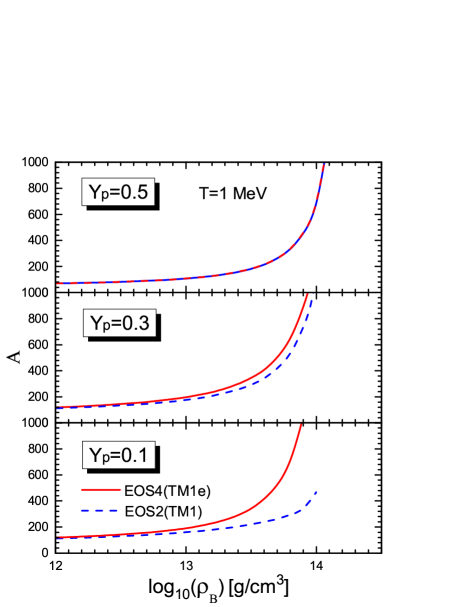
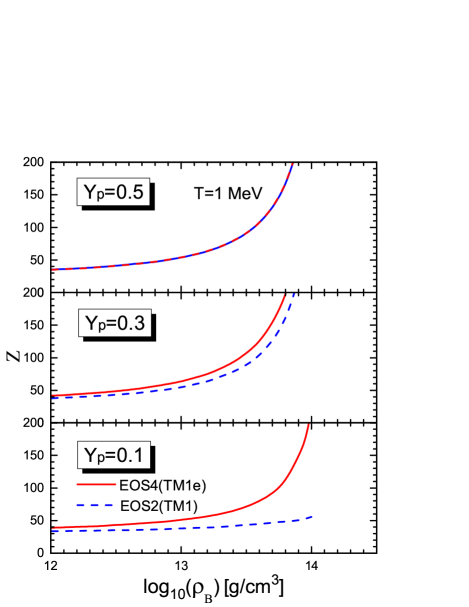
In nonuniform matter, the properties of heavy nuclei are determined by minimizing the free energy density in the parameterized Thomas–Fermi approximation. We display in Figure 6 the resulting density distributions of protons and neutrons inside the Wigner–Seitz cell for the case of MeV and at . The radius of the Wigner–Seitz cell is indicated by the hatch, while the radius of the heavy nucleus is shown by the dash-dotted line. The results obtained in EOS4 (red solid lines) are compared with those of EOS2 (blue dashed lines). It is shown that both the cell radius and the neutron radius (i.e., the radius of the heavy nucleus) obtained in EOS4 are larger than those in EOS2. Furthermore, the neutron-skin thickness, , is relatively small in the case of EOS4. This is because the TM1e model used in EOS4 has a smaller symmetry energy slope MeV than the value of MeV in the TM1 model of EOS2. It is well known that the neutron-skin thickness of finite nuclei is positively correlated to the symmetry energy slope . On the other hand, the density distributions, and , are also largely affected by the symmetry energy slope . The dripped neutron density of EOS4 is smaller than that of EOS2, while the neutron density at the center is much larger. This tendency can be understood from different behaviors of the symmetry energy between TM1e and TM1 models. As shown in Figure 2, the TM1e model has larger at low densities but smaller at high densities compared to the TM1 model. Therefore, the TM1e model results in relatively larger and smaller than the TM1 model. It is seen that the density gradient in EOS4 is larger than that in EOS2, which leads to larger surface energy and nuclear radius. A similar behavior was also reported in Togashi et al. (2017), where the authors used the model with small based on realistic nuclear forces and compared to the results of EOS2. In Figures 7 and 8, we show respectively the nuclear mass number and charge number as a function of the baryon mass density at MeV for , , and . It is seen that both and weakly depend on at low densities and rapidly increase before the transition to uniform matter. There are significant differences between EOS4 and EOS2 for small . The values of and obtained in EOS4 are larger than those of EOS2. This is because the TM1e model with a small results in a large nuclear radius as shown in Figure 6, which implies more protons and neutrons are bound inside the heavy nucleus. The differences of heavy nuclei between EOS4 and EOS2 may affect the neutrino transport and emission in core-collapse supernovae, which need to be explored in further studies.
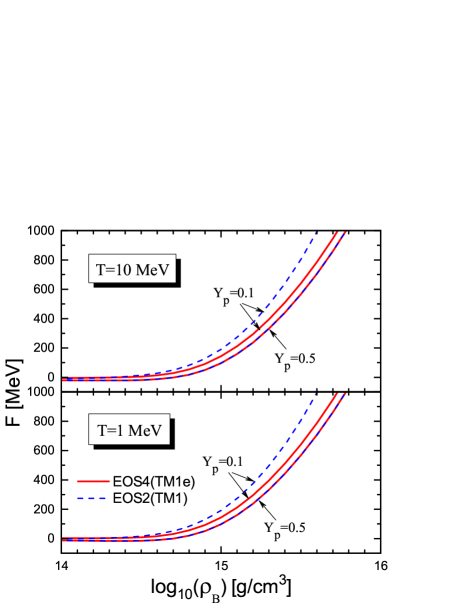
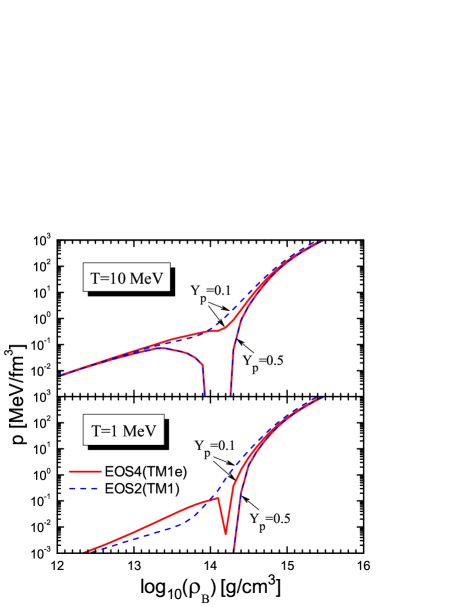
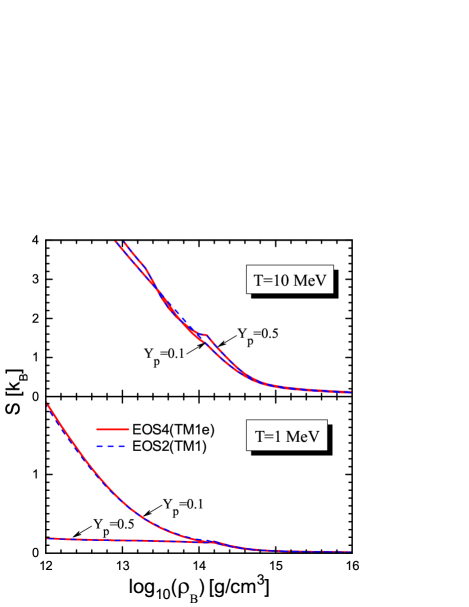
It is essential to discuss the effects of symmetry energy on the thermodynamic quantities in the EOS table. In Figure 9, we show the free energy per baryon as a function of the baryon mass density for and at and MeV. The results in EOS4(TM1e) are shown by solid lines, while those in EOS2(TM1) are displayed by dashed lines for comparison. There is almost no difference between EOS4 and EOS2 for the case of due to the same isoscalar properties of the two models. In the case of , the values of in EOS4 are smaller than those in EOS2, and their difference increases with increasing . This is because the TM1e model has smaller symmetry energy than the TM1 model at high densities, which leads to smaller free energy in neutron-rich matter. Comparing the cases between MeV and MeV, the tendencies of the free energy are very similar to each other. This implies that the dependence of the symmetry energy effect on is rather weak. We plot in Figure 10 the pressure as a function of for and at and MeV. The pressure is calculated from the derivative of the free energy, as given in Equation (11). Due to the formation of heavy nuclei in nonuniform matter, the pressure has a rapid drop as shown in the case of in the top panel (Note that this drop does not appear when contributions from leptons and photons are added). In contrast, the pressure for is much smooth due to less fraction of heavy nuclei. It is noticed that there is a clear discontinuity in EOS4(TM1e) around the phase transition to uniform matter for the case of and MeV. In fact, this discontinuity is also found in other cases (see, e.g., Figure 7 of Shen et al. (1998b) and Figure 14 of Togashi et al. (2017)). This is because the phase transition is determined by minimizing the free energy, and as a result, the free energy shown in Figure 9 is a smooth function of the density. However, the pressure calculated from the first derivative of the free energy may exhibit a discontinuity at the first-order phase transition (Pais et al., 2014). Compared to the results of EOS2 shown by dashed lines, the pressure of uniform matter beyond in EOS4 for is relatively small, so the discontinuity is more obvious in this case. Generally, the pressure at high densities obtained in EOS4 is lower than that in EOS2, which is a result of small density dependence of symmetry energy in the TM1e model. Therefore, the new EOS4 is softer than EOS2 due to different behaviors of the symmetry energy between these two models. In Figure 11, we show the entropy per baryon as a function of for and at and MeV. At MeV, the values of for are much smaller than those for . This is because most of nucleons exist inside heavy nuclei for the case of , while there is a large fraction of free neutrons for as shown in Figure 5. At MeV, the difference of between and is relatively small, because the formation of heavy nuclei becomes less important as the temperature increases. It is found that the difference of symmetry energy between TM1e and TM1 models has minor influence on the entropy, and as a result, the behavior of obtained in EOS4 is very similar to that in EOS2. Generally, the TM1e model with MeV leads to visible differences in EOS4 from EOS2 for , and the difference increases as the matter becomes more neutron-rich.
4 Summary
In this work, we constructed a new EOS table (EOS4) based on an extended TM1 model with MeV (referred to as the TM1e model) for astrophysical simulations of core-collapse supernovae and neutron-star mergers. Following the method described in our previous study (Shen et al., 2011), we employed the Thomas–Fermi approximation with a parameterized nucleon distribution for the description of nonuniform matter, which is modeled as a mixture of a single species of heavy nuclei, alpha particles, and free nucleons outside nuclei. At given temperature , proton fraction , and baryon mass density , we perform the minimization of the free energy density with respect to independent variables involved, so as to determine the thermodynamically stable state with the lowest free energy. For convenience in use and comparison, the new EOS4 was designed in the same tabular form as the previous version EOS2 presented in Shen et al. (2011). Now, both EOS4 and EOS2 are available at http://my.nankai.edu.cn/wlxy/sh_en/list.htm, http://user.numazu-ct.ac.jp/∼sumi/eos/index.html, and http://doi.org/10.5281/zenodo.3612487.
The main difference between the new EOS4 in this work and the previous EOS2 in Shen et al. (2011) is that the TM1e model with a small slope parameter MeV was used in EOS4 instead of the original TM1 model with MeV adopted in EOS2. The different behaviors of the symmetry energy between TM1e and TM1 lead to visible impacts on various aspects of the EOS for astrophysical simulations, especially in the neutron-rich region. The effects of the symmetry energy and its slope observed in this work are consistent with those reported in Togashi et al. (2017).
The present work was motivated by recent developments in astrophysical observations, such as the binary neutron-star merger GW170817, which provided new constraints on the tidal deformability and radii of neutron stars. It is likely that the TM1 model with MeV used in EOS2 predicts too large neutron-star radii compared to the current observations. Therefore, we prefer to revise our EOS table by employing the TM1e model with MeV, which could provide much smaller neutron-star radius. It is well known that the neutron-star radius is positively correlated to the symmetry energy slope . By introducing an additional - coupling term, it is possible to modify the density dependence of the symmetry energy according to the constraints from astrophysical observations and terrestrial nuclear experiments. In the TM1e model, we adjusted simultaneously two parameters associated to the meson, and as a result, the slope parameter MeV and the symmetry energy MeV at saturation density were achieved, which fall well within the constraints from various observations. It is noteworthy that the TM1e model provides the same properties of symmetric nuclear matter and similar binding energies of finite nuclei as the original TM1 model, whereas the density dependence of the symmetry energy is very different. This choice allows us to explore the effect solely from the symmetry energy without interference of the isoscalar part.
To examine the effect of symmetry energy, we made a detailed comparison between the new EOS4 and previous EOS2. It was found that the TM1e model used in EOS4 could predict relatively larger region of nonuniform matter and softer EOS in the neutron-rich region compared with the original TM1 model used in EOS2. In the case of EOS4, the critical temperature, where the nonuniform matter phase disappears completely, is clearly higher than the one in EOS2 for the case of low . Furthermore, the transition density to uniform matter in EOS4 is slightly larger than that in EOS2. In nonuniform matter, the mass number and charge number of heavy nuclei obtained in EOS4 were found to be larger than those of EOS2. We also found noticeable differences in the thermodynamic quantities like the free energy and pressure, especially for neutron-rich matter at high densities. All these differences between EOS4 and EOS2 become more significant as decreases. This is because the TM1e and TM1 models have the same isoscalar properties but different density dependence of the symmetry energy.
It is interesting and important to explore the effects of symmetry energy on astrophysical phenomena such as core-collapse supernovae and neutron-star mergers. In our recent work (Sumiyoshi et al., 2019), we have studied the influence of symmetry energy and its density dependence in numerical simulations of gravitational collapse of massive stars and cooling of protoneutron stars by using a hybrid EOS, where the TM1e model was adopted for uniform matter at densities above combined with the previous EOS2 of nonuniform matter at low densities. While the TM1e EOS at high densities is shown to have major effects on the birth of neutron stars in neutron-rich regions, the full table of TM1e EOS including the part of low densities will have influence on collapse and bounce of supernova cores, by non-trivial feedback through compositional changes with neutrino reactions, thereby the outcome of the (non)explosion and the compact object formation. The numerical simulation of core-collapse supernovae and the analysis of symmetry energy effects using the new EOS4 are currently underway.
References
- Abbott et al. (2017) Abbott, B. P., Abbott, R., Abbott, T. D., et al. 2017, Phys. Rev. Lett., 119, 161101
- Abbott et al. (2018) Abbott, B. P., Abbott, R., Abbott, T. D., et al. 2018, Phys. Rev. Lett., 121, 161101
- Abbott et al. (2019) Abbott, B. P., Abbott, R., Abbott, T. D., et al. 2020, arXiv:2001.01761
- Abrahamyan et al. (2012) Abrahamyan, S., Ahmed, Z., Albataineh, H., et al. 2012, Phys. Rev. Lett., 108, 112502
- Alam et al. (2016) Alam, N., Agrawal, B. K., Fortin, M., Pais, H., Providência, C., Raduta, Ad. R., & Sulaksono, A. 2016, Phys. Rev. C, 94, 052801(R)
- Angeli & Marinova (2013) Angeli, I., & Marinova, K. P. 2013, Atomic Data and Nuclear Data Tables 99, 69
- Antoniadis et al. (2013) Antoniadis, J., Freire, P. C. C., Wex, N., et al. 2013, Science, 340, 448
- Audi et al. (2003) Audi, G., Wapstra, A. H., & Thibault, C. 2003, Nucl. Phys. A, 729, 337
- Avancini et al. (2010) Avancini, S. S., Chiacchiera, S., Menezes, D. P., & Providência, C. 2010, Phys. Rev. C, 82, 055807
- Bao & Shen (2014a) Bao, S. S., & Shen, H. 2014a, Phys. Rev. C, 89, 045807
- Bao et al. (2014b) Bao, S. S., Hu, J. N., Zhang, Z. W., & Shen, H. 2014b, Phys. Rev. C, 90, 045802
- Bao & Shen (2015) Bao, S. S., & Shen, H. 2015, Phys. Rev. C, 91, 015807
- Birkhan et al. (2017) Birkhan, J., Miorelli, M., Bacca, S., et al. 2017, Phys. Rev. Lett., 118, 252501
- Burrows et al. (1984) Burrows, A., & Lattimer, J. M. 1984, ApJ, 285, 294
- Cavagnoli et al. (2011) Cavagnoli, R., Menezes, D. P., & Providência, C. 2011, Phys. Rev. C, 84, 065810
- Cromartie et al. (2019) Cromartie H. T., Fonseca E., Ransom S. M., et al. 2019, Nature Astronomy, doi:10.1038/s41550-019-0880-2
- Demorest et al. (2010) Demorest, P. B., Pennucci, T., Ransom, S. M., Roberts, M. S. E., & Hessels, J. W. T. 2010, Nature, 467, 1081
- Fattoyev et al. (2018) Fattoyev, F. J., Piekarewicz, J., & Horowitz, C. J. 2018, Phys. Rev. Lett., 120, 172702
- Fonseca et al. (2016) Fonseca, E., Pennucci, T. T., Ellis, J. A., et al. 2016, ApJ, 832, 167
- Fortin et al. (2015) Fortin, M., Zdunik, J. L., Haensel, P., & Bejger, M. 2015, A&A, 576, A68
- Furusawa et al. (2011) Furusawa, S., Yamada, S., Sumiyoshi, K., & Suzuki, H. 2011, ApJ, 738, 178
- Furusawa et al. (2013) Furusawa, S., Sumiyoshi, K., Yamada, S., & Suzuki, H. 2013, ApJ, 772, 95
- Furusawa et al. (2017a) Furusawa, S., Sumiyoshi, K., Yamada, S., & Suzuki, H. 2017a, Nucl. Phys. A, 957, 188
- Furusawa et al. (2017b) Furusawa, S., Togashi, H., Nagakura, H., Sumiyoshi, K., Yamada, S., Suzuki, H., & Takano, M. 2017b, JPhG, 44, 094001
- Hempel & Schaffner-Bielich (2010) Hempel, M., & Schaffner-Bielich, J. 2010, Nucl. Phys. A, 837, 210
- Horowitz & Piekarewicz (2001) Horowitz, C. J., & Piekarewicz, J. 2001, Phys. Rev. Lett., 86, 5647
- Ji et al. (2019) Ji, F., Hu, J. N., Bao, S. S., & Shen, H. 2019, Phys. Rev. C, 100, 045801
- Lattimer & Swesty (1991) Lattimer, J. M., & Swesty, F. D. 1991, Nucl. Phys. A, 535, 331
- Miller et al. (2019) Miller, M. C., Lamb, F. K., Dittmann, A. J., et al. 2019, ApJ, 887, L24
- Most et al. (2018) Most, E. R., Weih, L. R., Rezzolla, L., & Schaffner-Bielich, J. 2018, Phys. Rev. Lett., 120, 261103
- Okamoto et al. (2013) Okamoto, M., Maruyama, T., Yabana, K., & Tatsumi, T. 2013, Phys. Rev. C, 88, 025801
- Oertel et al. (2017) Oertel, M., Hempel, M., Klähn, T., & Typel, S. 2017, Rev. Mod. Phys., 89, 015007
- Oyamatsu (1993) Oyamatsu, K. 1993, Nucl. Phys. A, 561, 431
- Pais & Stone (2012) Pais, H., & Stone, J. R. 2012, Phys. Rev. Lett., 109, 151101
- Pais et al. (2014) Pais, H., Newton, W. G., & Stone, J. R. 2014, Phys. Rev. C, 90, 065802
- Pais & Providência (2016) Pais, H., & Providência, C. 2016, Phys. Rev. C, 94, 015808
- Providência & Rabhi (2013) Providência, C., & Rabhi, A. 2013, Phys. Rev. C, 87, 055801
- Riley et al. (2019) Riley, T. E., Watts, A. L., Bogdanov, S., et al. 2019, ApJ, 887, L21
- Schneider et al. (2017) Schneider, A. S., Roberts, L. F., & Ott, C. D. 2017, Phys. Rev. C, 96, 065802
- Schneider et al. (2019) Schneider, A. S., Constantinou, C., Muccioli, B., & Prakash, M. 2019, Phys. Rev. C, 100, 025803
- Shen et al. (2011a) Shen, G., Horowitz, C. J., & Teige, S. 2011a, Phys. Rev. C, 83, 035802
- Shen et al. (2011b) Shen, G., Horowitz, C. J., & O’Connor, E. 2011b, Phys. Rev. C, 83, 065808
- Shen et al. (1998a) Shen, H., Toki, H., Oyamatsu, K., & Sumiyoshi, K. 1998a, Nucl. Phys. A, 637, 435
- Shen et al. (1998b) Shen, H., Toki, H., Oyamatsu, K., & Sumiyoshi, K. 1998b, PThPh, 100, 1013
- Shen et al. (2011) Shen, H., Toki, H., Oyamatsu, K., & Sumiyoshi, K. 2011, ApJS, 197, 20
- Steiner et al. (2013) Steiner, A. W., Hempel, M., & Fischer, T. 2013, ApJ, 774, 17
- Sugahara & Toki (1994) Sugahara, Y., & Toki, H. 1994, Nucl. Phys. A, 579, 557
- Sumiyoshi et al. (2019) Sumiyoshi, K., Nakazato, K., Suzuki, H., Hu, J. N., & Shen, H. 2019, ApJ, 887, 110
- Tews et al. (2017) Tews, I., Lattimer, J. M., Ohnishi, A., & Kolomeitsev, E. E., 2017, ApJ, 848, 105
- Togashi et al. (2017) Togashi, H., Nakazato, K., Takehara, Y., Yamamuro, S., Suzuki, H., & Takano, M. 2017, Nucl. Phys. A, 961, 78
- Zhang & Shen (2014) Zhang, Z. W., & Shen, H. 2014, ApJ, 788, 185