KMTNet Nearby Galaxy Survey II. Searching for Dwarf Galaxies in Deep and Wide-field Images of the NGC 1291 system
Abstract
We present newly discovered dwarf galaxy candidates in deep and wide-field images of NGC 1291 obtained with the Korea Microlensing Telescope Network. We identify 15 dwarf galaxy candidates by visual inspection. Using imaging simulations, we demonstrate that the completeness rate of our detection is greater than 70% for the central surface brightness value of 26 mag arcsec-2 and for magnitudes mag. The structural and photometric properties of the dwarf galaxy candidates appear to be broadly consistent with those of ordinary dwarf galaxies in nearby groups and clusters, with 22.5 to 26.5 mag arcsec-2 and effective radii of 200 pc to 1 kpc. The dwarf galaxy candidates show a concentration towards NGC 1291 and tend to be redder the closer they are to the center, possibly indicating that they are associated with NGC 1291. The dwarf candidates presented in this paper appear to be bluer than those in denser environments, revealing that the quenching of star formation in dwarf galaxies is susceptible to the environment, while the morphology shaping is not.
1 Introduction
The CDM paradigm successfully predicts the large-scale structures of the Universe, but it often fails to explain the properties on much smaller scales (see Bullock & Boylan-Kolchin, 2017). Together with the too-big-to-fail (Boylan-Kolchin et al., 2011) and the planes of satellites problems (Pawlowski et al., 2012; Müller et al., 2017), one of the critical issues with this paradigm is the so-called ‘missing satellites problem’ (Klypin et al., 1999; Moore et al., 1999) in which models predict that there are more satellite galaxies for a given host galaxy than are actually observed, based on the census of dwarf-scale satellite galaxies in the Local Group (LG).
There have been a lot of effort towards explaining the problems using cosmological simulations with higher resolution and much improved baryonic physics (see Section 3 in Bullock & Boylan-Kolchin, 2017). Focusing on the possibility of incomplete observations, there have been several scenarios to explain the discrepancy between the predicted and observed number of satellite galaxies. One scenario suggests that tidal disruption of satellite galaxies can reduce the number of observable dwarf galaxies (e.g., Kravtsov et al., 2004; Garrison-Kimmel et al., 2017), but leaves behind distinct structures such as shells, streams, and tidal tails. It is also possible to mitigate the problem by applying physical mechanisms which suppress star formation in dwarf galaxies, such as supernovae-driven outflows (e.g., Font et al., 2011). Those processes leave remnants that would be expected to have a low surface brightness (LSB). In that respect, deep imaging surveys of LSB features are important as probes into the evolution of dwarf-scale satellite galaxies.
Since the 1980’s when LSB galaxies were first discovered (Sandage & Binggeli, 1984), many studies have reported discoveries of those galaxies despite the surface brightness limit ( mag arcsec-2; e.g., Impey et al., 1988; Bothun et al., 1991; Dalcanton et al., 1997). Although intensive all-sky surveys, such as the Sloan Digital Sky Survey (SDSS; York et al., 2000), have made a tremendous contribution to this field, the detection of faint dwarf galaxies is still difficult because of their low surface brightness, which have a value less than 1% of the brightness of the night sky.
| Parameter | Value | Reference |
|---|---|---|
| R.A. (J2000) | 1 | |
| Decl. (J2000) | 1 | |
| Morphology | (R)SB0/a(s) | 1 |
| Distance | 9.08 Mpc | 2 |
| M⋆ | 3 | |
| 7.98 mag | 4 | |
| 4–5 kpc | 4 |
Recently, new observational strategies and data analysis techniques for deep imaging surveys have been progressively developed to explore the LSB nature in galaxy groups, clusters (e.g., Kim et al., 2011; Ferrarese et al., 2012; Capaccioli et al., 2015; van Dokkum et al., 2015; Mihos et al., 2015; Muñoz et al., 2015; Merritt et al., 2016; Venhola et al., 2017; Park et al., 2017; Kondapally et al., 2018; Smercina et al., 2018; Park et al., 2019), and fields (e.g., Javanmardi et al. 2016; Henkel et al. 2017; Leisman et al. 2017). Furthermore, automated detection methods for identifying faint dwarf galaxies have been contributed to much larger explorations (e.g., Merritt et al., 2014; Davies et al., 2016; Fliri & Trujillo, 2016; van der Burg et al., 2016; Yagi et al., 2016; Bennet et al., 2017; Greco et al., 2018; Prole et al., 2018; Zaritsky et al., 2019; Carlsten et al., 2019). All of these efforts contribute to the detection of LSB galaxy populations and understand the evolution of dwarf galaxies in different environments.
In this paper, we present a list of dwarf galaxy candidates which are newly discovered in deep optical images of NGC 1291 taken by the Korea Microlensing Telescope Network (KMTNet; Kim et al. 2016b). NGC 1291 is located at a distance of 9.08 Mpc (McQuinn et al., 2017) and there are two potential companion galaxies that have similar recessional velocities (see Section 4.2). The survey of the NGC 1291 system, which has been thought to be a low-density environment, can contribute to the study of environmental effects on the evolution of dwarf galaxies. The basic properties of NGC 1291 are presented in Table 1. The KMTNet imager contains four CCD chips with a field-of-view (FoV) of 1 deg2 each, so the final mosaic images cover the whole area within the virial radius of NGC 1291111To obtain the virial radius of NGC 1291, we adopted the conversion equation of (Kravtsov, 2013). We assumed that the half-mass radius () can be replaced with the effective radius () because of a flat color profile in NGC 1291 (Byun et al., 2018).. In this study, we assumed that all of the dwarf galaxy candidates are located at the same distance as NGC 1291.
This paper is organized as follows. Section 2 describes the outline of the observations and the data reduction process. Section 3 presents a list of dwarf galaxy candidates, the completeness of detections, and the properties of the discovered dwarf galaxy candidates. Section 4 discusses the implications of the results for the evolution of dwarf galaxy candidates. Section 5 summarizes the results.
2 Data
We conducted deep optical imaging of NGC 1291 with KMTNet. Consisting of three 1.6-m identical telescopes, KMTNet is located at the Cerro Tololo Inter-American Observatory (CTIO), the South African Astronomical Observatory (SAAO), and Siding Spring Observatory (SSO). Each telescope contains a wide-field CCD camera with a FoV with average pixel scale of 0.4 arcsec. The data were taken at the KMTNet-CTIO observatory on November 12, 2015 with an average seeing of 1.1 arcsec. A total of 85 -band and 48 -band images were utilized which had total exposure times of 2.8 and 1.6 hrs, respectively. The images were taken by placing the target galaxy on each of the four chips with additional 7-points dithers. This strategy enabled us to obtain blank sky regions for dark-sky flat-fielding and also fill in the CCD gaps in the stacked images. The overall description of KMTNet Nearby Galaxy Survey (KNGS) project is also found in Byun et al. (2018).
The data reduction procedure used in this study is the same as that used in the previous study except for the addition of crosstalk correction (Kim et al., 2016a). We utilized crosstalk-corrected data this time to avoid confusing faint dwarf galaxies and artificial features. Brief description of the data reduction is as follows.
-
•
Overscan correction was adopted to subtract bias level because of the apparent instability of the bias frames.
-
•
Dark sky flat was generated by stacking all object frames with object-mask and then applied for flat-fielding.
-
•
A two-dimensional sky model was subtracted from each object frame to remove gradients over the sky background.
-
•
Accurate astrometric calibration was performed with SCAMP (Bertin, 2006) following the instructions provided by the KMTNet project team222http://kmtnet.kasi.re.kr, “Astrometric calibration for KMTNet data”.
-
•
Stacked images were generated by SWarp (Bertin et al., 2002) using median-combine without photometric calibration.
Finally, we obtained deep mosaic images with a FoV of 12 deg2 centered on NGC 1291 in the - and -bands. The photometric zero points for the mosaic images were determined using the AAVSO Photometric All-Sky Survey (APASS) DR9 catalog333https://www.aavso.org/apass, We derived magnitude using the conversion equation provided by Lupton (2005). The optimized data reduction procedure allowed to investigate the surface brightness down to 28–29 mag arcsec-2 within 1 limit.
3 Results
3.1 Detection
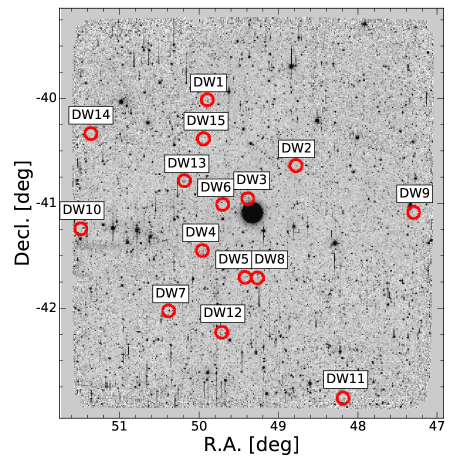
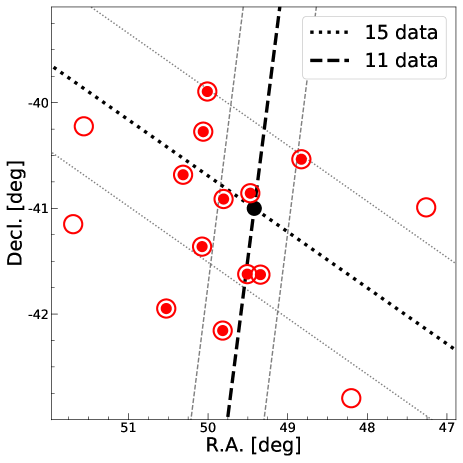
Four of us (W. Byun, Y.-K. Sheen, H. S. Park, and M. Kim) performed visual inspection for searching faint dwarf galaxies, independently. The dwarf galaxy candidates had to (1) have similar appearances in both - and -band images; (2) exhibit a smooth gradation of surface brightness on their outskirts to distinguish them from massive background galaxies; and (3) not be located at the vicinity of bright stars that may interfere with accurate identification. Each object discovered by each of us was then independently graded as “A/B/C”, where “A” is assigned to strong candidates with low surface brightness and extended light, “B” is assigned to ambiguous candidates with very low surface brightness, that can be easily confused with artifacts (e.g., crosstalk), “C” is assigned to less promising candidates with compact features. While a total of 35 objects were initially identified, we assessed that it might be biased by human subjectivity. Hence, we utilized the objects which are detected by at least two authors regardless of their grades. Then, we converted the grades “A/B/C” into the scores 25/15/5, and the objects with cumulative scores higher than 65 were designated as dwarf galaxy candidates. For the ambiguous candidates, several authors closely examined the images together for the final decision. This process resulted in the removal of probable background objects and tidal features from the list. A total of 15 dwarf galaxy candidates were identified and their locations are shown in Figure 1. Four out of our candidates (N1291-DW6/DW7/DW8/DW14) had been previously detected (Morshidi-Esslinger et al., 1999; Paturel et al., 2003), but the rest are newly discovered in this study.
Interestingly, most of the dwarf candidates were located on the eastern side of NGC 1291 and were distributed from north to south. Indeed, such structures have been reported in other studies (e.g., Metz et al. 2007; Ibata et al. 2013; Merritt et al. 2014; Tully et al. 2015; Müller et al. 2017). If the satellites are isotropically distributed around the host galaxy, there must be no dependency for the specific direction. So we performed a total least square fit using the dwarf candidates to find potential plane structures. As seen in the right panel of Figure 1, we divided the sample into two subsamples taking into account the uncertainty of virial radius of NGC 1291: kpc (open circles) and kpc (semi-filled circles). When using the whole data set, the dwarf candidates seemed to be aligning with a large scatter from the northwest to the southwest (dotted lines). Meanwhile, when only 11 candidates were used, they seemed to be more tightly aligned along the north-south direction (dashed lines). Note that such analyses can be affected by a projection effect, so further spectroscopic observations may be needed to confirm the planarity of the satellite galaxies.
3.2 Imaging simulation
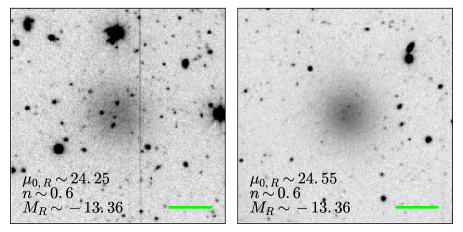
Imaging simulations were conducted to estimate the completeness of our visual inspection. Mock galaxies were generated on top of the mosaic image using photutils and astropy.modeling library in the PYTHON package. The mock galaxies were modeled by adopting the parameters of known dwarfs; (1) mag, (2) kpc, (3) Sérsic index , and (4) ellipticity . These mock galaxies were distributed randomly in the image and the line-of-sight distances were set to follow a Lorentzian distribution with a variance of 1 Mpc444To reflect the actual distribution of dwarf galaxies in MW-like galaxies, we employ an additional constraint that 10% of simulated galaxies have -1 Mpc. (cf. Smercina et al. 2018). The large wings in Lorentzian distribution can affect the completeness, but its effect appeared to be negligible because most of the simulated galaxies were located within a line-of-sight distance of 300–400 kpc. Figure 2 compares a simulated galaxy with a dwarf galaxy candidate discovered in this study.
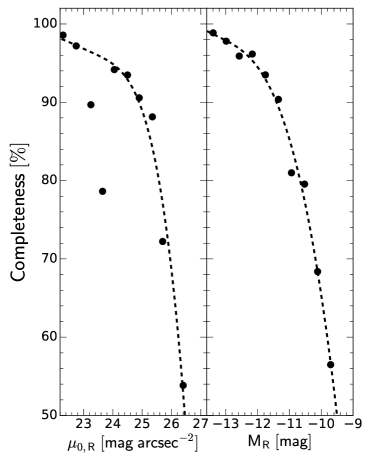
3.2.1 Completeness
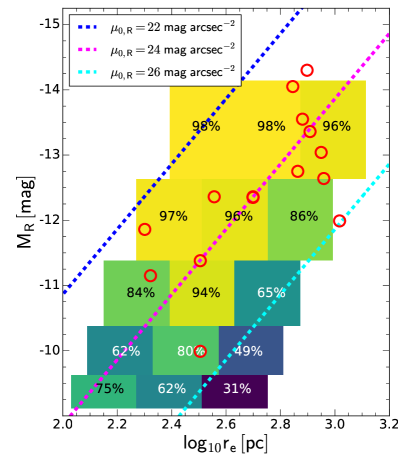
Eight imaging simulations were performed. In each simulation, 150 mock galaxies were generated. In order to estimate the completeness rate, the mock images were again subject to visual inspection. Note that we did not control the mock galaxies which are overlapped with bright objects, so the following results are presented as the lower limit. As shown in the left panel of Figure 3, the completeness rate reaches over 90% for mag in all galaxy sizes and 70% for mag. Meanwhile, the completeness rate appears to be much sensitive to the galaxy size or central surface brightness for mag. This result is mainly due to confusion between small dwarf galaxies and massive background galaxies, and also partly induced by the 3 surface brightness limit of 26.5 mag arcsec-2 in the mosaic image (see Byun et al., 2018). The right panel of Figure 3 also shows the average completeness rates against central surface brightness and absolute magnitude. Although the points are sparsely distributed, the fitted curves support that the completeness rate reaches over 70% for mag and 26 mag arcsec-2.
| ID | R.A.(J2000) | Decl.(J2000) | aaApparent magnitude calculated by Eq. 2. | bbColor measured within 2 effective radius derived from -band image. | ccCentral surface brightness (), Sérsic index () and effective radius () in -band image derived from the 1-D profile fit. | ccCentral surface brightness (), Sérsic index () and effective radius () in -band image derived from the 1-D profile fit. | ccCentral surface brightness (), Sérsic index () and effective radius () in -band image derived from the 1-D profile fit. | ddAbsolute magnitude calculated by assuming that the dwarfs are at the same distance as NGC 1291 ( Mpc). | eeStellar mass estimated with an equation of adopted from Into & Portinari (2013). | |
|---|---|---|---|---|---|---|---|---|---|---|
| (hh:mm:ss) | (dd:mm:ss) | (mag) | (mag) | (mag arcsec-2) | (″) | (mag) | () | |||
| N1291-DW1 | 3:19:25.9 | -40:03:47 | 17.460.13 | 1.31 | 24.180.19 | 0.650.03 | 11.300.23 | -12.34 | 6.97 | |
| N1291-DW2 | 3:15:09.7 | -40:40:05 | 17.050.13 | 1.17 | 24.610.19 | 0.650.03 | 16.620.38 | -12.75 | 7.03 | |
| N1291-DW3 | 3:17:29.4 | -40:58:22 | 16.250.05 | 1.36 | 23.810.07 | 0.710.01 | 17.300.17 | -13.55 | 7.45 | |
| N1291-DW4 | 3:19:43.1 | -41:26:54 | 16.440.08 | 1.28 | 24.250.13 | 0.600.02 | 18.470.26 | -13.36 | 7.42 | |
| N1291-DW5 | 3:17:38.1 | -41:41:45 | 16.760.10 | 1.16 | 24.570.14 | 0.770.02 | 20.320.42 | -13.04 | 7.15 | |
| N1291-DW6ffCross-ID: [MDS99] F301-056, [MDS99] F301-044, [MDS99] F301-064, LEDA 587327, respectively. | 3:18:43.0 | -41:01:27 | 17.440.18 | 1.14 | 23.090.24 | 0.880.04 | 8.240.17 | -12.36 | 6.87 | |
| N1291-DW7ffCross-ID: [MDS99] F301-056, [MDS99] F301-044, [MDS99] F301-064, LEDA 587327, respectively. | 3:21:24.4 | -41:59:44 | 15.500.04 | 1.13 | 23.340.06 | 0.580.01 | 17.860.14 | -14.30 | 7.48 | |
| N1291-DW8ffCross-ID: [MDS99] F301-056, [MDS99] F301-044, [MDS99] F301-064, LEDA 587327, respectively. | 3:17:01.4 | -41:42:01 | 15.750.10 | 1.23 | 22.950.13 | 0.820.02 | 15.880.24 | -14.05 | 7.59 | |
| N1291-DW9 | 3:09:25.1 | -41:04:57 | 18.420.18 | 1.20 | 23.900.23 | 0.840.04 | 7.370.14 | -11.38 | 6.47 | |
| N1291-DW10 | 3:25:38.4 | -41:13:51 | 17.160.23 | 1.11 | 25.080.32 | 0.720.05 | 20.600.82 | -12.64 | 6.99 | |
| N1291-DW11 | 3:12:44.2 | -42:47:54 | 17.510.32 | 0.81 | 23.990.44 | 0.800.07 | 11.630.54 | -12.36 | 6.59 | |
| N1291-DW12 | 3:18:47.0 | -42:11:58 | 19.810.36 | 1.12 | 25.190.54 | 0.750.09 | 7.220.26 | -9.99 | 5.98 | |
| N1291-DW13 | 3:20:33.8 | -40:48:18 | 17.810.34 | 1.22 | 26.390.55 | 0.480.08 | 23.601.89 | -11.99 | 6.62 | |
| N1291-DW14ffCross-ID: [MDS99] F301-056, [MDS99] F301-044, [MDS99] F301-064, LEDA 587327, respectively. | 3:25:02.8 | -40:21:32 | 17.940.48 | 1.02 | 22.660.63 | 0.800.11 | 4.560.18 | -11.86 | 6.45 | |
| N1291-DW15 | 3:19:37.7 | -40:25:17 | 18.650.32 | 1.07 | 22.830.38 | 1.070.22 | 4.820.22 | -11.15 | 6.20 |
Note. — Magnitudes and surface brightnesses are uncorrected for Galactic extinction.
3.3 Structural and photometric properties
This section presents the properties of the dwarf galaxy candidates mainly using -band images (Table 2).
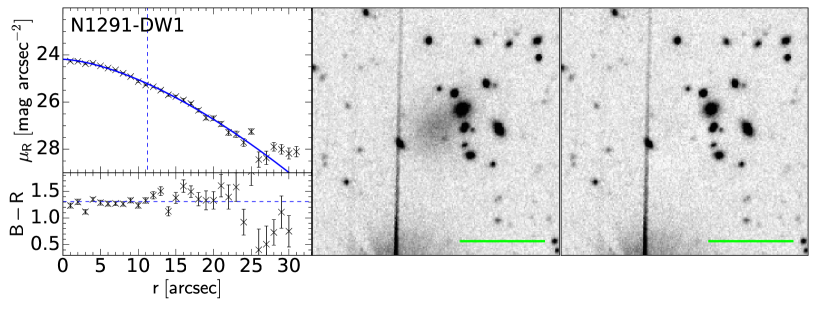
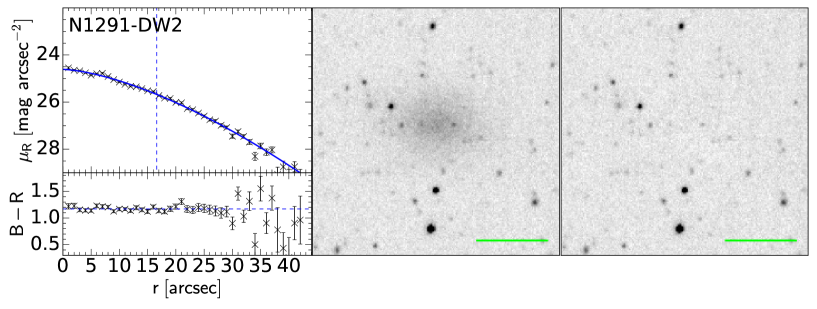
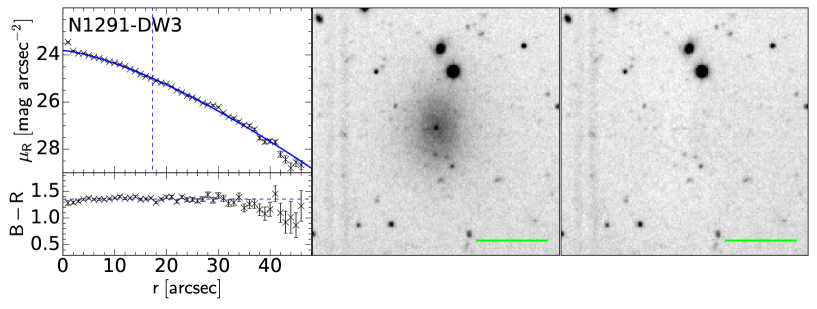
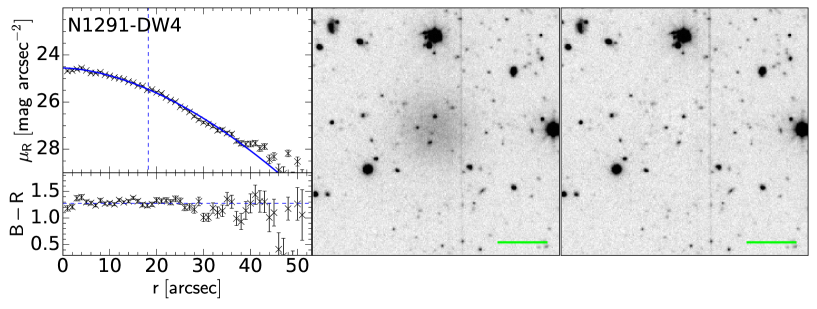
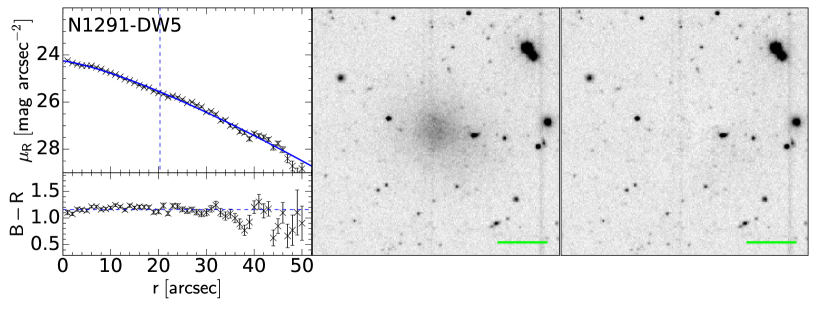
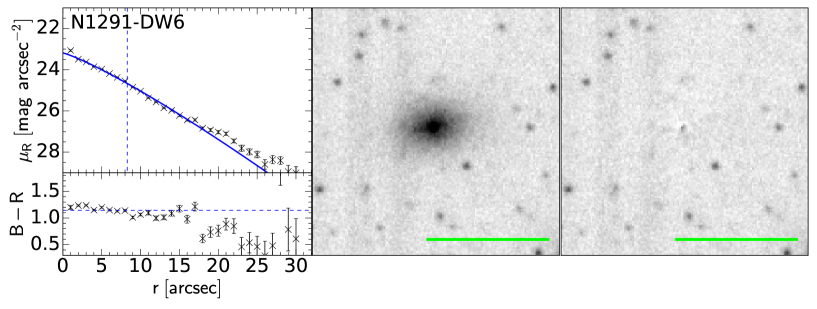
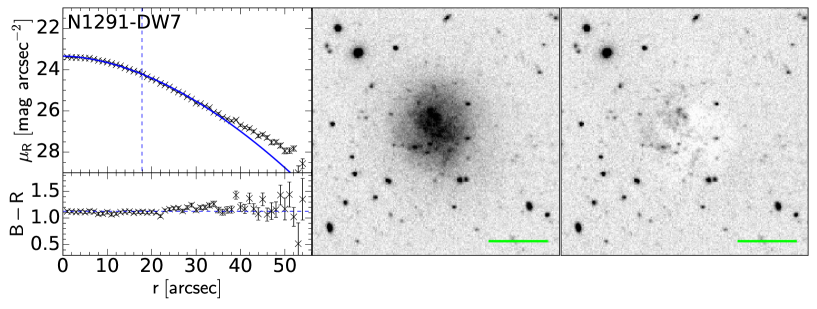
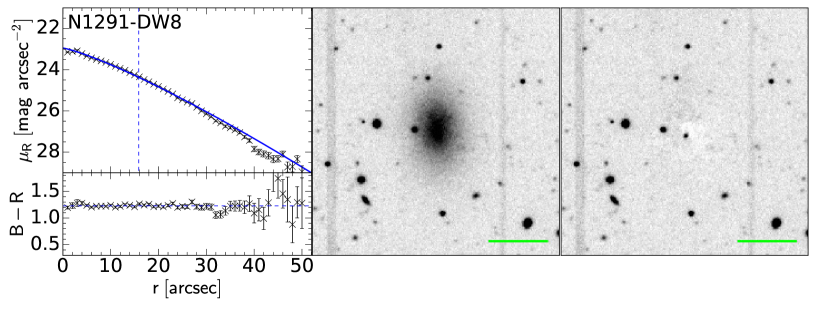
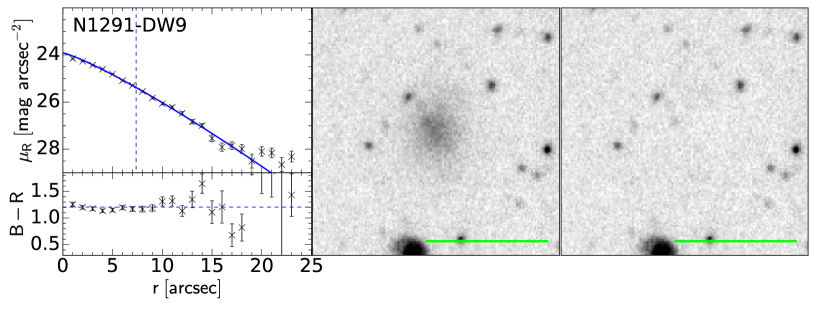
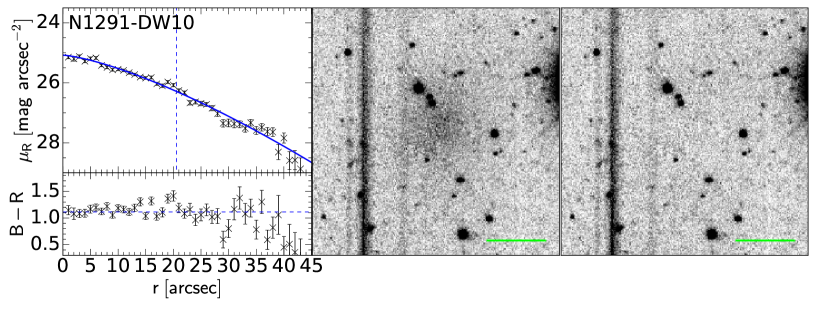
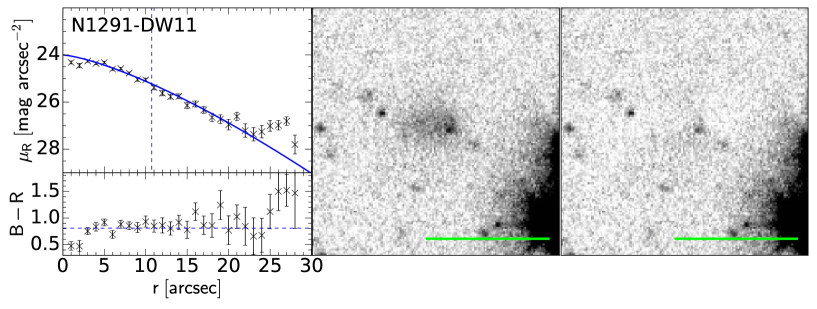
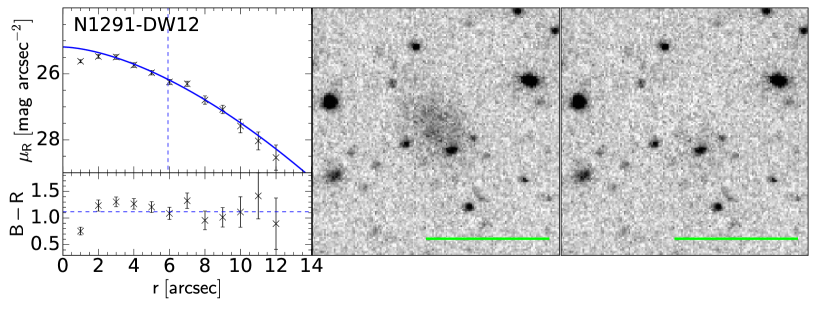
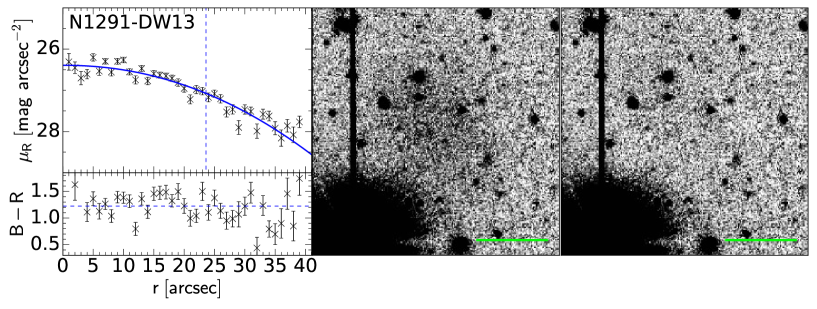
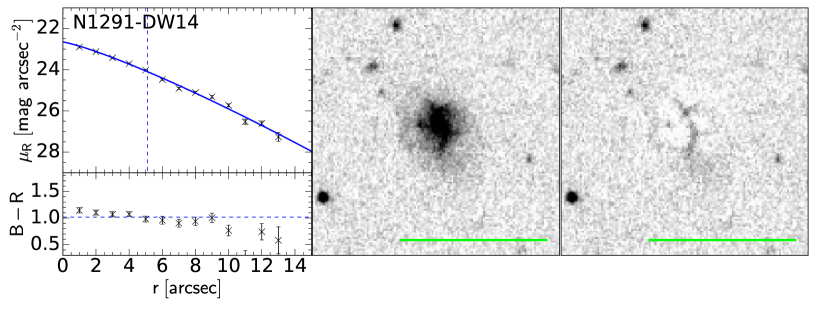
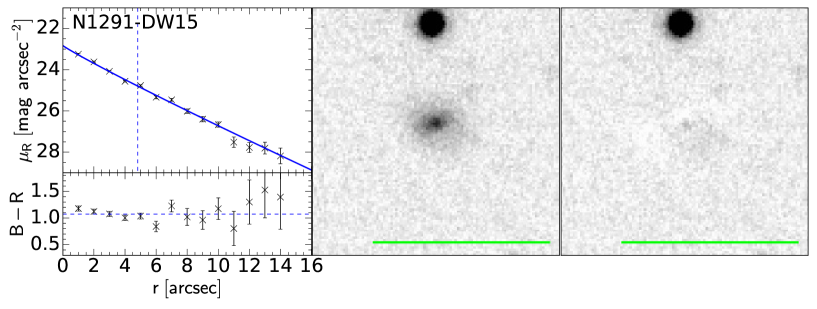
The images were prepared by subtracting the sky background from each cutout image using a two-dimensional polynomial model. Note that the sky subtraction was performed before the mosaic images were generated, but there local sky fluctuations may have introduced residuals. The surface brightness profiles of the dwarf galaxy candidates were estimated in - and -band images using the ELLIPSE task in IRAF. All parameters were first fit freely. Then the central position, ellipticity, and position angle values at the effective radius of each dwarf candidate were conservatively calculated based on the initial results. Finally, the isophotal fit was performed again using the three values above as fixed parameters over the whole radius.
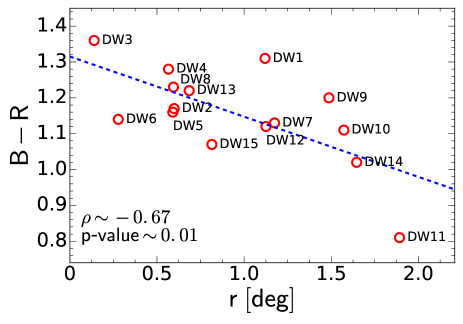
Figure 4 shows both the original and model-subtracted cutout images. Most of the removed objects left no residuals, but some (N1291-DW7/DW14) left irregular features due to their clumpy structures. Note that they seem like background spiral galaxies, but their central surface brightnesses are somewhat fainter than that of the typical spiral galaxies ( mag arcsec-2; see Bosma & Freeman, 1993 and references therein), implying that they are likely to be dwarf galaxies. Several dwarf spiral galaxies have been found in the nearby Universe although they are rare (cf. Schombert et al. 1995; Lisker et al. 2006). However, without any confirmation of their distances, it is hard to determine the real nature of them.
The azimuthally averaged surface brightness and color profiles are also presented in Figure 4. Note that the parameters presented in this section are not corrected by foreground Galactic extinction because the expected reddening effect towards NGC 1291 is negligible at .
The central surface brightnesses of the candidates are distributed between mag arcsec-2 and their average central surface brightness is 24.05 mag arcsec-2. The surface brightness profiles were fitted with a single Sérsic function which is commonly expressed as
| (1) |
where is the effective radius, is the intensity at the effective radius, is the Sérsic index, and , a constant adopted from Capaccioli (1989) (see also Ciotti & Bertin, 1999). Data points within the innermost 2 arcsec and which are fainter than 28 mag arcsec-2 were not used for the fit. As a result, all dwarf galaxy candidates were well described with a single Sérsic fit (blue solid lines in Figure 5). The effective radii were estimated to be arcsec (vertical lines in Figure 4). At a distance of 9.08 Mpc, it corresponds to 200 pc to 1 kpc. Sérsic indices were with an average value of 0.74. The total magnitudes of the dwarf galaxy candidates were estimated to be mag using the following equation of
| (2) |
where is the intensity at the center, is the scale length that satisfies the equation of , and is the gamma function. Note that considering the image depth difference and large errors, there was no significant difference with the literature results of the four previously detected galaxies in terms of the central surface brightnesses and the apparent magnitudes.
The weighted average colors are shown as horizontal dashed lines in Figure 4. The color range is 0.8 1.5 mag and the average value is 1.16 mag. Taking into account large errors in the outer regions, most of the candidates exhibited weak or no gradients in their color profiles.
Furthermore, their stellar masses were calculated using the mass-to-light ratio of from exponential star formation history with Kroupa initial mass function developed by Into & Portinari (2013). The average stellar mass is . The stellar masses were also estimated using other mass-to-light ratios found in Bell & de Jong (2001) to quantify the uncertainty of the stellar masses. The deviation for estimating stellar mass was revealed up to 20%. Note that detailed stellar evolution uncertainty was not considered, so the true deviation may be much larger (cf. Conroy 2013).
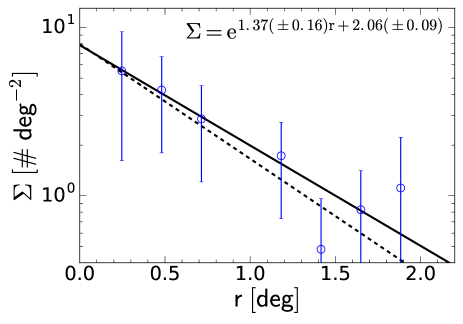
Figure 5 shows the color distribution of the dwarf galaxy candidates as a function of their projected distance from the center of NGC 1291. Though the candidates are significantly scattered, there seems to be a negative linear correlation, which has also been reported in much massive environments (e.g., Venhola et al., 2019). Note that the color of dwarf galaxies can be affected by their masses and magnitudes (e.g., Binggeli et al., 1985; Conselice et al., 2002; Adami et al., 2006; Lieder et al., 2012; Yagi et al., 2016). We found that the color of the dwarf candidates are weakly correlated with the absolute magnitudes, but there is no statistically significant correlation between the total magnitudes and the projected distances. Indeed, Phillips et al. (2015) have reported that the quenching process of the satellite galaxies around isolated MW-like host galaxies can be effective at lower stellar masses (). Therefore, a negative color gradient for the projected distance can be interpreted as a result of the quenching process of the satellite galaxies in the halo of NGC 1291 which also implies that the dwarf candidates may be accompanying NGC 1291.
Interestingly, N1291-DW3 and DW6 show weak excess of light in their innermost regions as nucleated cores. Given that they are the nearest candidates to NGC 1291, the nucleated core was likely a product of the tidal perturbation between the host and the satellite galaxies (cf. Binggeli & Cameron, 1991; Oh & Lin, 2000). However, the exact mechanism behind nucleation in dwarf galaxies is still a subject of debate (cf. Grant et al. 2005 and references therein). Moreover, Park et al. (2019) mentioned that the environment in different dynamic states can affect the correlation between the nucleated fraction and other physical properties of dwarf galaxies. More surveys of dwarf galaxies must be conducted, especially of those in environments similar to the one found in the NGC 1291 system.
3.4 Number density profile
Figure 6 presents two different radial number density profiles for the dwarf galaxy candidates according to their projected distance from the center of NGC 1291. The small sample size made the fit sensitive to the binning size, so two binning sizes were used: (1) equal linear distance in each annulus and (2) equal area in each annulus. Each can be well described by an exponential function up to the virial radius of NGC 1291. The two methods yielded the number densities of and , respectively. These results are relatively similar and within the error budget. It may be inappropriate to extract physically meaningful results from this fit because of the limited sample size on which it was based, but it is worth noting that the number density profiles showed centrally concentrated distributions, implying that the dwarf candidates are associated with NGC 1291.
4 Discussion
4.1 Comparisons with dwarfs in other host systems
NGC 1291 has been thought to reside in a relatively isolated environment. For instance, NGC 1291 accompanies a single bright galaxy ( mag) and 15 dwarf galaxy candidates within the projected distance of kpc. If the properties of dwarf galaxies are easily affected by the environment, the comparison between the dwarf candidates discovered in this study and those in other host systems with different populations can provide useful insight into the evolution of dwarf galaxies. The following samples were chosen because they provided available data on structural and photometric properties of their satellites, regardless of their distance confirmations using resolved individual stars.
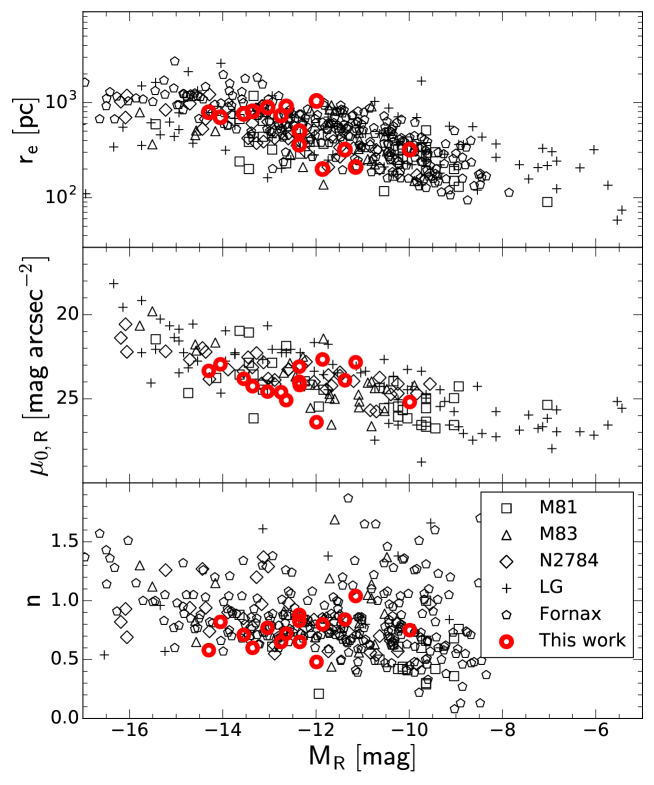
Figure 7 presents the effective radii, central surface brightnesses, and Sérsic indices of the dwarf candidates as a function of absolute magnitude. For the sake of simplicity, we assumed that the dwarf candidates are located at the distance of NGC 1291 (9.08 Mpc). The properties of known dwarfs in other host systems as well as the Fornax cluster are also presented. The structural and photometric properties of the dwarf candidates in the NGC 1291 system were revealed to be similar to those in other environments. Their significant distribution indicates that the shapes of dwarf galaxies are independent of their environments. This finding also supports the assumption that the dwarfs are located at approximately the same distances as NGC 1291. In fact, it cannot be a robust evidence as a shift in their distances would not entirely separate them from a distribution with the bulk of dwarf galaxies. However, most of the dwarf candidates are unlikely to be located in the foreground or background because no other host systems is found in the images that may be associated with dwarf candidates.
We also compared the colors of the dwarf candidates with those provided from the literatures. Interestingly, the average color of the dwarf galaxy candidates, ()555We used the interpolated conversion factors of , matching to the color of each candidate adopted from Fukugita et al. (1995), is slightly smaller than that of the dwarfs in the M83 group (; Müller et al. 2015), the M101 group (; Merritt et al. 2014), the M106 group (; Kim et al. 2011), and the NGC 2784 group (; Park et al. 2017). Note that the corrections for Galactic extinction were performed for all five samples and the colors in other studies were converted from and -band using the equation of Lupton (2005) if necessary. Indeed, this result may be inconclusive because of marginal uncertainties in color measurement, and systematic differences among the studies in the observational conditions. Nevertheless, we suggest that the comparison of color distributions under the strict conditions will be helpful in exploring the evolution of dwarf satellite galaxies in different host systems.
The color of dwarf satellite galaxies can be affected by their own masses and their projected distances from their host galaxies, which as shown in Figure 5. Therefore, we utilized subsamples with the absolute magnitude range of mag to avoid the mass effect as well as the incomplete detection issue. Secondly, we used the projected distance cut with kpc, adopted from the FoV limit of M106 survey (Kim et al., 2011). Note that the projected distance limit is broadly consistent with a half of the virial radius of each system, so dwarf galaxies within it are expected to have sufficiently experienced the environmental effect.
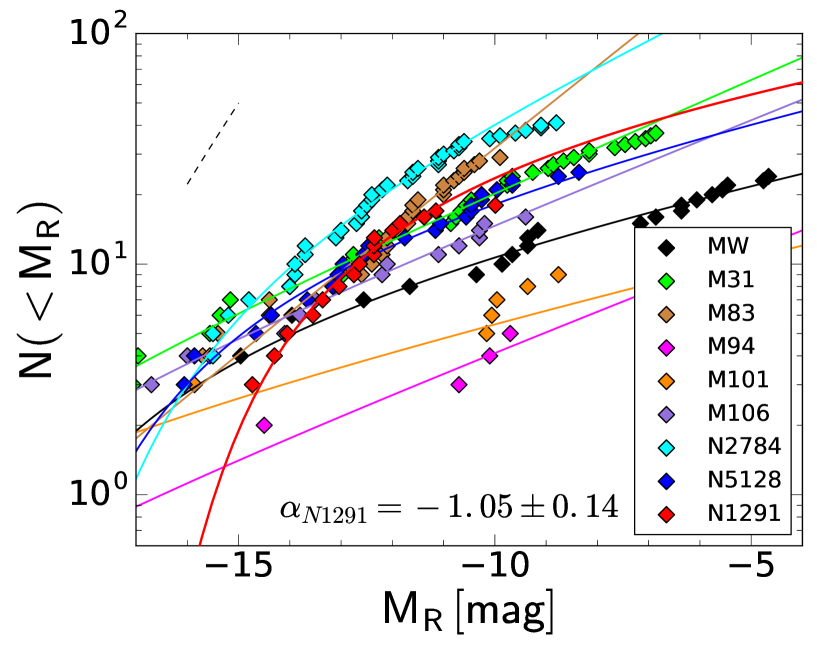
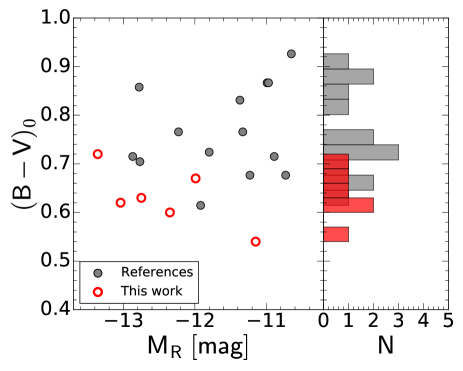
Figure 8 shows the color distributions of dwarf candidates in the NGC 1291 system and other dwarf galaxies. Approximately 15 dwarfs in the M83, M101, M106, NGC 2784 groups were selected as counterparts and their average color is . Six of the dwarf candidates in the NGC 1291 system were selected with an average color of . The Kolmogorov-Smirnov test also indicated that the color distributions of the two samples are unlikely to have been drawn from the same population (p-value ). The dwarf candidates in the NGC 1291 system seem to have magnitude-dependent color distributions, while dwarf galaxies in other host systems tend to be redder regardless of their absolute magnitudes. This difference tends to be more obvious in less luminous dwarf galaxies which are thought to be susceptible to environmental effect due to their less massive dark matter halos. It shows that the dwarf satellite galaxies around NGC 1291 is somewhat less quenched than those in other system. It is noteworthy that although host galaxies resemble each other in terms of stellar mass, the evolution of dwarf satellite galaxies around them can vary.
4.2 Cumulative luminosity functions
We examined the cumulative luminosity function (LF) of the NGC 1291 system. The Schechter function (Schechter, 1976) was employed, which is:
| (3) |
where is the number of galaxies brighter than , is a scaling factor, is the faint-end slope, is the characteristic magnitude where the break of LF occurs, and is the upper incomplete gamma function. To improve the completeness of the LF, we included potential members of the NGC 1291 system using the radial velocity range of km s-1 (ESO 300-14; , ESO 300-16; ). Their projected distances from the center of NGC 1291 are 230 kpc and 280 kpc, respectively. Note that the velocity offset of 150km s-1 for NGC 1291 was defined based on the velocity distribution of nearby objects, but it did not significantly affect the slope of the faint-end.
Figure 9 compares the cumulative LF of the faint galaxies in the NGC 1291 system with those of the MW&M31 (McConnachie, 2012; Martin et al., 2013a, b), M83 (Müller et al., 2015), M94 (Karachentsev et al., 2013; Smercina et al., 2018), M101 (Bennet et al., 2019), M106 (Kim et al., 2011), NGC 2784 (Park et al., 2017), NGC 5128 (Crnojević et al., 2019). Note that the incompleteness introduced from the different FoV covered by each study may affect the following results. Since the dwarf satellites in M83, M106, NGC 2784 and NGC 1291 have not yet been confirmed to be located at each host system, the resulting LFs can be regarded as upper limits at the moment. In order to directly compare the references, only galaxies with absolute magnitudes of 666For the sake of simplicity, we used the conversion factor of , from Fukugita et al. (1995) mag were used. The faint magnitude limits of the samples were adopted to have a completeness rate higher than 90% in each study. We found that the faint-end slope in the NGC 1291 system is , which is much flatter than that predicted by the CDM model (; Trentham & Tully, 2002) shown as dashed line in Figure 9. It is similar to that of the MW (), M31 (), M83 (), M94 (), M101 (), M106 (), NGC 2784 (), NGC 5128 (). Note that we could not derive uncertainties for M94 and M101 because of their sparse satellite populations in the system. This result may indicate that the population of low-mass dwarf galaxies in the NGC 1291 system is indistinct from those in other host systems.
5 Summary
In this study, 15 dwarf galaxy candidates were identified by visual inspection of deep and wide-field images of NGC 1291 obtained with KMTNet. Of those 15 candidates, 11 are newly discovered in this study. We performed imaging simulations and estimated the completeness of the visual inspection that was above 70% in 26 mag arcsec-2 and mag. The photometric and structural properties of dwarf candidates were measured, the results of which are summarized as follows.
-
1.
The surface brightness profiles of dwarf galaxy candidates were well described with a single Sérsic function. The structural and photometric properties were similar to those of ordinary dwarf galaxies, with a central surface brightness of 22.5–26.5 mag arcsec-2 and effective radii of 0.2–1 kpc. Assuming that they are located at 9.08 Mpc, the absolute magnitudes of the 15 dwarf galaxy candidates are mag.
-
2.
Only the two nearest dwarf candidates from NGC 1291 exhibited nucleated cores. The colors of the dwarf candidates seem to be linearly correlated with their projected distances from the center of NGC 1291. This result may have been a product of the interaction between the host and satellite galaxies, such as tidal interactions and the quenching process.
-
3.
In order to understand the evolution of dwarfs in different environments, the properties of the dwarf candidates were compared to those in other host systems. The color distribution of dwarf candidates is the only property dissimilar from those of other dwarfs in other satellite population systems as the candidates are slightly bluer than other dwarfs. This result indicates that the dwarfs in the NGC 1291 system are likely less quenched than dwarfs in other host systems. It also reveals that environments play an important role in the quenching process but may not affect the morphology shaping of dwarf galaxies.
References
- Adami et al. (2006) Adami, C., Picat, J. P., Savine, C., et al. 2006, A&A, 451, 1159
- Bell & de Jong (2001) Bell, E. F., & de Jong, R. S. 2001, ApJ, 550, 212
- Bennet et al. (2019) Bennet, P., Sand, D. J., Crnojević, D., et al. 2019, ApJ, 885, 153
- Bennet et al. (2017) —. 2017, ApJ, 850, 109
- Bertin (2006) Bertin, E. 2006, in Astronomical Society of the Pacific Conference Series, Vol. 351, Astronomical Data Analysis Software and Systems XV, ed. C. Gabriel, C. Arviset, D. Ponz, & S. Enrique, 112
- Bertin et al. (2002) Bertin, E., Mellier, Y., Radovich, M., et al. 2002, in Astronomical Society of the Pacific Conference Series, Vol. 281, Astronomical Data Analysis Software and Systems XI, ed. D. A. Bohlender, D. Durand, & T. H. Handley, 228
- Binggeli & Cameron (1991) Binggeli, B., & Cameron, L. M. 1991, A&A, 252, 27
- Binggeli et al. (1985) Binggeli, B., Sandage, A., & Tammann, G. A. 1985, AJ, 90, 1681
- Bosma & Freeman (1993) Bosma, A., & Freeman, K. C. 1993, AJ, 106, 1394
- Bothun et al. (1991) Bothun, G. D., Impey, C. D., & Malin, D. F. 1991, ApJ, 376, 404
- Boylan-Kolchin et al. (2011) Boylan-Kolchin, M., Bullock, J. S., & Kaplinghat, M. 2011, MNRAS, 415, L40
- Bullock & Boylan-Kolchin (2017) Bullock, J. S., & Boylan-Kolchin, M. 2017, ARA&A, 55, 343
- Byun et al. (2018) Byun, W., Sheen, Y.-K., Ho, L. C., et al. 2018, AJ, 156, 249
- Capaccioli (1989) Capaccioli, M. 1989, in World of Galaxies (Le Monde des Galaxies), ed. J. Corwin, Harold G. & L. Bottinelli, 208–227
- Capaccioli et al. (2015) Capaccioli, M., Spavone, M., Grado, A., et al. 2015, A&A, 581, A10
- Carlsten et al. (2019) Carlsten, S. G., Greco, J. P., Beaton, R. L., & Greene, J. E. 2019, arXiv e-prints, arXiv:1909.07389
- Chiboucas et al. (2009) Chiboucas, K., Karachentsev, I. D., & Tully, R. B. 2009, AJ, 137, 3009
- Ciotti & Bertin (1999) Ciotti, L., & Bertin, G. 1999, A&A, 352, 447
- Conroy (2013) Conroy, C. 2013, ARA&A, 51, 393
- Conselice et al. (2002) Conselice, C. J., Gallagher, John S., I., & Wyse, R. F. G. 2002, AJ, 123, 2246
- Crnojević et al. (2019) Crnojević, D., Sand, D. J., Bennet, P., et al. 2019, ApJ, 872, 80
- Dalcanton et al. (1997) Dalcanton, J. J., Spergel, D. N., Gunn, J. E., Schmidt, M., & Schneider, D. P. 1997, AJ, 114, 635
- Davies et al. (2016) Davies, J. I., Davies, L. J. M., & Keenan, O. C. 2016, MNRAS, 456, 1607
- Ferrarese et al. (2012) Ferrarese, L., Côté, P., Cuilland re, J.-C., et al. 2012, ApJS, 200, 4
- Fliri & Trujillo (2016) Fliri, J., & Trujillo, I. 2016, MNRAS, 456, 1359
- Font et al. (2011) Font, A. S., Benson, A. J., Bower, R. G., et al. 2011, MNRAS, 417, 1260
- Fukugita et al. (1995) Fukugita, M., Shimasaku, K., & Ichikawa, T. 1995, PASP, 107, 945
- Garrison-Kimmel et al. (2017) Garrison-Kimmel, S., Wetzel, A., Bullock, J. S., et al. 2017, MNRAS, 471, 1709
- Grant et al. (2005) Grant, N. I., Kuipers, J. A., & Phillipps, S. 2005, MNRAS, 363, 1019
- Greco et al. (2018) Greco, J. P., Greene, J. E., Strauss, M. A., et al. 2018, ApJ, 857, 104
- Henkel et al. (2017) Henkel, C., Javanmardi, B., Martínez-Delgado, D., Kroupa, P., & Teuwen, K. 2017, A&A, 603, A18
- Ibata et al. (2013) Ibata, R. A., Lewis, G. F., Conn, A. R., et al. 2013, Nature, 493, 62
- Impey et al. (1988) Impey, C., Bothun, G., & Malin, D. 1988, ApJ, 330, 634
- Into & Portinari (2013) Into, T., & Portinari, L. 2013, MNRAS, 430, 2715
- Javanmardi et al. (2016) Javanmardi, B., Martinez-Delgado, D., Kroupa, P., et al. 2016, A&A, 588, A89
- Jerjen et al. (2000) Jerjen, H., Binggeli, B., & Freeman, K. C. 2000, AJ, 119, 593
- Karachentsev et al. (2013) Karachentsev, I. D., Makarov, D. I., & Kaisina, E. I. 2013, AJ, 145, 101
- Kim et al. (2011) Kim, E., Kim, M., Hwang, N., et al. 2011, MNRAS, 412, 1881
- Kim et al. (2016a) Kim, S.-L., Cha, S.-M., Lee, C.-U., et al. 2016a, Publication of Korean Astronomical Society, 31, 35
- Kim et al. (2016b) Kim, S.-L., Lee, C.-U., Park, B.-G., et al. 2016b, Journal of Korean Astronomical Society, 49, 37
- Klypin et al. (1999) Klypin, A., Kravtsov, A. V., Valenzuela, O., & Prada, F. 1999, ApJ, 522, 82
- Kondapally et al. (2018) Kondapally, R., Russell, G. A., Conselice, C. J., & Penny, S. J. 2018, MNRAS, 481, 1759
- Kravtsov (2013) Kravtsov, A. V. 2013, ApJ, 764, L31
- Kravtsov et al. (2004) Kravtsov, A. V., Gnedin, O. Y., & Klypin, A. A. 2004, ApJ, 609, 482
- Leisman et al. (2017) Leisman, L., Haynes, M. P., Janowiecki, S., et al. 2017, ApJ, 842, 133
- Li et al. (2011) Li, J.-T., Wang, Q. D., Li, Z., & Chen, Y. 2011, ApJ, 737, 41
- Lieder et al. (2012) Lieder, S., Lisker, T., Hilker, M., Misgeld, I., & Durrell, P. 2012, A&A, 538, A69
- Lisker et al. (2006) Lisker, T., Grebel, E. K., & Binggeli, B. 2006, AJ, 132, 497
-
Lupton (2005)
Lupton, R. H. 2005, Transformations between SDSS magnitudes and other
systems,
https://www.sdss.org/dr15/algorithms
/sdssubvritransform/#Lupton(2005) - Martin et al. (2013a) Martin, N. F., Slater, C. T., Schlafly, E. F., et al. 2013a, ApJ, 772, 15
- Martin et al. (2013b) Martin, N. F., Schlafly, E. F., Slater, C. T., et al. 2013b, ApJ, 779, L10
- McConnachie (2012) McConnachie, A. W. 2012, AJ, 144, 4
- McQuinn et al. (2017) McQuinn, K. B. W., Skillman, E. D., Dolphin, A. E., Berg, D., & Kennicutt, R. 2017, AJ, 154, 51
- Merritt et al. (2014) Merritt, A., van Dokkum, P., & Abraham, R. 2014, ApJ, 787, L37
- Merritt et al. (2016) Merritt, A., van Dokkum, P., Danieli, S., et al. 2016, ApJ, 833, 168
- Metz et al. (2007) Metz, M., Kroupa, P., & Jerjen, H. 2007, MNRAS, 374, 1125
- Mihos et al. (2015) Mihos, J. C., Durrell, P. R., Ferrarese, L., et al. 2015, ApJ, 809, L21
- Moore et al. (1999) Moore, B., Ghigna, S., Governato, F., et al. 1999, ApJ, 524, L19
- Morshidi-Esslinger et al. (1999) Morshidi-Esslinger, Z., Davies, J. I., & Smith, R. M. 1999, MNRAS, 304, 297
- Muñoz et al. (2015) Muñoz, R. P., Eigenthaler, P., Puzia, T. H., et al. 2015, ApJ, 813, L15
- Müller et al. (2015) Müller, O., Jerjen, H., & Binggeli, B. 2015, A&A, 583, A79
- Müller et al. (2017) Müller, O., Scalera, R., Binggeli, B., & Jerjen, H. 2017, A&A, 602, A119
- Oh & Lin (2000) Oh, K. S., & Lin, D. N. C. 2000, ApJ, 543, 620
- Park et al. (2019) Park, H. S., Moon, D.-S., Zaritsky, D., et al. 2019, ApJ, 885, 88
- Park et al. (2017) —. 2017, ApJ, 848, 19
- Paturel et al. (2003) Paturel, G., Petit, C., Prugniel, P., et al. 2003, A&A, 412, 45
- Pawlowski et al. (2012) Pawlowski, M. S., Pflamm-Altenburg, J., & Kroupa, P. 2012, MNRAS, 423, 1109
- Phillips et al. (2015) Phillips, J. I., Wheeler, C., Cooper, M. C., et al. 2015, MNRAS, 447, 698
- Prole et al. (2018) Prole, D. J., Davies, J. I., Keenan, O. C., & Davies, L. J. M. 2018, MNRAS, 478, 667
- Sandage & Binggeli (1984) Sandage, A., & Binggeli, B. 1984, AJ, 89, 919
- Schechter (1976) Schechter, P. 1976, ApJ, 203, 297
- Schombert et al. (1995) Schombert, J. M., Pildis, R. A., Eder, J. A., & Oemler, Augustus, J. 1995, AJ, 110, 2067
- Smercina et al. (2018) Smercina, A., Bell, E. F., Price, P. A., et al. 2018, ApJ, 863, 152
- Trentham & Tully (2002) Trentham, N., & Tully, R. B. 2002, MNRAS, 335, 712
- Tully et al. (2015) Tully, R. B., Libeskind, N. I., Karachentsev, I. D., et al. 2015, ApJ, 802, L25
- van der Burg et al. (2016) van der Burg, R. F. J., Muzzin, A., & Hoekstra, H. 2016, A&A, 590, A20
- van Dokkum et al. (2015) van Dokkum, P. G., Abraham, R., Merritt, A., et al. 2015, ApJ, 798, L45
- Venhola et al. (2017) Venhola, A., Peletier, R., Laurikainen, E., et al. 2017, A&A, 608, A142
- Venhola et al. (2019) —. 2019, A&A, 625, A143
- Yagi et al. (2016) Yagi, M., Koda, J., Komiyama, Y., & Yamanoi, H. 2016, ApJS, 225, 11
- York et al. (2000) York, D. G., Adelman, J., Anderson, John E., J., et al. 2000, AJ, 120, 1579
- Zaritsky et al. (2019) Zaritsky, D., Donnerstein, R., Dey, A., et al. 2019, ApJS, 240, 1