Your Noise, My Signal: Exploiting Switching Noise for Stealthy Data Exfiltration from Desktop Computers
Abstract.
Attacks based on power analysis have been long existing and studied, with some recent works focused on data exfiltration from victim systems without using conventional communications (e.g., WiFi). Nonetheless, prior works typically rely on intrusive direct power measurement, either by implanting meters in the power outlet or tapping into the power cable, thus jeopardizing the stealthiness of attacks. In this paper, we propose (Noise for Data Exfiltration), a new system for stealthy data exfiltration from enterprise desktop computers. Specifically, achieves data exfiltration over a building’s power network by exploiting high-frequency voltage ripples (i.e., switching noises) generated by power factor correction circuits built into today’s computers. Located at a distance and even from a different room, the receiver can non-intrusively measure the voltage of a power outlet to capture the high-frequency switching noises for online information decoding without supervised training/learning. To evaluate , we run experiments on seven different computers from top vendors and using top-brand power supply units. Our results show that for a single transmitter, achieves a rate of up to 28.48 bits/second with a distance of 90 feet (27.4 meters) without the line of sight, demonstrating a practically stealthy threat. Based on the orthogonality of switching noise frequencies of different computers, we also demonstrate simultaneous data exfiltration from four computers using only one receiver. Finally, we present a few possible defenses, such as installing noise filters, and discuss their limitations.
1. Introduction
The total number of registered malware samples has grown by 36% in the past year and reached an all-time high of 690 million, let alone the huge number of undiscovered malware (Security_Malware_ThreatReport_McAfee_March_2018, ). Importantly, more than 70% of the malware threats are in the form of phishing, spywares, and Trojans that aim at stealing sensitive information, especially from end users in companies, universities, among others (which we collectively refer to as enterprise) (Security_Threat_Survey_SANS_2017, ).
In the wake of growing risks of data theft, a proactive defense is to keep sensitive data within an enterprise network at all times. Nonetheless, this approach is vulnerable to various types of covert channel attacks, through which sensitive data is stealthily transferred to a program that can access external networks and eventually send information to the outside (Security_Covert_Channels_SANS_2010, ; Security_Covert_Channel_Mobile_ZhiqiangLin_SecureComm_2014_Chandra2014TowardsAS, ; Security_Lampson_Note_on_Confinement_Problem_1973_Lampson:1973:NCP:362375.362389, ). For example, one program’s usage pattern of CPU resources, if detected by another program, can be modulated for information transfer between the two (Security_Lampson_Note_on_Confinement_Problem_1973_Lampson:1973:NCP:362375.362389, ; Security_CovertChannel_Mobile_Survey_2012_Marforio:2012:ACC:2420950.2420958, ). Consequently, to mitigate data theft risks, enterprise users commonly have restricted access to outside networks — all data transfer from and to the outside is tightly scrutinized.
Nevertheless, such systems may still suffer from data exfiltration attacks that bypass the conventional communications protocols (e.g., WiFi) by transforming the affected computer into a transmitter and establishing a covert channel. For example, the transmitting computer can modulate the intensity of the generated acoustic noise by varying its cooling fan or hard disk spinning speed to carry 1/0 bit information (e.g., a high fan noise represents “1” and “0” otherwise), while a nearby receiver with a microphone can hear the noise and decode the carried bits (Security_AirGap_Acoustic_DiskFiltration_DiskNoise_ESORICS_2017, ; Security_AirGap_Fansmitter_Acoustic_arXiv_DBLP:journals/corr/GuriSDE16, ; Security_AirGap_Acoustic_Ultrasound_FPS_Canada_2014, ; Security_AirGap_Acoustic_Ultrasound_MeshNetworks_NotIsraeli_Journal_2013, ). Likewise, the power consumption (Security_AirGap_Mobile_USB_Charging_ACNS_Mobile_CovertChannel_Spolaor2017NoFC, ; Security_AirGap_Electric_PowerHammer, ), the amount of generated heat (Security_AirGap_Thermal_BitWhisper_CSF_2015_Guri:2015:BCS:2859845.2859982, ), the electromagnetic interference (EMI) (Security_AirGap_EMI_GSMem_Security_2015, ; Security_AirGap_EMI_AirHopper_TIST_Journal_2017_Guri:2017:BAG:3055535.2870641, ), the system status LEDs (Security_AirGap_Optimal_Keyboard_LED_Loughry:2002:ILO:545186.545189, ; Security_AirGap_Optical_HardDrive_LED_Guri2017LEDitGOL, ), and magnetic signal (to escape a Faraday cage) (Security_AirGap_Magnetic_Mobile_ASP_DAC_2016_Matyunin2016CovertCU, ; Security_AirGap_Magnetic_ODINI_FaradyCage_Bypass, ) can all be modulated in a similar manner for data exfiltration.
Our contribution. We contribute to the existing body of research by designing a new data exfiltration system, called (Noise for Data Exfiltration), where a malware modulates the victim computer’s power consumption to send data over a building’s power network to the attacker’s receiver. The key novelty is that uniquely exploits high-frequency voltage ripples (i.e., electronic switching noises) generated by power factor correction (PFC) circuits built into today’s power supply units for power-consuming devices like computers. Like the existing data exfiltration attacks (Table 3), exhibits several desirable properties: a reasonable achievable bit rate (28.48 bits/s), good effective distance (27.4 meters), and no line-of-sight requirement. Additionally, based on an in-depth investigation of how PFC-induced switching noises relate to a computer’s power consumption, adds the following two distinguishing features to the literature.
Indirect power measurement. uses indirect power measurement that does not require any tampering of the building’s power network and hence is more stealthy. Here, being indirect means that the target computer’s current does not directly flow through the attacker’s sensing device at the receiver; instead, the receiver only measures voltage signals containing PFC-induced switching noises which we find are correlated with the target computer’s power/current. Nonetheless, the existing power-based data exfiltration attacks rely on direct power measurement and hence are less stealthy (Security_AirGap_Mobile_USB_Charging_ACNS_Mobile_CovertChannel_Spolaor2017NoFC, ; Security_AirGap_Electric_PowerHammer, ; Genkin:2016:EKE:2976749.2978353, ): a power meter is directly connected to the outlet or a sensing apparatus is placed along the cable directly powering the target device.
Simultaneous data exfiltration. We identify the (approximate) orthogonality nature of PFC-induced switching noises in practice, thus allowing simultaneous data exfiltration from multiple computers to a single receiver without much interference. Thus, if multiple computers within the same power network are infected, only a single receiver is needed to exfiltrate data from these computers in parallel. This results in a higher overall exfiltration rate due to the multiple parallel data streams.
More concretely, we focus on an enterprise environment, with the goal of stealthy data exfiltration from a desktop computer. Note that, we do not target military-grade systems that have sophisticated and expensive defense against information leakages (e.g., TEMPEST (tempestGoodman2001, )). We first observe that the amplitude information of a computer’s electric current, and hence the power consumption, is contained in the voltage at any other power outlet connected to the same building’s power network.
In practice, however, it is very challenging to directly extract the current amplitude of the target computer from the voltage measurement, which consists of a blend of current amplitude information of all the devices within the same power network (Section 4.1). This is further compounded by the power grid’s random voltage fluctuations which can be several order-of-magnitude larger than the voltage variation caused by current amplitude variations.
We find that all desktop computers today are mandated to have built-in power PFC circuits in their power supply units to reduce harmonics (pfcHandbook, ; EnergyStar_Computer_Requirement_PFC_V7_2018, ; iecRegulation, ). Importantly, these PFC circuits result in prominent high-frequency current ripples between 40kHz and 150kHz (pfcHandbook, ), whose amplitude changes with the computer’s power consumption — the higher power consumption, the taller ripples, and vice-versa. These high-frequency current ripples also produce high-frequency voltage ripples at other power outlets, which are referred to switching noises. Thus, by properly filtering the received voltage signals at a power outlet, switching noises can be retained and the receiver is able to successfully extract information about the transmitter’s modulated current amplitude. Further, the switching noise frequencies are typically different for different computers and hence are not subject to much interference. This orthogonality of switching noises allows simultaneous data exfiltration attacks from multiple computers by a single receiver.
We present an end-to-end design of . Like any normal programs, only uses the transmitter’s CPU resource without any special privilege (e.g., Kernel access). Any device with data storage, such as a laptop and a cellphone, as well as an added analog-to-digital converter (ADC, to digitize the voltage signals) plugged into a power outlet can be used as a receiver. Moreover, does not require any offline training or calibration using supervised classification algorithms.
To demonstrate the practical applicability of , we run experiments on seven computers with different configurations and vendors in four different labs/offices in two separate buildings. We also achieve successful exfiltration even when four computers send data simultaneously to a single receiver. We show that achieves successful data exfiltration with an effective rate of up to 28.48 bits/second, which is reasonably high compared to many existing covert channels (Security_AirGap_Bridgeware_ACM_Communications_2018_Guri:2018:BAM:3200906.3177230, ; Security_AirGap_EMI_GSMem_Security_2015, ; Security_AirGap_Mobile_USB_Charging_ACNS_Mobile_CovertChannel_Spolaor2017NoFC, ). More importantly, the receiver can be located in a different room approximately 90 feet (27.4 meters) away from the transmitter. Finally, we also present a set of possible defense mechanisms, such as installing noise filters, and discuss their limitations.
2. Features of NoDE and Preliminaries
In this section, we first discuss ’s distinguishing features and advantages under its own subclass of power analysis-based side/covert channel attacks. Then, we provide a note on the current PFC design in power electronics.
2.1. Power Analysis-based Attacks
falls under the power analysis-based attacks, and we identify the key differences of from the existing works. With power usage information of the victim, prior studies have achieved secret key extraction from smart cards and mobile devices (mangard2008power, ; Genkin:2016:EKE:2976749.2978353, ; Camurati:2018:SCE:3243734.3243802, ), anomaly detection in embedded systems (clark2013wattsupdoc, ; Liu:2016:CET:2976749.2978299, ; park2018power, ), tracking websites (clark2013current, ; Security_AirGap_Mobile_Charging_WebsiteFingerprinting_Powe_Side_Channel_Yang2017OnIB, ), among others. Besides the orthogonal context and objective, our work stands apart from the prior studies in the following key aspects.
Power measurement. A prominent assumption made by many existing attacks is that the target system’s power consumption (or current) can be directly measured (clark2013current, ; Security_AirGap_Mobile_Charging_WebsiteFingerprinting_Powe_Side_Channel_Yang2017OnIB, ). Nonetheless, this can only be accomplished if the sensing apparatus is placed directly inside the target system or at the nearest power outlet (indicated by Fig. 1(a) and \raisebox{-.9pt} {A}⃝ in Fig. 1(b)). Moreover, the way that the transmitter’s current is measured (e.g., measuring current at \raisebox{-.9pt} {B}⃝ in Fig. 1(b)) (Security_AirGap_Electric_PowerHammer, ) results in a very low bit rate because of strong interference from other computers and/or devices.
By sharp contrast, can collect voltage signals from any outlet within the same power network as the transmitter, and identifies and focuses on a unique frequency band for each transmitter, thus achieving stealthy data exfiltration (even simultaneously from multiple transmitters).
Offline training. The studies on side channel attacks using power analysis are prolific, e.g., recognizing TV content out of voltage signal measurement from a nearby outlet (UWashington_TV_CCS_2011_Enev:2011:TVP:2046707.2046770, ) and identifying human gestures using body-induced electric signals (UWashington_PowerNoiseBodyAntenna_CHI_2011_Cohn:2011:YNM:1978942.1979058, ). Nonetheless, these studies typically apply supervised machine learning models and need to extract a set of features from the collected power signals and compare them against a set of pre-recorded patterns for recognition. Thus, offline model training on the target system under a controlled environment is required. Clearly, this is not feasible in our context for stealthy reasons.
Our design is fundamentally different and does not need to match received signals against pre-trained patterns, which can significantly differ from runtime conditions. Instead, to receive new information from the target computer on the fly, adapts its 1/0 bit decision threshold and filter’s passband based on a small pre-determined pilot sequence on a frame-by-frame basis.
Simultaneous transmission using orthogonal signals. In addition to the intrusive nature, direct power measurement requires dedicated power meters (i.e., receivers) for each target computer. Placing a power mater at a higher level in the power network (e.g., at \raisebox{-.9pt} {B}⃝ in Fig. 1(b)) to capture multiple transmitters does not work as the current signals from the transmitters as well as other equipment are superimposed in the readings and hard to distinguish. While also collects a mix of signals from all equipment, it can still separate each transmitted signal in the high frequency (10kHz150kHz) using the insight that PFC circuits generate orthogonal high-frequency switching noises (Fig. 12).
While some side channel attacks directly look at the current amplitude (clark2013current, ; Security_AirGap_Mobile_Charging_WebsiteFingerprinting_Powe_Side_Channel_Yang2017OnIB, ), the study (Enev:2011:TVP:2046707.2046770, ) considers a wide frequency band (e.g., 160kHz) of collected voltage signals. Thus, when other appliances or multiple victims are present, strong interference can be produced. For example, the attack is demonstrated on only one TV in a home or small lab with a relatively clean power network (Enev:2011:TVP:2046707.2046770, ). By contrast, for each transmitter, we precisely extract the frequency feature over a proper narrow band (e.g., 60Hz) without strong interference from other devices, thus achieving simultaneous data exfiltration from multiple transmitters in a large lab with about 30 active computers (Section 6.2.2).
also differs from (Shaolei_Colo_Voltage_CCS_2018, ) which utilizes a wider frequency band (i.e., 1kHz or more) and estimates a data center-wide aggregated power consumption over a much lower time resolution (i.e., once every minute) for load injection attacks. Whereas, is specifically designed to detect individual power consumption at a time resolution of milliseconds.
2.2. NoDE and TEMPEST
Electromagnetic emission has long been known as a major source of information leakage (highland1986random, ). Notably, the eavesdropping on electromagnetic radiation (EMR) of communication equipment in the early-mid 1900s leads to the development of, to date partially classified, defense technologies code-named TEMPEST (tempestGoodman2001, ). The recently declassified TEMPEST defense imposes stringent restrictions on electromagnetic radiation from computer systems both over the air and through power lines (tempestGoodman2001, ). However, TEMPEST defense, shielding equipment and/or Faraday caging, is very expensive and mainly used in military application. For example, NATO countries spend billions of dollar of their defense budget each year for TEMPEST shielding (Anderson99softtempest, ). While the defense requirement is outlined, the technology for TEMPEST attacks still remains classified. There is skepticism on the feasibility of TEMPEST attacks (tempestForbes2000, ; tempestGoodman2001, ), not to mention the sophisticated sensing equipment necessary to carry out such an attack. Consequently, typical enterprise environments (e.g., companies), which are our target systems, may not necessarily adhere to the costly TEMPEST defense practices.
A relatively inexpensive alternative to TEMPEST using software, named Soft-TEMPEST is proposed in (kuhn1998soft, ). Soft-TEMPEST targets obsolete CRT monitors and mainly reduces the electromagnetic emission distance, whereas utilizes power networks for data exfiltration at a distance.
2.3. Power Electronics
It is well known in the field of power electronics that the high-frequency switching operation in PFC circuits produces voltage noises and is fundamental for improving the power factor of appliances (pfcHandbook, ; PFC_frequency_analysis_VT_zhang2001evaluation, ). The existing research on PFC designs is primarily from the efficiency perspective, e.g., how to select the conduction mode and switching frequency to achieve the best energy efficiency of power supply units and meet regulation compliances (pfcHandbook, ). In sharp contrast, there is much less understanding from the adversarial perspective: how can the PFC-induced switching noises be exploited as useful signals for stealthy data exfiltration attacks? fills the gap by performing an in-depth study of how the switching noise amplitude relates to a computer’s power consumption and uniquely transforming switching noises of a computer’s power supply unit into data-carrying signals for data exfiltration.
3. Threat Model
We consider a broadly-interpreted enterprise environment (such as company and university) which is a primary target for data theft (Security_Data_Theft_Wiki, ; Security_Data_Theft_Enterprise_Survey_cheng2017enterprise, ). We focus on a desktop computer, because it is the predominant type of computer (especially for storing important data) and its built-in PFC circuit is suitable for information transfer (Section 4.3). For brevity, we also use “transmitter” or “computer” to denote the transmitting desktop computer.
Our threat model is illustrated in Fig. 2, including one or more transmitters and a receiver. Both the transmitters and receiver are connected to the same building’s power network. Note that, because typically there are filters between different buildings’ power networks, even dedicated PLC adapters cannot reliably communicate across different buildings (PowerLineCommunications_Survey_JSAC_2016_Cano:2016:SAP:2963140.2963846, ).
Transmitter. A transmitter is a desktop computer infected by malware that intends to send sensitive information (e.g., password and financial information) to the outside without using any network or removable storage. Like in the existing literature on covert channels, our threat model builds upon the malware’s capability of obtaining sensitive information, and is not intended for sending large files due to rate limits. The malware can use the transmitter’s CPU like any normal programs, but no special privileges are assumed by . Importantly, while it leverages the building’s power network, does not need to intrusively install a new or use an existing dedicated PLC adapter in the target transmitter.
Receiver. The receiver can be any innocuous-looking device that is plugged into an outlet in the same building’s power network as the transmitter. The receiver needs an ADC for digitizing its received voltage, which is universally used by any signal-collecting digital systems (e.g., digital temperature sensor) and can be easily hidden inside a laptop/cellphone charger. Moreover, the receiver can be located in a distant room different than the transmitter. Thus, there is no prohibitive requirement for a receiver. Even though the building is solely occupied by a single enterprise, guests are typically still allowed to plug their laptops or cellphones into an outlet for charging.
Practicality of malware injection. While there are various ways that malware can get into a computer, we classify them into two categories — easy and hard — based on the level of difficulty and effort required for malware infection.
Easy: We consider the malware injection “easy” when the target computer can take input from the outside through external media and/or networks. For example, the target computer can get infected with malware when it visits malicious webpages or is connected to an effected USB drive, during which malware can be implanted without being noticed. It is the predominant approach of malware injection for today’s enterprise environments (Security_Threat_Survey_SANS_2017, ). Not to mention those malware injection incidents affecting millions of Internet users every day (Security_Malware_ThreatReport_McAfee_March_2018, ; Security_Threat_Survey_SANS_2017, ), a striking example of infecting a mission-critical system is that the malware Stuxnet infected Iran’s nuclear program through an infected USB drive (langner2011stuxnet, ; stuxnetRealStoty, ).
Hard: We consider that the malware injection is “hard” when there is no easy approach to malware injection. For example, the target computer can be almost completely isolated from all external networks, which is also known as “air-gaping” (Security_AirGap_Bridgeware_ACM_Communications_2018_Guri:2018:BAM:3200906.3177230, ). In such a scenario, malware can still be injected by exploiting hardware/software backdoors throughout the supply chain. For example, it has been recently reported that some microchips were added to servers’ motherboards during the manufacturing process without the knowledge of a major server vendor (superMicroImplant_bllomberg, ). In other instances, ShadowPad was implanted into a software program developed by a third-party vendor, affecting hundreds of large businesses (Security_Backdoor_Discovery_Kaspersky_2017, ), while malicious batteries (Security_AirGap_Mobile_Malicious_Battery_Technion_UTAustin_2018, ) and other hardware Trojans (Security_HardwareTrogan_Survey_2010_Tehranipoor:2010:SHT:1724965.1725002, ) are all known threats to data security. An even more striking example is that over 100,000 computers that had never been connected to any network were also implanted with information-stealing hardware Trojans by using a classified technology (Security_AirGap_NSA_100000_Implant_Hardware_NYTimes_2014, ).
A complete data exfiltration attack involves two major steps. The first step is to inject a malware program into the target computer and collect sensitive information. The second step is to establish a covert communication channel to send sensitive data to the receiver. Like the existing covert channel literature (Security_AirGap_Acoustic_MOSQUITO_ArXiv_2018, ; Security_AirGap_Bridgeware_ACM_Communications_2018_Guri:2018:BAM:3200906.3177230, ; Security_AirGap_Electric_PowerHammer, ; Security_AirGap_Mobile_Malicious_Battery_Technion_UTAustin_2018, ), our work focuses on the step of establishing a covert communication channel. Thus, we can embed into an existing information-collecting malware. Concretely, we describe the procedure of integrating with malware created by the recently released malware toolkit L0rdix (malwareToolL0rix_1, ; malwareToolL0rix_2, ) as follows. The L0rdix toolkit comes with a variety of pre-built and configurable functionalities. It can steal information from the victim system by collecting login information, browser cookies, and files matching pre-configured extensions. It can also monitor clipboard content to steal data matching predefined strings. L0rdix toolkit offers botnet capabilities such as opening a specific URL, execute commands, kill processes, upload and download files and run executable files. L0rdix also comes with USB infection, mining, detection prevention, anti-analysis, and anti-VM capabilities as well. In our context, we leverage the malware’s existing capabilities of system infiltration and information collection, and utilize its botnet functionality with our covert channel communication. We can either attach our code with L0rdix malware or configure L0rdix to download our program as malicious code. Other malware generators such as Senna Spy FTP, which spread as a Trojan bundled with free software, can also be used to secretly download the code of into an infected system (toolSennaSpy, ; toolSennaSpy2, ).
4. Power Network as a Covert Channel
In this section, we present our covert channel residing in a building’s power network.
4.1. Overview of a Building’s Power Network
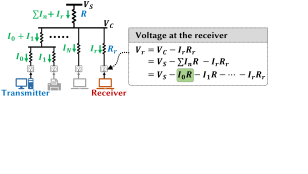
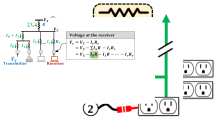
The utility power typically enters a building through a single point. Then, through a distribution box, power is split to different floors/rooms in parallel and finally to different power strips/outlets. For large buildings, a multi-level distribution hierarchy may be used. Further, the utility may provide three-phase power to buildings, and the three phases can be divided depending on functions (e.g., offices on one phase, and the central air conditioner on another) or physical topologies. For illustration, Fig. 3 provides a simplified example of a single-phase power network of a building, highlighting the parallel connection of different power outlets. The common source voltage enters a distribution/panel box and reduces to due to a voltage drop caused by the line resistance. Then, the voltage is supplied to different rooms/outlets. We can write the receiver’s voltage signal as
| (1) |
where is the resistance of the common line from which all currents flow, and is the resistance of the line directly supplying power to the receiver. Clearly, the receiver’s voltage signal contains the transmitter’s current denoted by in Fig. 3, whose amplitude can be modulated by varying the CPU load to carry information (Section 5.1). Thus, if the receiver is able to extract out of its signal , it can exfiltrate information from a computer through the power network.
4.2. Computer’s Power Supply Unit
We now look at the anatomy of a computer’s power supply unit and identify an important component — PFC circuit — which generates high-frequency current ripples that can be detected by the receiver.
4.2.1. A closer look at computer’s power supply unit
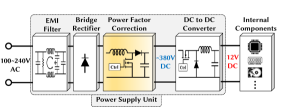
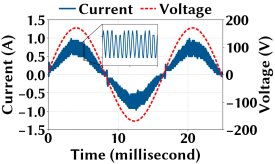
As shown in Fig. 4, a power supply unit based on the standard SMPS design draws 100240V AC voltage from an outlet and then, after multiple stages, provides regulated 12V DC voltage to internal components such as CPU. Specifically, at the front end, there is an EMI filter to limit frequency components of greater than 150kHz both coming from and conducted back to the power network, in compliance with international regulations (PFC_EMI_Understanding_TI, ; PFC_Federal_EMI_ElectronicCode_Website, ). Then, a rectifier converts the incoming AC voltage to a pulsating DC voltage (unipolar half-sine waves), followed by a PFC circuit which improves the power factor by regulating the input current waveform and making it resemble the entering voltage’s sine wave. Fig. 5(a) shows a snapshot of the current waveform drawn by our Dell computer with PFC. The PFC elevates the voltage to around 380V, which is stepped down and becomes 12V DC voltage for internal components.
Harmonic distortion is undesirable since it reduces the power factor and causes unwanted power losses in the power system (pfcHandbook, ). Low-power devices with SMPS (switch mode power supply) are allowed to have a low power factor without PFC (see Fig. 22 in Appendix C.3 for the current waveform). Nonetheless, regardless of the actual power consumption, all devices with a power rating of 75W (applicable for desktop computers) must have PFC circuits for mitigating harmonics as mandated by international regulations (EnergyStar_Computer_Requirement_PFC_V7_2018, ; iecRegulation, ; pfcHandbook, ). Thus, a crucial point we highlight is that the PFC requirement for mitigating harmonics universally applies to all of today’s desktop computers.
4.2.2. Frequency spikes generated by PFC
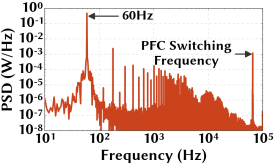
As shown in Fig. 5(a), while improving power factor, the PFC circuit also produces high-frequency current ripples due to its working principle (pfcHandbook, ). Specifically, the core of a PFC circuit is rapidly switching the incoming current between two modes — a rising mode where the current increases, and a falling mode where the current decreases. Through switching, the current drawn from the power outlet resembles a sine waveform following the voltage signal. The switching frequency is determined by a controller as well as the PFC components (e.g., inductor), and typically falls into the range of 40kHz, 150kHz, which is not subject to EMI regulations that set limits on frequencies greater than 150kHz (pfcHandbook, ; PFC_Federal_EMI_ElectronicCode_Website, ).
There are three basic modes for PFC switching (a.k.a., conduction mode) as summarized in Table 4 in Appendix C.1. In practice, vendors may adopt proprietary designs using variants of the basic modes (pfcHandbook, ). Naturally, the PFC’s switching operation results in high-frequency current ripples, thus generating a PSD (power spectrum density) spike around the switching frequency. Illustrative current waveforms and frequency analysis results are shown in Table 4. Note that when PFC is not used, there exist no such PSD spikes within 40kHz, 150kHz (see Fig. 22(b)).
Desktop computers’ power supply units almost all have a rated capacity of over 300W to accommodate extensibility. Thus, the continuous conduction mode (CCM) is most widely-used due to its low peak current. We show the current and its frequency analysis for our Dell computer in Fig. 5. It can be observed that with PFC, the harmonics are an order of magnitude smaller than the 60Hz component. Furthermore, the current waveform and frequency analysis match with those illustrative figures for CCM in Table 4 in Appendix C.1, clearly showing a prominent high-frequency PSD spike generated by the PFC circuit.
4.3. Extracting Transmitter’s Current based on PFC Switching Frequency
The receiver’s voltage signal in Eqn. (1) contains all the frequency components of the common source voltage and currents of all connected devices. That is, the high-frequency current ripples generated by PFC circuits affect voltage signals at any power outlet within the same power network, which are referred to as switching noise (pfcHandbook, ). Consequently, if we filter out all but the transmitter’s high-frequency switching noises from the receiver’s voltage , we are left with the transmitter’s switching noise around its PFC frequency and the switching noise amplitude is also highly correlated with the transmitter’s current . This is achieved based on the (approximate) orthogonality of PFC’s switching noises.
Different computers typically have non-overlapping PFC switching frequencies. In fact, our experiment shows that even for computers with the same configuration and manufactured by the same vendor, different computers still have (slightly) different PFC switching frequencies due to manufacturing process variations and can simultaneously transmit data without much interference. Furthermore, the prominent PSD spikes between 40kHz and 150kHz do not interfere significantly with harmonics (predominantly less than 20kHz) generated by other devices. Therefore, in practice, the ripples in the receiver’s voltage signal caused by the target transmitter’s switching noise do not suffer from significant interferences from other sources.
We empirically validate the feasibility of extracting the transmitter’s current amplitude information. Our experiment is conducted in a lab with 30+ computers, where the transmitter and receiver are plugged into two outlets located about 55 feet away from each other. The details of the setup are presented in Section 6.1. We vary the transmitting computer’s current by varying its CPU load because compared to components such as hard disk and memory chips, a computer’s CPU has a high dynamic power that can be easily adjusted by loading/unloading the CPU. Moreover, CPU is ubiquitously available in all computers and needed by any running program. As GPUs are power-consuming, a computer’s current can also be significantly varied in a similar fashion by using increasing the utilization of a dedicated GPU. Note, however, that a GPU is less ubiquitous compared to a CPU, especially in ordinary office environments. Thus, throughout our study, we will only utilize CPU to change a computer’s current for data exfiltration.
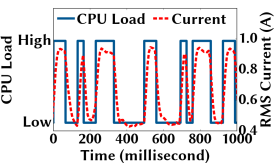
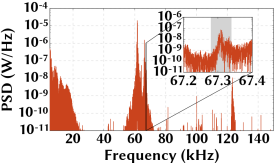
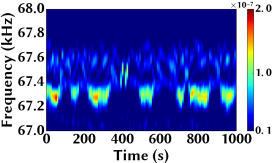
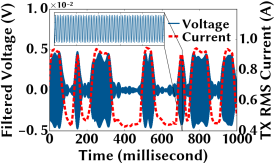
We show in Fig. 6(a) the transmitter’s CPU load and current amplitude, which match with each other quite well. Then, we perform a frequency analysis of the received voltage signal and show the result in Fig. 6(b). We see large frequency components between 40kHz and 80kHz (and sporadic higher-frequency spikes). These are mainly due to different computers’ PFC switching operations, and the components around 67.3kHz are caused by our transmitter. The temporal variation of the PSD spikes created by the transmitter is shown in the frequency spectrum in Fig. 6(c) where we can easily identify the transmitter’s high current periods. Next, we filter the collected voltage signal with a passband of 67.28kHz, 67.34kHz and show the filtered voltage signal in Fig. 6(d) where the filtered voltage signal resembles the current ripples (as shown in the zoom-in window). The filtered voltage amplitude is close to zero during the low current periods because the PSD spikes shifts away from the 60Hz passband.
In summary, we have demonstrated that, with a proper band-pass filter, the amplitude of the receiver’s filtered voltage signal can recover the transmitter’s modulated current amplitude and hence be exploited for demodulation.
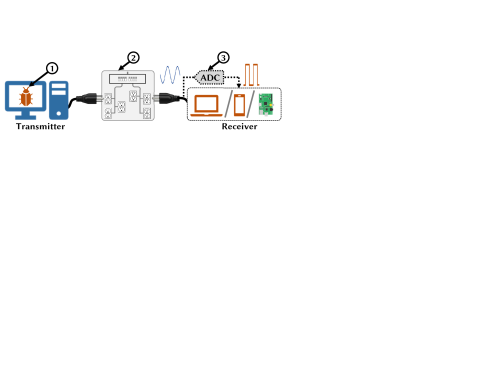
5. The Design of NoDE
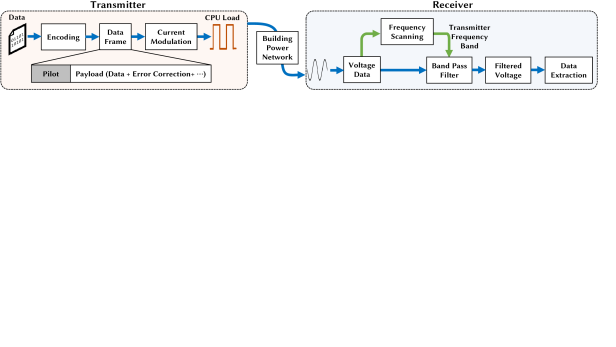
In this section, we present the design of . As shown in Fig. 8, includes both a transmitter (i.e., a desktop computer with implanted malware) and a receiver (i.e., any voltage-collecting device plugged into a power outlet).
5.1. Transmitter Design
Like in the prior literature on covert channels (Security_AirGap_Bridgeware_ACM_Communications_2018_Guri:2018:BAM:3200906.3177230, ; Security_AirGap_Mobile_USB_Charging_ACNS_Mobile_CovertChannel_Spolaor2017NoFC, ; Security_AirGap_EMI_GSMem_Security_2015, ), focuses on the physical process of data exfiltration — converting 1/0 bits into current amplitudes and decoding it from a remote outlet. That is, the implanted malware already collects needed information (Section 3) and encodes it into 1/0 bit streams that are ready for data framing and modulation. Next, we address the key design issues.
5.1.1. Choosing symbol rate
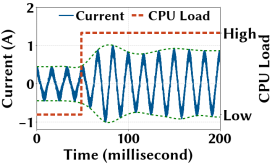
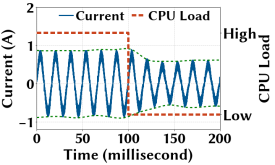
modulates the transmitter’s current amplitude by varying the CPU load based on 1/0 bit values. Thus, the achievable symbol rate crucially depends on how fast the current amplitude changes in response to the CPU load. While the CPU usage can be adjusted within a millisecond or even faster (UMich_Wenisch_PeakPowerModel_Server_SMPS_ISLPED_2010_Meisner:2010:PPM:1840845.1840911, ), the current drawn by a computer may not instantly follow (i.e., lags) the CPU usage. In our experiment with a Dell PowerEdge computer in Fig. 7(a) shows that the current takes about 2030 milliseconds to reach the peak after jump in the CPU load at around 50 milliseconds. In addition, because of the feedback control adopted by a power supply unit, a sudden CPU load change can create a current inrush followed by a current dip. As shown in Fig. 7(b) , the current also lags by around 30 milliseconds when the CPU load sharply changes from high to low.
Based on our experiment results, we choose 33ms as the default symbol duration. This means that, by modulating the transmitter’s current amplitude, the achievable symbol rate in is 30 symbols per second.
5.1.2. Choosing modulation mode
For a fixed symbol rate, a higher bit rate can be achieved if each symbol carries more bits. Here, we run experiments to see how many bits can be successfully mapped into each symbol: discrete current/power levels are needed for bits per symbol. For , we vary CPU loads at four levels (0%, 25%, 75% and 100%, representing “00”, “01”, “10” and “11”, respectively) and see how input current changes, given three different symbol lengths — 33ms, 66ms, and 100ms.
We show the results in Fig. 9 and see that when each symbol lasts 33ms, there is a mismatch between the CPU load (representing 2 digital bits) and the resulting current amplitude, thus clearly leading to a very high symbol error rate. As explained in Section 5.1.1, this mismatch is mainly due to the complex feedback control mechanisms and large capacitors inside a computer’s power supply unit. If the symbol length increases to 66ms, there is still insufficient time for the current amplitude to yield a steady response. The current amplitude correlates well with the CPU load when the symbol length increases to 100ms, but this means that the effective bit rate is only 20 bits/second, which is even lower than 30 bits/second achieved by a binary modulation with a symbol length of 33ms. With bits per symbol, there is an even poorer correlation between the CPU load and input current, unless the symbol length is sufficiently large.
As a result, we choose binary modulation and use high and low currents to represent “1” and “0”, respectively. Concretely, we build upon the existing literature (Security_AirGap_Fansmitter_Acoustic_arXiv_DBLP:journals/corr/GuriSDE16, ; Security_AirGap_Mobile_USB_Charging_ACNS_Mobile_CovertChannel_Spolaor2017NoFC, ) and design a simple current modulator as described in Algorithm 3 in Appendix D. The current modulator program takes 1/0 bit information as the input and runs some dummy calculations (e.g., generating random numbers) to load the CPU and change the computer’s input current.
5.1.3. Choosing the frame length
Like in many communications systems (Goldsmith_WirelessCommunications_2005, ), groups 1/0 bit sequences into frames, each beginning with a pilot sequence (Section 5.1.4). As shown in Fig. 8, following the pilot symbols is the actual payload that contains uncoded bits or coded bits using error correction techniques.
In our context, the transmitter’s PFC switching frequency is unknown to the receiver and may vary over time, albeit slowly. Throughout each frame, however, the transmitter’s PFC switching frequency should remain relatively constant. As shown in the cumulative density function (CDF) and the frequency spectrum in Fig. 21, the PFC switching frequency does not vary by more than 50Hz within 5 seconds. On the other hand, for a good bit detection, the receiver’s frequency band for filtering voltage signals can be only 60Hz. Thus, we conservatively choose a frame length of 100 symbols, resulting in frame duration of 3.3 seconds.
5.1.4. Choosing pilot symbols
In wireless communications, pilot symbols are symbols mutually known to both the transmitter and receiver and inserted at the beginning of each frame, allowing the receiver to estimate the channel state and synchronize data reception (Goldsmith_WirelessCommunications_2005, ). In our context, pilot symbols are needed by the receiver to identify the transmitter’s signals and the start of a data frame (details in Section 5.2). Nonetheless, the length of a pilot sequence needs to be properly chosen. A too short sequence may not be enough for the attacker to accurately acquire the transmitter’s PFC switching frequency, whereas a too long sequence takes up an unnecessarily high overhead. In our experiments in Section 6.2.3, we find that a 6-bit pilot sequence (“110010” in our study) strikes a good balance, while we also examine 4-bit and 8-bit pilot sequences (Table 1). Note that, for some scenarios (e.g., when there are multiple transmitting computers), a longer pilot sequence may be needed to uniquely identify each transmitting computer and better locate the corresponding frequency band. However, in general, there is no need to change the pilot sequence for different buildings or power suppliers.
To summarize, considering the hardware constraints and behavior of the PFC switching frequency, we choose in our default design a symbol period of 33 milliseconds, 1 bit per symbol, 100 bits in each data frame with a frame duration of 3.3 seconds, and a 6-bit pilot sequence “110010”.
5.2. Receiver Design
On the receiver side, calculates the average amplitude of filtered voltage signals for every bit length and compares it against a detection threshold for deciding a 1/0 bit value. There are three major steps: (1) finding a passband for the filter; (2) identifying the start of a data frame; and (3) demodulating the extracted signals into 1/0 data bits.
5.2.1. Finding the filter’s passband
In practice, the transmitter’s PFC switching frequency is unknown to the receiver. Based on a predetermined pilot sequence, we propose a scanning process to find a frequency passband for filtering received voltage signals and retaining the prominent PSD spikes generated by the transmitter. The scanning process is described in Algorithm 1, where two nested loops scan through the frequency bands from 20 kHz to 150 kHz with a moving window of variable size. The notion of means a band-pass filter with and being the lower and upper cutoff frequencies, respectively. When appears as a subscript, it means that a signal passes through a band-pass filter .
In each inner loop, the amplitude/envelop of filtered voltage signal is extracted and then evenly sliced into bit-length pieces. Then, the average amplitude for each piece is used for deciding binary bit values. Specifically, we set the the mean of bit-wise average amplitudes of the filtered signal as the binary bit decision threshold: a bit-wise average amplitude higher than the threshold is decoded as “1”, and “0” otherwise. Then, by comparing the extracted bits with the pilot sequence, we return the passband that yields no errors for pilot detection.
As the PFC switching frequency does not vary significantly over time, we only need to scan through a wide frequency range (e.g., from 20kHz to 150kHz) once. After the initial scan, the receiver only needs to quickly fine tune its filter’s passband over a much narrower range (e.g., 500Hz around the previously-found passband, instead of 20kHz to 150kHz) to compensate for runtime switching frequency offsets. Moreover, provided that voltage signals are acquired and stored, bit extraction can be done offline, and hence the scanning complexity is not an issue. In fact, with kHz, Algorithm 1 only takes less than 5 minutes in Matlab on a laptop.
5.2.2. Identifying the start of a frame
While the filter’s passband does not vary significantly due to the slow variation of PFC switching frequencies, the bit detection threshold depends on the non-controllable environment (e.g., other computers with similar PFC switching frequencies can cause interferences) and hence can change quickly at runtime. We propose a time-domain scanning process to identify the bit detection threshold and start of each data frame based on the predetermined pilot sequence. The scanning process is presented in Algorithm 2.
5.2.3. Extracting data bits
After identifying a pilot sequence, the receiver can extract actual payload bits using the bit detection threshold returned by Algorithm 2: if a bit-wise average amplitude of the filtered signal is higher than the threshold, then the corresponding payload bit is decided as “1”, and “0” otherwise.
6. Evaluation
This section presents experiment results to validate the practical feasibility of , highlighting that achieves an effective rate of up to 28.48 bits/second to a receiver located in another room about 90 feet ( meters) away.
6.1. Methodology
Experiment setup. As listed in Table 2, we test seven computers with different operating systems/configurations, including four recently purchased from two top vendors (Dell and Acer) which collectively account for more than 25% of the global PC market share (Market_PC_IDC_Q2_2018, ), an iMac (27 inch), and two custom-built computers with top-brand power supply units (Corsair and EVGA). They all have CCM type PFC in their power supply units. Our collection of desktops is representative of commonly used models in our target case of modern enterprise office setup.
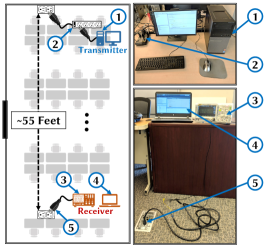
These computers are located in four different labs/offices in two different buildings (referred to as A and B, respectively). As our default location, Lab #1 in Building A is a large shared lab space housing about 30 students with 30+ active desktop computers, where the transmitter’s and receiver’s power outlets are approximately 55 feet away from each other. Thus, Lab #1 represents an environment with high power line noises. The layout of Lab #1 is illustrated in Fig. 10. In addition, we also run experiments in another two labs (#2 with about 10 students and #3 with about 15 students) in Building A. Our experiment setup in Building B is illustrated in Fig. 14, where the transmitter and receiver are located in two different rooms about 90 feet away from each other.
Transmitted data. Like other studies on covert channels (Security_AirGap_Bridgeware_ACM_Communications_2018_Guri:2018:BAM:3200906.3177230, ; Security_AirGap_Mobile_USB_Charging_ACNS_Mobile_CovertChannel_Spolaor2017NoFC, ; Security_AirGap_EMI_GSMem_Security_2015, ), focuses on stealthy exfiltration of already collected information. Thus, for illustration, we use 8-bit ASCII values of the string “password123” followed by six random bits as the payload data and “110010” as the 6-bit pilot sequence. Each frame has 100 bits. We also randomly generate 50 data frames for each experiment. Each symbol carries one bit and lasts 33ms. Like the existing covert channel literature, error correction coding is orthogonal and omitted in our experiments.
Current amplitude modulation. To modulate the current amplitude (Section 5.1.2), we implement a current modulator following Algorithm 3 which can be incorporated into existing malware for data exfiltration. The program is written in Java and uses multiple nested and computations on a random floating number to vary the CPU load. We use multi-threading to increase the impact on the CPU. However, as the default case, we do not use any CPU pinning and allow regular OS scheduling.
Voltage measurement. To collect voltage signals, we use a Rigol 1074z oscilloscope as a proxy ADC circuit. To remove the voltage’s dominant 60Hz component and improve the signal acquisition precision, we follow (Enev:2011:TVP:2046707.2046770, ) and insert a RC high-pass filter with 10kHz cutoff frequency between the power outlet and the oscilloscope. We use 500 kilo-samples per seconds (kSa/s) as the default sampling rate. While we use a bulky oscilloscope for convenience, the receiver only needs to hide a small ADC circuit (e.g., using ATmega Microcontroller) to acquire and digitize the voltage signal (Section 3).
Frequency analysis and filters. We use Matlab to perform Fourier analysis and signal filtering. In real-world implementation, the receiver may also use a digital signal processing chip to filter voltage signals and demodulate bit values in real time.
Metrics. We calculate the bit error rate (i.e., percentage of bit errors) and effective transmission rate measured in bits/second (i.e., actual payload bit rate, excluding pilot symbols and erroneous bits). We also list in Table 2 the distance between the transmitter’s and receivers’ power outlets.
6.2. Evaluation Results
We now present our evaluation results, highlighting that achieves stealthy data exfiltration from desktop computers. We first present a snapshot of data exfiltration using followed by the case where four transmitters are simultaneously sending data to a single receiver. We then evaluate under different background applications, different numbers of CPU cores used by , and different pilot lengths. We also test how the CPU states affect , and the effectiveness of in data exfiltration without a line of sight. Finally, we present results with computers from different manufacturers.
6.2.1. A snapshot of data exfiltration
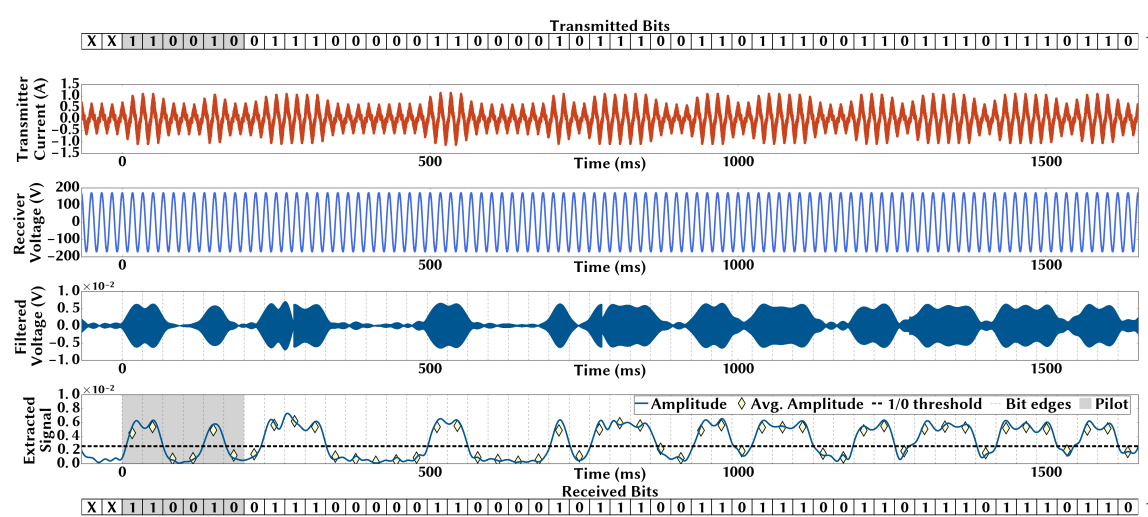
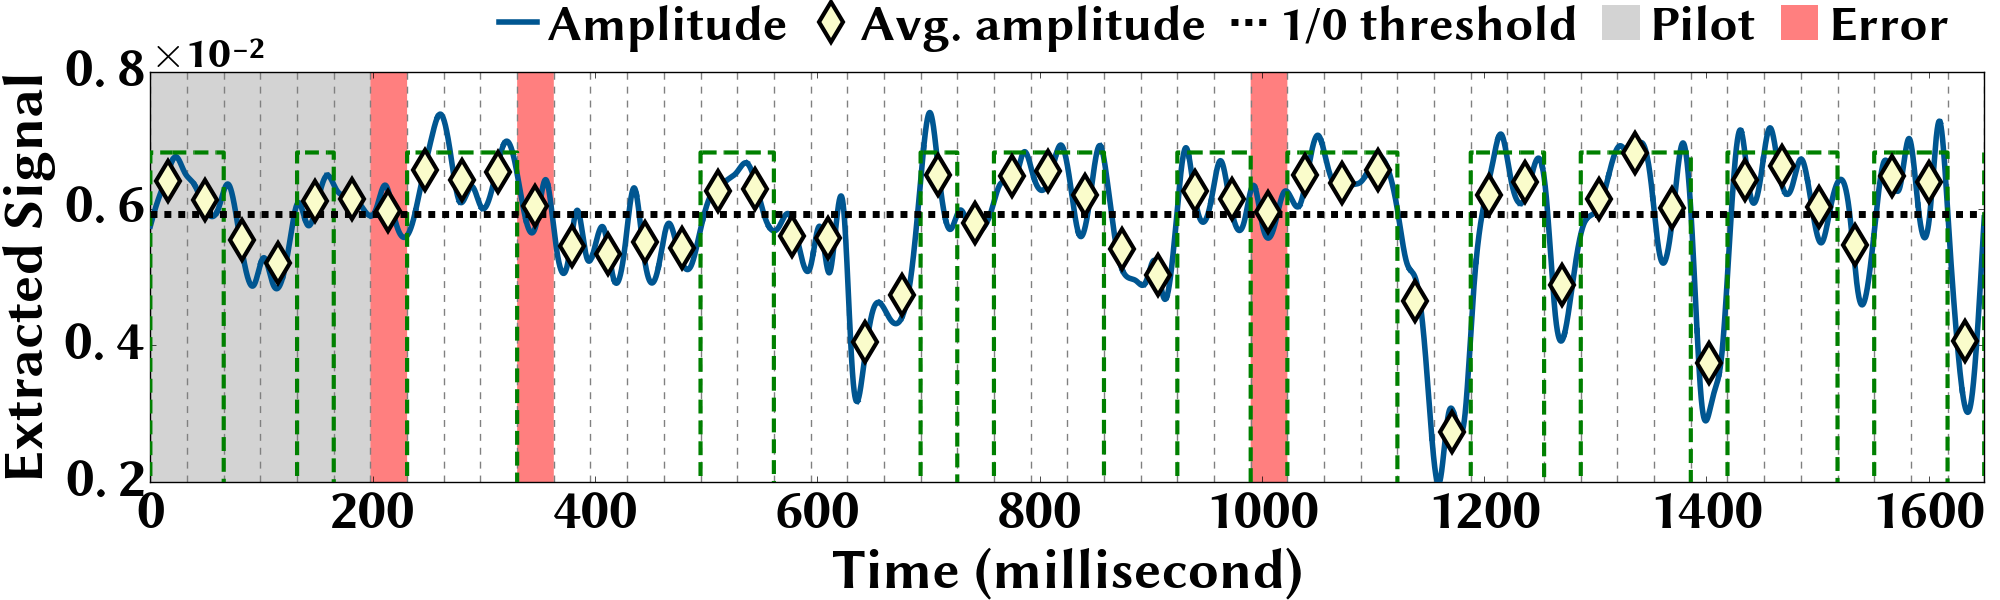
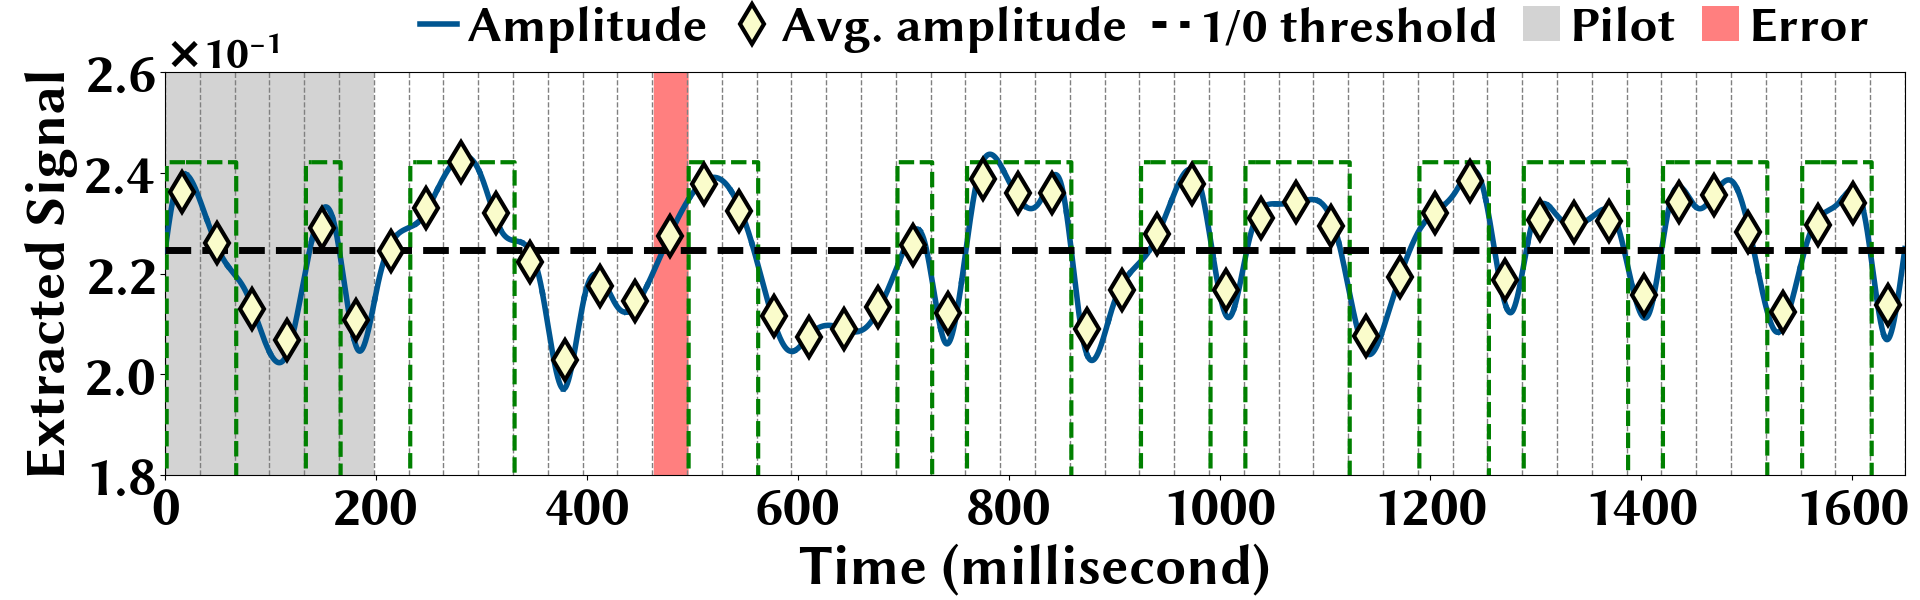
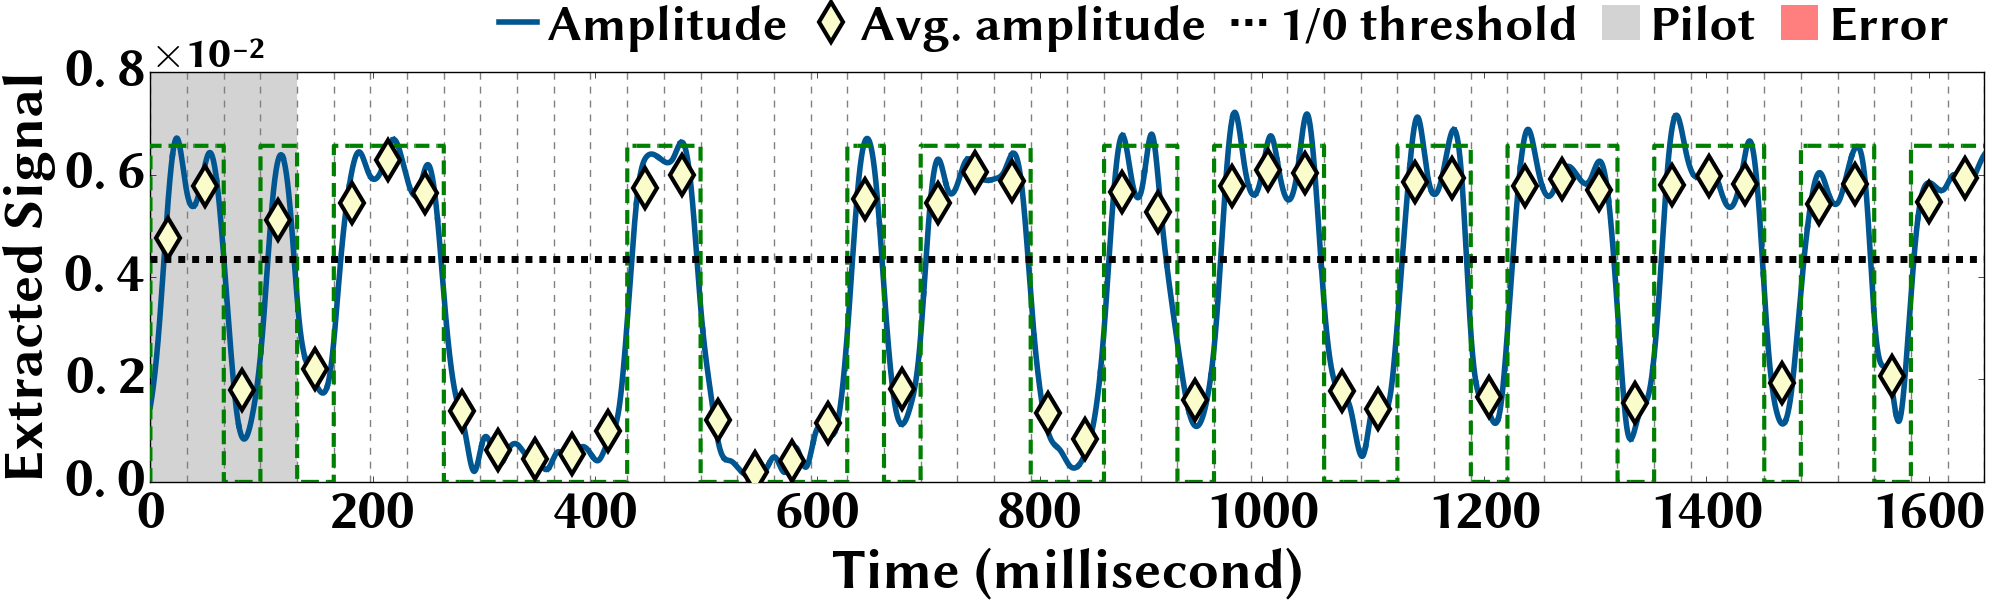
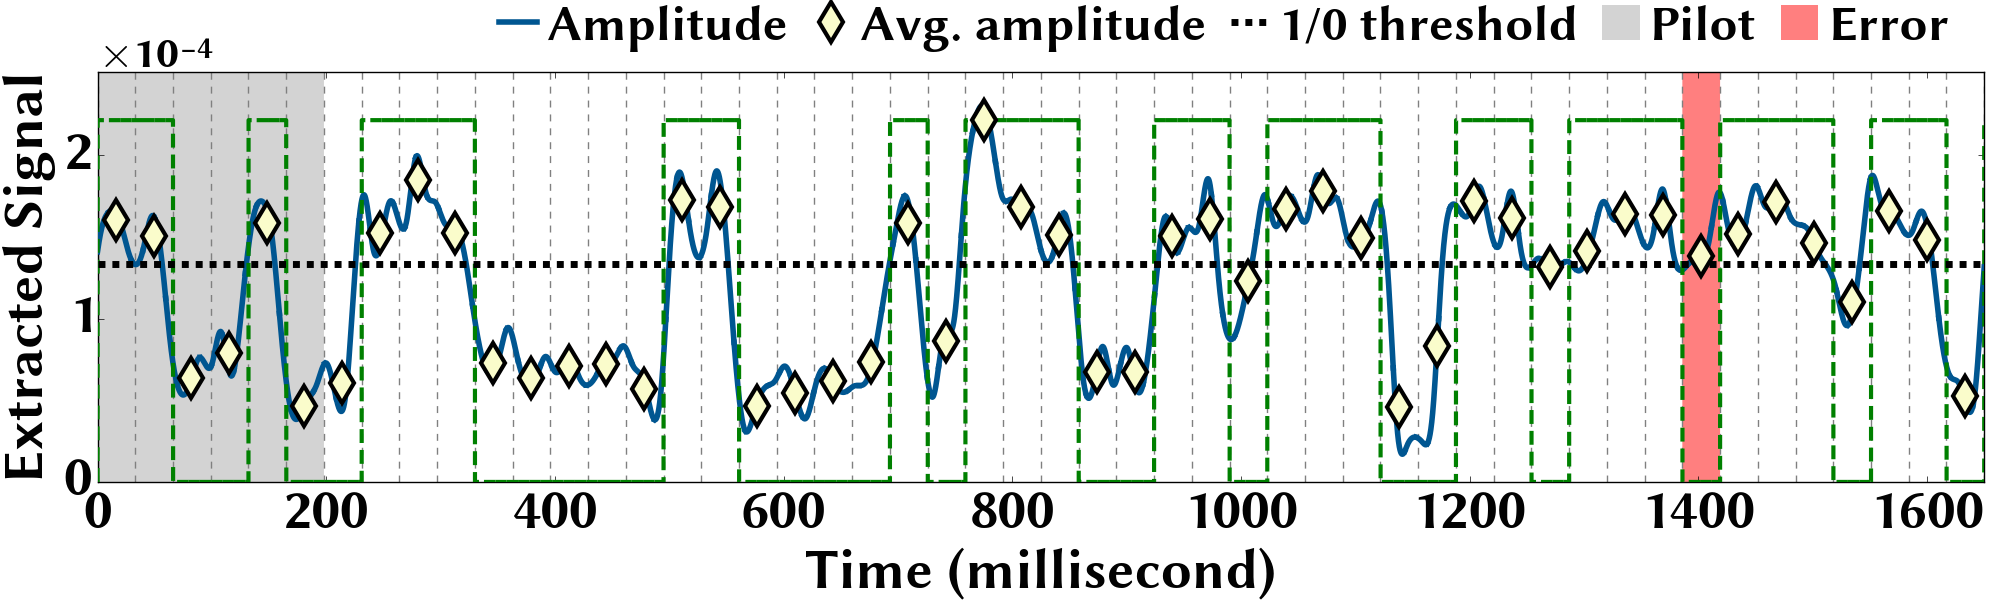
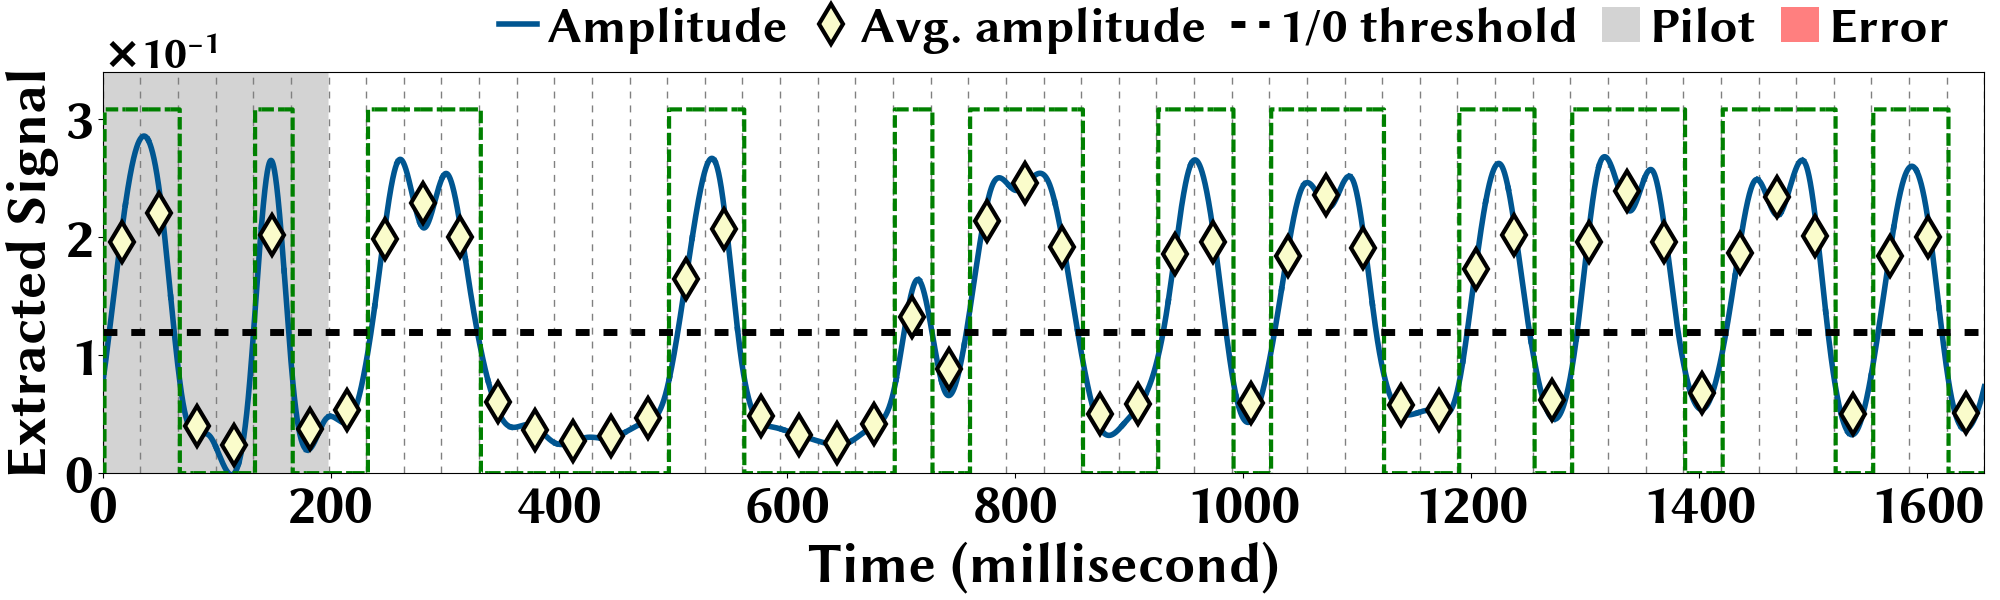
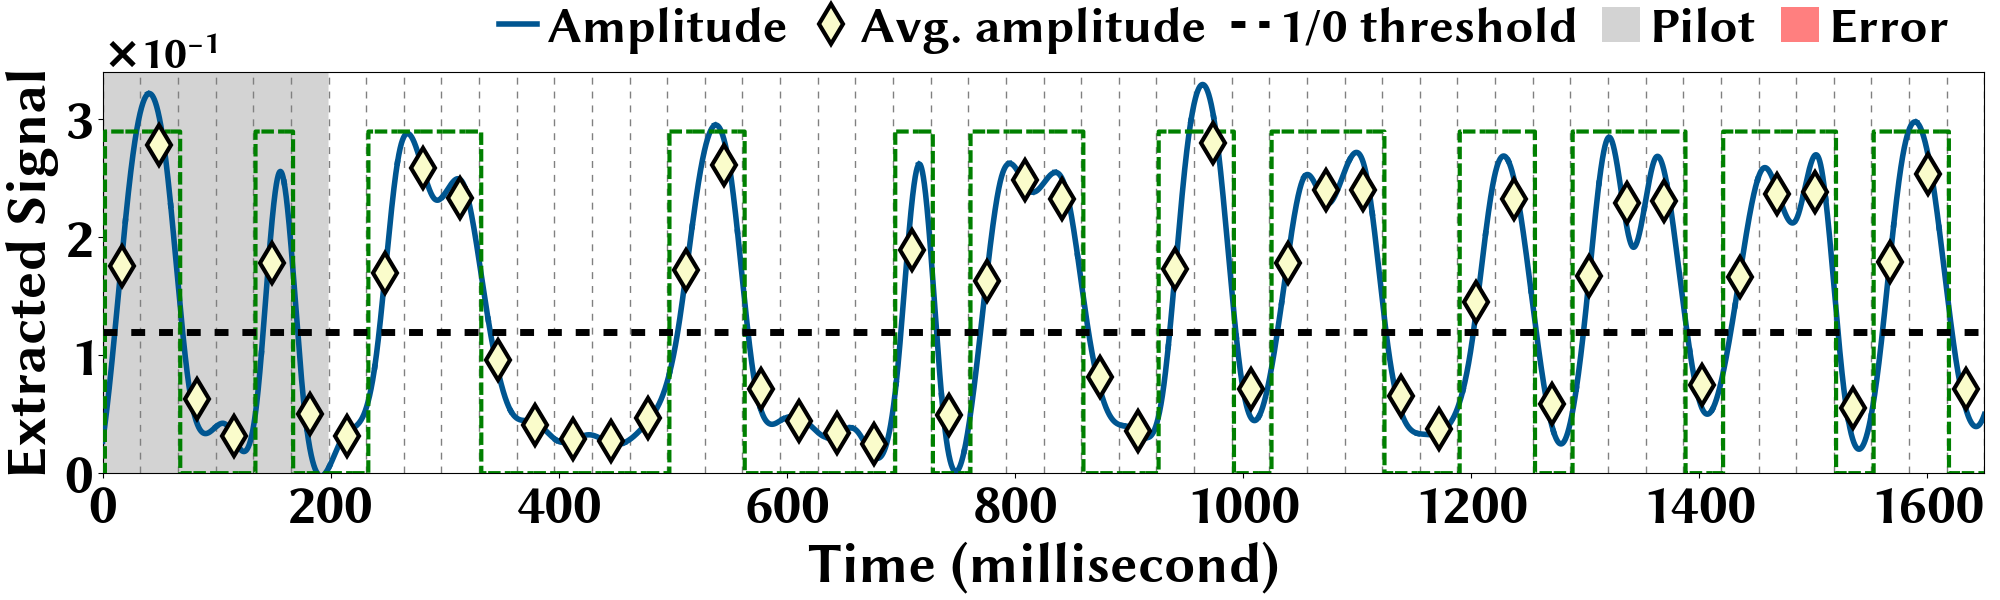
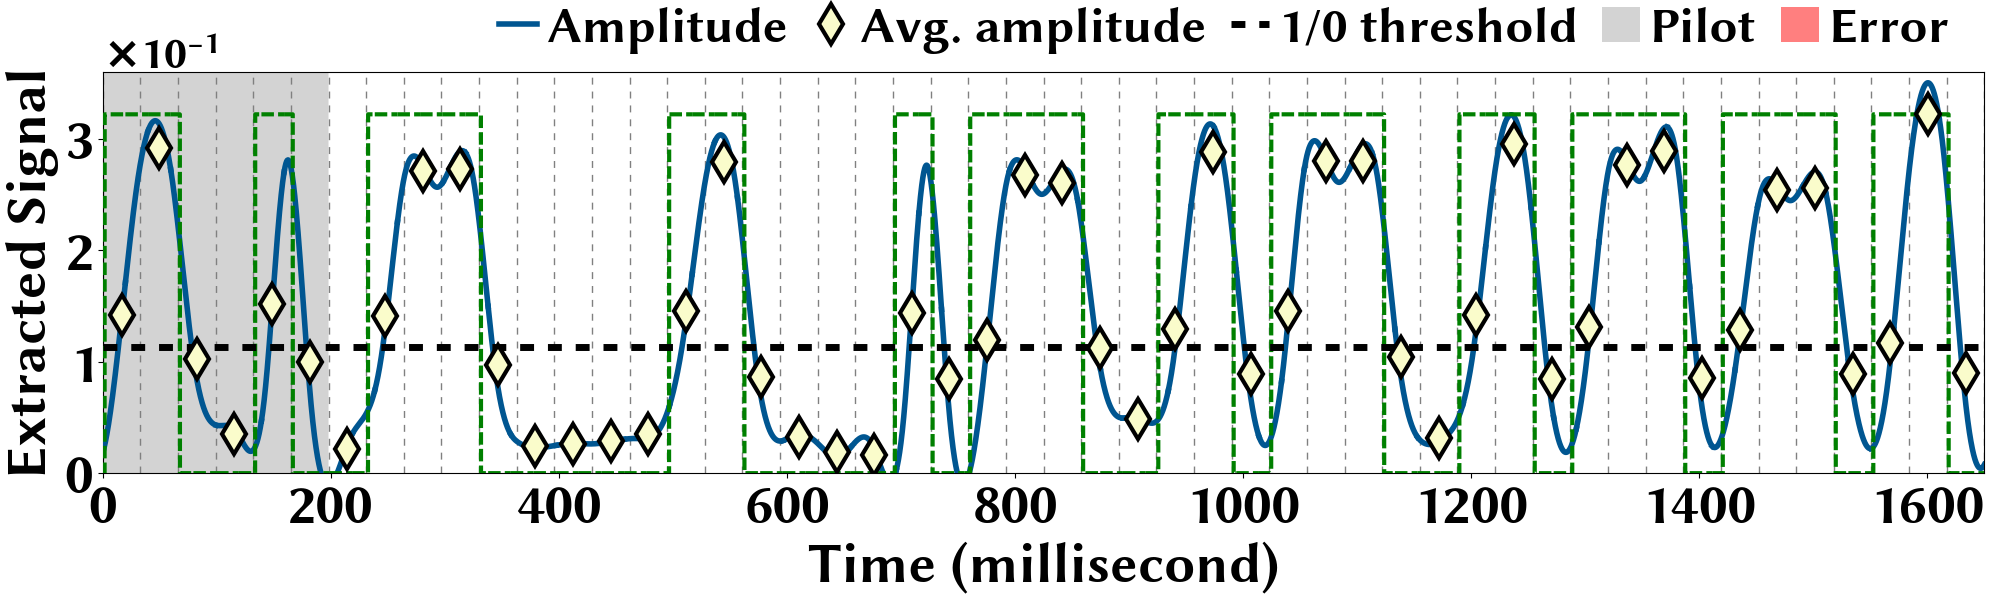
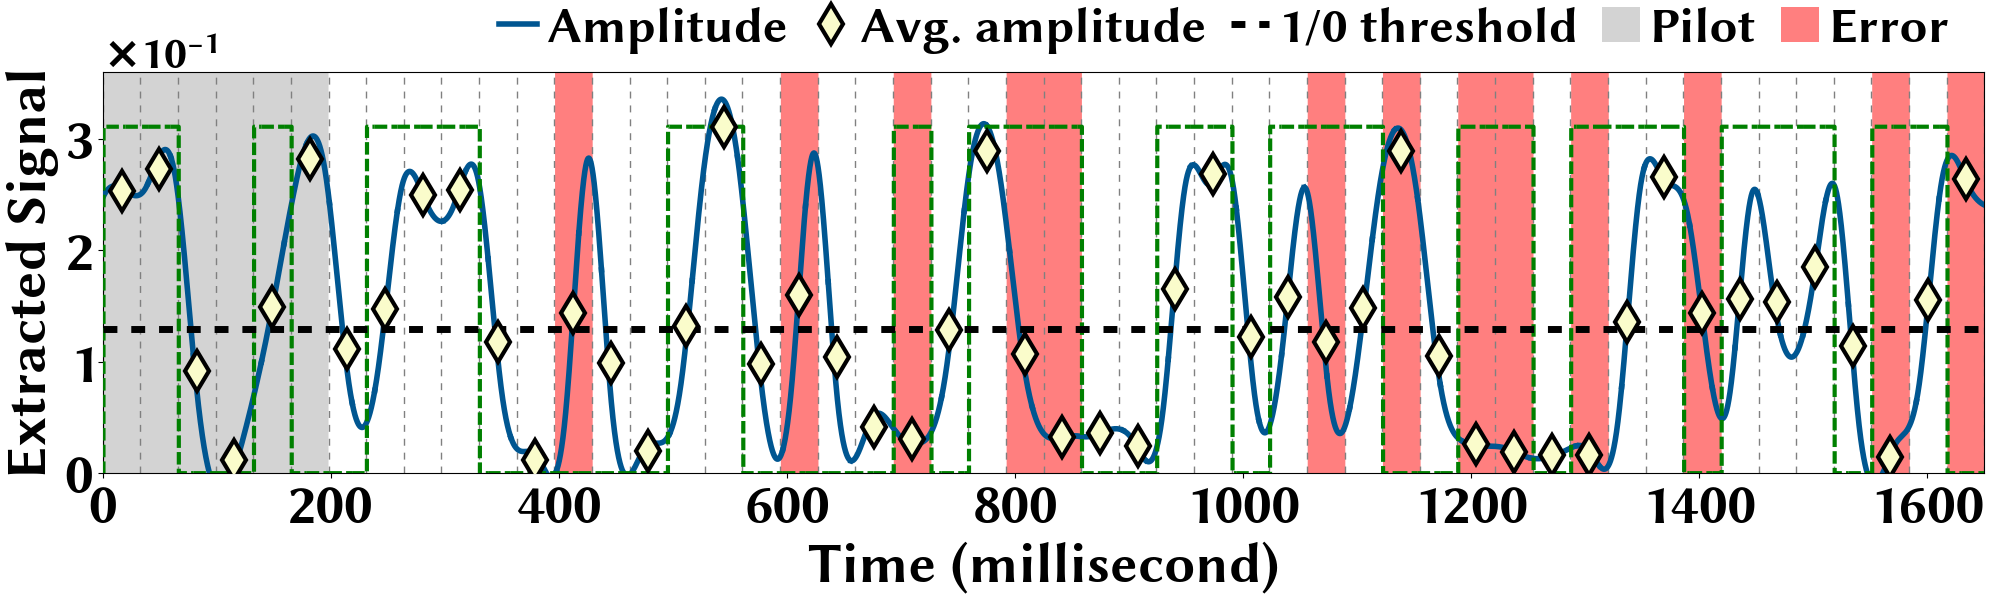
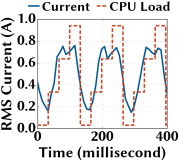
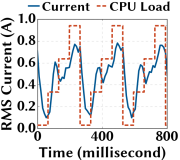
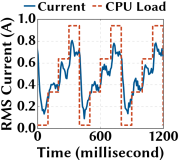
We show in Fig. 11 the different stages of for data exfiltration from our Dell Optiplex computer with 4 CPU cores. For clarity, we only show the first 50 bits in a data frame. At the top, we show the frame bits with the pilot sequence highlighted in a gray shade. The “X”s prior to the pilot sequence indicate “no data”. Also, the time index “0” indicates the start of the frame. We then show the transmitter’s current, which is modulated by varying the CPU load. We can see that the current amplitude changes with the transmitted bits.
Then, we show the receiver’s unfiltered voltage signal, which is affected by grid voltage variations as well as all other loads sharing the same power network and hence barely reveals any useful information. Next, we show the filtered voltage signal with a passband of 67.28 kHz, 67.34 kHz identified by Algorithm 1. The envelop/amplitude of the filtered voltage signal is extracted, and then the average amplitude is used for bit detection. From the pilot sequence, we identify the frame’s starting point and set the bit detection threshold accordingly (Algorithm 2). The bit-wise average amplitudes are then demodulated into the received bits — an average amplitude above the detection threshold is considered as “1”, and “0” otherwise. In this experiment, the received bits perfectly match the transmitted bits without any errors, resulting an effective payload bit rate of 28.48 bits/second.
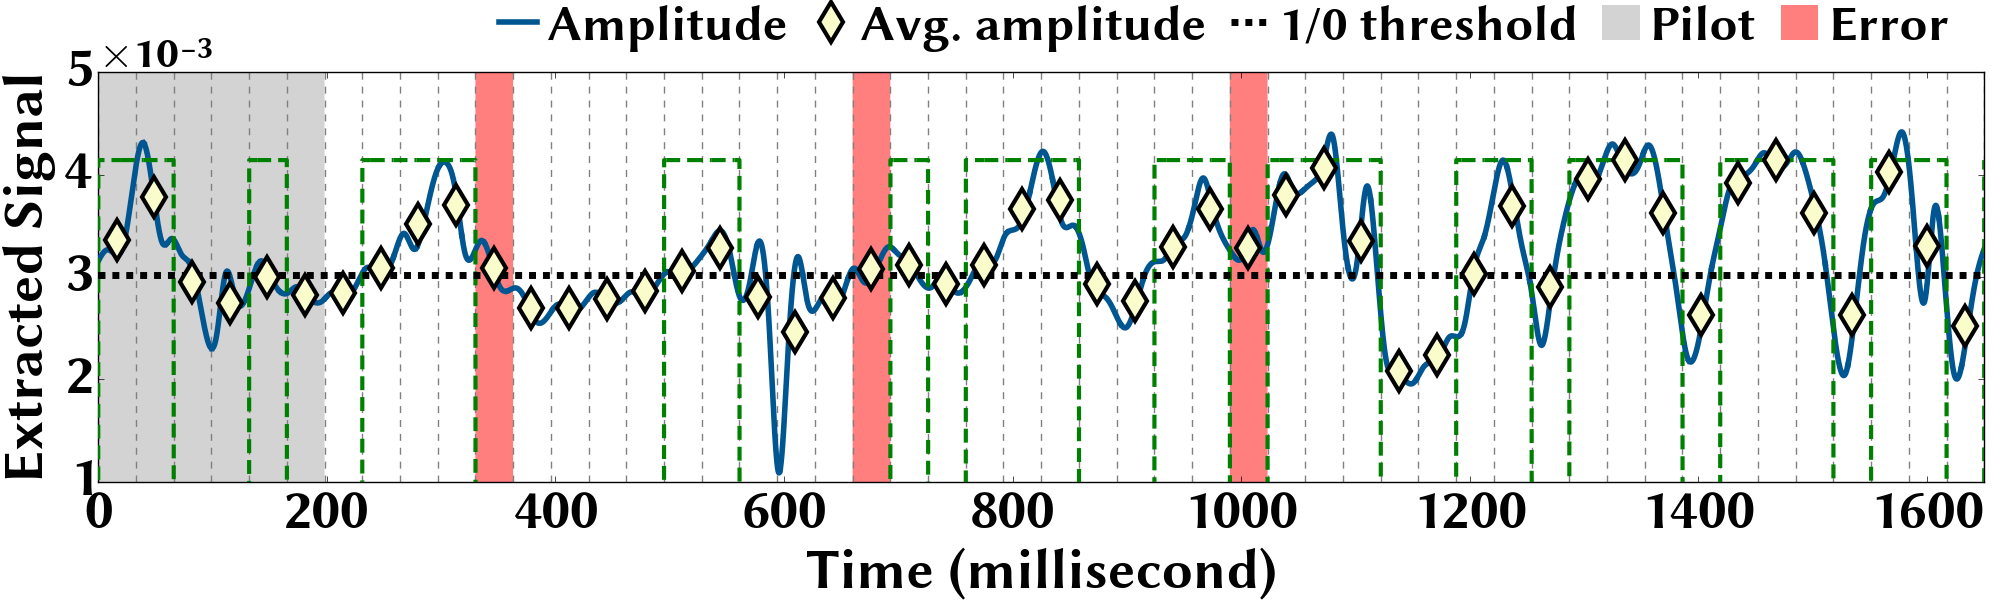
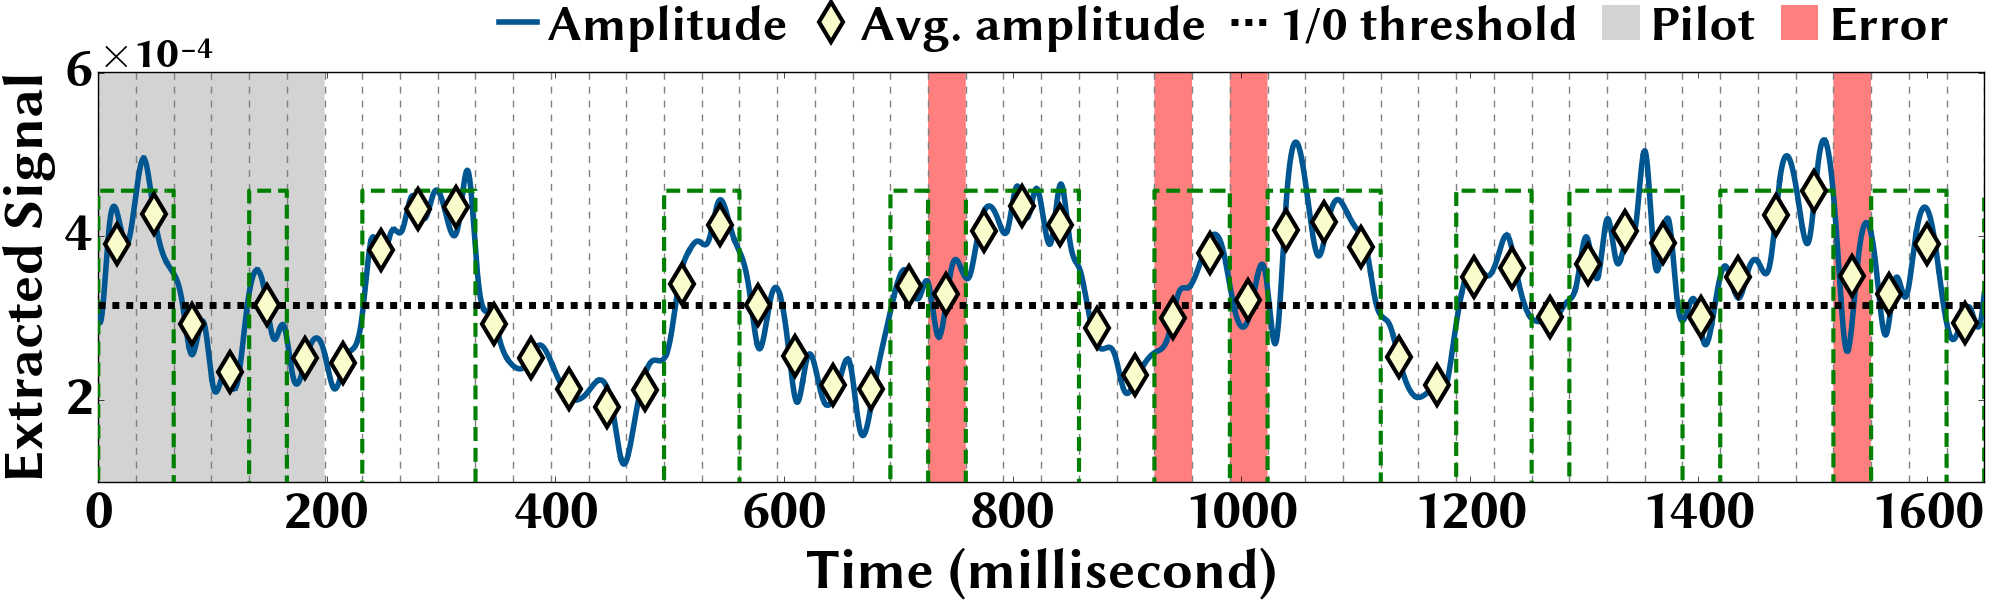
6.2.2. Simultaneous transmissions
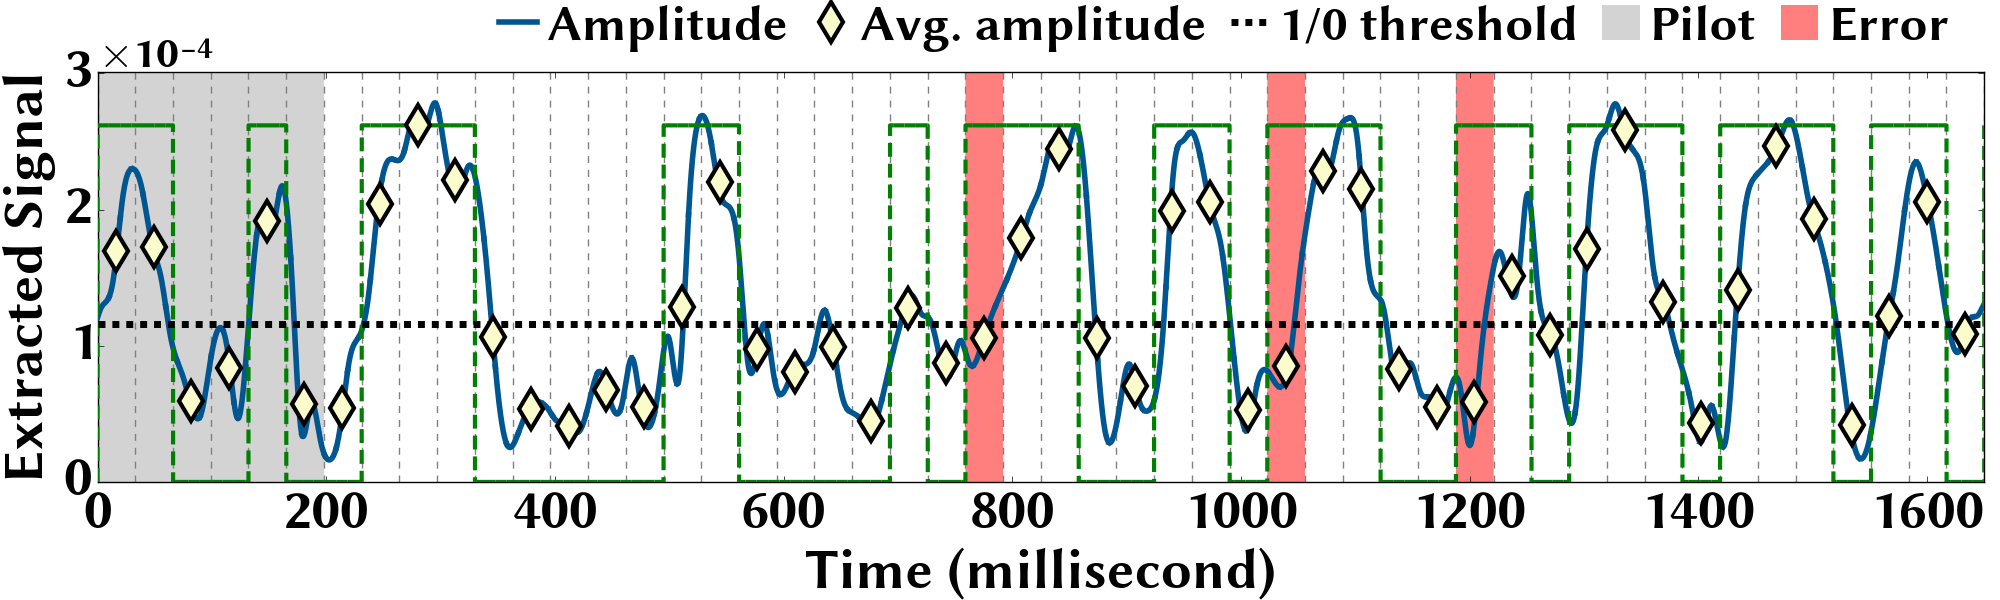
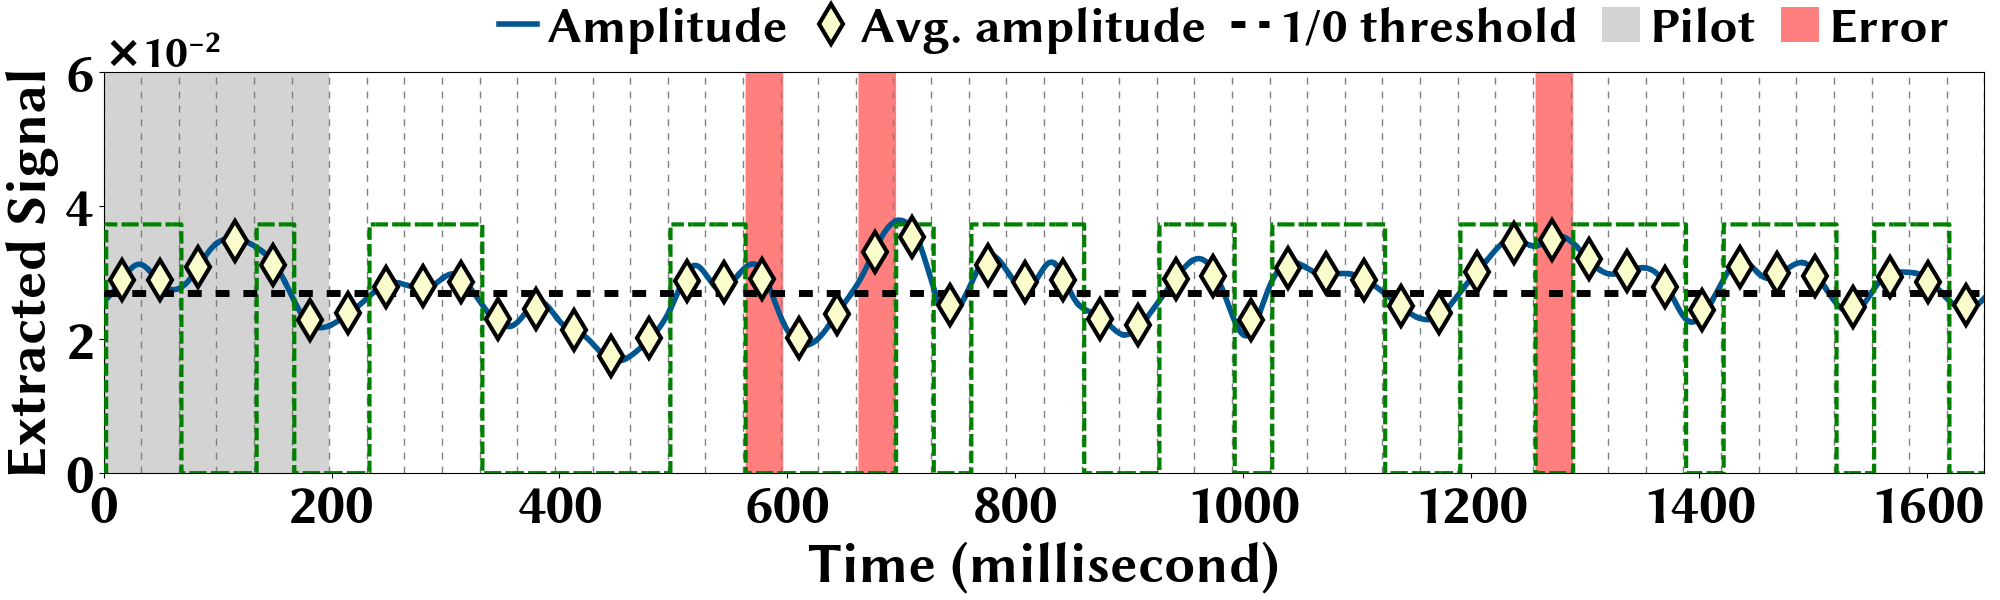
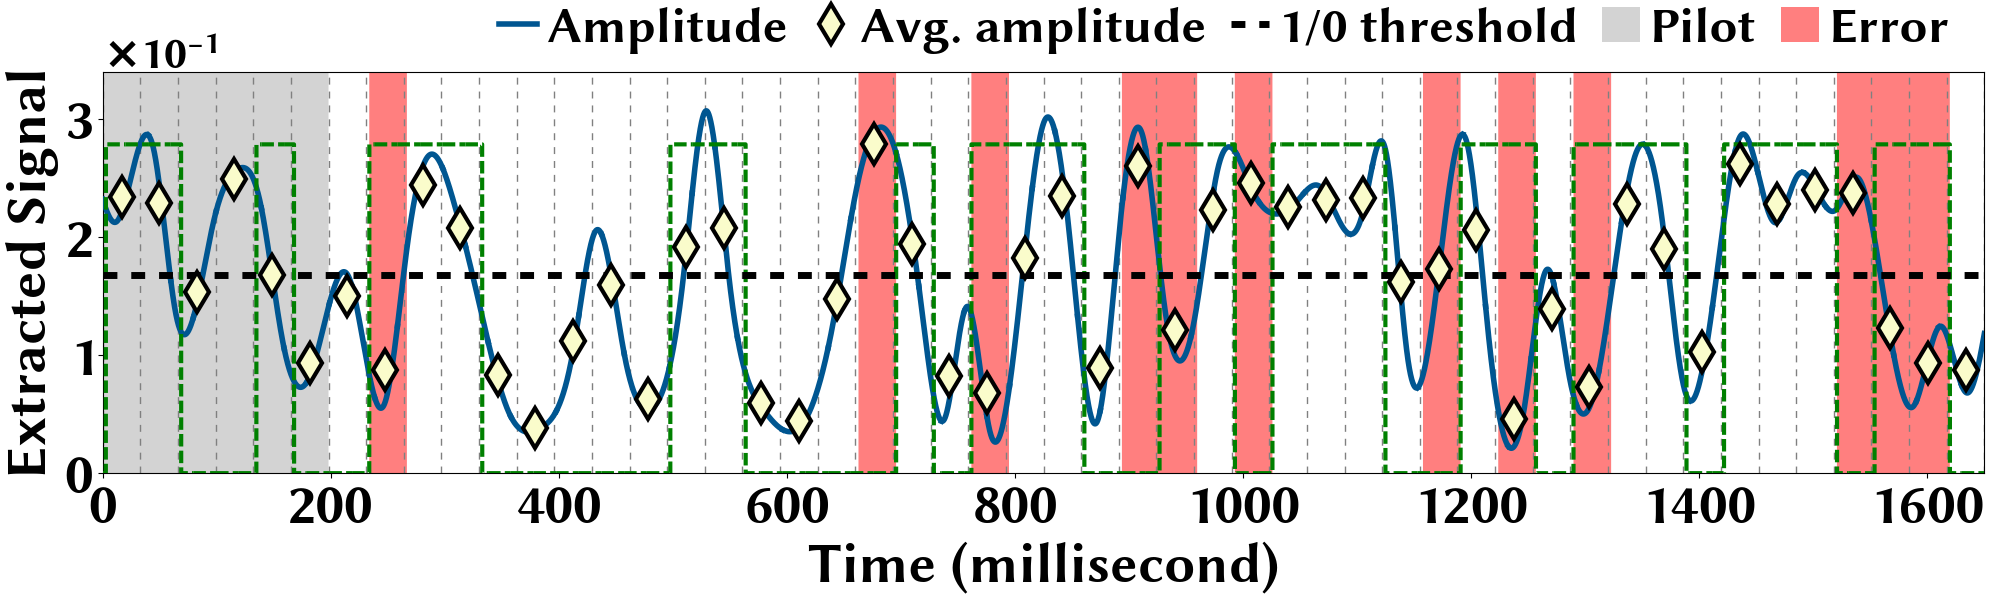
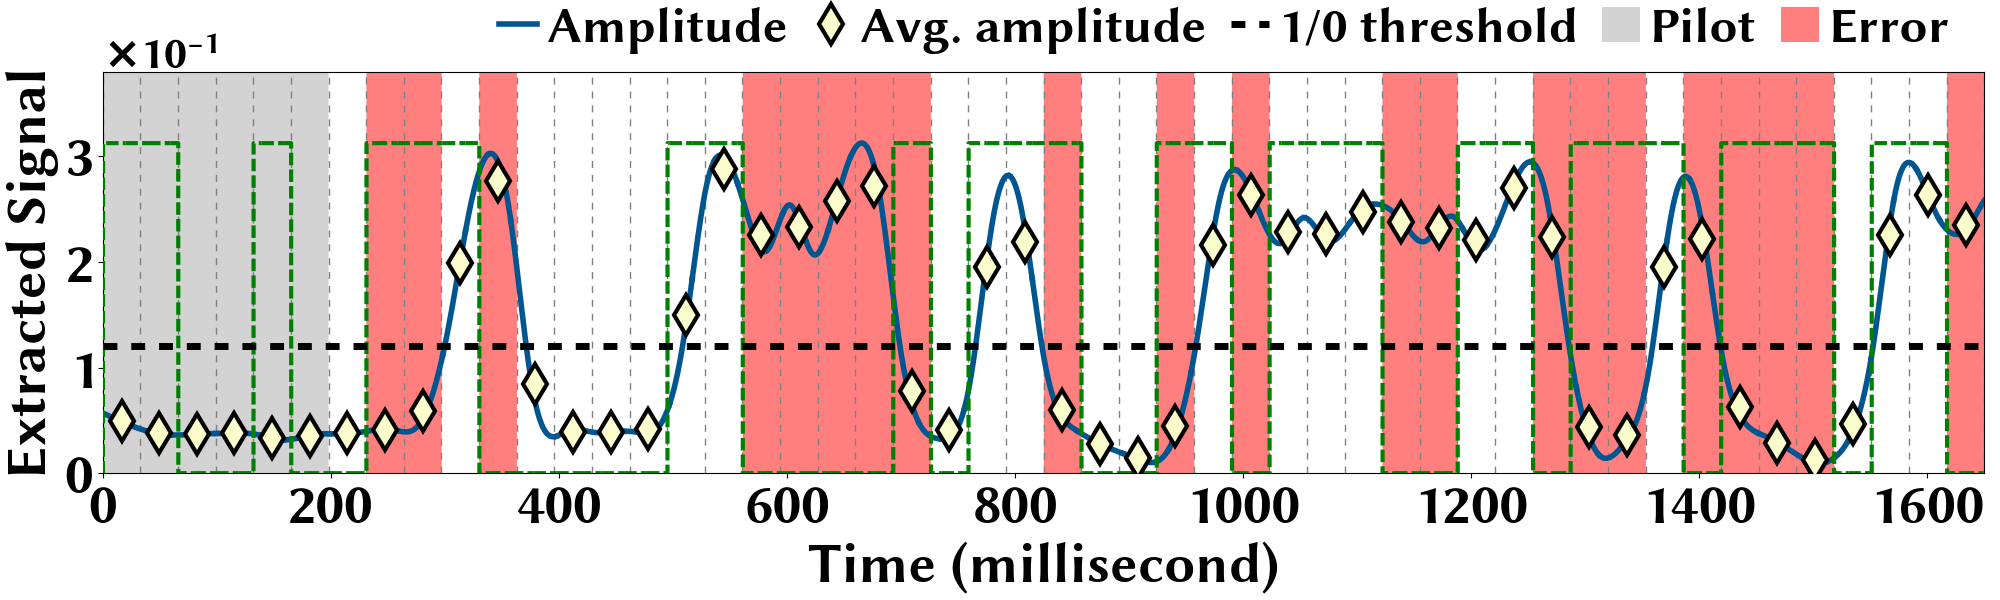
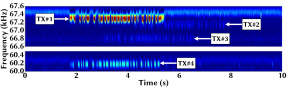
We simultaneously use multiple computers as transmitters to demonstrate that the PSD spikes from different computers do not interfere with each other. We conduct this experiment in Lab#1 using three Dell OptiPlex desktops with identical power supply units and one Dell XPS desktop with a different supply unit. Note that, while we use four computers as transmitters, there are other computers (30+) in the building that also generate switching noise spikes due to their PFC circuits.
Fig. 12 shows the frequency spectrum of the voltage signal from the receiver while the corresponding data frame extractions are shown in Appendix E.2. In the top figure, we show the frequency spectrum of the three transmitters with identical power supply units whose PSD spikes are close to each other (within the frequency band 66.6kHz, 67.6kHz). The bottom figure shows the frequency spectrum of the other transmitter which generates PSD spikes around 60.1kHz. Each transmitter sends a single data frame at different times. We can clearly identify the data frames of the four transmitters in the frequency spectra. We use four 60Hz band-pass filters with center frequencies 60.13kHz, 67.09kHz, 67.3kHz, and 66.72kHz to extract the transmitted data frames. As shown in Appendix E.2, we achieve data exfiltration with a maximum bit error rate less than 7% for any transmitter.
| Scenario |
|
|
|
||||||
|---|---|---|---|---|---|---|---|---|---|
| Default (4 cores) | 0.0% | 28.48 | Fig. 11 | ||||||
| With YouTube streaming | 2.3% | 27.82 | Fig. 27(a) | ||||||
| With MS Word running | 0% | 28.48 | Fig. 27(b) | ||||||
| With web browsing | 0% | 28.48 | Fig. 27(c) | ||||||
| With HDD file transfer | 3.5% | 27.48 | Fig. 27(d) | ||||||
| With ML training | 1.67% | 28.00 | Fig. 27(e) | ||||||
| Loading 1 CPU core | 8.9% | 25.94 | Fig. 28(a) | ||||||
| Loading 2 CPU cores | 2.5% | 27.77 | Fig. 28(b) | ||||||
| Loading 3 CPU cores | 0.0% | 28.48 | Fig. 28(c) | ||||||
| Using 4-bit pilot sequence | 3.3% | 28.13 | Fig. 29(a) | ||||||
| Using 8-bit pilot sequence | 0.0% | 27.88 | Fig. 29(b) |
6.2.3. Data exfiltration under different settings
Now, we vary the default settings listed in Section 6.1. The results are summarized in Table 1, while the figures are shown in Appendix E.1.
First, we run a concurrent program by playing “See You Again” on YouTube on a Google Chrome browser, which is one of the most viewed videos (YouTube_SeeYouAgain_Video, ). As video streaming can be fairly CPU intensive111Our test desktop does not have a dedicated GPU to offload video processing., running YouTube adds random variations to the transmitter’s power. It also reduces the difference between transmitted ”0”s and ”1”s, resulting in a 2.3% bit error rate. We also run experiments using MS Word, web browsing, file transfer, and machine learning training as background applications resulting in 0%, 0%, 3.5%, and 1.67% bit error rates, respectively. In the MS word experiment, we mimic user behavior by repeatedly opening a new file, typing a few lines of texts and then saving the file. For the web browsing experiment, we open new popular websites (e.g., GMail and Facebook), scroll through the page content, and follow links to other pages. For the file transfer experiment, we transfer a 5GB file from one HDD drive to another in our desktop computer running Windows 10. For the machine learning experiment, we repeat training Tensorflow in Python with 6000 samples from the MNIST data set taking around fives minutes to finish (lecun1998gradient, ). From the results from Table 1 we see that under a diverse set of background applications running simultaneously, still maintains a low bit error rate.
Second, we use CPU pinning to restrict the number of cores that are assigned to the modulation program in . Reducing number of cores increases the bit error rate because it limits how much the modulation program can vary the transmitter’s current. Nonetheless, we find that even by loading only one CPU core (the weakest transmission), achieves an effective rate of 25.94 bits/second. In Table 1 we omit the four core case which is our default case with 0% bit error rate.
Finally, we consider 4-bit (“1101”) and 8-bit (“11001010”) pilot sequences. We see that when using a 4-bit pilot sequence “1101”, the bit detection threshold may not be properly set due to lack of enough pilot symbols, but it has lower overhead than the 8-bit pilot and still achieves 28.13 bits/second.
|
Configuration |
|
|
Year |
|
Location |
|
|
|
|
|||||||||||||||||||
|
|
Windows 10 |
|
2015 | 67.3 kHz |
|
55 feet | 0.0% | 28.48 | Fig. 11 | |||||||||||||||||||
|
|
|
|
2016 | 65.8 kHz |
|
90 feet | 0.0% | 28.48 | Fig. 32 | |||||||||||||||||||
|
|
Windows 10 |
|
2017 | 60.1 kHz |
|
55 feet | 0.0% | 28.48 | Fig. 30(d) | |||||||||||||||||||
| Acer G3-710 |
|
|
ACER 750W | 2016 | 63.5 kHz |
|
20 feet | 10.1% | 25.60 | Fig. 33(a) | |||||||||||||||||||
|
|
Windows 10 |
|
2018 | 91.2 kHz |
|
55 feet | 8.1% | 26.17 | Fig. 33(b) | |||||||||||||||||||
|
|
|
|
2016 | 67.7 kHz |
|
15 feet | 9.2% | 25.85 | Fig. 33(c) | |||||||||||||||||||
| Apple iMac Model A1419 (27-inch) | Core i5-3470S, 8 GB | macOS 10.13.3 | Apple 300W PA13112A1 (for 2012-2017 models) | 2015 | 101 kHz | Lab #1 (Building A) | 55 Feet |
|
15.79 | Fig. 34 | |||||||||||||||||||
|
9.21 |
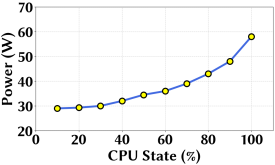
6.2.4. Impact of CPU scaling on the transmitter
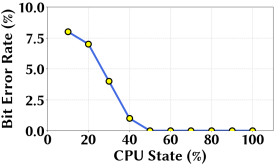
We tune the CPU scaling of the transmitter by changing the “maximum processor state” in the Windows power management system. We vary the maximum processor state from 10% to 100% which, in our test computer, corresponds to CPU frequency from 0.79 GHz to 3.68 GHz. We use the default settings and transmit 100 frames under each different CPU scaling and record the average power consumption of the transmitter using a WattsUp power meter. Figs. 13(a) and 13(b) show the bit error rates and power consumption for the different CPU scaling. Similar to our experiment with the number of cores for , we see a higher bit error rate when the transmitter consumes less power due to reduced CPU speed. Note that, While dynamic CPU scaling at runtime is supported by modern CPUs, it is more commonly applied in data centers with sophisticated power-performance control, where energy saving is a crucial concern. For typical enterprise environments, DVFS is not applied and instead, desktop computers commonly run at the high-performance mode (i.e., 100% maximum processor state, which is also the default setting in Windows 10).
6.2.5. Data exfiltration without line of sight
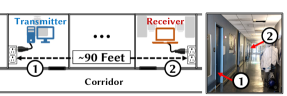
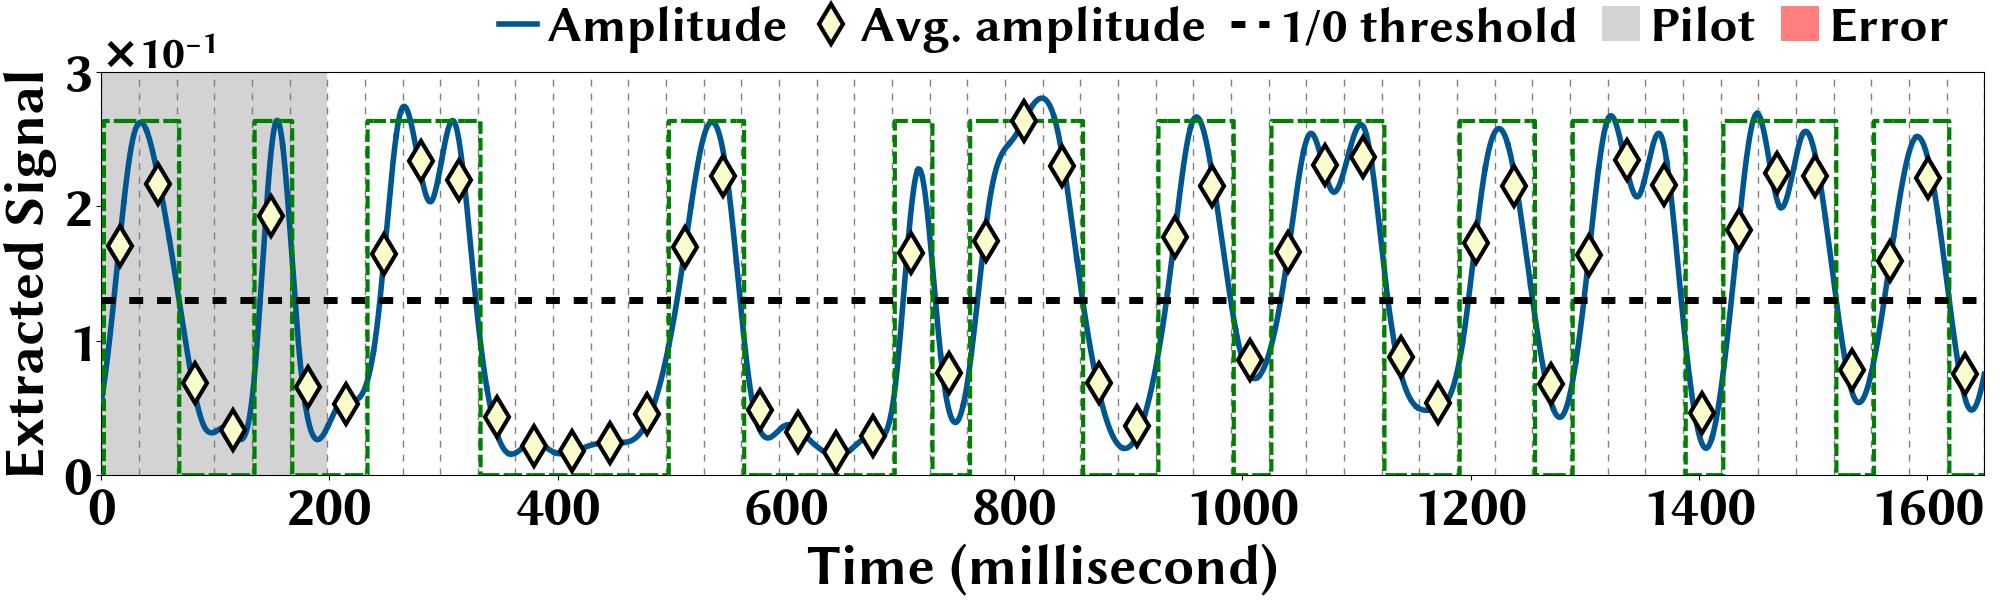
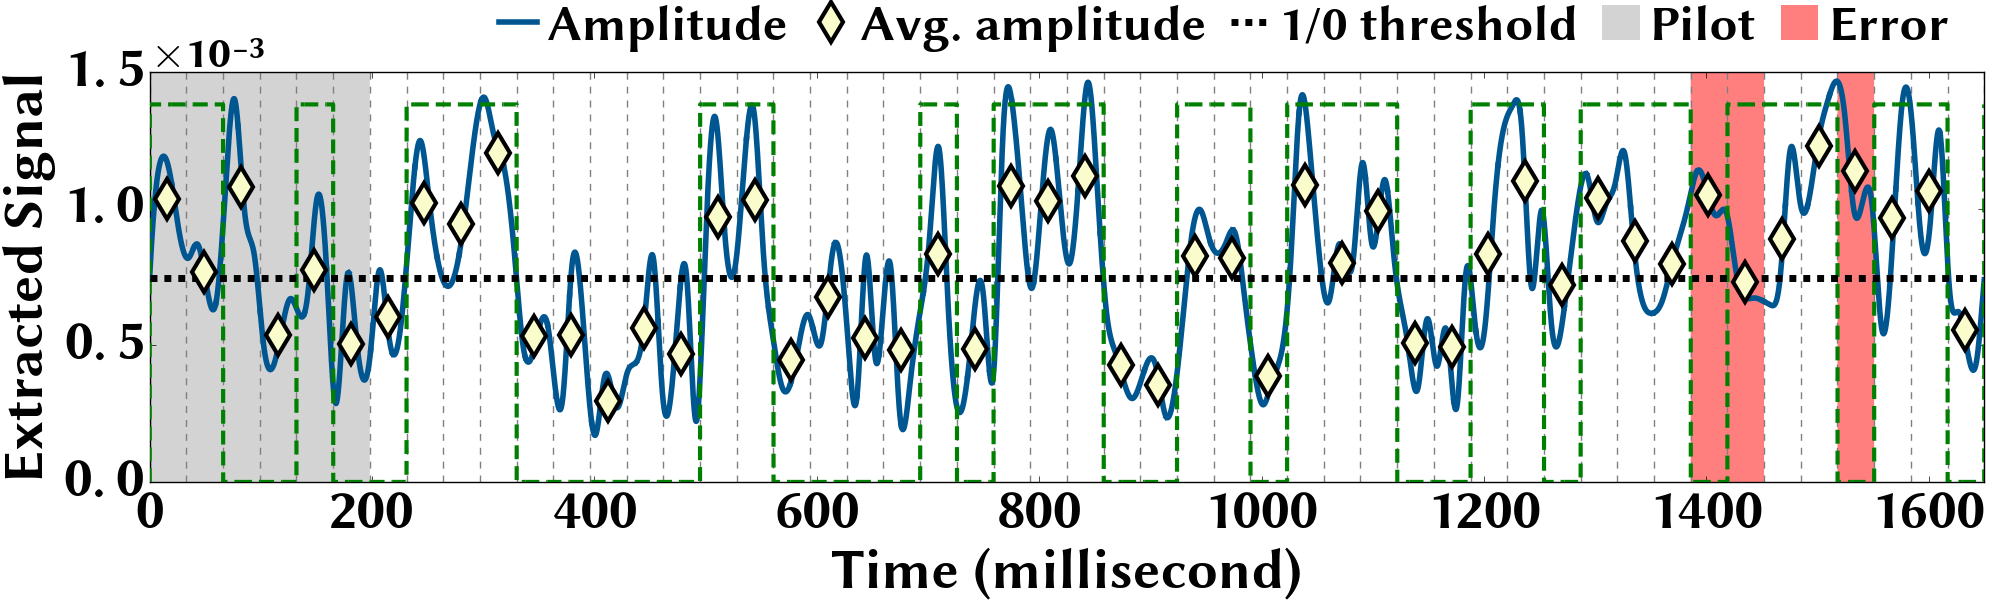
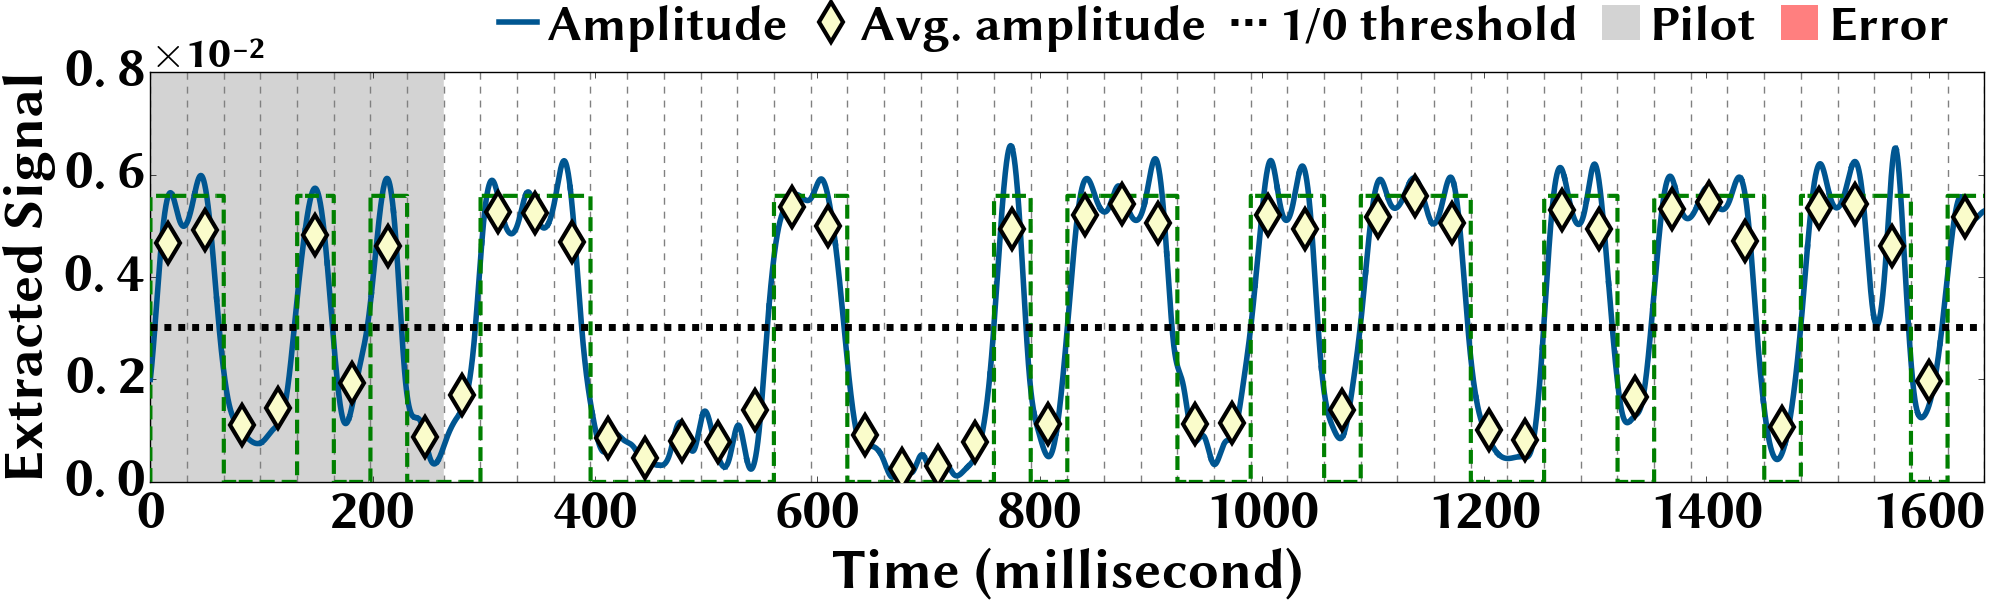
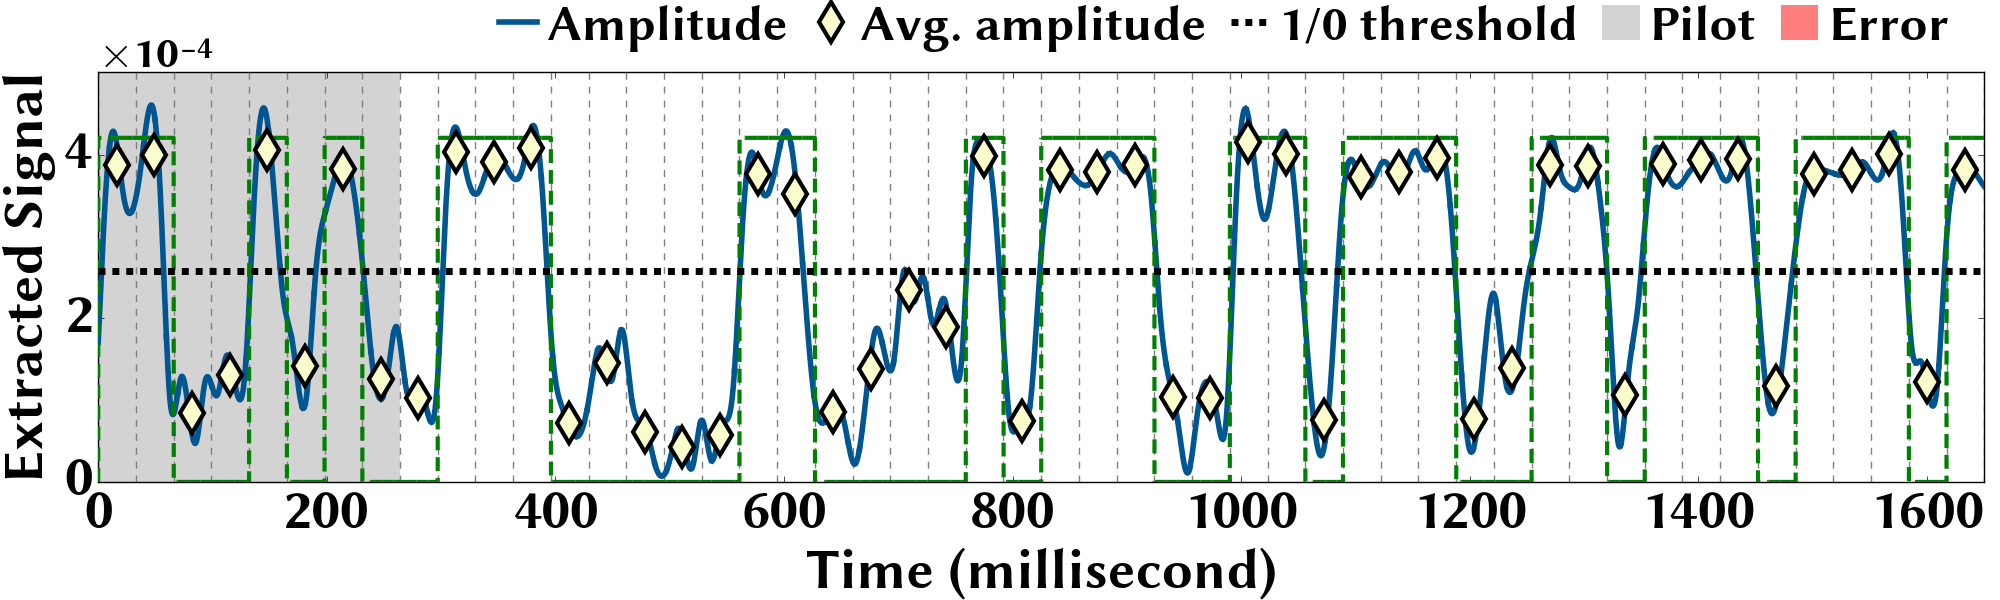
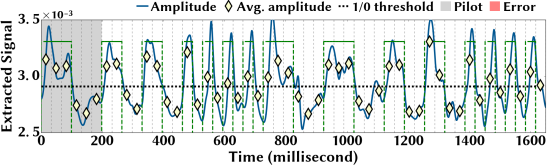
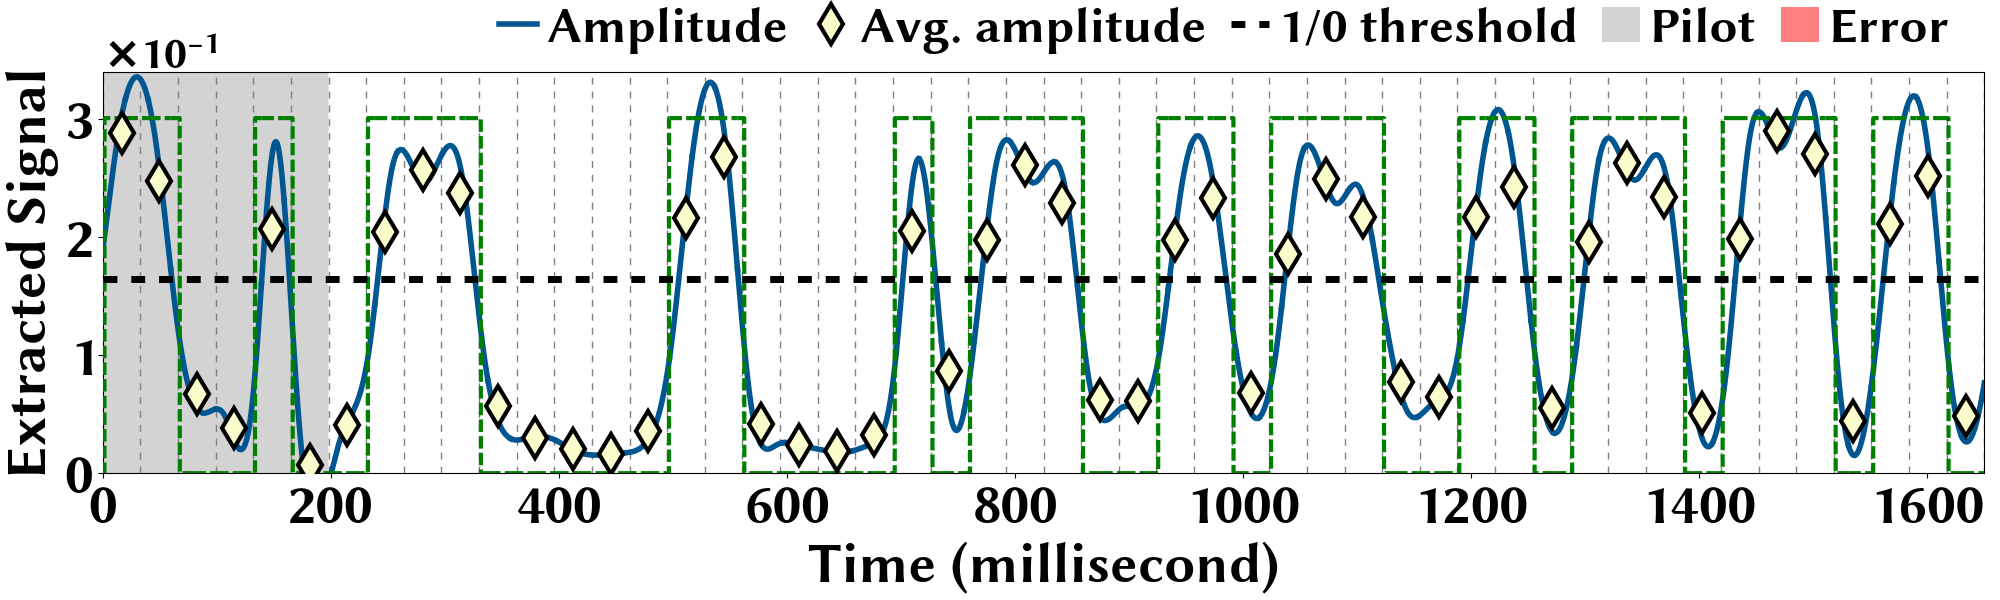
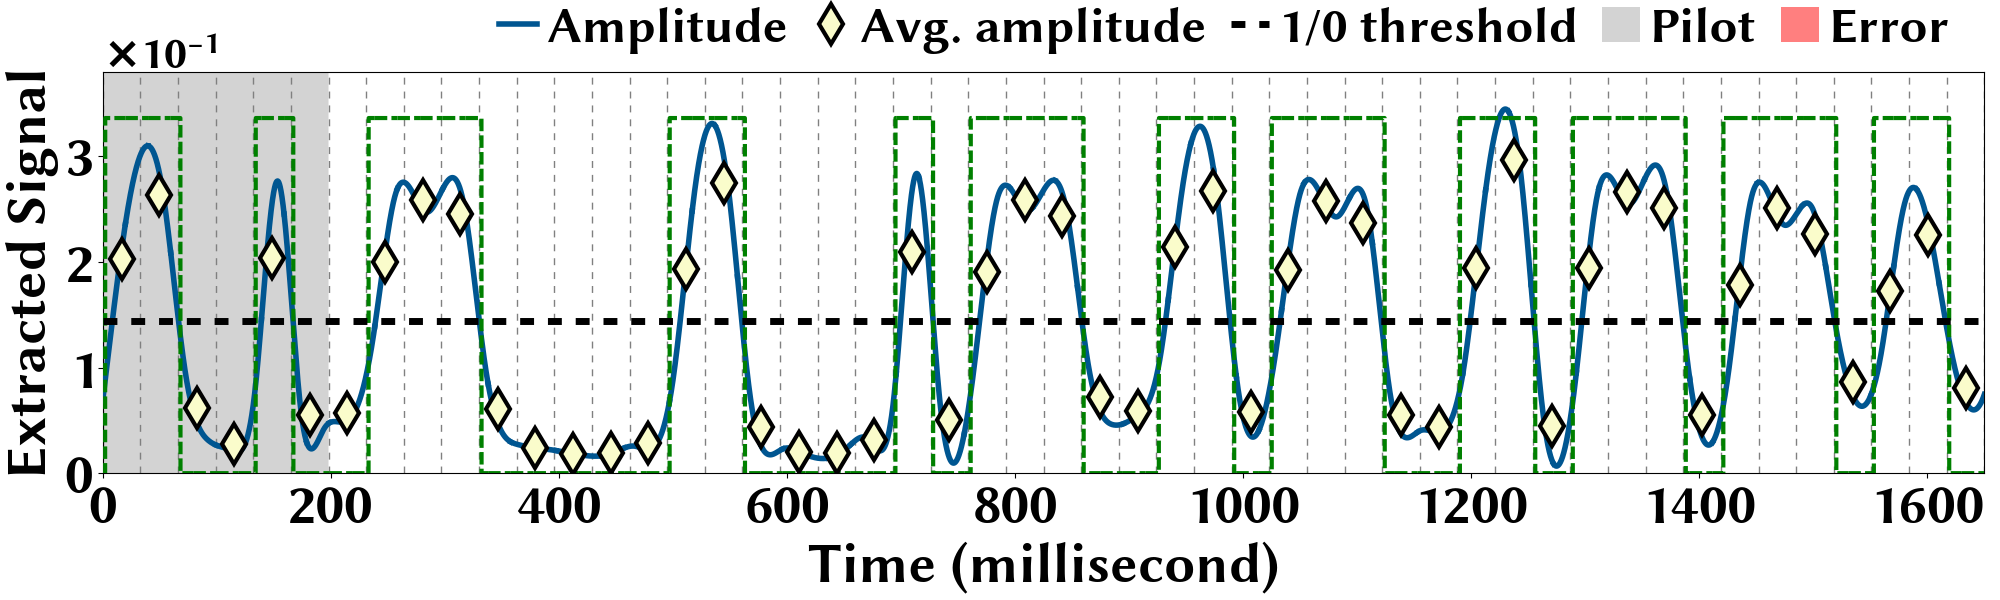
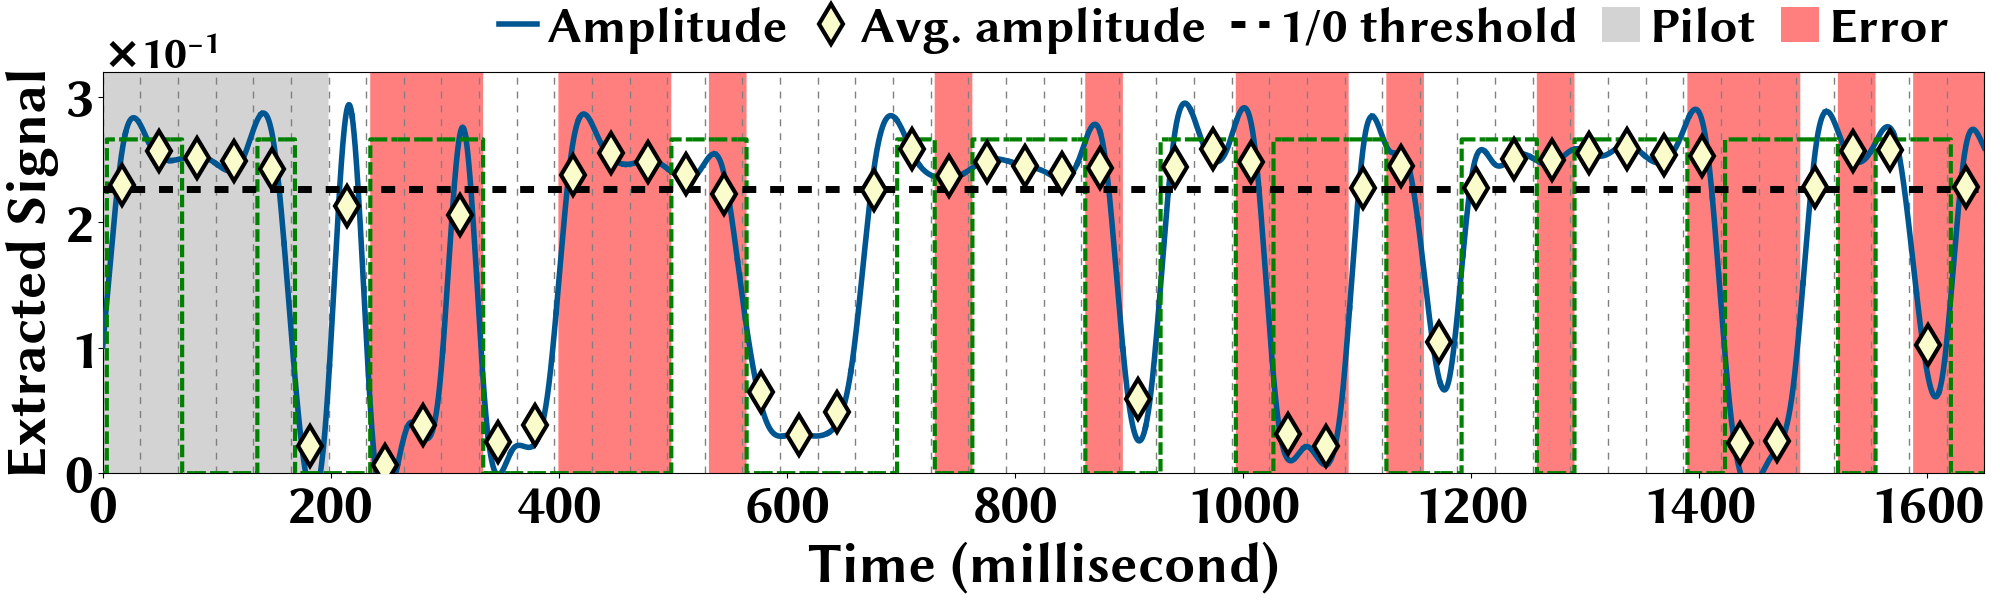
As shown in Fig. 14, we run an experiment in Building B where the transmitter and receiver are plugged into two outlets located in two different rooms which are approximately 90 feet away from each other. We use a Dell PowerEdge computer as the transmitter which, albeit using a different switching frequency, adopts same PFC design as our Dell Optiplex computer. We show a snapshot of extracted signals at the receiver in Fig. 32 in Appendix E.4. We see that, compared to Fig. 11, the distinction between bit “1” and bit “0” in terms of the average amplitude of filtered voltage is less significant. Nonetheless, even with a transmitter-receiver distance of 90 feet and across different rooms, still achieves error-free stealthy data exfiltration with a rate of 28.48 bits/second.
6.2.6. Data exfiltration from other computers
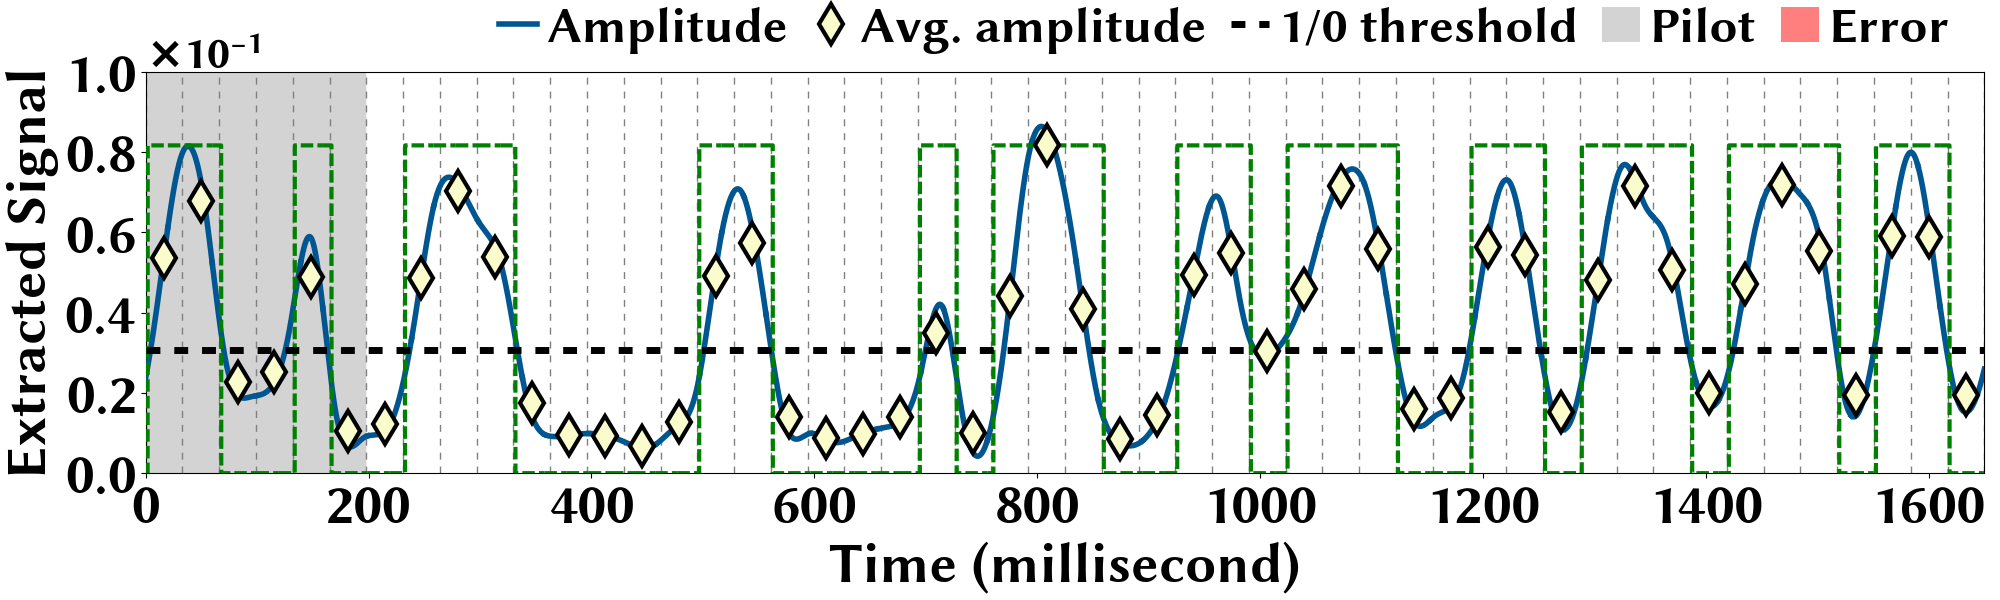
To further evaluate , we run more experiments on four additional computers: an Apple iMac, an Acer, and two custom-built systems with top-brand power supply units (Corsair and EVGA). These computers are located in different labs in Building A. For the iMac, we could achieve a maximum of 15.79 bits/second due the iMac’s slow response to power change and wider frequency signature (discussed further in Appendix E.6). We summarize our results in Table 2, while the details are presented in Appendices E.5 and E.6.
In summary, while certain conditions may degrade the effectiveness of , our experiments on different computers and under different settings confirm that can exploit a building’s power network as a covert channel for stealthy data exfiltration from desktop computers without using a conventional communication network.
6.3. Discussions
We now discuss from the following important aspects.
Comparison with PLC adapters. Without dedicated physical powerline communications (PLC) adapters, still achieves information transfer over power networks. This is due to the PFC’s capability of generating prominent high-frequency quasi-orthogonal switching noises. During our experiments, we have found that the amplitudes of PFC-induced switching noise spikes and high-frequency voltage signals (in MHz range) modulated by a PLC adapter (NETGEAR PowerLINE 1000) are in the same order of magnitude. Thus, in practice, the achievable transmission range of is expected to be similar to that of a PLC adapter (typically up to a few tens of meters) (PowerLineCommunications_Survey_JSAC_2016_Cano:2016:SAP:2963140.2963846, ).
Missed frames and bits. In any covert channels (Security_AirGap_EMI_GSMem_Security_2015, ; Security_AirGap_Mobile_USB_Charging_ACNS_Mobile_CovertChannel_Spolaor2017NoFC, ; Security_AirGap_Electric_PowerHammer, ), some frames may not be successfully received due to erroneous pilot and/or payload symbols, and the receiver is not able to notify the transmitter due to the unidirectional covert channel. To trade efficiency for reliability, the transmitter may send each data frame multiple times and/or apply error correction coding (Goldsmith_WirelessCommunications_2005, ).
Higher bit rate and limit. Like in the existing power-based data exfiltration literature (Security_AirGap_Mobile_USB_Charging_ACNS_Mobile_CovertChannel_Spolaor2017NoFC, ; Security_AirGap_Electric_PowerHammer, ), we empirically demonstrate the achievable bit rate of . Nonetheless, we provide conjectures on two possible approaches to further improving the achievable bit rate for data exfiltration. First, we may possibly improve the achievable bit rate if privileged access to the target computer’s PFC is granted. Specifically, the PFC’s feedback gain may be altered to increase the responsiveness of the power supply unit, i.e., the power supply unit follows changes in the CPU utilization/power consumption more closely. This can be achievable since most modern computer power supplies utilize digital control to adjust the feedback gain (pfcHandbook, ; pfcST, ). Second, given privileged access to the computer’s power supply unit, another complementary approach is to modulate the PFC’s switching frequency for data exfiltration. The digitally-controlled PFC circuit allows dynamically setting the switching frequency through its control program (zhang2004digital, ). However, this approach may still be restricted by how often we can change the switching frequency. Moreover, frequency modulation requires wider bandwidth and hence can be susceptible to greater interferences from other devices/computers.
Sources of bit errors. Various factors can introduce bit errors during data exfiltration, including the source signal strength (affected by the amount of transmitter’ power consumption that can be modulated by the malware and the PFC design), signal propagation path and fading (affected by the relative location/distance of transmitter and receiver, line impedance, building’s power network topology), interferences from other devices with similar PFC switching frequencies, among others. While it is challenging, if not impossible, to theoretically quantify the impact of different factors on the resulting bit errors for a given transmitter-receiver pair, one can qualitatively conclude based on standard bit error analysis for additive white-Gaussian noise channels (Goldsmith_WirelessCommunications_2005, ) that a lower bit error rate can be achieved by increasing the source signal strength, reducing the signal propagation fading, and/or mitigating interferences. These are also reflected by our above empirical results.
Scalability of NoDE. The scalability of the simultaneous exfiltration depends largely on whether or not switching noise spikes generated by different computers overlap with each other. Next, we discuss the following three different cases — orthogonal switching noises spikes, overlapping switching noise spikes, and practical scenarios.
When switching noise spikes of different computers are perfectly frequency-orthogonal. In this case, data exfiltrations from different transmitting computers can be viewed as independent, without much inference from each other. If we conservatively assume that the switching noise spike of a computer occupies a frequency band of 500Hz (400Hz sidelobes around the most prominent spike plus 100Hz guard band) and that the noise spikes of all transmitting computers are perfectly frequency-orthogonal, then can achieve simultaneous data exfiltrations from up to 200 computers over the frequency range of 50–150kHz, which is the range for typical switching frequencies of PFC circuits (pfcHandbook, ).
When switching noise spikes of different computers are overlapping in frequencies. In this case, simultaneous data exfiltrations become challenging, as in the case of any communications systems (Goldsmith_WirelessCommunications_2005, ). Thus, different transmitting computers need to access the covert channel at different times. This is not restrictive, since a target computer may not be always sending data over our covert channel.
Practical scenario. In practice, the likelihood of overlapping PFC-induced noise spikes is not very high because the switching frequency is not tightly regulated in the power supplies. Thus, under a scale of up to a few tens of computers, we expect that the switching noise spikes of some computers may partially overlap, while most noise spikes do not overlap (Fig. 12). If other background computers have overlapping switching noise spikes with a target computer, their switching noises can be viewed as quasi-static background noises and do not significantly affect data exfiltrations from the target computer. For example, even on a single computer with simultaneous background applications, we show in Table 1 that still can successfully exfiltrate data.
To summarize, the likelihood of having overlapping PFC-induced noise spikes among two computers is not very high in practice, thus allowing simultaneous data exfiltrations. Nonetheless, when two or more target computers have the overlapping switching noise spikes, they need to transmit information at different times using .
7. Defense Mechanism
Three major approaches exist to defend against — eliminating PFC-induced switching noises, preventing the switching noises entering the power network, and suppressing malware activities. The first two approaches involve hardware implementation and/or modification, while the last approach can be implemented primarily in software.
7.1. Eliminating PFC-induced Switching Noises
Completely eliminating PFC noise would require re-designing of computers’ power supply units with fundamentally different PFC strategy. However, it is non-trivial to find alternative solutions to replace the existing mature designs of power supply units without compromising energy efficiency. Moreover, such a change will require an industry-wide upgrade which is not likely to occur anytime soon. Alternatively, a stricter EMI regulation can be imposed to include components less than 150kHz.


7.2. Preventing Switching Noise From Entering Power Networks
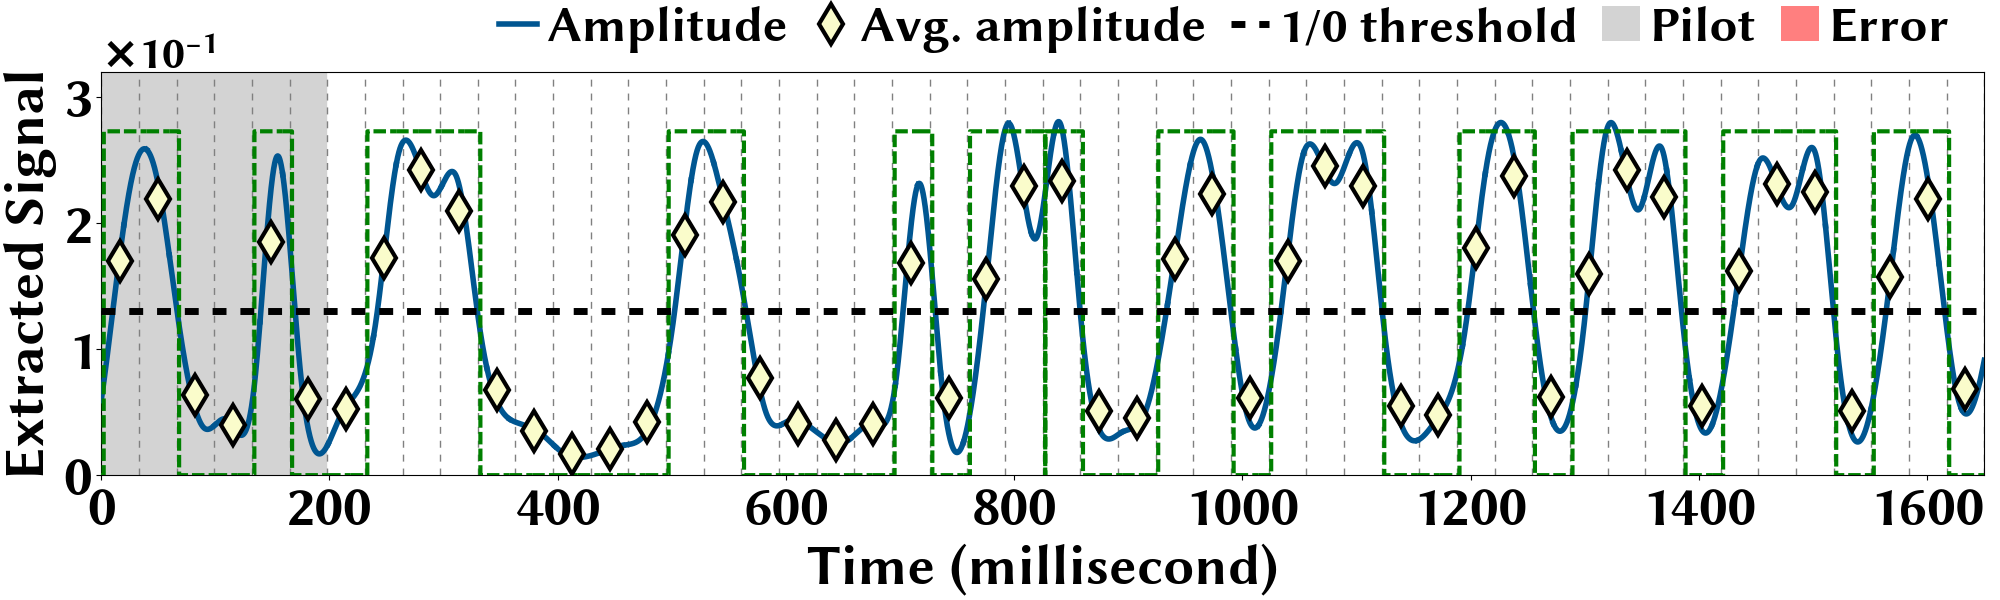
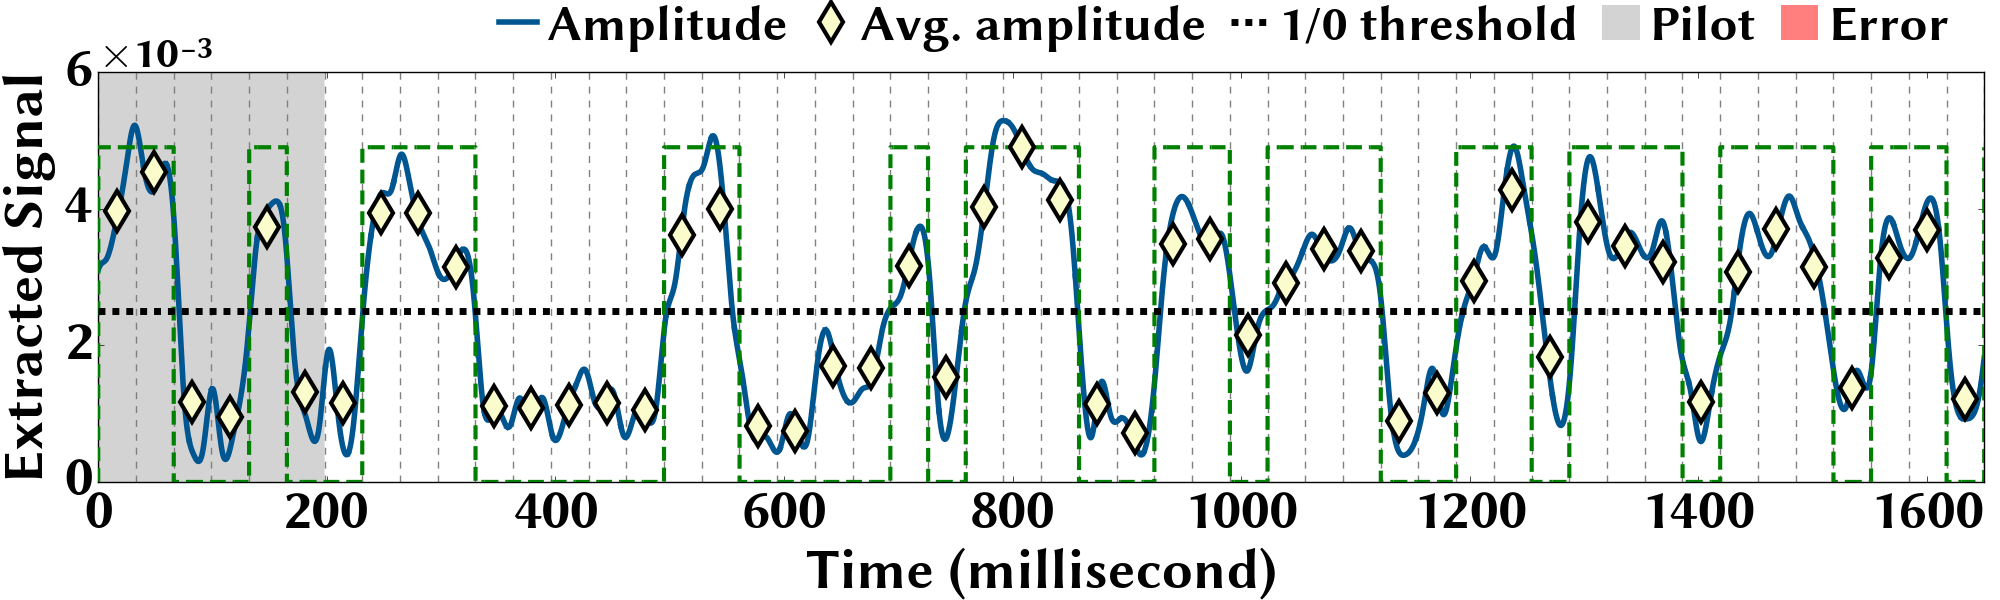
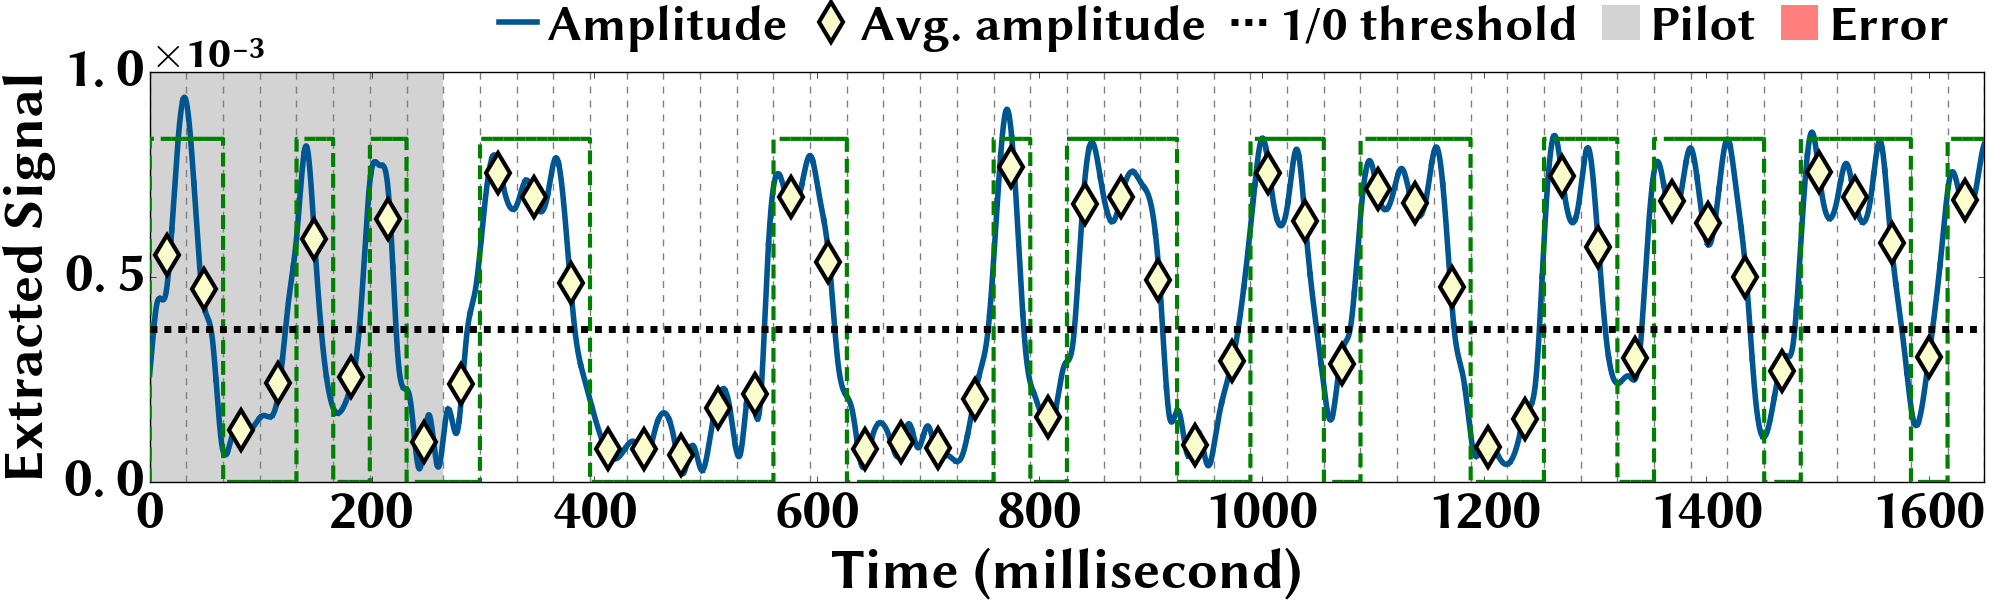
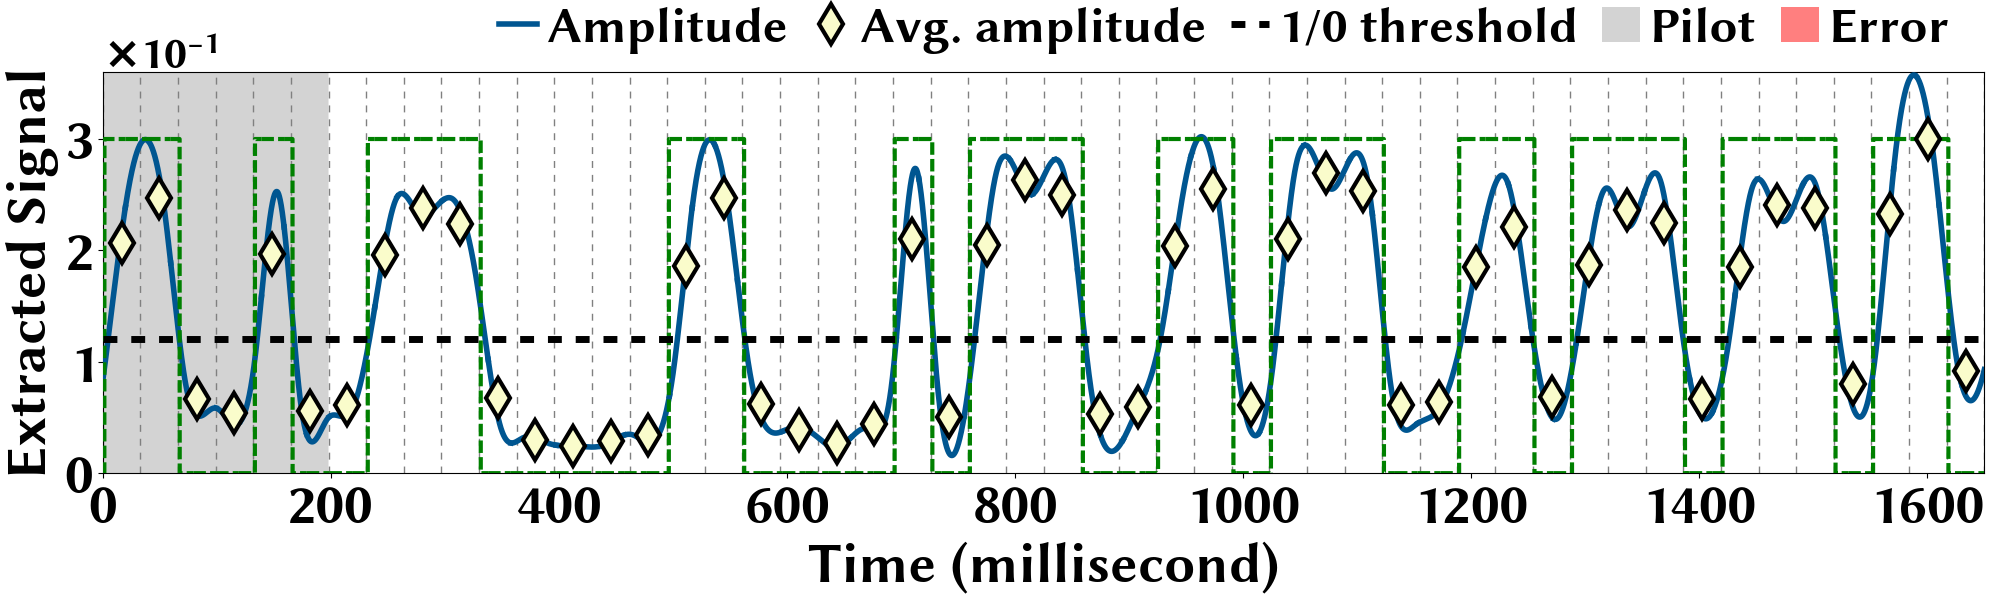
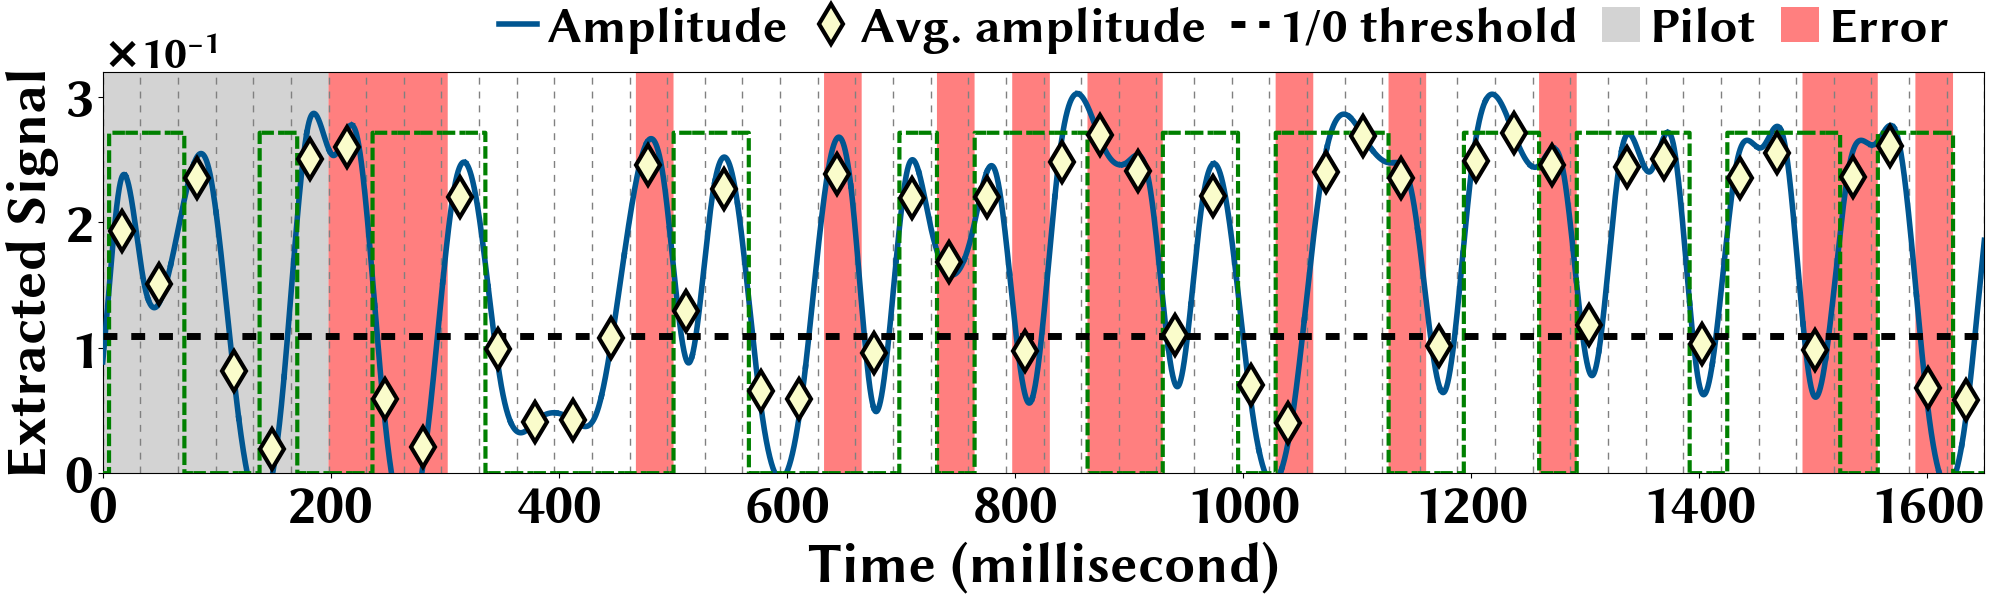
An intuitive defense against is to power a computer through a UPS instead of directly connecting it to a power outlet, and thereby restricting the PFC noise from entering the power network. In such a case, as shown in Fig.15(a), the UPS sits between the desktop power supply and the power outlet (i.e., power network). However, an UPS does not necessarily provide electrical isolation from the power network. Instead, it “bypasses” the utility power to its connected devices during normal operation. The UPS acts as an alternate power source when the power supplied through the utility is interrupted in the event of voltage drop or complete power losses. To illustrate this, we connect our Dell PowerEdge computer to a 600VA CyberPower UPS and conduct our data exfiltration experiment in Building B. As shown in Fig. 35, we have “zero” bit error, which matches our previous experiments without the UPS. Hence, an UPS-powered computer does not necessarily mean it is immune to the threat of , let alone the added UPS cost.
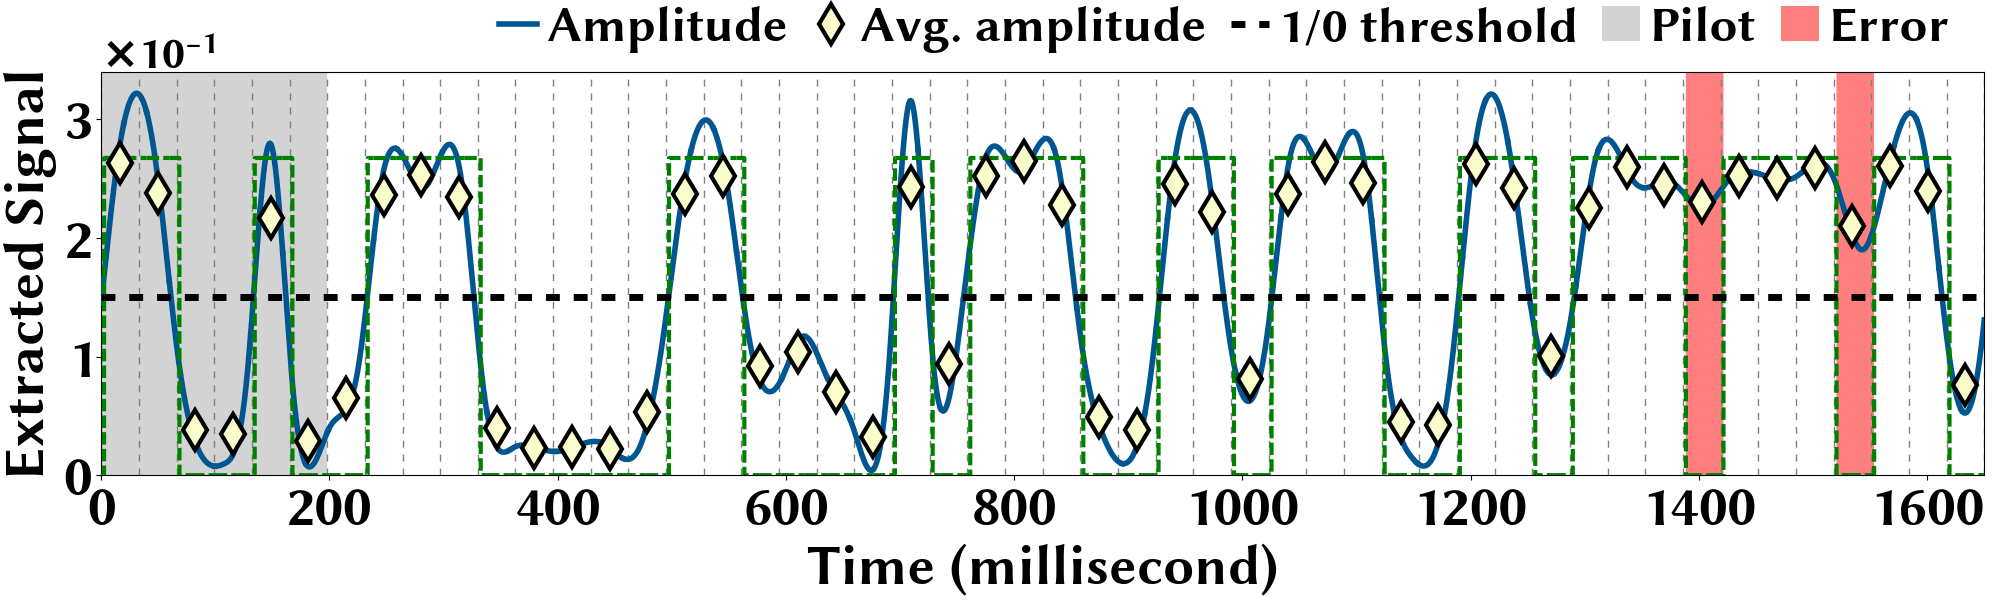
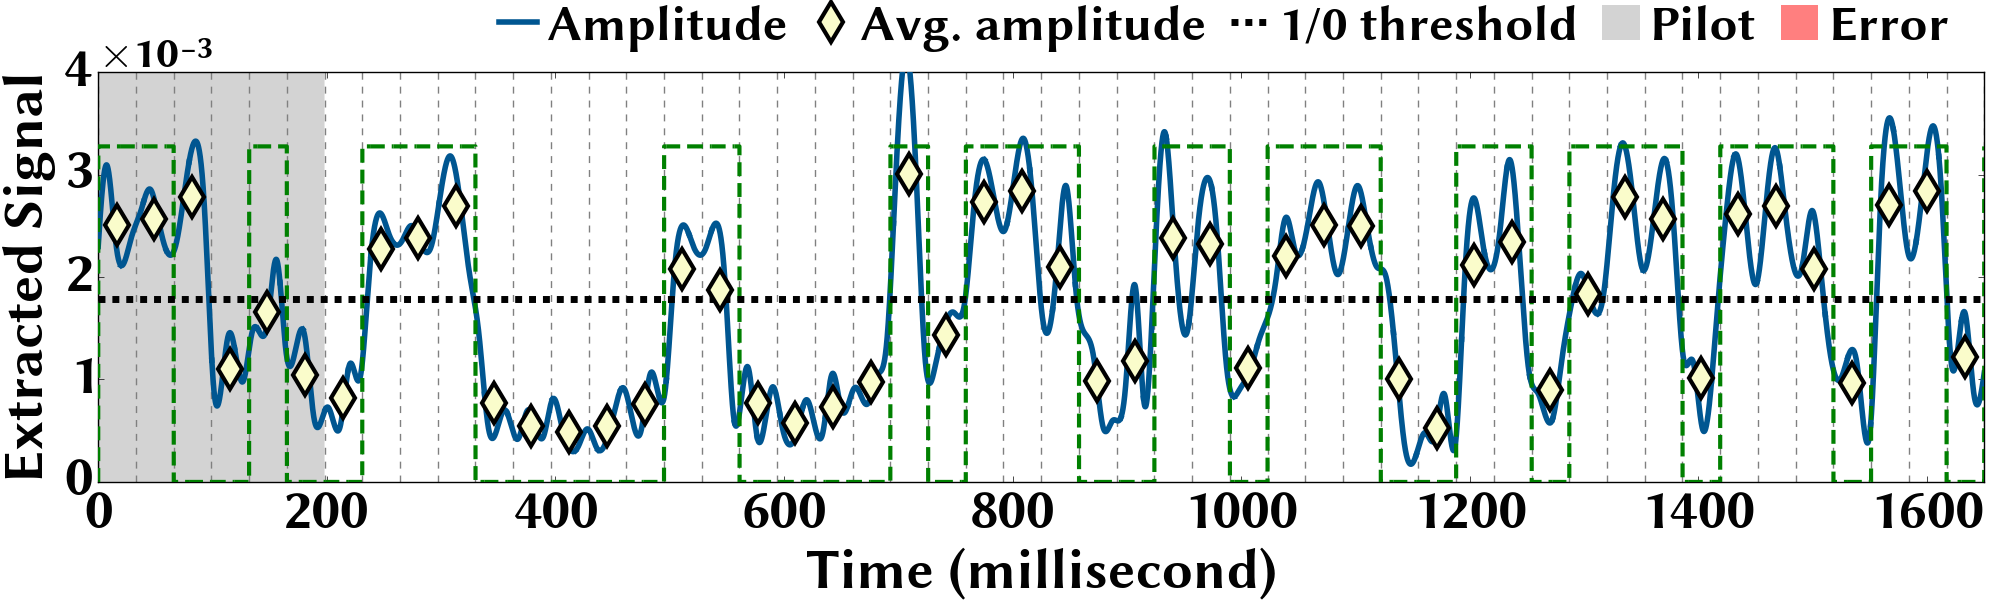
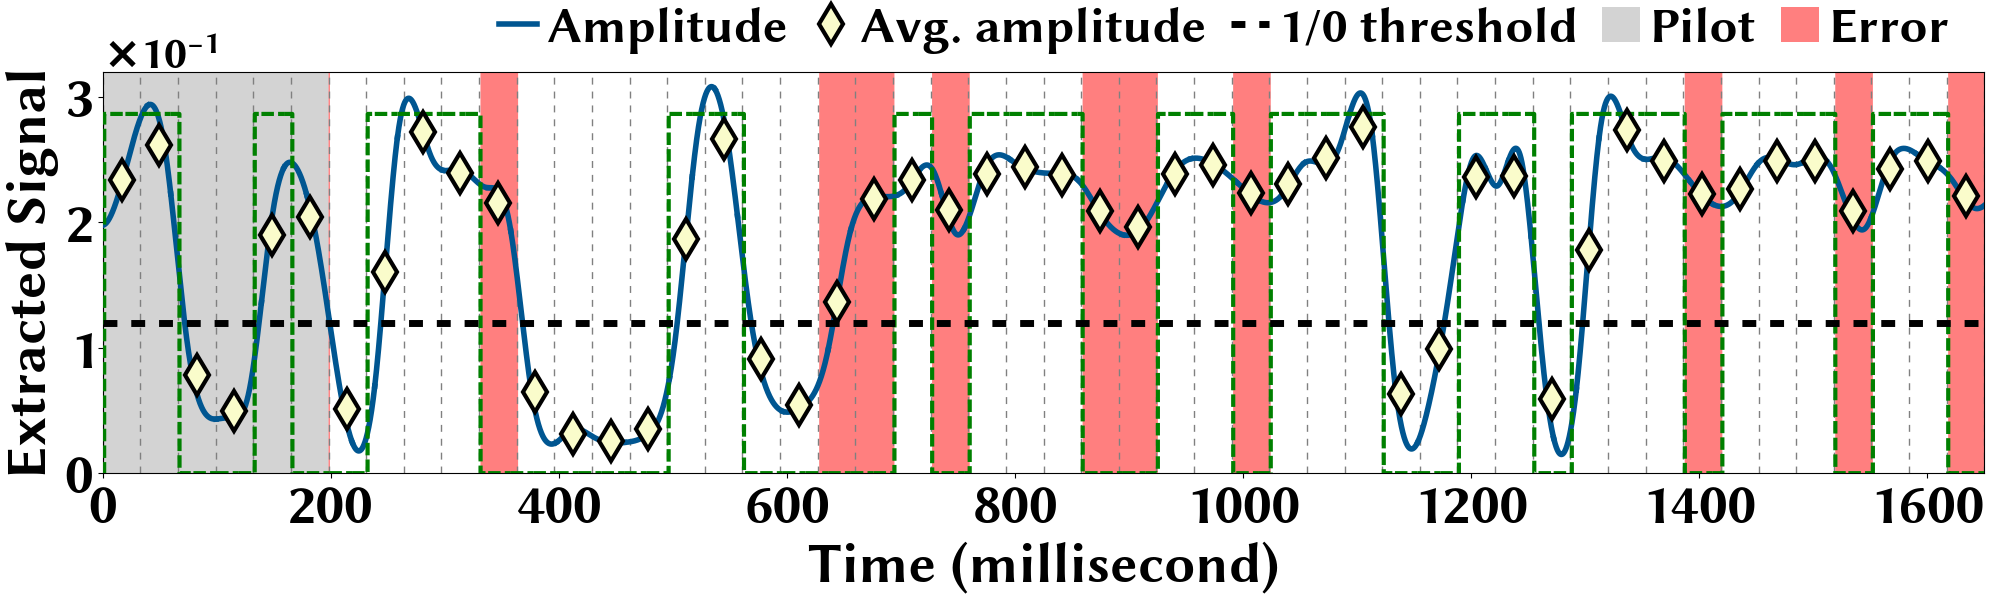
Another defense is to insert a power line noise filters between computers and power outlets, as shown in Fig. 15(b). The filters are commercially available to use together with household/office appliances for reducing interference and better facilitating power line communications. However, they mainly reduce the amplitude of appliance-generated noise entering the power network, without complete elimination. To demonstrate this, we run an experiment on our Dell PowerEdge computer plugged into a power line noise filter (X10 XPPF (PFC_power_line_filter, )) in Building B. The resulting received signal is shown in Fig. 36, from which we see that the signal amplitude of the PFC-induced switching noise spike is degraded by more than a factor of 10 compared to the case without any filters (Fig. 32). Thus, while not entirely prohibiting the transmitter’s switching noise spikes from entering the power network, the power line noise filter can significantly attenuate the amplitude of spikes, reducing the effective transmission distance.
7.3. Suppressing Malware Activities
As data exfiltration is done by varying the CPU load to modulate the transmitter’s overall power consumption, a possible defense is to randomly vary the CPU load to de-correlate the overall power consumption with information bits. In the prior literature, hardware-based techniques have been developed to randomize the power consumption and obfuscate the power signature of instructions executed in devices (moradi2015assessment, ; benini2003energy, ; guneysu2011generic, ; das2017high, ). While they are efficient in terms of the power overhead for randomization, such hardware-based techniques are typically tailored for devices with specific functions such as cryptography and not suitable for commodity processors. On the other hand, power randomization can also be achieved by software-based approaches.
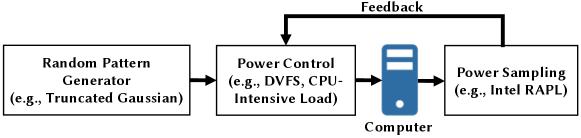
Concretely, we evaluate software-based approaches for power randomization with two different implementations — and . In , we design a program that launches CPU-intensive computations at random times to add random power consumption. In , we follow the state-of-the-art technique to randomize the overall power consumption using a feedback loop (pothukuchi2019maya, ). As illustrated in Fig. 16, samples the CPU power and uses combinations of CPU speed scaling (DVFS) and CPU-intensive computation to find-tune the power to follow the random pattern generator. The key difference between these two approaches is that mainly adds random power noise to the existing power consumption patterns, whereas randomizes the overall power by more proactively controlling the CPU.
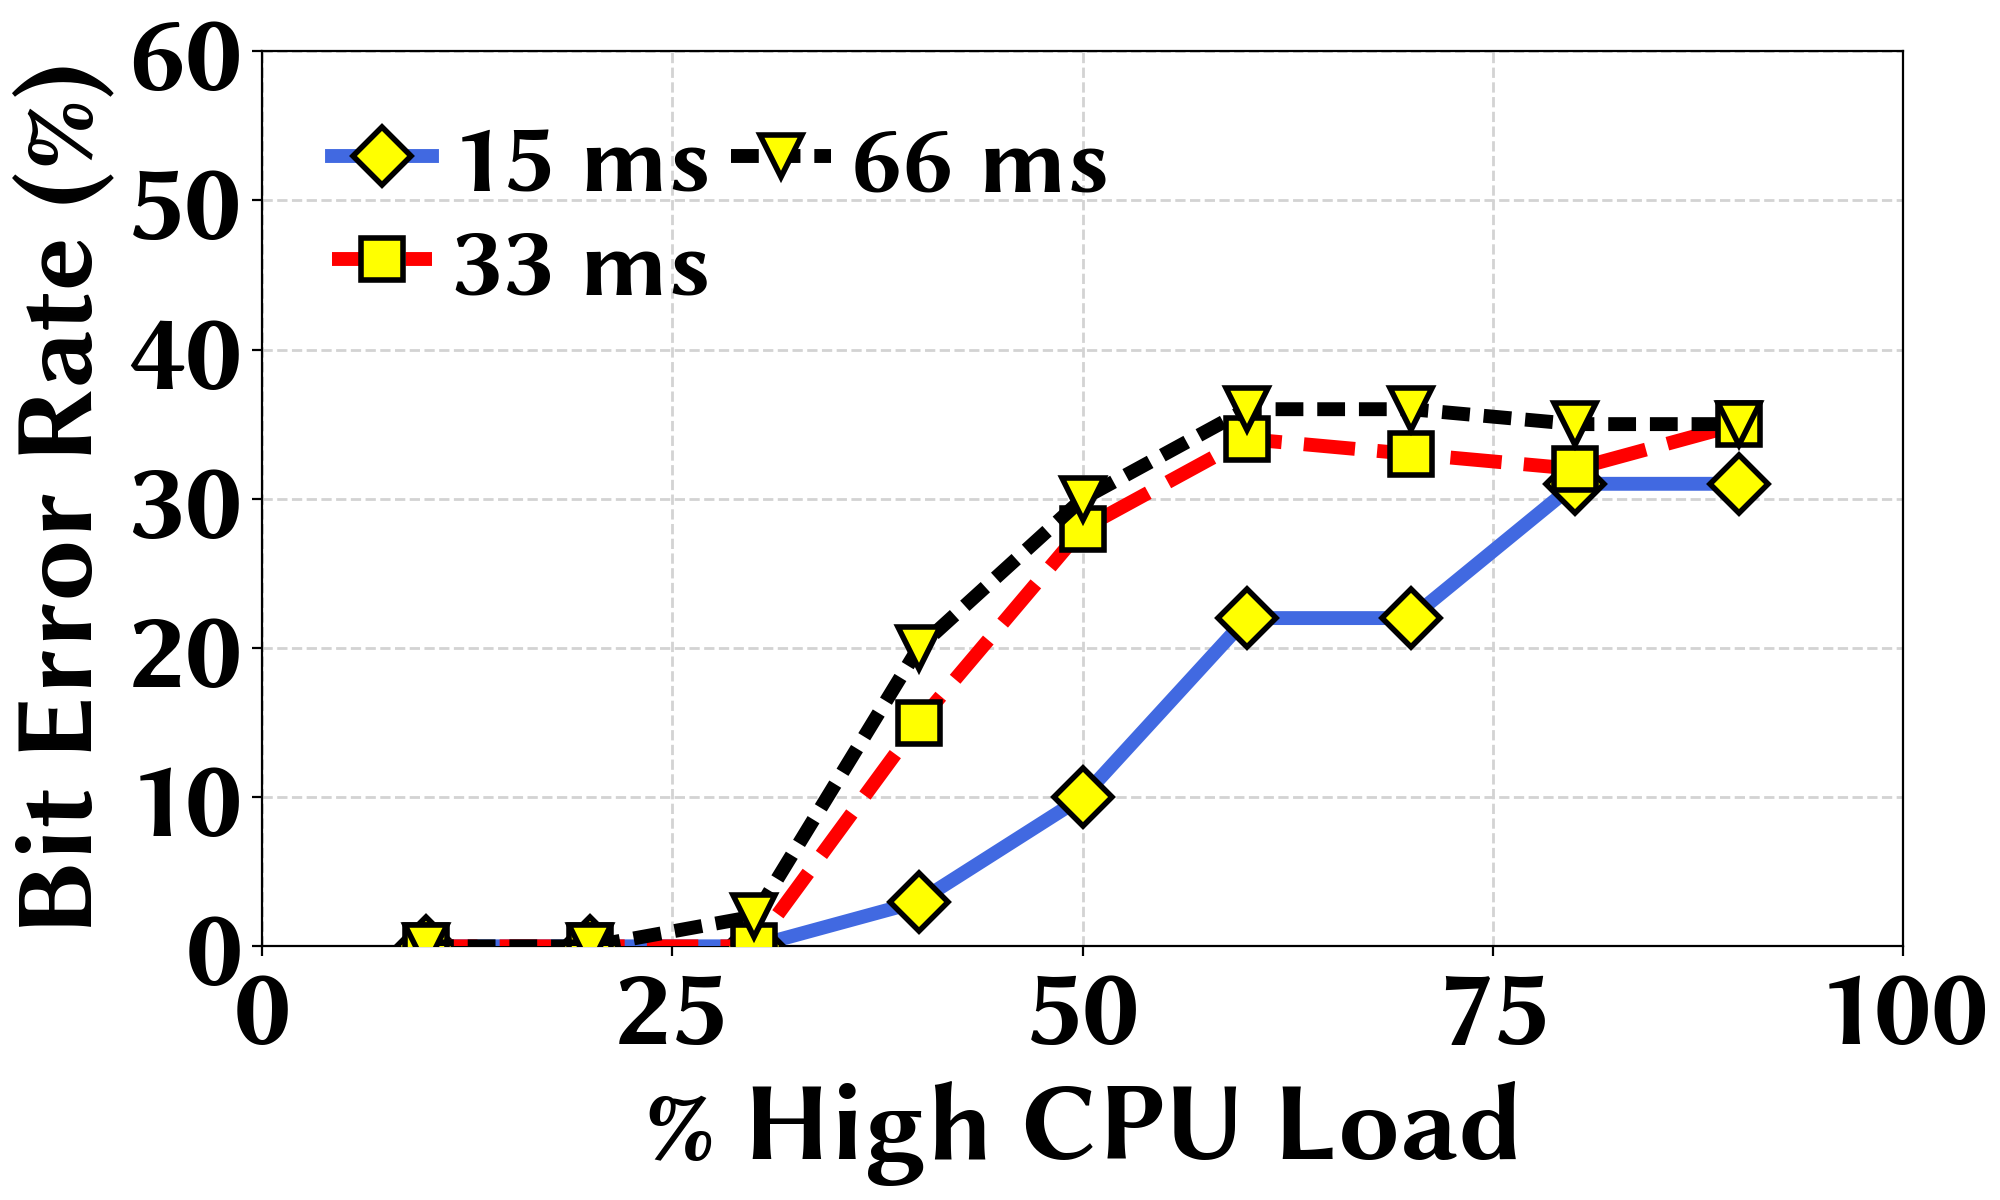
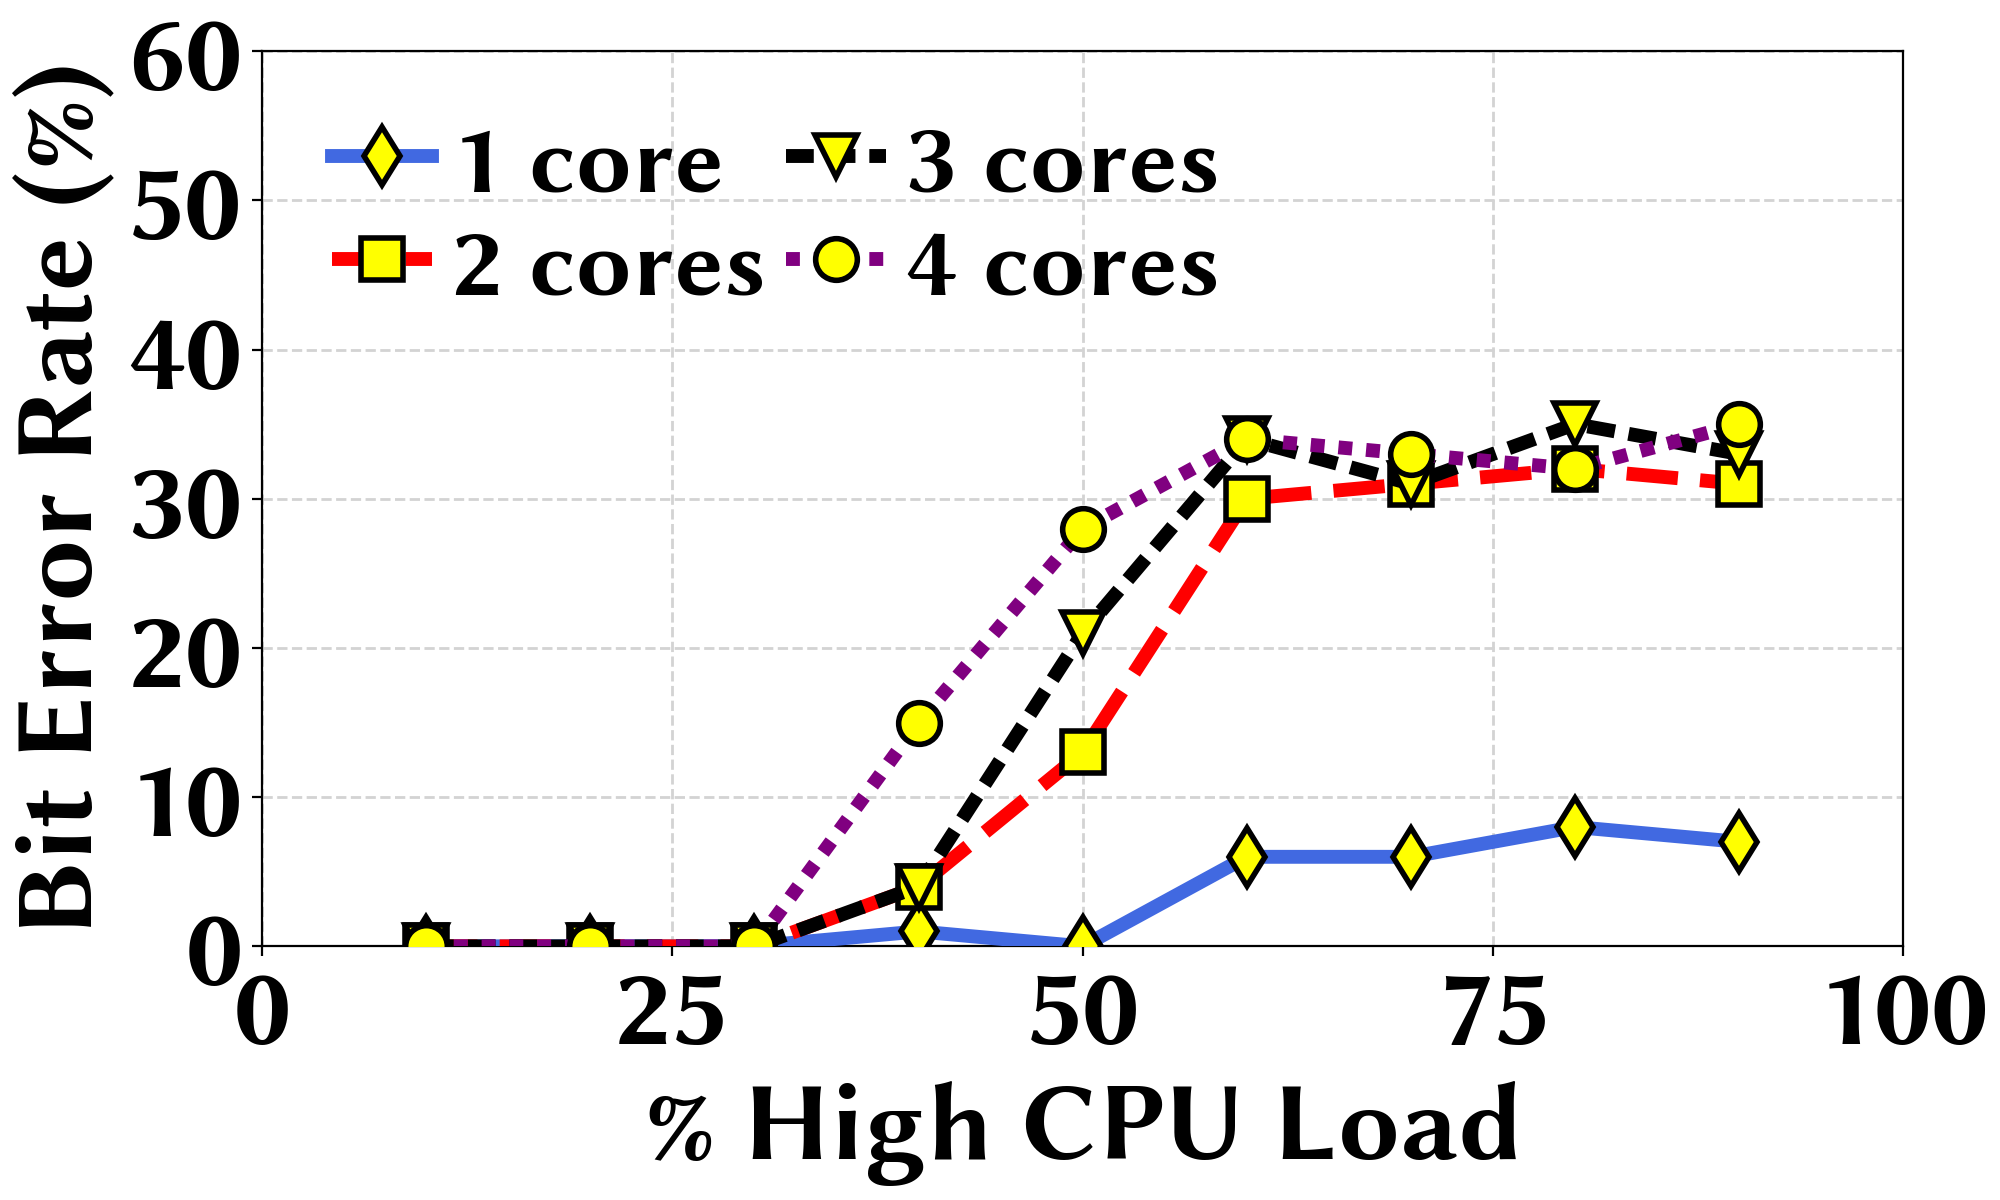
. We test ’s performance under varying settings of ’s time interval of added CPU loads, percent time of high CPU load, and the number of CPU cores used. Fig. 17(a) shows ’s bit error rates as we increase the percent time of high CPU load from 10% to 90% for three different loading intervals (15/33/66 milliseconds). We see a general trend that, regardless of the interval length, an increasing percentage of CPU high load affects more. We also see that 15 milliseconds loading interval is worse than both 33 and 66 milliseconds intervals because it does not create a sustained high CPU load. On the other hand, we see from Fig. 17(b) that loading more CPU cores by also increases ’s bit error rate.
. We implement in Ubuntu and use Intel RAPL interface for sampling the power (intel_RAPL, ; intel_power_gadget, ), cpufreq for DVFS (cpufreq, ), and repeated floating-point operations as CPU-intensive computation. While we implement on Linux, software-based power monitoring and DVFS in other systems (e.g., Windows) are also available (intel_power_gadget, ; amd_uProf, ; powercfg, ; cpufreq, ). In our experiment, the target power is determined by random numbers generated following a Gaussian distribution where we discard values smaller than 0 and greater than 1, resulting in a truncated Gaussian distribution. The values of 0 and 1 corresponding to 35W and 85W in our experiment, respectively. The mean and variance are user-set inputs to , and the resulting probability density function can be expressed as
| (2) |
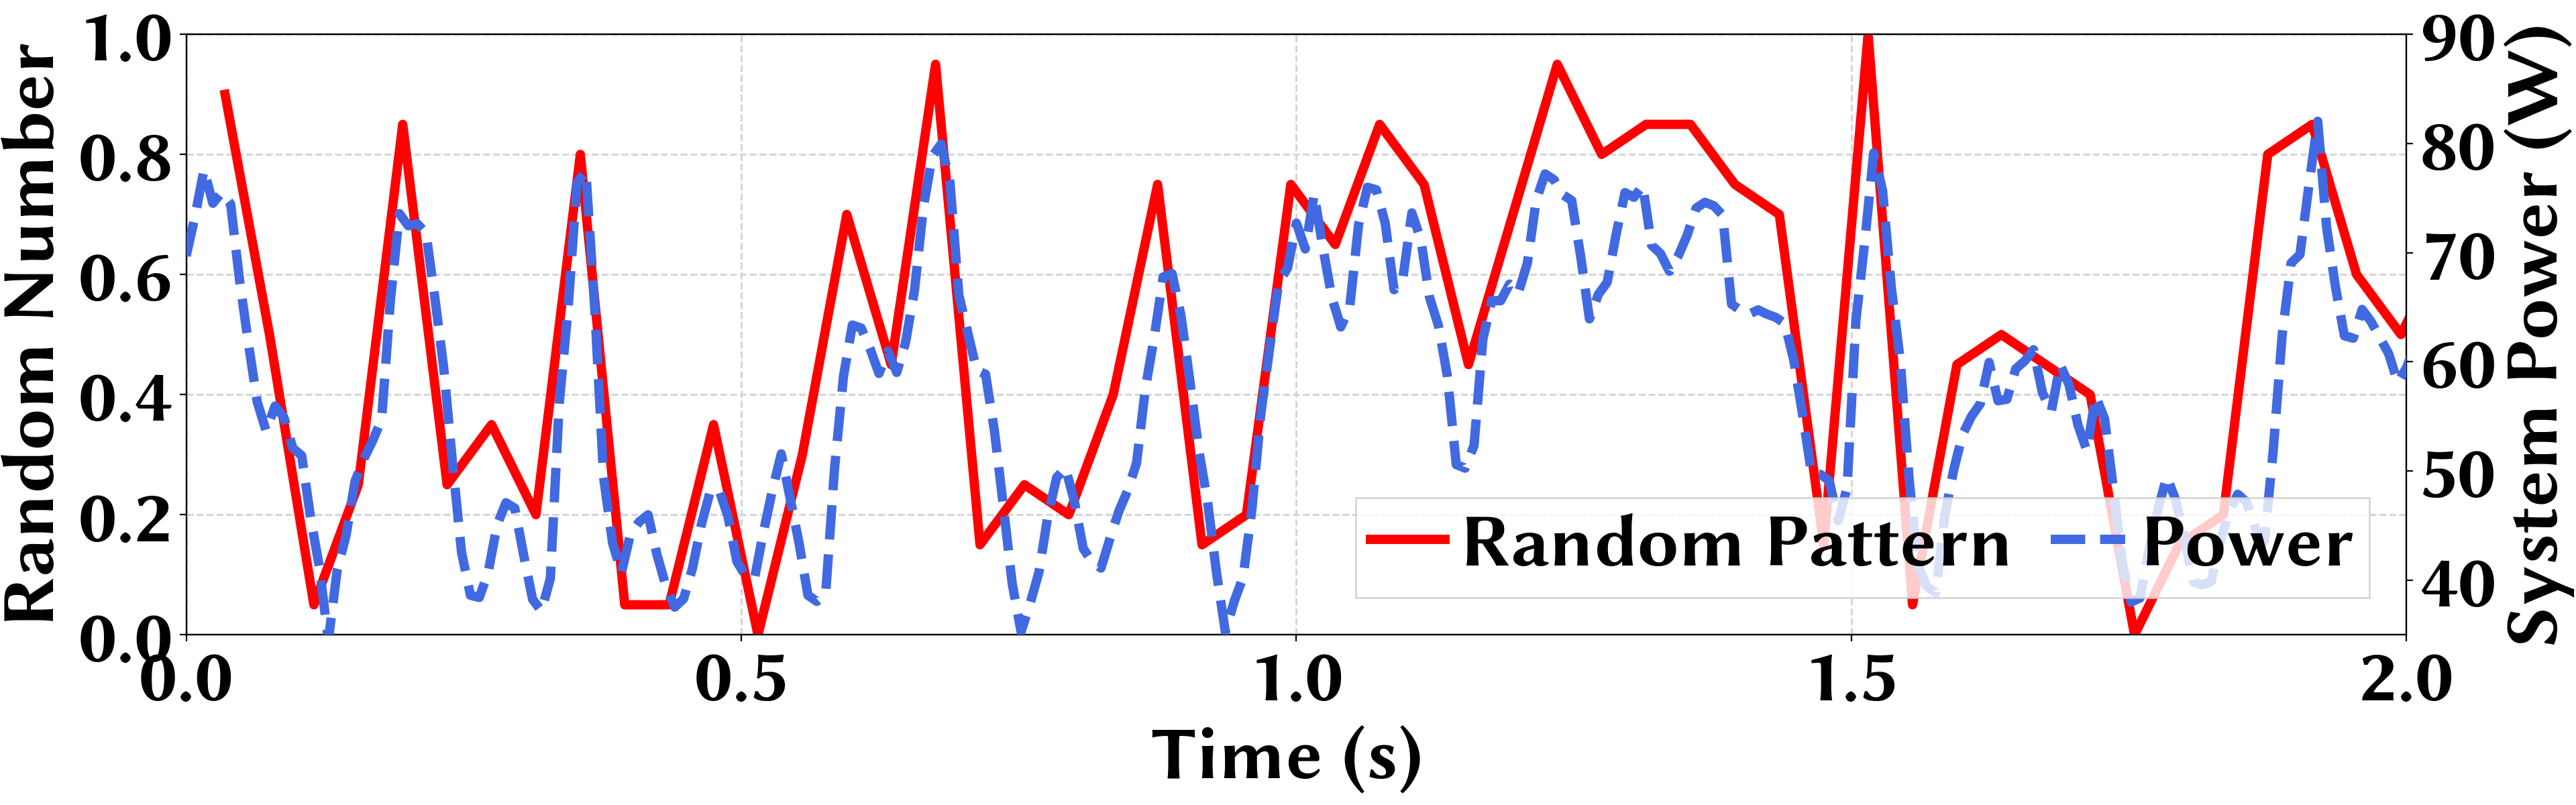
where , is the mean, and is the standard deviation of the untruncated Gaussian distribution. Based on the feedback, the CPU control block sets the appropriate CPU speed using DVFS and the amount of CPU-intensive workload to follow the randomly set power consumption target. In Fig. 18, we show a snapshot of the random number sequence and corresponding power consumption of running with a mean of 0.5 and a standard deviation of 0.5 for a truncated Gaussian distribution. We update the randomly set target power every 40 milliseconds. We see that the power consumption closely follows the supplied random number with minor deviations at times mainly due to the computer power supply’s internal controls. While we use a truncated Gaussian distribution, this approach can be adopted with other probability distributions. In our evaluation, works perfectly against , and we cannot even identify the pilot sequence to extract the transmitted bits.
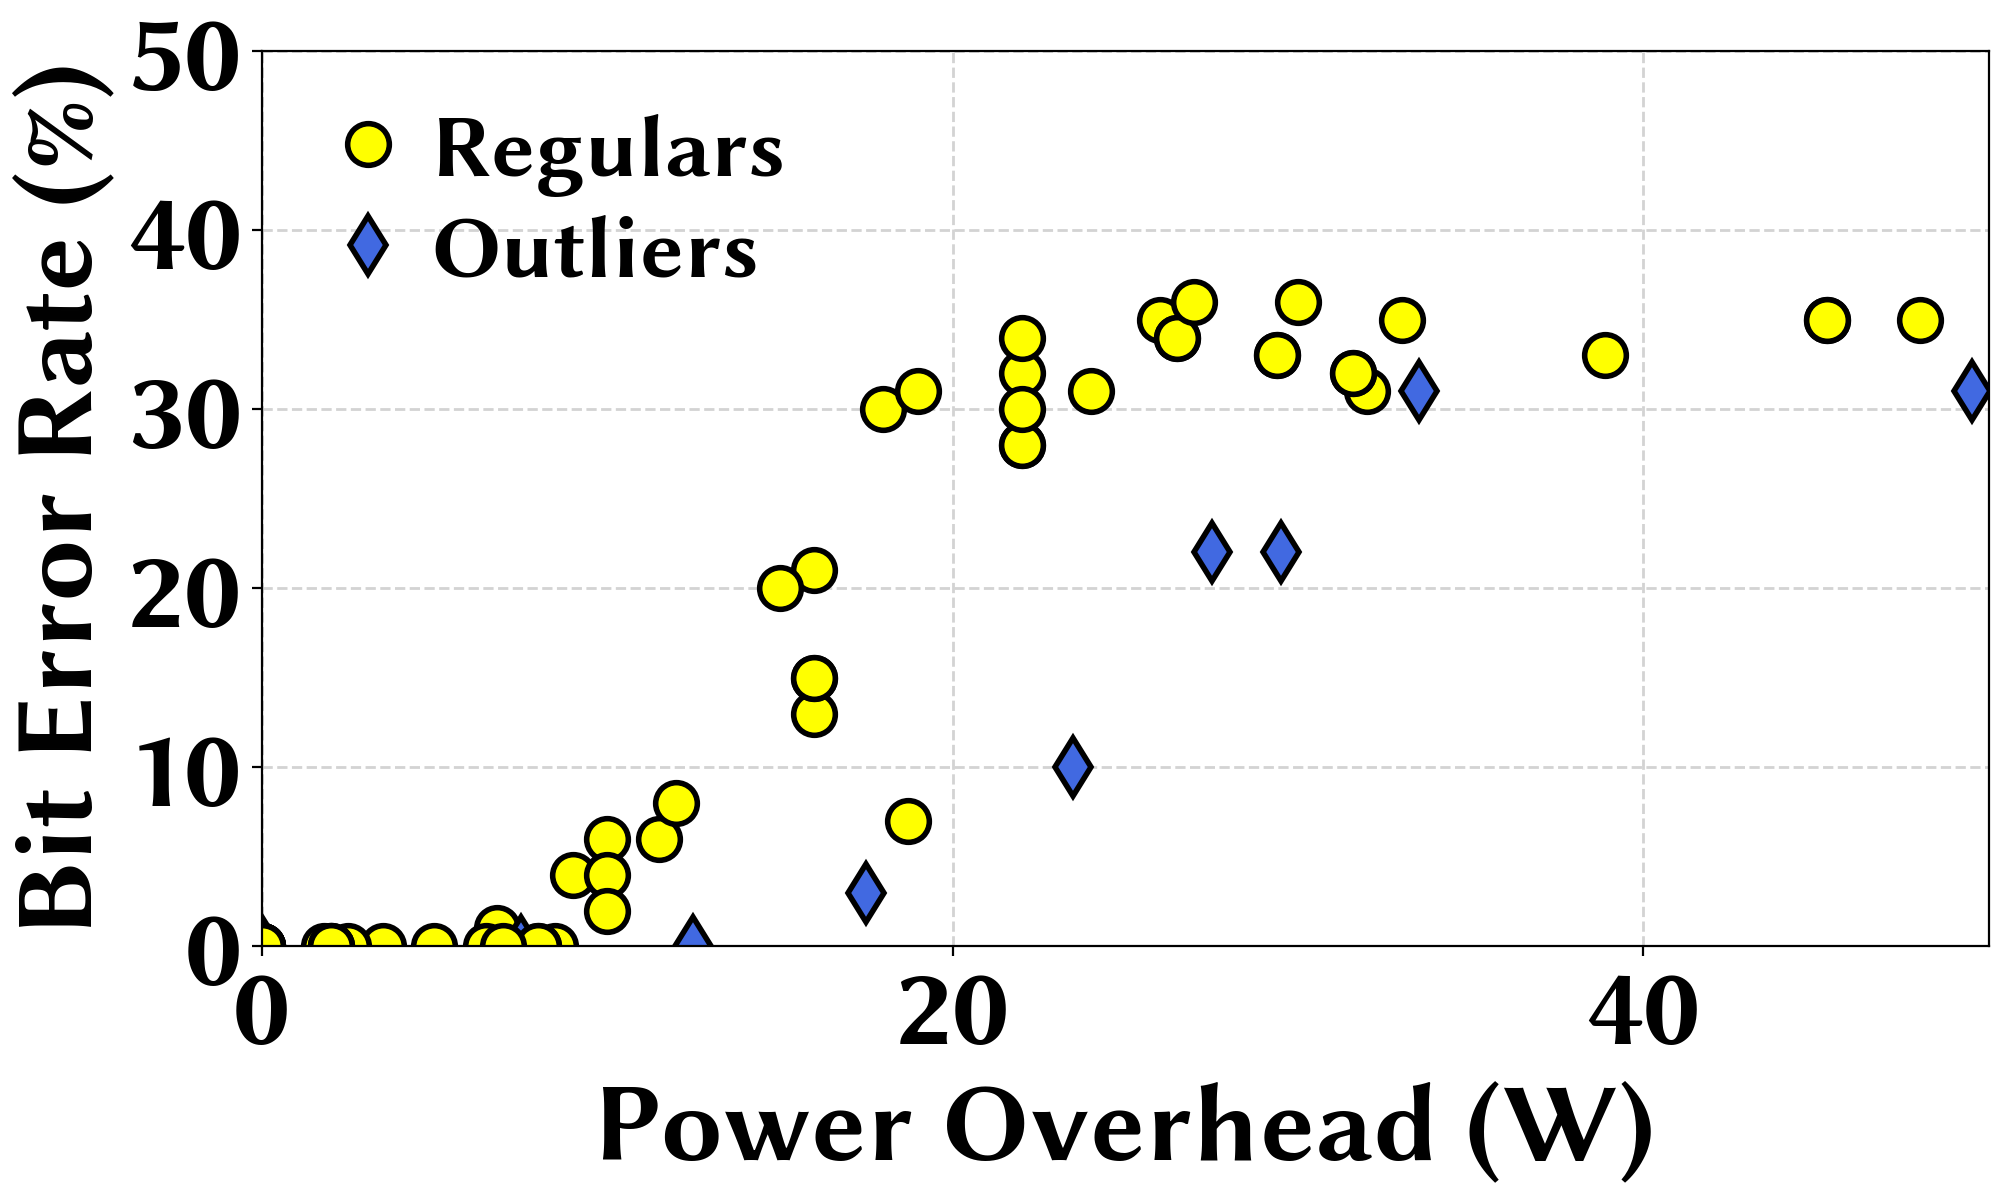
Overhead. Both and add overhead to the system to defend. Since injects random power noise, it results in additional power consumption by the computer. To have a detailed view of ’s overhead, we show the power overhead under different cases in Fig. 19(a) with the 15-millisecond results as outliers. We calculate the power overhead by running without any transmission and subtracting the idle power (28W) from the average power consumption. The key message from Fig. 19(a) is that can significantly affect ’s performance (¿ 30% bit error rate) when it injects more than 20W of random power consumption. Nonetheless, in relation to the 28W idle power of our test computer, this amounts to a 70% overhead.
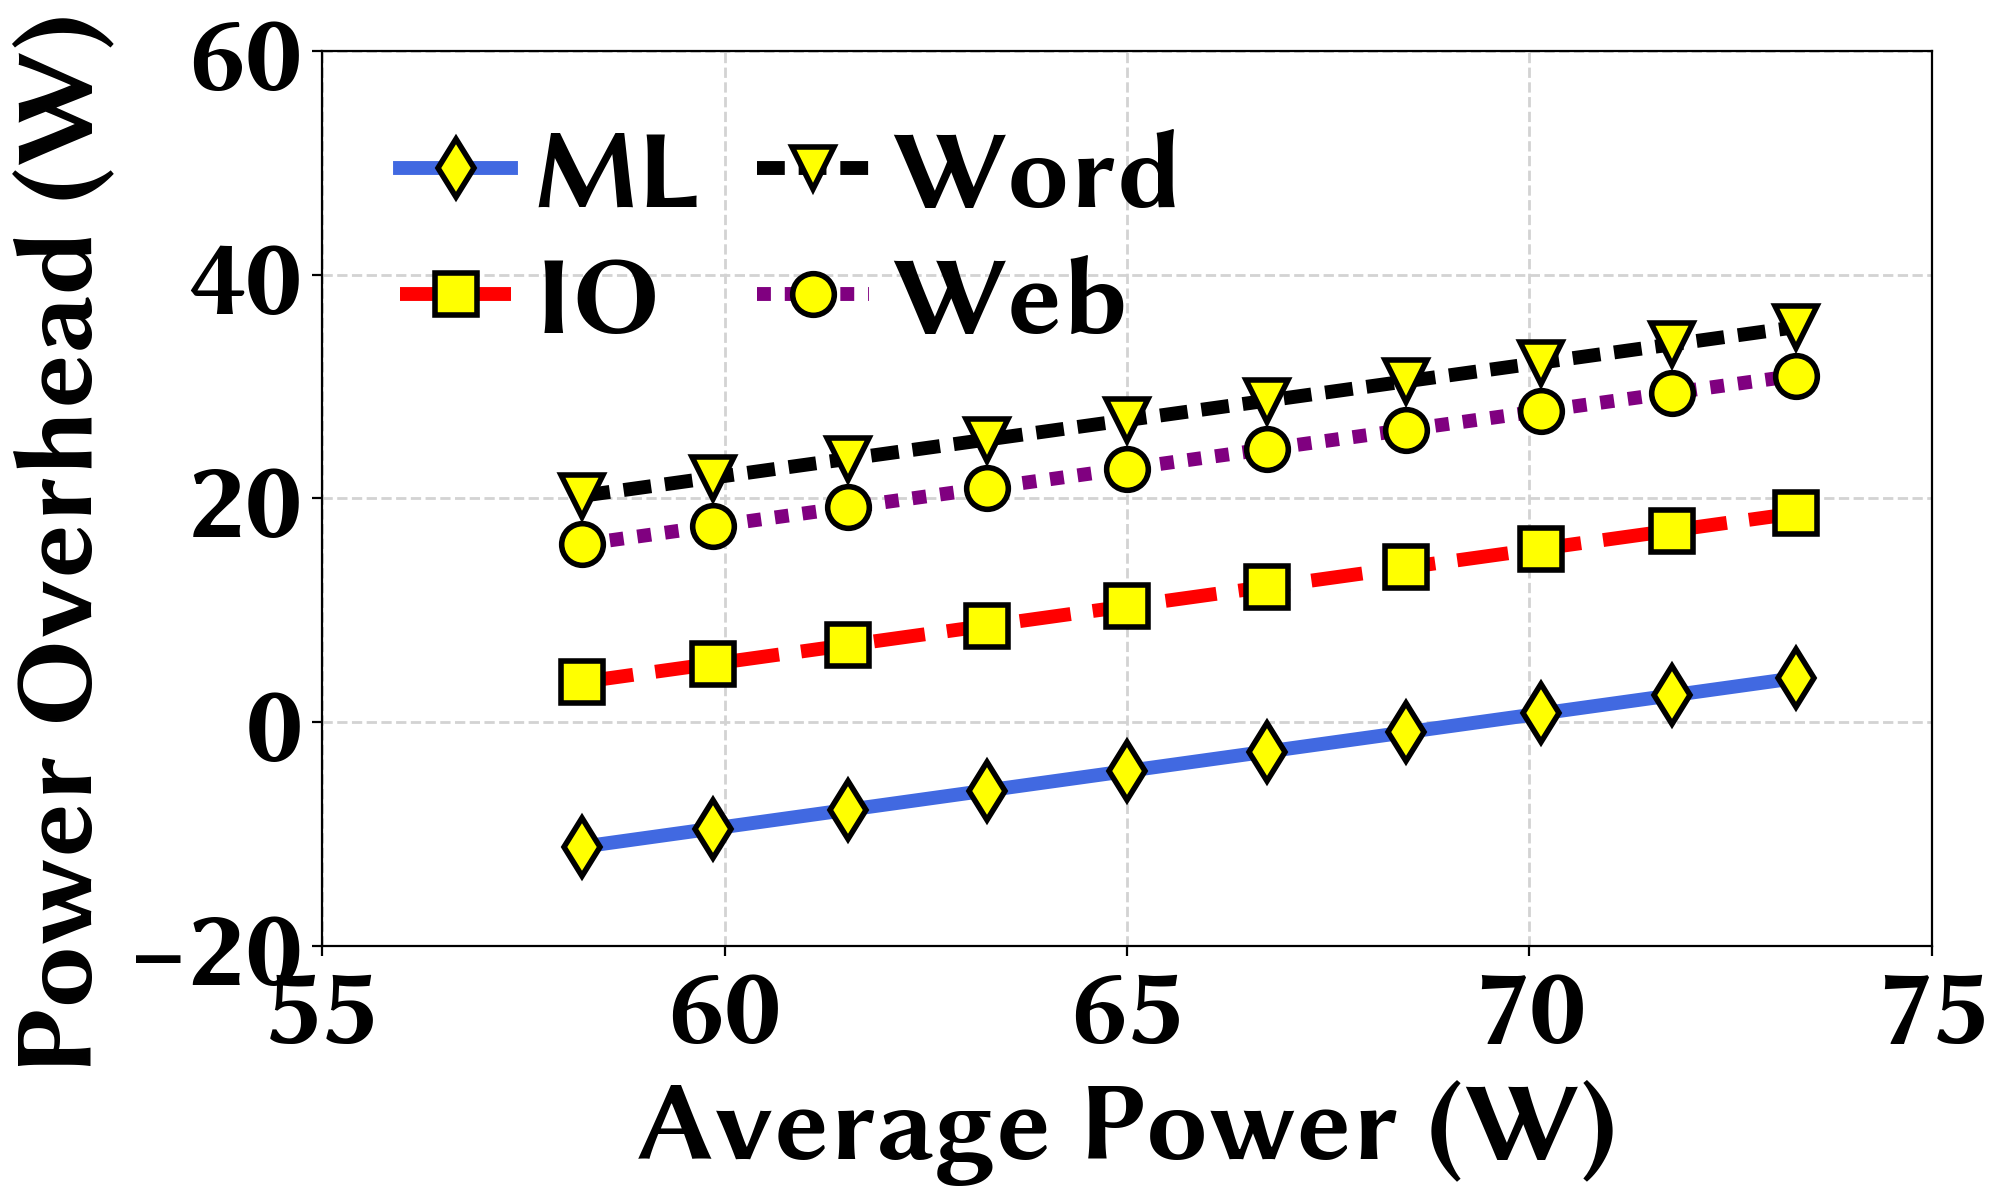
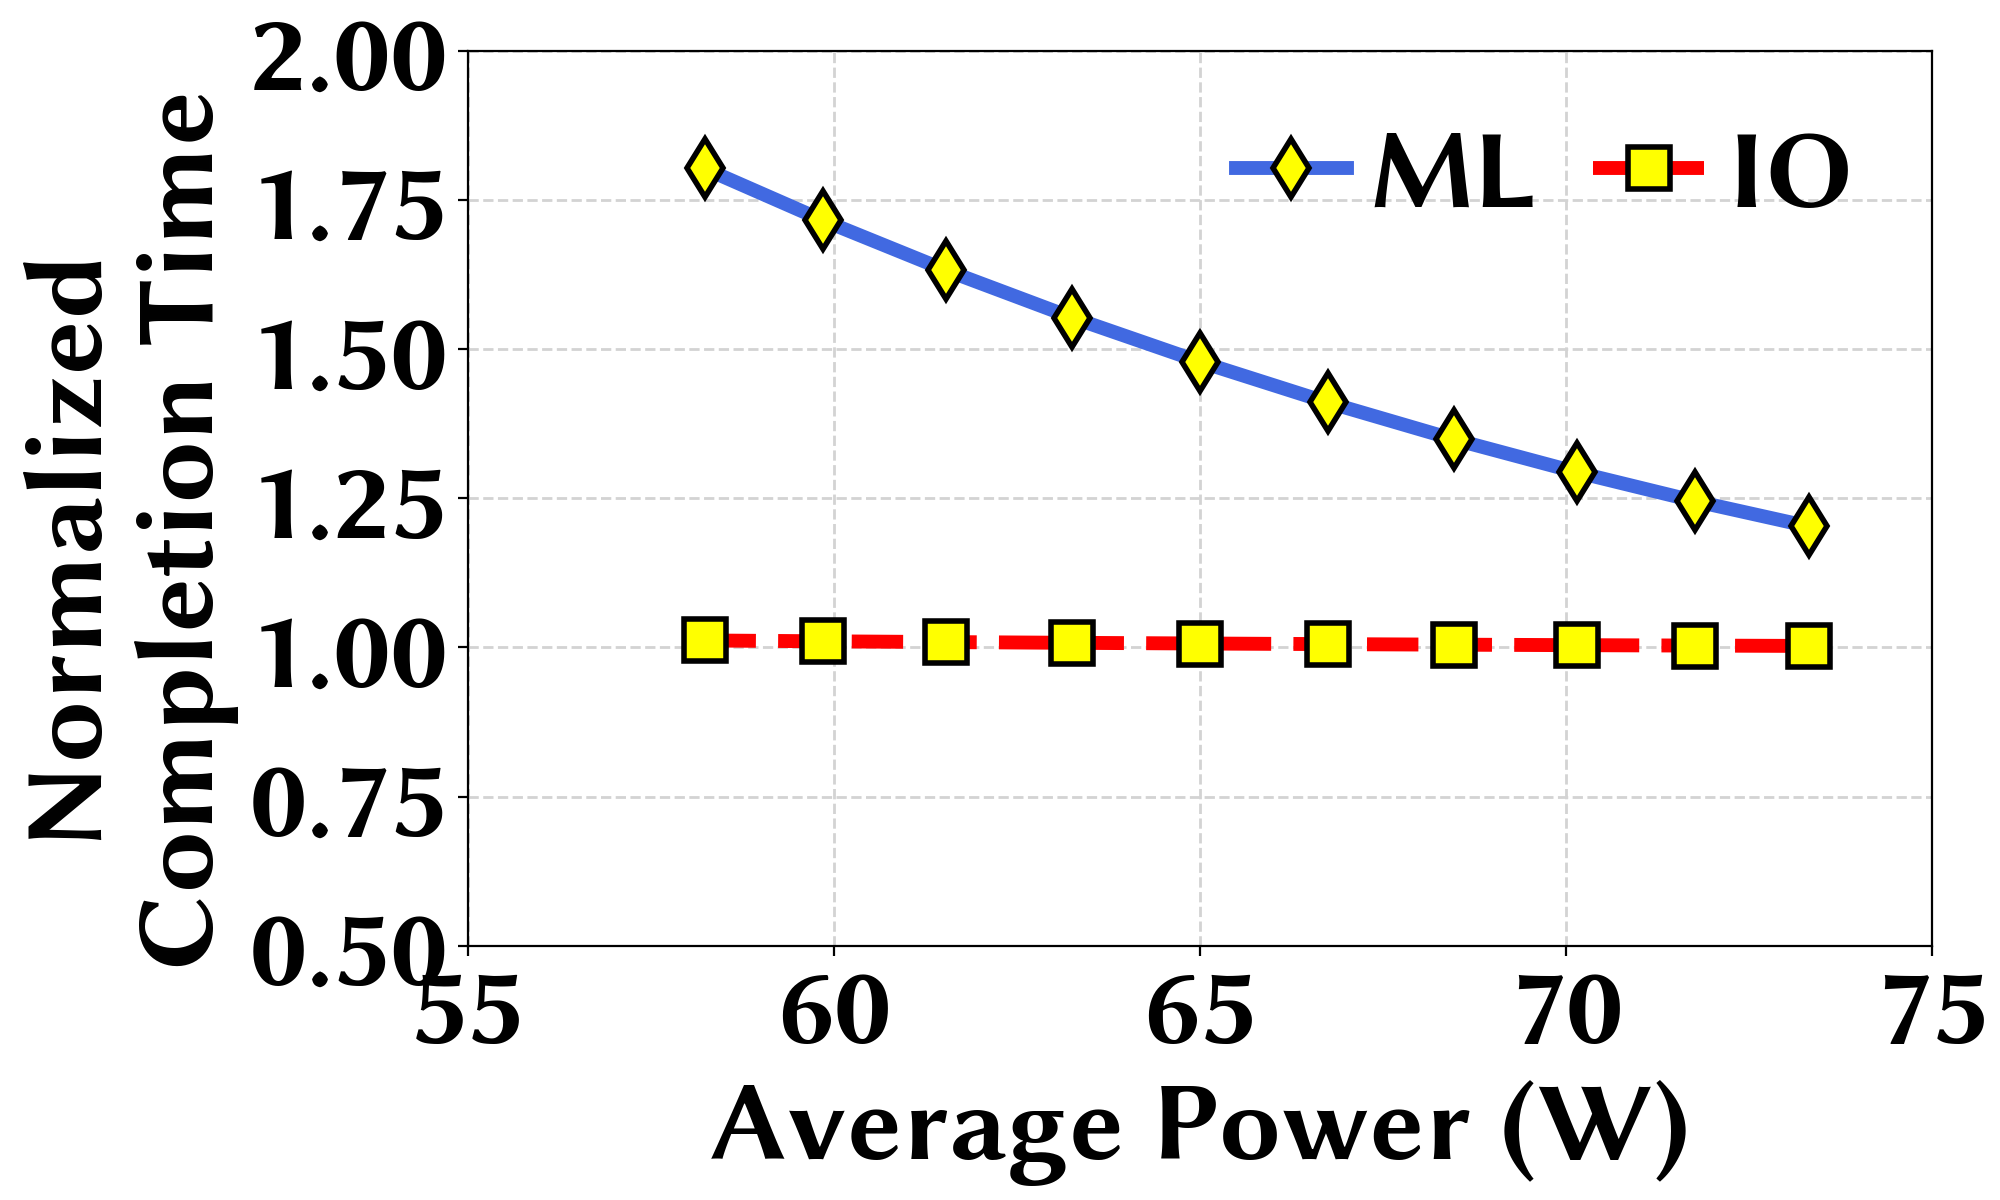
For , we have both power overhead when CPU-intensive workloads are launched to increase the overall power, and performance overhead when CPU speed is throttled to reduce the overall power. To evaluate the power and performance overheads, we run with four different applications — Machine learning training (ML), large file transfer in hard disk (IO), word processing (Word), and web browsing (Web). Figs. 19(b) and 19(c) show the change in power and performance overheads as we change the average power consumption target by changing the mean of the truncated Gaussian random distribution. We calculate the power overhead by subtracting the average power consumption without from the average power consumption with . For the performance overhead, we take the ML training and file transfer completion times with and normalize the values with respect to those without . We exclude Word and Web from the performance overhead evaluation since they do not have completion times like ML or IO applications. Note that during our experiments, we do not experience any significant perceivable impact of on the performance of word processing and web browsing.
We see that the power overheads increase with increasing average power consumption. Also, ’s power overhead with perfect defense is lower than ’s power overhead at higher bit error rates. More importantly, however, we see that different applications have different power overheads for the same average power, with ML having a negative power overhead when the average power is less than 70W. This is due to each application’s power requirement. running along an application with a low power requirement mostly adds power to follow its power target, whereas needs to apply CPU throttling more frequently to reduce power when the underlying application requires more power. This is also why ML has a negative power overhead, indicating that due to frequent throttling has reduced the average power lower than the otherwise average power requirement of ML without . From Fig. 19(c), it is also evident that frequent throttling at lower average power targets causes a higher performance overhead for the ML application. For the IO application, we do not see a significant performance variation since CPU throttling does not severely affect the file transfer speed. The key take-away from the results is that the overhead for depends on the underlying application and, for power-hungry applications, reducing the power overhead comes at the expense of performance degradation. A favorable balance between power and performance overheads can be attained through careful choice of the random number distribution parameters (e.g., mean).
vs . is more effective against than , since offers a perfect defense against and incurs a lower power overhead as well, especially for power-hungry background applications. However, incurs possible performance overheads due to the CPU throttling. It may also require additional OS privileges and/or accesses for CPU throttling and instrumentation for power sampling.
In addition to the aforementioned pro-active countermeasures, a reactive defense approach would be to identify and remove data exfiltration malware by monitoring application behavior or computer CPU utilization. However, the constant emergence of new malware remains as, and will continue being, one of the greatest threats faced by computers (Security_Malware_ThreatReport_McAfee_March_2018, ; Security_Threat_Survey_SANS_2017, ; Security_Malware_Forecast_SophosLabs_2018, ; Security_MalwareTrends_GDataSecurityBlog_2017, ). On the other hand, utilizing the knowledge of for data exfiltration, one can design a power network voltage monitoring system that continuously scans through the voltage signals for suspicious switching noise spike patterns in the high frequency. A potential drawback of this approach is the computational burden to continuously monitor a large frequency spectrum since PFC-induced switching noise is generated by every computer power supply unit.
In summary, we see that different countermeasures against have their own merits and hurdles. Based on our study, as a hardware-based defense, we recommend the installation of power noise filters because of its attenuation on PFC-induced switching noises. As for the software-based technique, we recommend power randomization due to its effectiveness.
8. Related Work
There have been a plethora of studies on data exfiltration under a threat model where an adversary tries to extract information from a tightly secured computer system without using traditional data transfer protocols (e.g., network). The key idea is to encode information in physical attributes (e.g., the heat generated by a computer (Security_AirGap_Thermal_BitWhisper_CSF_2015_Guri:2015:BCS:2859845.2859982, )) to carry it to an external receiver (e.g., temperature sensor). Meanwhile, decoding changes of these physical attributes does not require any cyber access to the target system, thus bypasses the system’s defense and forms covert channels for stealing information. Alternatively, a secure system may spill its secrets by inadvertently influencing an externally visible physical property (i.e., a side channel) (genkin2014rsa, ; genkin2015stealing, ; Genkin:2016:EKE:2976749.2978353, ).
Table 3 summarizes the physical medium, key design attributes, transmission rates, and effective distances of the recently proposed data exfiltration attacks. Compared to the existing research, achieves a reasonably high bit rate of 28.48 bits/s. Most acoustic covert/side channels cannot achieve a transfer rate higher than , except for (Security_AirGap_Acoustic_Ultrasound_FPS_Canada_2014, ) (140 bits/s) which requires the target to be equipped with a speaker and the receiver be in the same room as the target computer. (Security_AirGap_Acoustic_Ultrasound_FPS_Canada_2014, ) can reach up to 67,000 bits/s only in the audible range (20Hz20kHz) at the expense of high detection possibility. On the other hand, both electromagnetic emanation and magnetic covert/side channel can achieve similar transfer rates as but have much shorter effective distances. (Security_AirGap_EMI_GSMem_Security_2015, ) can reach a commendable speed of 1000 bits/s but requires professional-grade receiver hardware with a high sophistication.
Among all, optical covert channels attain the best transmission rates because of the extremely fast response time of LEDs. But, they require the receiver to be in the line of sight of the transmitter (e.g., be in the same room). Also, because of the high bit rates, photodiodes need to be used as the receiver, further restricting the effective distance even within the line of sight. In contrast, can have the transmitter and receiver in two different rooms that are 27.4 meters away from each other without line of sight.
Another important aspect of is that unlike other studies which cannot achieve both their highest bit rate and longest distance for the same settings (i.e., increasing distance decreases bit rate), works at the 27.4 meters distance without compromising its rate of 28.48 bits/s at 0% bit error. While Table 3 is not an exhaustive list, it provides important insights into the potential and limitation of various physical covert/side channels-based data exfiltration attacks.
9. Concluding Remarks
In this paper, we studied data exfiltration from a desktop computer in an enterprise environment, and proposed to achieve stealthy information transfer over a building’s power network without using any PLC adapters. exploits high-frequency switching noises caused by the PFC circuits built into all of today’s computers and achieves an effective rate of 28.48 bits/second with a distance of 90 feet (27.4 meters) without line of sight. We validated ’s data exfiltration capability under different settings and hardware configurations. We also showed that certain configurations such as CPU speed scaling may reduce ’s data exfiltration rates. In addition, we offered some insights into the limitations and open issues of our proposed system. Finally, we outlined a few possible defenses and suggested both hardware-based and software-based techniques.
References
- [1] Ross Anderson and Markus G. Kuhn. Soft tempest - an opportunity for nato, 1999.
- [2] Ben Hunter. L0rdix: Multipurpose attack tool, https://blog.ensilo.com/l0rdix-attack-tool.
- [3] Luca Benini, Elvira Omerbegovic, A Macii, Massimo Poncino, E Macii, and Fabrizio Pro. Energy-aware design techniques for differential power analysis protection. In Proceedings 2003. Design Automation Conference (IEEE Cat. No. 03CH37451), pages 36–41. IEEE, 2003.
- [4] Ralf Benzmuller. Malware trends. G Data Security Blog, 2017 (https://www.gdatasoftware.com/blog/2017/04/29666-malware-trends-2017).
- [5] Dominik Brodowski. Cpu frequency and voltage scaling code in the linux(tm) kernel, https://www.kernel.org/doc/Documentation/cpu-freq/user-guide.txt.
- [6] Giovanni Camurati, Sebastian Poeplau, Marius Muench, Tom Hayes, and Aurélien Francillon. Screaming channels: When electromagnetic side channels meet radio transceivers. In CCS, 2018.
- [7] Cristina Cano, Alberto Pittolo, David Malone, Lutz Lampe, Andrea M. Tonello, and Anand G. Dabak. State of the art in power line communications: From the applications to the medium. IEEE J. Sel. A. Commun., 34(7):1935–1952, July 2016.
- [8] Brent Carrara and Carlisle Adams. On acoustic covert channels between air-gapped systems. In Foundations and Practice of Security, 2014.
- [9] Hardware Dev Center. Powercfg command-line options, https://docs.microsoft.com/en-us/windows-hardware/design/device-experiences/powercfg-command-line-options.
- [10] AMD Developer Central. AMD uProf, https://developer.amd.com/amd-uprof/.
- [11] Swarup Chandra, Zhiqiang Lin, Ashish Kundu, and Latifur Khan. Towards a systematic study of the covert channel attacks in smartphones. In SecureComm, 2014.
- [12] Long Cheng, Fang Liu, and Danfeng Yao. Enterprise data breach: Causes, challenges, prevention, and future directions. Wiley Interdisciplinary Reviews: Data Mining and Knowledge Discovery, 7(5), 2017.
- [13] Shane S Clark, Hossen Mustafa, Benjamin Ransford, Jacob Sorber, Kevin Fu, and Wenyuan Xu. Current events: Identifying webpages by tapping the electrical outlet. In ESORICS, 2013.
- [14] Shane S Clark, Benjamin Ransford, Amir Rahmati, Shane Guineau, Jacob Sorber, Wenyuan Xu, Kevin Fu, A Rahmati, M Salajegheh, D Holcomb, et al. Wattsupdoc: Power side channels to nonintrusively discover untargeted malware on embedded medical devices. In HealthTech, 2013.
- [15] Gabe Cohn, Daniel Morris, Shwetak N. Patel, and Desney S. Tan. Your noise is my command: Sensing gestures using the body as an antenna. In CHI, 2011.
- [16] Debayan Das, Shovan Maity, Saad Bin Nasir, Santosh Ghosh, Arijit Raychowdhury, and Shreyas Sen. High efficiency power side-channel attack immunity using noise injection in attenuated signature domain. In 2017 IEEE International Symposium on Hardware Oriented Security and Trust (HOST), pages 62–67. IEEE, 2017.
- [17] Electronic Code of U.S. Federal Regulations. Unintentional radiators, section 15.107 — conducted limits, 2018.
- [18] Energy Star. Computers specification version 7.0, 2018, https://www.energystar.gov/products/spec/computers_specification_version_7_0_pd.
- [19] Miro Enev, Sidhant Gupta, Tadayoshi Kohno, and Shwetak N. Patel. Televisions, video privacy, and powerline electromagnetic interference. In CCS, 2011.
- [20] Miro Enev, Sidhant Gupta, Tadayoshi Kohno, and Shwetak N. Patel. Televisions, video privacy, and powerline electromagnetic interference. In CCS, 2011.
- [21] Benyamin Farshteindiker, Nir Hasidim, Asaf Grosz, and Yossi Oren. How to phone home with someone else’s phone: Information exfiltration using intentional sound noise on gyroscopic sensors. In WOOT, Berkeley, CA, USA, 2016.
- [22] Daniel Genkin, Lev Pachmanov, Itamar Pipman, and Eran Tromer. Stealing keys from pcs using a radio: Cheap electromagnetic attacks on windowed exponentiation. In CHES, 2015.
- [23] Daniel Genkin, Lev Pachmanov, Itamar Pipman, Eran Tromer, and Yuval Yarom. Ecdsa key extraction from mobile devices via nonintrusive physical side channels. In CCS. ACM, 2016.
- [24] Daniel Genkin, Adi Shamir, and Eran Tromer. Rsa key extraction via low-bandwidth acoustic cryptanalysis. In Crypto, 2014.
- [25] Andrea Goldsmith. Wireless Communications. Cambridge University Press, 2005.
- [26] Cassi Goodman. An introduction to tempest, 2001,https://www.sans.org/reading-room/whitepapers/privacy/paper/981.
- [27] Tim Güneysu and Amir Moradi. Generic side-channel countermeasures for reconfigurable devices. In International Workshop on Cryptographic Hardware and Embedded Systems, pages 33–48. Springer, 2011.
- [28] Mordechai Guri and Yuval Elovici. Bridgeware: The air-gap malware. Commun. ACM, 61(4):74–82, March 2018.
- [29] Mordechai Guri, Assaf Kachlon, Ofer Hasson, Gabi Kedma, Yisroel Mirsky, and Yuval Elovici. Gsmem: Data exfiltration from air-gapped computers over GSM frequencies. In USENIX Security, 2015.
- [30] Mordechai Guri, Matan Monitz, and Yuval Elovici. Bridging the air gap between isolated networks and mobile phones in a practical cyber-attack. ACM Trans. Intell. Syst. Technol., 8(4):50:1–50:25, May 2017.
- [31] Mordechai Guri, Matan Monitz, Yisroel Mirski, and Yuval Elovici. BitWhisper: Covert signaling channel between air-gapped computers using thermal manipulations. In CSF, 2015.
- [32] Mordechai Guri, Yosef Solewicz, Andrey Daidakulov, and Yuval Elovici. Acoustic data exfiltration from speakerless air-gapped computers via covert hard-drive noise (‘diskfiltration’). In ESORICS, 2017.
- [33] Mordechai Guri, Yosef Solewicz, Andrey Daidakulov, and Yuval Elovici. MOSQUITO: Covert ultrasonic transmissions between two air-gapped computers using speaker-to-speaker communication. https://arxiv.org/abs/1803.03422, 2018.
- [34] Mordechai Guri, Yosef A. Solewicz, Andrey Daidakulov, and Yuval Elovici. Fansmitter: Acoustic data exfiltration from (speakerless) air-gapped computers. http://arxiv.org/abs/1606.05915, 2016.
- [35] Mordechai Guri, Boris Zadov, Dima Bykhovsky, and Yuval Elovici. PowerHammer: Exfiltrating data from air-gapped computers through power lines. https://arxiv.org/abs/1804.04014, 2018.
- [36] Mordechai Guri, Boris Zadov, Andrey Daidakulov, and Yuval Elovici. ODINI: Escaping sensitive data from faraday-caged, air-gapped computers via magnetic fields. https://arxiv.org/abs/1802.02700, 2018.
- [37] Mordechai Guri, Boris Zadov, and Yuval Elovici. LED-it-GO: Leaking (a lot of) data from air-gapped computers via the (small) hard drive led. In DIMVA, 2017.
- [38] Michael Hanspach and Michael Goetz. On covert acoustical mesh networks in air. Journal of Communications, 8(11):758–767, November 2013.
- [39] Timothy Hegarty. An overview of radiated EMI specifications for power supplies. Texas Instruments Whitepaper, June 2018.
- [40] Arik Hesseldahl. The tempest surrounding tempest, 2000,https://www.forbes.com/2000/08/10/mu9.html#725665731004.
- [41] Harold Joseph Highland. Random bits & bytes: Electromagnetic radiation revisited. Computers and Security, 1986.
- [42] IDC. PC market (2nd quarter of 2018), https://www.idc.com/getdoc.jsp?containerId=prUS44118818.
- [43] IECEE. IEC 61000-3-2:2018: Electromagnetic compatibility (EMC) - part 3-2, https://www.youtube.com/watch?v=F8nL2gRYTc0&t=3s.
- [44] Mohammad A. Islam and Shaolei Ren. Ohm’s law in data centers: A voltage side channel for timing power attacks. In CCS, 2018.
- [45] Kaspersky Lab. Shadowpad: How attackers hide backdoor in software used by hundreds of large companies around the world. Corporate News, August 2017.
- [46] Kevin Jones. Take a look at l0rdix, the super malware toolkit of 2018, https://hackercombat.com/take-a-look-at-l0rdix-the-super-malware-toolkit-of-2018.
- [47] Patrick Konsor. Intel power gadget, https://software.intel.com/en-us/articles/intel-power-gadget.
- [48] Markus G Kuhn and Ross J Anderson. Soft tempest: Hidden data transmission using electromagnetic emanations. In International Workshop on Information Hiding, pages 124–142. Springer, 1998.
- [49] David Kushner. The real story of stuxnet, https://spectrum.ieee.org/telecom/security/the-real-story-of-stuxnet.
- [50] Butler W. Lampson. A note on the confinement problem. Commun. ACM, 16(10):613–615, October 1973.
- [51] Ralph Langner. Stuxnet: Dissecting a cyberwarfare weapon. IEEE Security & Privacy, 9(3):49–51, 2011.
- [52] Yann LeCun, Léon Bottou, Yoshua Bengio, Patrick Haffner, et al. Gradient-based learning applied to document recognition. Proceedings of the IEEE, 86(11):2278–2324, 1998.
- [53] Pavel Lifshits, Roni Forte, Yedid Hoshen, Matt Halpern, Manuel Philipose, Mohit Tiwari, and Mark Silberstein. Power to peep-all: Inference attacks by malicious batteries on mobile devices. In Privacy Enhancing Technologies, 2018.
- [54] Yannan Liu, Lingxiao Wei, Zhe Zhou, Kehuan Zhang, Wenyuan Xu, and Qiang Xu. On code execution tracking via power side-channel. In CCS, 2016.
- [55] Joe Loughry and David A. Umphress. Information leakage from optical emanations. ACM Trans. Inf. Syst. Secur., 5(3):262–289, August 2002.
- [56] Stefan Mangard, Elisabeth Oswald, and Thomas Popp. Power analysis attacks: Revealing the secrets of smart cards, volume 31. Springer Science & Business Media, 2008.
- [57] Claudio Marforio, Hubert Ritzdorf, Aurélien Francillon, and Srdjan Capkun. Analysis of the communication between colluding applications on modern smartphones. In ACSAC, 2012.
- [58] Nikolay Matyunin, Jakub Szefer, Sebastian Biedermann, and Stefan Katzenbeisser. Covert channels using mobile device’s magnetic field sensors. In ASP-DAC, 2016.
- [59] McAfee Labs. Threats report, March 2018.
- [60] David Meisner and Thomas F. Wenisch. Peak power modeling for data center servers with switched-mode power supplies. In ISLPED, 2010.
- [61] Amir Moradi and Alexander Wild. Assessment of hiding the higher-order leakages in hardware. In International Workshop on Cryptographic Hardware and Embedded Systems, pages 453–474. Springer, 2015.
- [62] Official Video on YouTube. See you again, https://www.youtube.com/watch?v=RgKAFK5djSk.
- [63] On Semiconductor. New evidence of hacked supermicro hardware found in u.s. telecom, https://www.bloomberg.com/news/articles/2018-10-09/new-evidence-of-hacked-supermicro-hardware-found-in-u-s-telecom.
- [64] On Semiconductor. Power factor correction (PFC) handbook, http://www.onsemi.com/pub/Collateral/HBD853-D.PDF.
- [65] Srinivas Pandruvada. Running average power limit, https://01.org/blogs/2014/running-average-power-limit-%E2%80%93-rapl.
- [66] J. Park, X. Xu, Y. Jin, D. Forte, and M. Tehranipoor. Power-based side-channel instruction-level disassembler. In DAC, 2018.
- [67] Raghavendra Pradyumna Pothukuchi, Sweta Yamini Pothukuchi, Petros Voulgaris, and Josep Torrellas. Maya: Falsifying power sidechannels with operating system support. arXiv preprint arXiv:1907.09440, 2019.
- [68] David E. Sanger and Thom Shanker. NSA devises radio pathway into computers. In The New York Times, Jan. 14, 2014.
- [69] SANS Institute. Covert channels. InfoSec Reading Room, 2010.
- [70] SANS Institute. Threat landscape survey: Users on the front line. InfoSec Reading Room, 2017.
- [71] Security Stronghold. How to remove senna spy ftp trojan, https://www.securitystronghold.com/gates/senna-spy-ftp-trojan.html.
- [72] SophosLabs. Malware forecast. Sophos White Paper, 2018.
- [73] Riccardo Spolaor, Laila Abudahi, Veelasha Moonsamy, Mauro Conti, and Radha Poovendran. No free charge theorem: A covert channel via usb charging cable on mobile devices. In ACNS, 2017.
- [74] STMicroelectronics. Circuits for power factor correction with regards to mains filtering, http://www.onsemi.com/pub/Collateral/HBD853-D.PDF.
- [75] Symantec. Sennaspy generator, https://www.symantec.com/security-center/writeup/2001-062211-2540-99.
- [76] Mohammad Tehranipoor and Farinaz Koushanfar. A survey of hardware trojan taxonomy and detection. IEEE Design & Test, 27(1):10–25, January 2010.
- [77] Wikipedia. Data theft, https://en.wikipedia.org/wiki/Data_theft.
- [78] X10 Home Gadgets. Xppf plug in noise filter, https://www.x10.com/xppf-plug-in-filter.html.
- [79] Qing Yang, Paolo Gasti, Gang Zhou, Aydin Farajidavar, and Kiran S. Balagani. On inferring browsing activity on smartphones via USB power analysis side-channel. IEEE Transactions on Information Forensics and Security, 12(5):1056–1066, May 2017.
- [80] Jindong Zhang, Jianwen Shao, Peng Xu, Fred C. Lee, and Milan M. Jovanovic. Evaluation of input current in the critical mode boost pfc converter for distributed power systems. In IEEE Applied Power Electronics Conference and Exposition, 2001.
- [81] Wanfeng Zhang, Guang Feng, Yan-Fei Liu, and Bin Wu. A digital power factor correction (pfc) control strategy optimized for dsp. IEEE Transactions on Power Electronics, 19(6):1474–1485, 2004.
Appendix
Appendix A Related Notions
Power spectrum/ frequency spectrum: Power spectrum disintegrates a signal into its frequency components and show the power of each frequency component. To illustrate the changes in happening in different frequency components of a signal, the power spectrum or frequency spectrum is typically shown over time with heat maps.
Passband: In signal processing, filters are applied on a signal to attenuate undesired frequency components while let pass the useful frequency components. The passband refers to the frequency range that a filter allows to pass through. The passband is identified using the lower and upper cutoff frequencies. When a filter allows a specific frequency band to pass, it is called a band-pass filter. When the passband starts at zero (i.e., lower cutoff = 0 Hz), it is called a low-pass filter. When the passband ends at infinity (i.e., upper cutoff - infinity Hz) it is called a high-pass filter.
Harmonics: Harmonics are frequency components at multiples of the fundamental frequency. In power system, harmonics are produced when the 50Hz/60Hz sinusoidal voltage or current gets distorted by non-linear loads (such as SMPS). Harmonics in the power system create unwanted losses in power transmission.
Appendix B Voltage from a Power Outlet
We show in Fig. 20(a) a snapshot of the voltage trace collected from a power outlet in our lab. It can be seen that the supplied voltage varies by more than 500mV within just a few minutes. We further show the probability mass function (PMF) of a 24-hour voltage distribution in Fig. 20(b), demonstrating a nearly 5V variation in the actual supplied voltage.
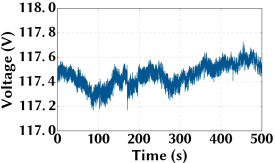
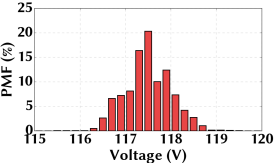
Appendix C Computer’s Power Supply Unit
C.1. Conduction Modes for PFC
In Table 4, we show a summary of major conduction modes for PFC circuits used in today’s computers.
|
|
|
|
Property | ||||||||
|---|---|---|---|---|---|---|---|---|---|---|---|---|
|
>300W |
![[Uncaptioned image]](/html/2001.06729/assets/figures/pfc_designs_curr_CCM.png)
|
![[Uncaptioned image]](/html/2001.06729/assets/figures/pfc_designs_freq_CCM.png)
|
|
||||||||
|
<300W |
![[Uncaptioned image]](/html/2001.06729/assets/figures/pfc_designs_curr_DCM.png)
|
![[Uncaptioned image]](/html/2001.06729/assets/figures/pfc_designs_freq_DCM.png)
|
|
||||||||
|
<300W |
![[Uncaptioned image]](/html/2001.06729/assets/figures/pfc_designs_curr_CrCM.png)
|
![[Uncaptioned image]](/html/2001.06729/assets/figures/pfc_designs_freq_CrCM.png)
|
|
C.2. PFC Switching Frequency Variation
We show the cumulative density function (CDF) of our Dell Optiplex’s PFC switching frequency variation in Fig. 21(a). We see that the PFC switching frequency varies no more than 50Hz within 5 seconds. In Fig. 21(b), we also show the frequency spectrum over a 5 second window and confirm that there is only a small variation in the PFC switching frequency.
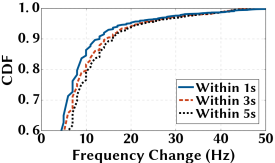
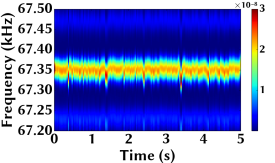
C.3. Current Drawn by Microsoft Surface Book
We show the measured current drawn by a Microsoft Surface Book with a 65W power rating in Fig. 22(a) and the frequency analysis of the current in Fig. 22(b). We see that the current waveform looks by no means like the sine voltage waveform and the total harmonic components are even stronger than the 60Hz component in terms of power spectral density (PSD). Beyond 20kHz, the intensity of harmonics decreases to an extremely low level, leaving only background noise.
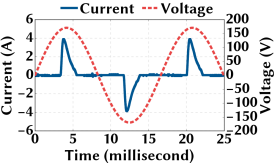
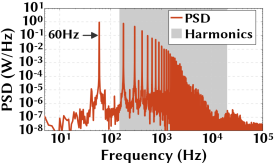
Appendix D Algorithm for Current Modulator
We design a simple current modulator as described in Algorithm 3. The current modulator program takes 1/0 bit streams as the input and runs some dummy calculations (e.g., generating random numbers) to load the CPU and change the computer’s input current.
Appendix E Data Exfiltration Results
E.1. Experiment on Dell Optiplex Computer
with different background application. Now, we run experiments on our Dell Optiplex computer under settings different from the default one. First, to run a concurrent program to mimic user’s normal activity, we play “See You Again” on YouTube on a Google Chrome browser, which is one of the most viewed videos [62]. We also run experiments using MS Word, web browsing, file transfer, and machine learning training as background applications resulting in 0%, 0%, 3.5%, and 1.67% bit error rates, respectively. In the MS word experiment, we mimic user behavior by repeatedly opening a new file, typing a few lines of texts and then saving the file. For the web browsing experiment, we open new popular websites (e.g., GMail and Facebook), scroll through the page content, and follow links to other pages. For the file transfer experiment, we transfer a 5GB file from one HDD drive to another in our desktop computer running Windows 10. For the machine learning experiment, we repeat training Tensorflow in Python with 6000 samples from the MNIST data set taking around fives minutes to finish [52]. We show snapshots of the detections in Fig. 27.
with different number of CPU cores. Next, we restrict the number of cores that are assigned to the modulation program in , and show the experimental results in Fig. 28.
with different pilot lengths. Finally, we consider 4-bit (“1101”) and 8-bit (“11001010”) pilot sequences, and show the experiment results in Fig. 29.
E.2. Experiment Using Multiple Transmitters
Fig. 30 shows the snapshot of data exfiltration for different transmitters from our multi-transmitter experiment. Our results show 0% error for TX#1 and TX#4 while 6.8% and 1.1% error for TX#2 and TX#3, respectively.
E.3. Impact of CPU scaling on the transmitter
Snapshots of detection results for 10%, 50%, and 100% CPU states are shown in Fig. 31.
E.4. Experiment Without Line of Sight
Fig. 32 shows the snapshot of data exfiltration when the receiver and transmitters are placed in two separate rooms 90 feet away from each other in Building B.
E.5. Experiment on Other Computers
Fig. 33 shows the experiment results for our Acer computer, our custom built computer #1, and our custom built computer #2.
E.6. Experiment on iMac
We conduct our experiment on an Apple iMac 27-inch computer in Lab #1. The transmitter and the receiver are placed 55 feet away from each other. The iMac has an all-in-one compact design with monitor and other components assembled together and powered by a single power supply unit.
We first show the frequency spectrum for a data frame transmitted from the iMac with a symbol length of 100ms in Fig. 23(a), which reveals that the PFC-induced frequency spike of the iMac is around 101kHz. It also shows that frequency band that carries the transmitted data has a much wider bandwidth of 1kHz compared to the Dell computers’ frequency bands in Fig. 12. Further, while not explicitly indicated in Fig. 23(a), the frequency amplitudes in the transmitted band is reversed, where the “1”s has lower amplitude and “0”s has a higher amplitude. We also show the frequency spectrum for a symbol length of 50ms in Fig. 23(b). The figures show the detection accuracy significantly deteriorates as we increase the symbol rate. In fact, we can not have successful data transmission for our default symbol length of 33ms. This is mainly due to the iMac’s power supply unit has a slower response to the power demand compared to other computers in our experiments.
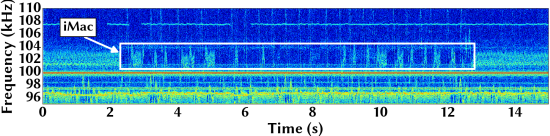
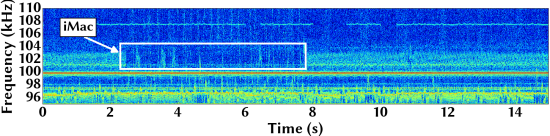
Next, we show a snapshot of data exfiltration from the iMac for four different symbol lengths ranging from 50ms to 125ms in Fig. 34. As discussed before, the bit error rate decreases as we increase the symbol length. However, since a higher symbol length means a lower maximum bits/second, the overall bit transfer rate decreases.
Appendix F PMF of Noise in Extracted Signal Amplitudes
We set the average signal amplitude of filtered voltage signals when transmitted bits are 1 as the reference signal amplitude for bit 1. When the transmitted bit is 1, any deviation of an actually received bit-wise signal amplitude from the reference value is considered as noise. Similarly, we also obtain the reference signal amplitude for bit 0, and obtain the noise. Next, we show the PMF of noise for both Dell Optiplex and Dell PowerEdge computers in Fig. 24. The noise amplitude distribution does not seem to be Gaussian. In other words, our covert channel is likely corrupted by non-Gaussian noises.
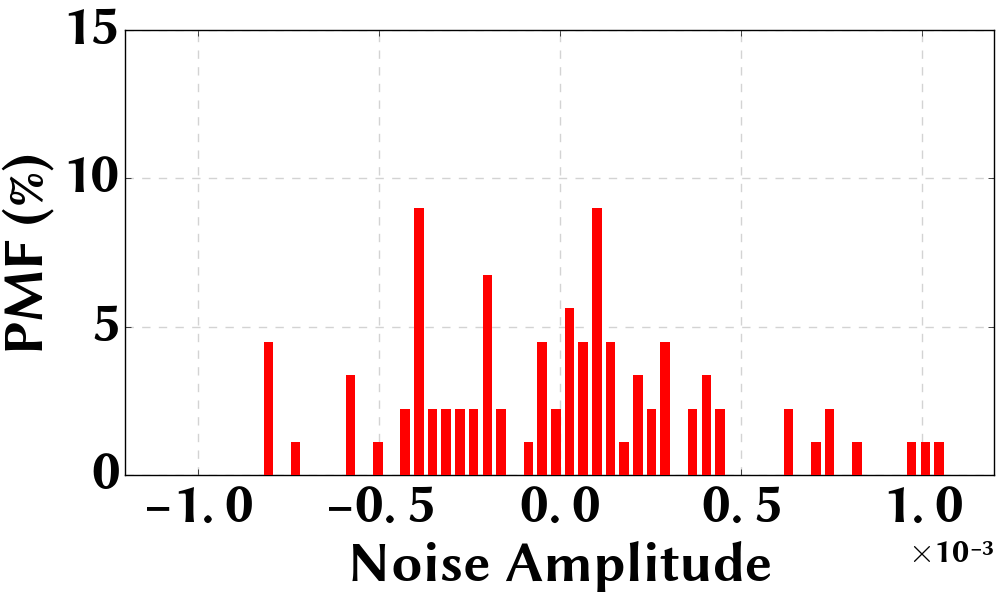
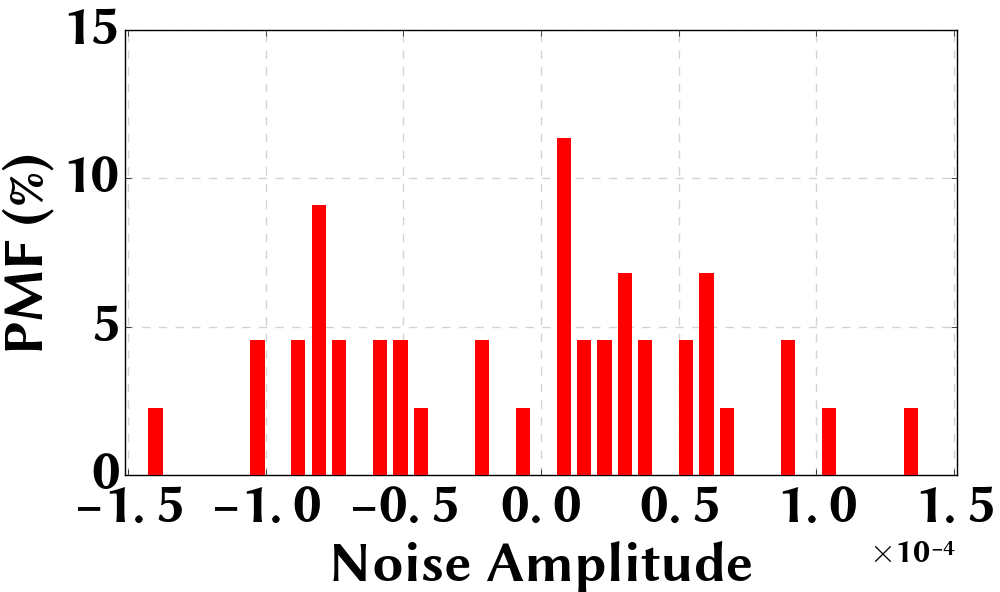
Appendix G Defense Mechanism Experiments
G.1. Experiment on a UPS-Powered Computer
We power our Dell PowerEdge computer through a CyberPower UPS, which is plugged into a power outlet in the transmitter’s room in Building B. In Fig. 35, we show that the receiver can still extract information without errors. Thus, an UPS-powered computer does not necessarily mean it is immune to the threat of , let alone its added UPS cost.
G.2. Experiment in the Presence of Noise Filters
We plug in noise filter (X10 XPPF) [78] into a power outlet in the transmitter’s room in Building B, and then plug in the power cord of our PowerEdge computer into the noise filter. Although the intensity of high-frequency PSD spikes in the receiver’s voltage signal is reduced, it is still much higher than the power line background noise and detectable. In Fig. 36, we show that the receiver can have an effective rate of 25.57 bits/second. Although the transmission distance is reduced compared to the no-filter case, the receiver can still be located in another room without being restricted to the line of sight of the transmitter.
G.3. Random Power Load Defense
We test the performance of a defense program that that injects random power loads by randomly deciding to either run a CPU-intensive computation or remain idle. We test ’s performance under varying settings of the defense program’s time interval of the CPU loads, percent time of high CPU load, and number of CPU cores used by the defense program. Figs. 37, 38, 39, and 40 shows the snapshot of detection results for some selected cases of interest, while Fig. 25 shows the power overhead for different settings. Fig. 26 shows the current drawn by the defense program with the CPU load 20% and 60% of the times.
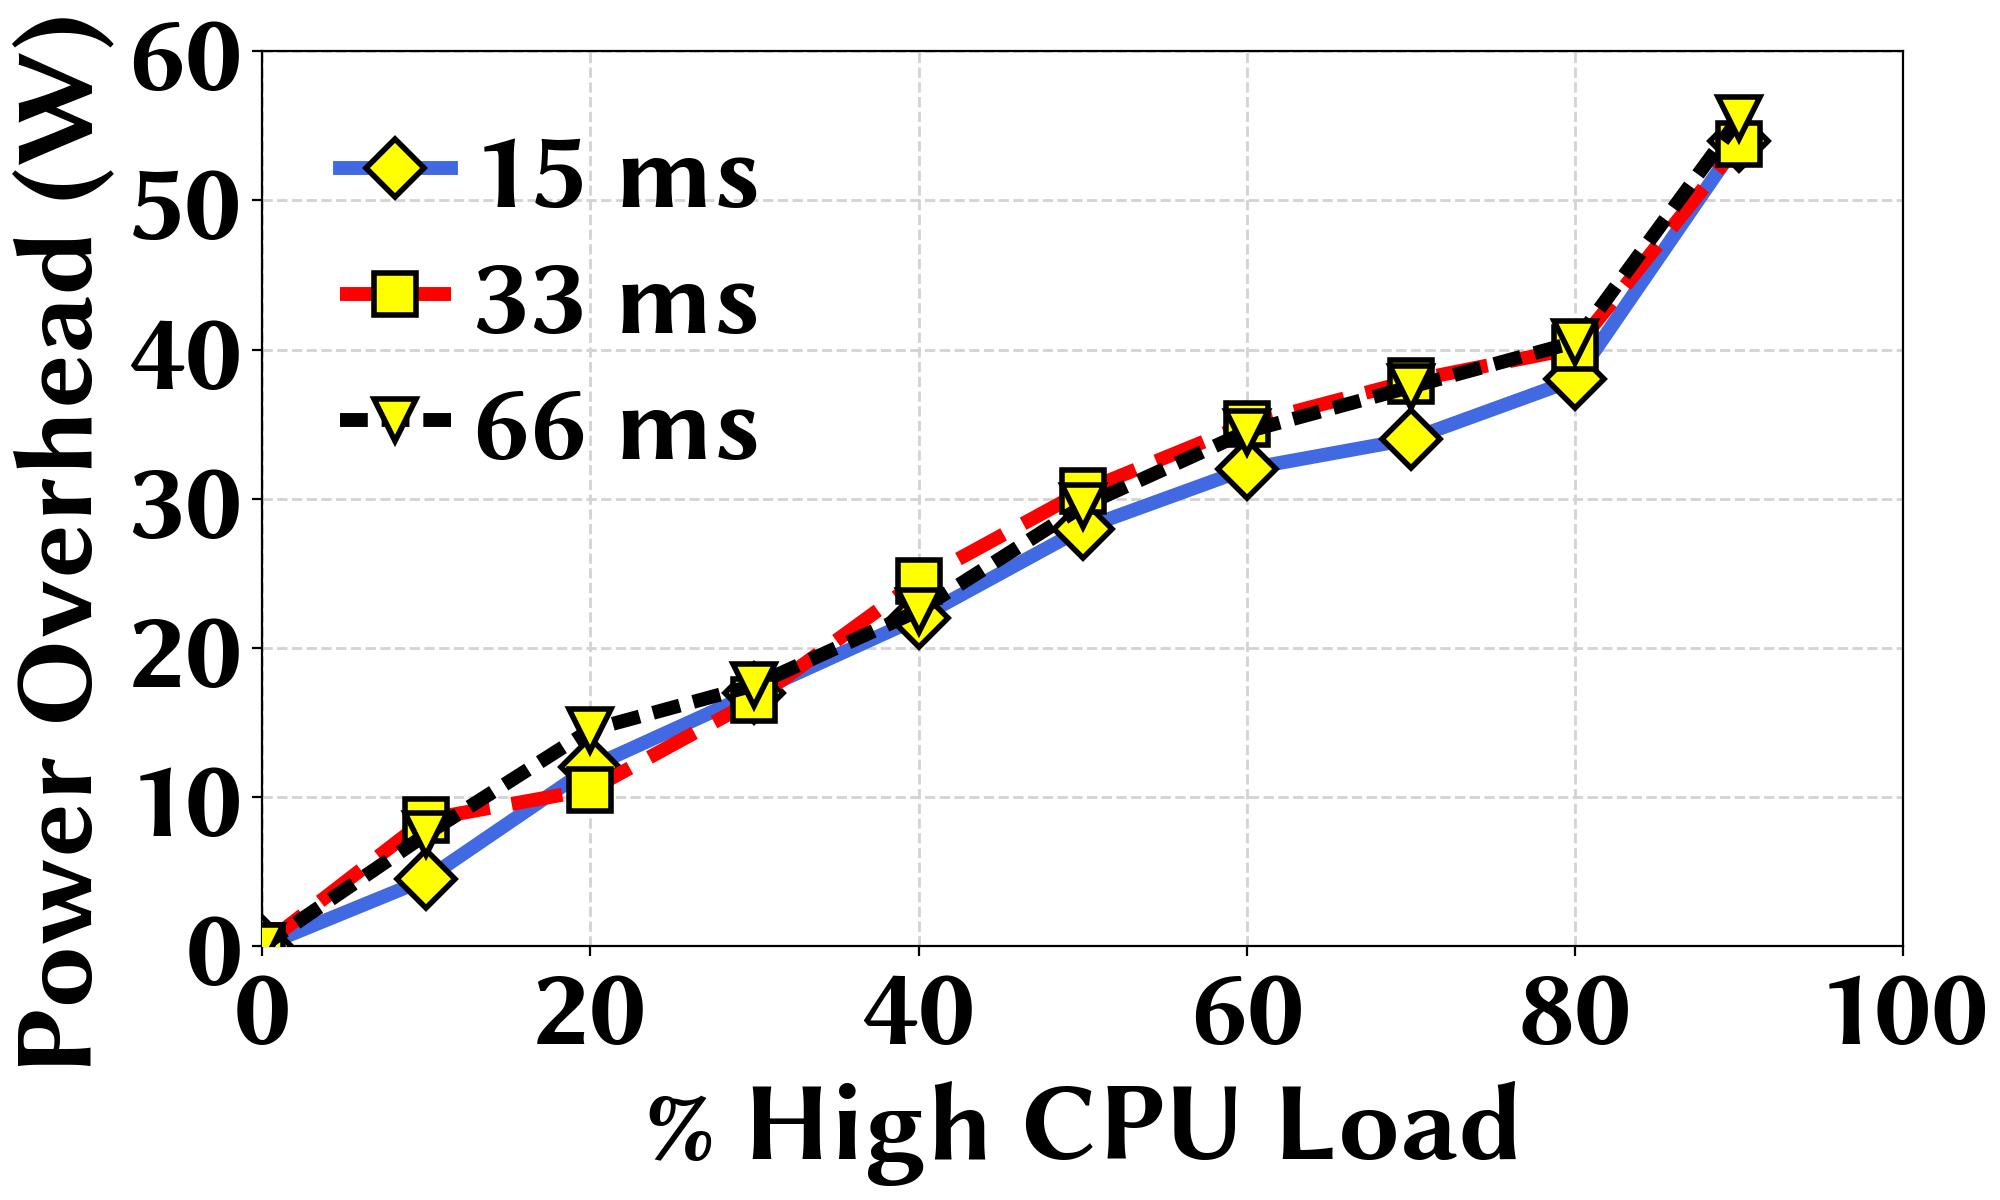
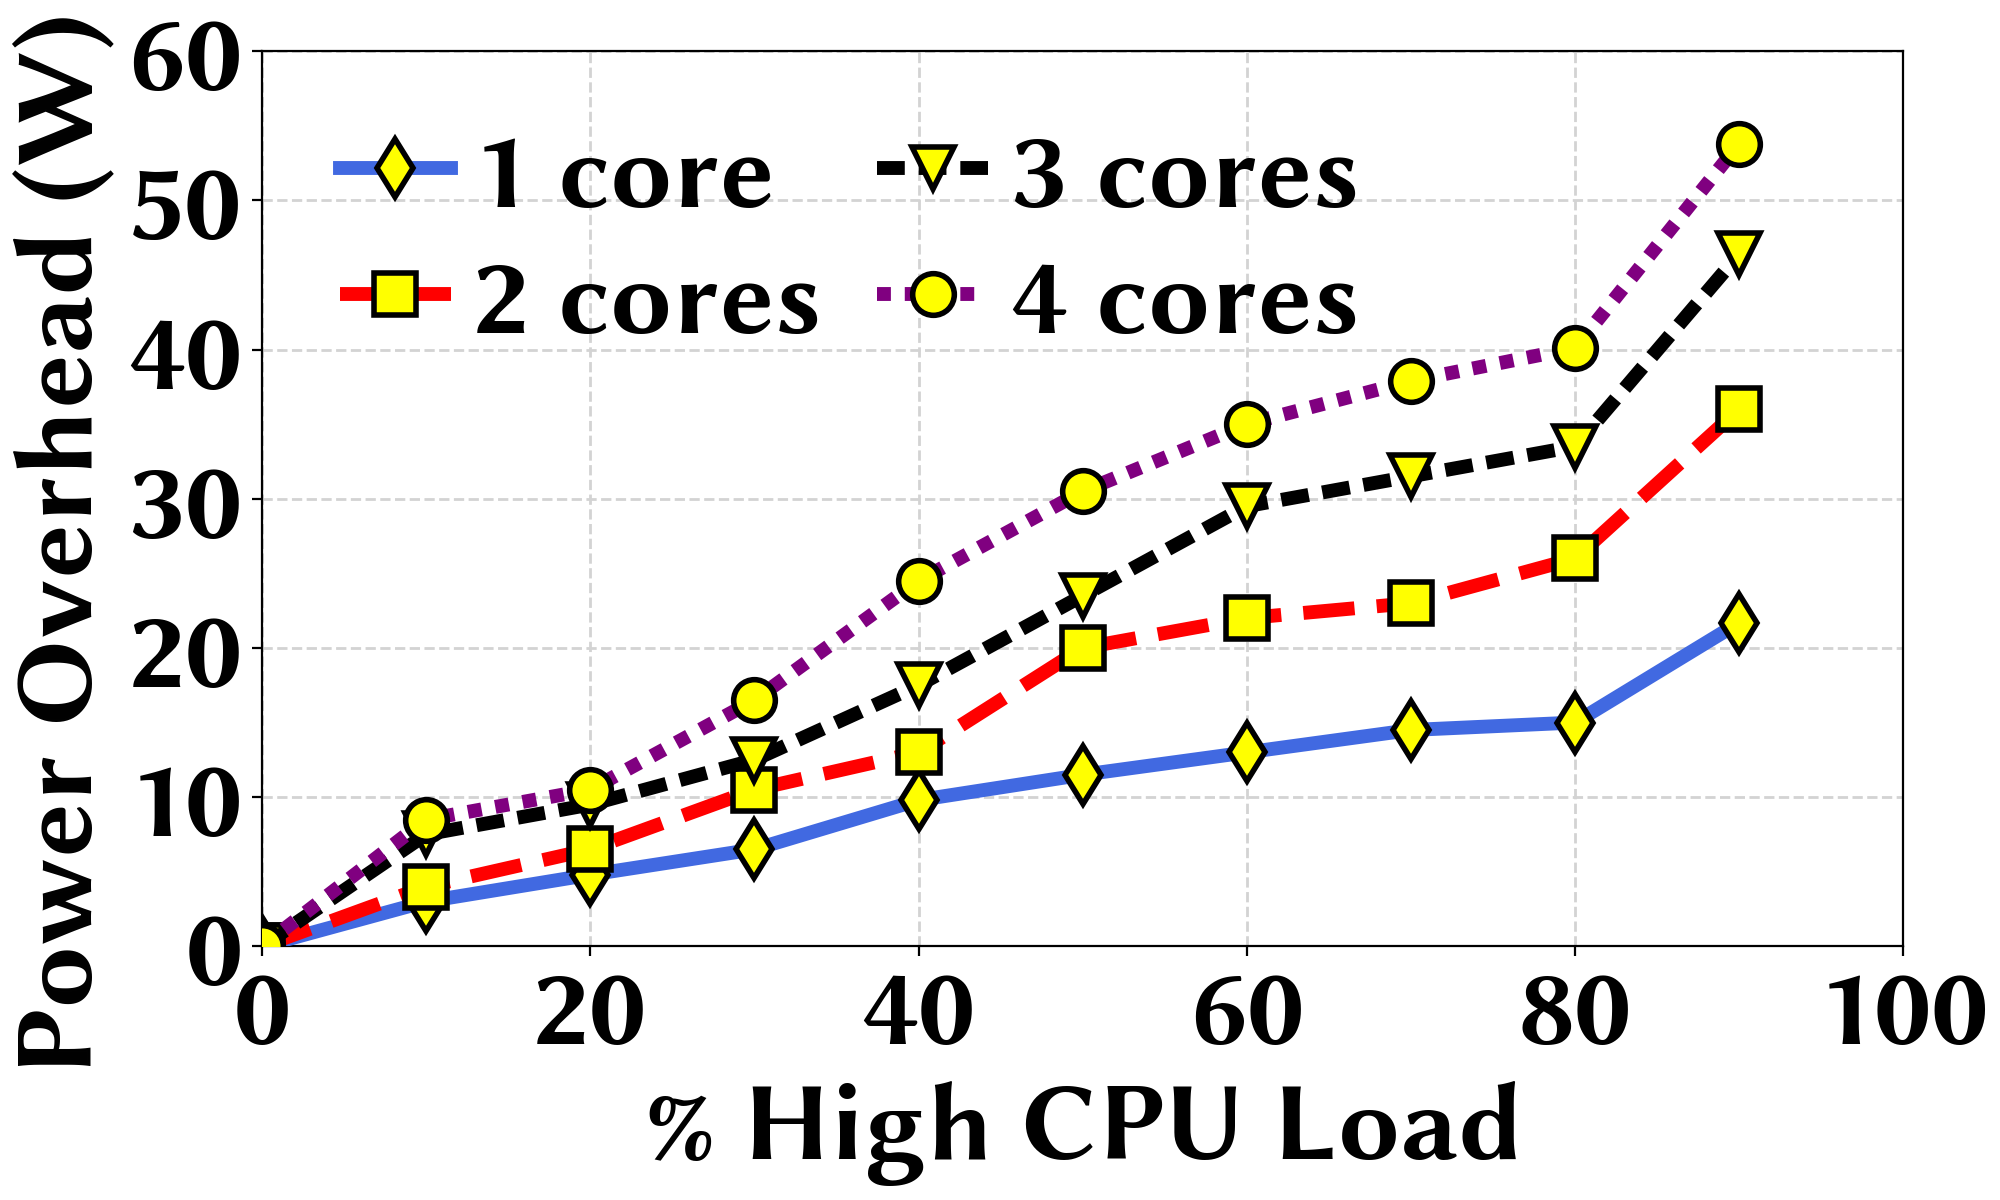
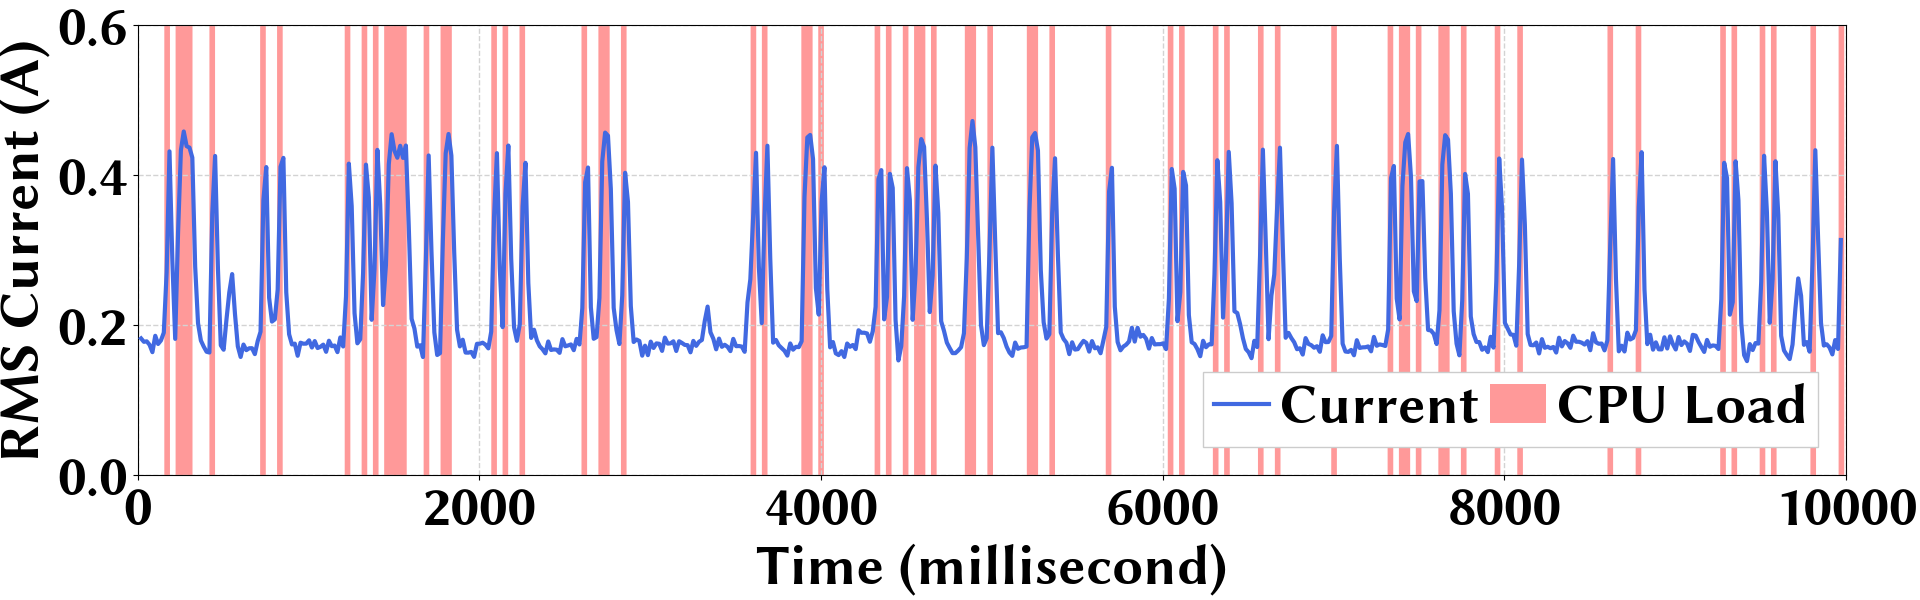
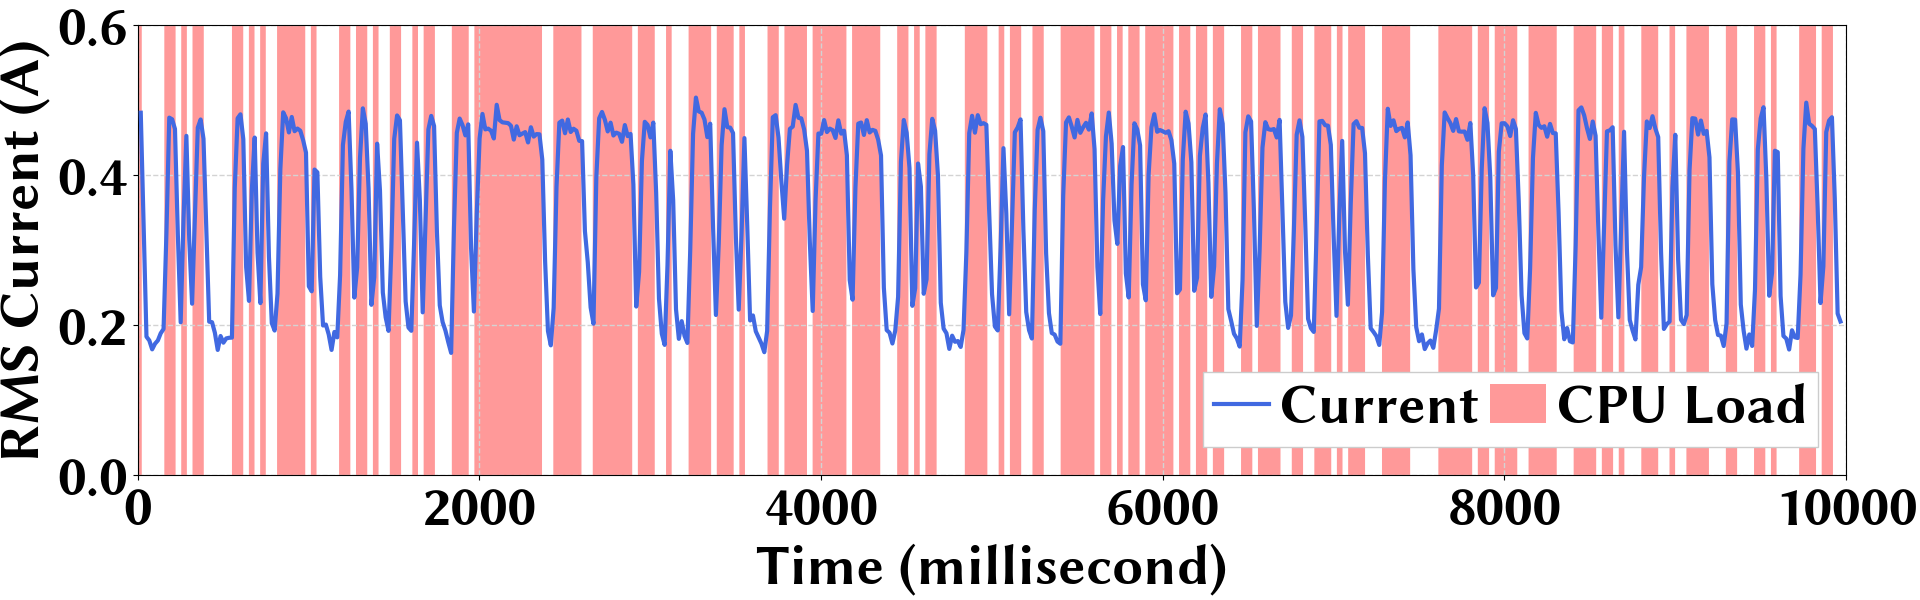
Appendix H Snapshots of All Detection Results