meson production in inelastic p+p interactions at 158 \GeVcbeam momentum measured by \NASixtyOneat the CERN SPS \PreprintIdNumberCERN-EP-2020-002 \ShineJournal \ShineJournalRefpublished in Eur. Phys. J. C80, 460 (2020) \ShineDOI10.1140/epjc/s10052-020-7955-1 \ShineAbstract The measurement of resonance production via its decay mode in inelastic p+p collisions at beam momentum 158 \GeVc( \GeV) is presented. The data were recorded by the \NASixtyOnehadron spectrometer at the CERN Super Proton Synchrotron. The template method was used to extract the signal and double-differential transverse momentum and rapidity spectra were obtained. The full phase-space mean multiplicity of mesons was found to be . The \NASixtyOneresults are compared with the \EposLongand Hadron Resonance Gas models as well as with world data from p+p and nucleus-nucleus collisions.
1 Introduction and motivation
Strange hadron production is believed to be an important tool to study the dynamics of high-energy collisions. In collisions achieving high energy densities strangeness production was predicted to be enhanced [1] as a result of the decrease of the mass of strangeness carriers due to partial chiral symmetry restoration. The resonance state contains an valence quark and is therefore sensitive to the level of strangeness production. Thus, the data on meson production provide a more complete understanding of hadron chemistry.
Measurements of the production of short-lived resonances are a unique tool to understand the less known aspects of high energy collisions, especially their time evolution. In heavy ion collisions the yields of resonances may help to distinguish between two possible freeze-out scenarios: the sudden and the gradual one [2]. Namely, the ratio of to charged kaon production may allow to estimate the time interval between chemical (end of inelastic collisions) and kinetic (end of elastic collisions) freeze-out. The lifetime of the resonance ( fm/) is comparable to the expected duration of the rescattering hadronic gas phase between the two freeze-out stages. Consequently, a certain fraction of resonances will decay inside the fireball. The momenta of their decay products are expected to be significantly modified by elastic scatterings, preventing the experimental reconstruction of the resonance via an invariant mass analysis. In such a case a suppression of the observed yield is expected. Such an effect was indeed observed in nucleus-nucleus collisions at Super Proton Synchrotron (SPS) and Relativistic Heavy Ion Collider (RHIC) energies [3, 4, 5, 6, 7, 8]. The ratio of production ( stands for , or , and denotes or ) showed a decrease with increasing system size as expected due to the increasing rescattering time between chemical and kinetic freeze-out. The same effect was recently reported also by the ALICE Collaboration at the Large Hadron Collider (LHC) [9, 10, 11, 12].
When looking at the energy dependence of the ratio111In ALICE at LHC and STAR at RHIC papers. e.g. Refs. [10, 12, 7], the results for and were combined and averaged and denoted by the symbol ; the ratios were measured at mid-rapidity. in central Pb+Pb or Au+Au collisions, a bit larger suppression of is observed for the 2.76 TeV222The ratios in Pb+Pb collisions at = 2.76 TeV and 5.02 TeV are in agreement within uncertainties [12]. LHC energy [10] when compared to the top RHIC (=200 \GeV) energy [7], namely = () for the 0–5% (5–10%) central Pb+Pb reactions at LHC and for the 0–10% most central Au+Au interactions at RHIC. Those values can be compared with those for p+p interactions, which are at LHC [10] and at RHIC [7]. Thus, the ratio in central Pb+Pb collisions at LHC (2.76 TeV) drops to 59 (61)% of the value found for p+p interactions. For RHIC energies this drop is similar and equals 59%.
In the NA49 experiment at the CERN SPS and meson production was analyzed separately and the corresponding (almost ) mean multiplicities obtained in the 23.5% most central Pb+Pb collisions at =17.3 \GeVare and , respectively [4]. They can be rescaled (using the mean number of wounded nucleons; factor 362/262, see also Table 8) to the 5% most central collisions, resulting in mean multiplicities of and , respectively. Their average, divided by the multiplicity () for the 5% most central Pb+Pb collisions [13] results in the ratio of which is similar to the value measured in the 10% most central Au+Au collisions at RHIC [7]. Finally, the ratio for p+p interactions at the same SPS energy can be estimated as [4, 14]. Thus, at SPS energy the resonance to non-resonance ratio in central Pb+Pb drops to about 43–44% of the value for p+p interactions. This effect is even stronger than the one observed at RHIC and LHC and might suggest that the lifetime (calculated in the rest frame; see Eq. (21) in Sec. 5.4) of the hadron gas system created in central nucleus-nucleus collisions at the SPS is longer than that at higher energies. Eventually, resonance regeneration processes start to play a role for higher energies counteracting the suppression due to rescattering. It should also be pointed out that the whole picture assumes that the conditions at chemical freeze-out of p+p and Pb+Pb collisions are the same. More detailed calculations of the time between freeze-outs, both in the rest frame and in collision center-of-mass reference system, are given in Sec. 5.4.
The results for p+p collisions provide an important base-line for heavier nucleus-nucleus systems. So far the ratio for p+p interactions did not show large differences between the top RHIC and four LHC energies [15, 10, 16, 12]. Most of the results at lower energies are less reliable due to large uncertainties, see the compilation in Ref. [15], and new points in Refs. [4, 10, 16, 12]. This emphasizes the need to obtain high precision p+p data at energies lower than the top RHIC energy. Continuing considerations for p+p collisions, a very intriguing effect was reported in the most recent ALICE analysis of the multiplicity dependence in p+p collisions [17, 18]. The and ratios decrease when going from low-multiplicity to high-multiplicity p+p interactions at the LHC energies. This may be an indication of a hadronic phase with significant non-zero lifetime even in p+p collisions.
The transverse mass spectra and yields of mesons are also important inputs for Blast-Wave models (determining kinetic freeze-out temperature and transverse flow velocity) and Hadron Resonance Gas models (determining chemical freeze-out temperature, baryochemical potential, strangeness under-saturation factor, system volume, etc.). Those models significantly contribute to our understanding of the phase diagram of strongly interacting matter. In principle, the precise determination of transverse flow velocity is attractive due to the fact, that recent LHC, RHIC and even SPS results suggest that dense and collectively behaving system may appear also in collisions of small nuclei, or even in elementary interactions. Finally, the study of resonances in elementary interactions contributes to the understanding of hadron production, due to the fact that products of resonance decays represent a large fraction of the final state particles. Resonance spectra and yields provide an important reference for tuning Monte Carlo string-hadronic models.
The study of and/or production in p+p collisions at RHIC energies was performed by the STAR [5] and PHENIX [19] experiments and at LHC energies by ALICE [15, 10, 16, 12, 20, 18]. The NA49 experiment performed the measurements in inelastic p+p collisions at beam momentum of 158 \GeVc(CERN SPS) [4]. Also the LEBC-EHS facility at the CERN SPS measured and production in p+p collisions at 400 \GeVc [21]. Finally, results obtained at the energies of the CERN Intersecting Storage Rings (ISR) were published in Refs. [22, 23].
This paper reports measurements of resonance production via its decay mode in inelastic p+p collisions at beam momentum of 158 \GeVc( \GeV)333The analysis of as well as and at lower SPS energies is a subject of future \NASixtyOnepaper. [24]. The data were recorded by the \NASixtyOnehadron spectrometer [25] at the CERN SPS. Unlike in the previous NA49 analysis [4] at the same beam momentum, the template method was used to extract the signal. This method was found to allow a more precise background subtraction than the standard procedure. Moreover, the large statistics \NASixtyOnedata (about 52.5M events recorded with the interaction trigger compared to 2.5M p+p events analysed in NA49 [26, 27]) allowed to obtain high quality double-differential transverse momentum and rapidity spectra of mesons. The paper is organized as follows. Section 2 briefly describes the \NASixtyOnedetector. Section 3 discusses the analysis procedures, including event and track cuts, method of signal extraction, corrections, and evaluation of uncertainties. The final results are presented in Section 4 and their comparison with world data and models in Section 5. A summary Section 6 closes the paper.
2 Experimental setup
The \NASixtyOneexperiment [25] uses a large acceptance hadron spectrometer located in the CERN North Area. The schematic layout of the \NASixtyOnedetector is shown in Fig. 1. The detailed description of the full detector can be found in Ref. [25]. Here only the detector components, which were used in this analysis, are described.
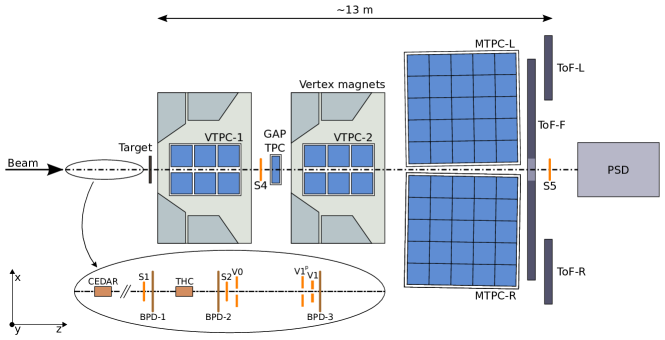
A set of scintillation and Cherenkov counters as well as beam position detectors (BPDs) upstream of the spectrometer provide timing reference, identification and position measurements of incoming beam particles. The trigger scintillator counter S4 placed downstream of the target is used to select events with collisions in the target area by the absence of a charged particle hit.
Secondary beams of positively charged hadrons at 158 \GeVcare produced from 400 \GeVcprotons extracted from the SPS accelerator. Particles of the secondary hadron beam are identified by two Cherenkov counters, a CEDAR [30] (for 158 \GeVcbeam CEDAR-N) and a threshold counter (THC). The CEDAR counter, using a coincidence of six out of the eight photo-multipliers placed radially along the Cherenkov ring, provides positive identification of protons, while the THC, operated at pressure lower than the proton threshold, is used in anti-coincidence in the trigger logic. A selection based on signals from the Cherenkov counters allowed one to identify beam protons with a purity of about 99%. A consistent value for the purity was found by bending the beam into the TPCs with the full magnetic field and using identification based on its specific ionization energy loss [31].
The main tracking devices of the spectrometer are four large volume Time Projection Chambers (TPCs). Two of them, the vertex TPCs (VTPC-1 and VTPC-2), are located in the magnetic fields of two super-conducting dipole magnets with a combined bending power of 9 Tm which corresponds to about 1.5 T and 1.1 T fields in the upstream and downstream magnets, respectively.
Two large main TPCs (MTPC-L and MTPC-R) are positioned downstream of the magnets symmetrically to the beam line. The fifth small TPC (GAP TPC) is placed between VTPC-1 and VTPC-2 directly on the beam line. It closes the gap between the beam axis and the sensitive volumes of the other TPCs. The TPCs are filled with Ar and CO2 gas mixtures. Particle identification in the TPCs is based on measurements of the specific energy loss () in the chamber gas.
The p+p data sets, which are the topic of this paper, were recorded with the proton beam incident on a liquid hydrogen target (LHT), a 20 cm long cylinder positioned about 80 cm upstream of VTPC-1.
3 Data sets and analysis technique
3.1 Data sets
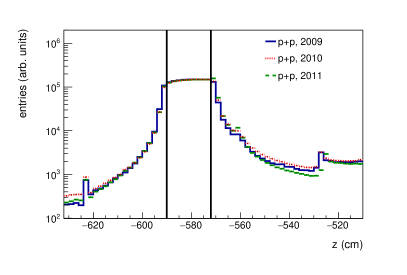
The results for p+p interactions are based on high-statistics data runs (in years 2009, 2010, and 2011) which recorded about collisions ( events selected by the interaction trigger) of the proton beam with a 20 cm long liquid hydrogen target (LHT). The conditions during the three runs were very similar as demonstrated in Fig. 2 (left) where the -position (along the beam line) of the reconstructed p+p interaction vertex is shown. For the analysis the range of -position of the main vertex was selected to cover mostly the LHT (see Sec. 3.3) in order to maximize the number of good events and minimize the contamination by off-target interactions. Figure 2 (right) shows that for the 2009 production the ratio of the number of events in the target-removed sample to the number of events in the target-inserted sample (ratio calculated in the range cm; histograms normalized in the range cm) is on the level of 4.8%, and therefore no correction for non-target interactions was applied. An alternative method of analysis (see for example Ref. [28]) would be to measure and subtract the resonance yields in the target-removed data, but both the standard method and the template-fitting method used in this paper cannot be applied to data sets with small statistics such as the target removed data recorded by \NASixtyOne. In order to estimate the systematic biases related to the contamination by off-target interactions the window of -position of the main vertex was varied (see Sec. 3.10).
Table 1 presents the details of data sets collected in the three separate data taking periods. The number of events recorded with the interaction trigger, as well as the number of events selected for the analysis (see Sec. 3.3) are shown. One sees that only 44–56% of the events were used for the analysis. This drop is caused mainly by BPD reconstruction inefficiencies and off-target interactions accepted by the trigger. The number of tracks, given in the Table 1, refers to tracks registered in accepted events only. The agreement of the fractions of accepted tracks in the three analyzed data sets confirms the similarity of the data recorded in 2009, 2010 and 2011. For the analysis of production these three data sets were combined at the level of preparing invariant mass distributions (Sec. 3.6).

| 2009 | 2010 | 2011 | Total | |
| Number of events | 2.87M (100%) | 37.78M (100%) | 11.88M (100%) | 52.53M (100%) |
| selected by interaction trigger | ||||
| Number of events after cuts | 1.26M (43.9%) | 19.97M (52.9%) | 6.62M (55.7%) | 27.85M (53.0%) |
| Number of tracks | 8.62M (100%) | 136.58M (100%) | 45.48M (100%) | 190.68M (100%) |
| Number of tracks after cuts | 4.81M (55.8%) | 76.41M (55.9%) | 24.91M (54.8%) | 106.13M (55.7%) |
| without cut | ||||
| Number of tracks after all cuts | 2.26M (26.2%) | 35.79M (26.2%) | 11.74M (25.8%) | 49.79M (26.1%) |
3.2 Analysis method
The details of \NASixtyOnecalibration, track and vertex reconstruction procedures, as well as simulations used to correct the reconstructed data, are discussed in Refs. [28, 29, 32]. In the following section the analysis technique developed for the measurement of the spectra in p+p interactions is described. The procedure used for the data analysis consists of the following steps:
-
(i)
application of event and track selection criteria,
-
(ii)
selection of and candidates based on the measurement of their ionization energy loss () in the gas volume of the TPCs,
-
(iii)
creation of invariant mass distribution of pairs,
-
(iv)
creation of invariant mass distribution of pairs for mixed events and Monte Carlo templates,
-
(v)
extraction of signal,
-
(vi)
application of corrections (obtained from simulations) to the raw numbers of ; they include losses of inelastic p+p interactions due to the on-line and off-line event selection as well as losses of due to track and pair selection cuts and the detector geometrical acceptance.
The details of the steps are described in the following subsections.
3.3 Event selection
Inelastic p+p interactions were selected by the following criteria:
- (i)
-
(ii)
no off-time beam particle was detected within s around the trigger (beam) particle,
-
(iii)
the trajectory of the beam particle was measured in at least one of BPD-1 or BPD-2 and in the BPD-3 detector and was well reconstructed,
-
(iv)
the primary interaction vertex fit converged,
-
(v)
the fit of the -coordinate of the primary p+p interaction vertex (see Fig. 2) converged and the fitted position was found between -590 cm and -572 cm, where the center of the LHT was at -580 cm. The range of this cut was selected to maximize the number of good events and minimize the contamination by off-target interactions,
-
(vi)
events with a single, well measured positively charged track with absolute momentum close to the beam momentum ( \GeVc) were rejected.
The above event cuts select well measured inelastic p+p interactions. The background due to elastic interactions is removed (cuts (iv) and (vi)). The contribution of off-target interactions is reduced (cut (v)). The losses of inelastic interactions due to the event selection procedure were corrected using simulations (see below). The number of events after these cuts is .
3.4 Track selection
After the event selection criteria a set of track quality cuts were applied to individual tracks. These cuts were used to ensure high reconstruction efficiency, proper identification of tracks and to reduce the contamination of tracks from secondary interactions, weak decays and off-time interactions. The individual tracks were selected by the following criteria:
-
(i)
the track fit including the interaction vertex converged,
-
(ii)
the total number of reconstructed points on the track should be greater than 30,
-
(iii)
the sum of the number of reconstructed points in VTPC-1 and VTPC-2 was greater than 15 or the number of reconstructed points in the GAP TPC was greater than 4,
-
(iv)
the distance between the track extrapolated to the interaction plane and the interaction point (impact parameter) should be smaller than 4 cm in the horizontal (bending) plane and 2 cm in the vertical (drift) plane,
-
(v)
the track momentum (in the laboratory reference system) is in the range \GeVc,
-
(vi)
the track transverse momentum is required to be smaller than 1.5 \GeVc,
-
(vii)
track cuts were applied to select and candidates (see Sec. 3.5).
The number of tracks left after these cuts is about .
3.5 Selection of kaon and pion candidates
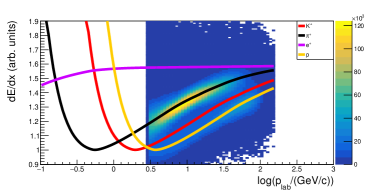
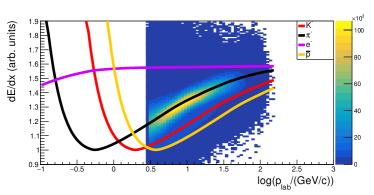
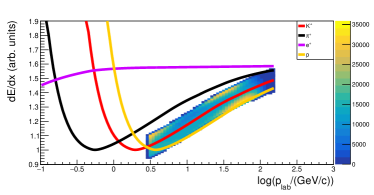
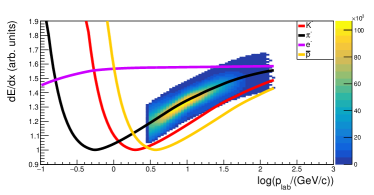
Charged particle identification in the \NASixtyOneexperiment is based on the measurement of their ionization energy loss () in the gas of the TPCs and of the time of flight (tof) obtained from the ToF-L and ToF-R walls. For the region of the relativistic rise of the ionization at large momenta, the measurement of alone allows identification. At lower momenta the bands for different particle species overlap and the identification based only on measurements of in the TPCs (this analysis) is not enough. For this reason the track cut (v) was applied. In Fig. 3 the values as a function of total momentum (), measured in the laboratory reference system, are shown for positively and negatively charged particles, separately. The and candidates were selected by requiring their values to be within or around their nominal Bethe-Bloch values, respectively. Here represents the typical standard deviation of a Gaussian fitted to the distribution of kaons and pions. Since only small variations of were observed for different total momentum and transverse momentum bins, fixed values were used for and for . The bands of selected and candidates are shown in the bottom panel of Fig. 3
3.6 signal extraction
The raw numbers of are usually obtained by performing fits to the invariant mass spectra with the sum of a background and a signal function. The invariant mass is defined as:
| (1) |
where represents the total energy and the momentum vector of daughter particles from decay.
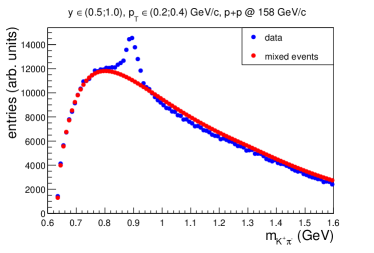
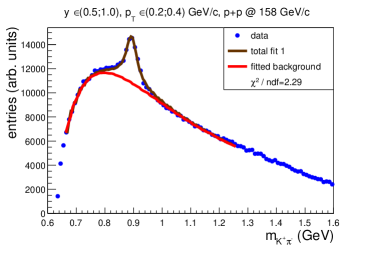
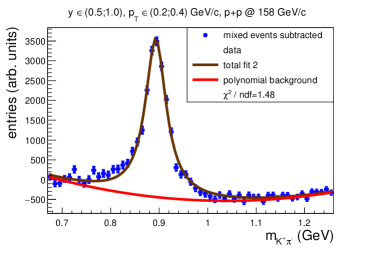
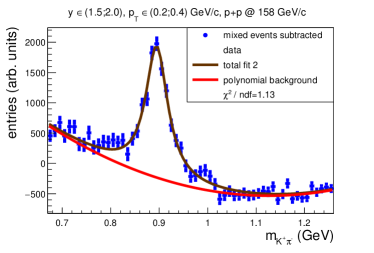
In the standard method (mixing method) the large combinatorial background is estimated by invariant mass spectra calculated for pairs originating from different events. Figures 4 and 5 (top, left) show combinatorial background histograms (red points) compared to the data histograms of (blue points). Mixed events were normalized to the same number of pairs as in real data in the invariant mass range from 0.6 to 1.6 \GeV. After subracting the normalized mixed event background the blue points in Figs. 4, 5 (bottom, left) were obtained. The signal is prominently seen, but the histogram still shows a residual background, seen especially for low invariant mass values. This residual background probably comes from the products of other resonance decays, which are not properly accounted for by the event-mixing, and should be subtracted. The final fit (total fit 2) was performed with the function of Eq. (2) using an additional background component based on a second order polynomial:
| (2) |
where , , , and are free parameters of the fit, and the Breit-Wigner () component is described by Eq. (3):
| (3) |
where is the normalization factor, and and are also fitted. The initial values of the mass () and width () parameters of were taken from the Particle Data Group (PDG): \GeVand \GeV [35]. The red lines (polynomial background) in Figs. 4, 5 (bottom, left) show the fitted additional background component (Eq. (2) without ) and the brown lines (total fit 2) the total fit result (Eq. (2)).
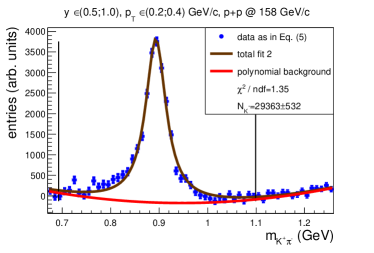
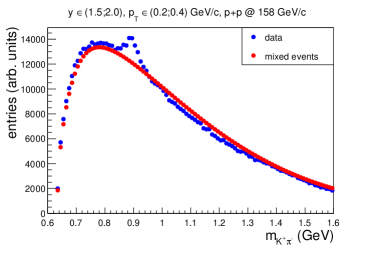
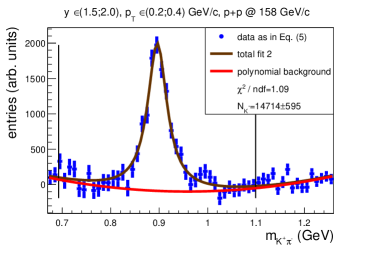
In order to obtain a better background description compared to the mixing method, the template method was applied. Namely, the invariant mass spectra of the data (blue data points in Figs. 4, 5 (top, right)) were fitted with a function given by Eq. (4):
| (4) |
The background is described as a sum of two contributions: and . is the background estimated based on the mixing method, which was discussed above. The template (MC stands for Monte Carlo) is the shape of background, which describes the contribution of pairs originating from:
-
(i)
combination of tracks that come from decays of resonances different than , for example one track from a meson and one from a meson,
-
(ii)
combination of tracks where one comes from decay of a resonance and one comes from direct production in the primary interaction.
The templates were constructed by passing p+p interactions, generated with the \EposLong [33] hadronic interaction model using the CRMC 1.4 package [34], through the \NASixtyOnedetector simulation chain and then through the same reconstruction routines as the data. The simulation keeps the history of particle production thus allowing to identify their identity and origin enabling the construction the proper templates. For the reconstructed MC events, the same event and track selection criteria, as for real data, were used. They also include the effects of the limited acceptance of the detector. Both the template and the data histograms were computed in bins of rapidity (calculated in the center-of-mass reference system) and transverse momentum .
Finally, the signal () is described using the Breit-Wigner distribution Eq. (3).
The and histograms in the fit function Eq. (4) were normalized to have the same numbers of pairs as the real data histogram in the invariant mass range from 0.6 to 1.6 \GeV. The symbols , and in Eq. (4) are the normalization parameters of the fit (), which describe the contributions of , and to the invariant mass spectra. The mass and width of the are the parameters of the Breit-Wigner shape obtained within the mass window . The values from total fit 2 (see Fig. 4 or 5 (bottom, right)) were used in the results section below.
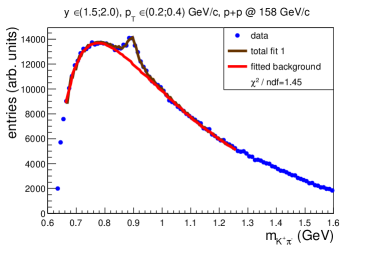
In Figs. 4, 5 (top, right), the fitted invariant mass spectra, using Eq. (4), are presented by brown curves (total fit 1). The red lines (fitted background) show the fitted function without the signal contribution (). The fits (brown and red curves) were performed in the invariant mass range from 0.66 \GeVto 1.26 \GeV. It is seen that Eq. (4) (without component) describes the background much better than only mixed events (Figs. 4, 5 (top, left)). After MC template and mixed event background subtraction (see Eq. (5)), the resulting mass distributions (blue data points) are shown in Figs. 4, 5 (bottom, right). One sees that the remaining background (red curves) is much less significant than in the case of the standard method (Figs. 4, 5 (bottom, left)). In fact, a small residual background is present mostly for the and bins in which the statistics is very low. To subtract it, a fit of the blue histograms was performed as the last step using the function Eq. (2). The results are shown in Figs. 4, 5 (bottom, right). The red lines (polynomial background) illustrate the remaining residual background (Eq. (2) without ) and the brown curves (total fit 2) the sum of residual background and signal distribution (Eq. (2)). Finally, the uncorrected number of mesons (for each separate and bin) is obtained as the integral over the signal of total fit 2 in Figs. 4, 5 (bottom, right). The integral is calculated in the mass window .
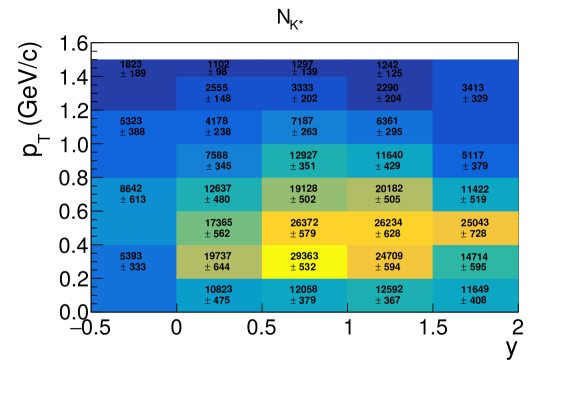
3.7 Uncorrected numbers of
Figure 6 presents the uncorrected numbers of () as obtained from the extraction procedure described in Sec. 3.6. The values are shown with statistical uncertainties. For each invariant mass bin in Fig. 4 or 5 (bottom, right), the bin content was calculated as:
| (5) |
where is the raw production in a given bin, and , , and are described in Eq. (4). The statistical uncertainty of can be expressed as (the notation is omitted for simplifying the formula):
| (6) |
where , and are the standard statistical uncertainties taken as the square root of the number of entries. For and histograms the number of entries had to be properly normalized. Due to high statistics of data, Monte Carlo, and mixed events, the uncertainties of parameters and were neglected. Finally, for each bin of in Fig. 6 the uncorrected number of , , was calculated as the integral over the signal of total fit 2 in Figs. 4, 5 (bottom, right). The integral was obtained within the mass window . The statistical uncertainty of the raw number of , , was taken as the uncertainty of the integral calculated by the ROOT [36] package using covariance matrix of the fitted parameters.
3.8 Correction factors
In order to determine the number of mesons produced in inelastic p+p interactions, two corrections were applied to the extracted raw number of :
-
(i)
The loss of the due to the requirement was corrected by a constant factor:
(7) where and are the probabilities (based on the cumulative Gaussian distribution) for or to lie within or around the nominal Bethe-Bloch value.
-
(ii)
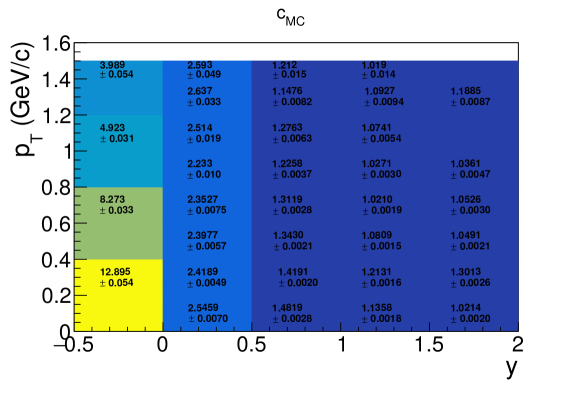
A detailed Monte Carlo simulation was performed to correct for geometrical acceptance, reconstruction efficiency, losses due to the trigger bias, detector acceptance as well as the quality cuts applied in the analysis. The width of the resonance was simulated according to the known PDG value [37]. The correction factors are based on inelastic p+p events produced by the \EposLongevent generator [33]. The validity of these events for calculation of the corrections was verified in Refs. [28, 38]. The particles in the generated events were tracked through the \NASixtyOneapparatus using the Geant3 package [39]. The TPC response was simulated by dedicated \NASixtyOnesoftware packages which take into account all known detector effects. The simulated events were reconstructed with the same software as used for real events and the same selection cuts were applied (except the identification cuts: and total momentum ).
For each and bin, the correction factor was calculated as:
(8) where:
-
-
is the number of generated in a given (y,) bin,
-
-
is the number of reconstructed and selected by the cuts in a given () bin. The reconstructed charged particles were matched to the simulated and based on cluster positions. Then the invariant mass was calculated for all pairs. The reconstructed number of was obtained by repeating the same steps (template method) as in raw data; they are described in Section 3.6,
-
-
is the number of generated inelastic p+p interactions (),
-
-
is the number of accepted p+p events ().
The uncertainty of was calculated assuming that the denominator is a subset of the nominator and thus has a binomial distribution. The uncertainty of was calculated as follows:
(9) -
-
The values of correction factors , together with statistical uncertainties, are presented in Fig. 7 for all analyzed bins.
3.9 Corrected yields
The double-differential yield of per inelastic event in a bin of () is calculated as follows:
| (10) |
where:
-
-
is the branching ratio of decay into pairs (obtained [27] from the Clebsch-Gordan coefficients),
-
-
is the uncorrected number of , obtained by the signal extraction procedure described in Sec. 3.6,
-
-
is the number of events after cuts,
-
-
, are the correction factors described above,
-
-
and are the bin widths.
The corrected double-differential yields of together with their uncertainties are presented in Sec. 4.
3.10 Statistical and systematic uncertainties
The statistical uncertainties of the corrected double-differential yields (see Eq. (10)) take into account the statistical uncertainties of (see Eq. (9)) and the statistical uncertainties (see Sec. 3.7) of the uncorrected number of . The correction has no statistical uncertainty. The final formula is expressed as follows:
| (11) |
The systematic uncertainties were estimated taking into account two sources. The first group of effects is associated with the signal extraction procedure and the second with event and track quality cuts.
The considered sources of the systematic uncertainty and the corresponding modifications of the analysis method were the following:
-
(I)
The uncertainty due to the signal extraction procedure:
- (i)
-
(ii)
the initial value of the parameter of the signal function was changed by 8%,
-
(iii)
the initial value of the mass parameter of the Breit-Wigner distribution was changed by 0.3 MeV,
-
(iv)
the parameters , and describing the contribution of the templates in the fitting function (see Eq. (4)) were changed by 10%,
-
(v)
the value of the parameter of the signal function was fixed at the PDG value ,
-
(vi)
the value of the parameter of the signal function was fixed at the PDG value ,
- (vii)
-
(viii)
the invariant mass range over which the raw number of was integrated was changed from to and ,
-
(ix)
the raw number of was calculated as the sum of points (after 2nd order polynomial subtraction) instead of the signal integral.
-
(II)
The effects of event and track quality cuts were checked by performing the analysis with the following cuts changed compared to the original values:
-
(i)
the window in which off-time beam particles are not allowed was increased from s to s around the trigger particle,
-
(ii)
the cut on the -position of the interaction vertex was changed from cm to cm and cm,
-
(iii)
the standard cuts ( for and for ) were modified to for , for (narrower cut) and for , for (wider cut),
-
(iv)
the minimum required total number of points in all TPCs for decay products was changed from 30 to 25 and 35,
-
(v)
the minimum required number of clusters in both VTPCs for decay products was changed from 15 to 12 and 18,
-
(vi)
the impact parameter cuts for the tracks were turned off.
-
(i)
For each of the possible sources described above the partial systematic uncertainty was calculated as half of the difference between the lowest and the highest value obtained by varying the given parameter. Then, the final systematic uncertainty was taken as: . The contributions of uncertainties to the total uncertainty are negligible for I (ii), I (iii), and I (iv). The final systematic uncertainties are shown in the figures as light red shaded bands.
4 Results
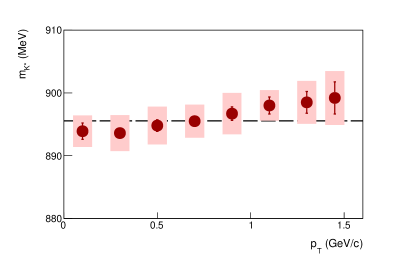
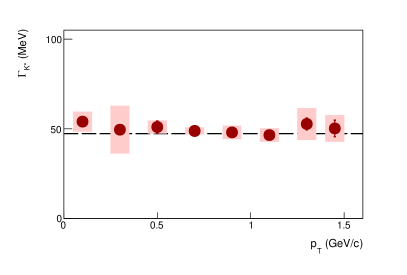
4.1 Mass and width of
The values of mass and width of mesons were extracted from the fits to background subtracted invariant mass spectra (see Sec. 3.6). They are presented in Fig. 8 in different transverse momentum bins (numerical data are listed in Table 2). The results are shown for the rapidity range . Within uncertainties, the values are consistent with information provided by the PDG. However, one observes a slight increase of the parameter with with an average close to the PDG value. The corresponding slope is significant since a large part of the shown systematic uncertainty is due to the magnetic field uncertainty (see below). The points (with their statistical uncertainties), presented in the left panel of Fig. 8, were fitted with a linear function resulting in the slope parameter value equal to 4.5 1.2. The change of the parameter with transverse momentum does not introduce a systematic variation of the yield since the parameter is fitted in each (, ) bin, and the signal integration range ( 380 MeV) is much larger than the change ( 6 MeV).
The magnetic field strength was verified with a precision of better than 1% by studying the and invariant mass distributions [40]. In order to check how the magnetic field calibration influences the results, the momentum components of decay products (kaons and pions) were varied by . Such a change did not affect width and yield significantly. However, the resulting changes of the mass parameter are equal or larger than uncertainties described in Sec. 3.10, and they were taken into account in the calculation of the final uncertainty of the mass parameter shown in Fig. 8 (left) and Table 2.
The comparison of mass and width of mesons with other experiments is shown in Sec. 5.
| (\GeVc) | (MeV) | (MeV) |
| (0.0;0.2) | ||
| (0.2;0.4) | ||
| (0.4;0.6) | ||
| (0.6;0.8) | ||
| (0.8;1.0) | ||
| (1.0;1.2) | ||
| (1.2;1.4) | ||
| (1.4;1.5) |
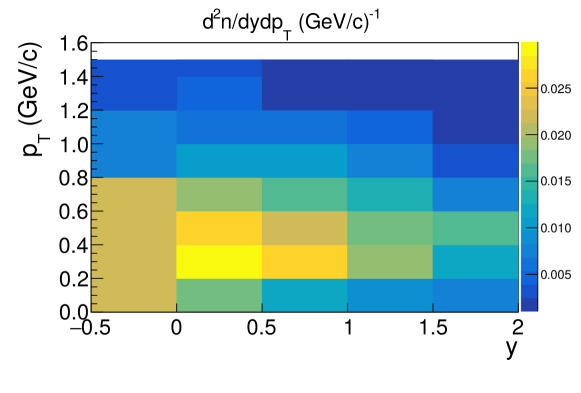
4.2 Double-differential spectra
The double-differential yields of mesons in inelastic p+p interaction at 158 \GeVcin bins of () are presented in Fig. 9. The numerical values with statistical and systematic uncertainties are presented in Table 3.
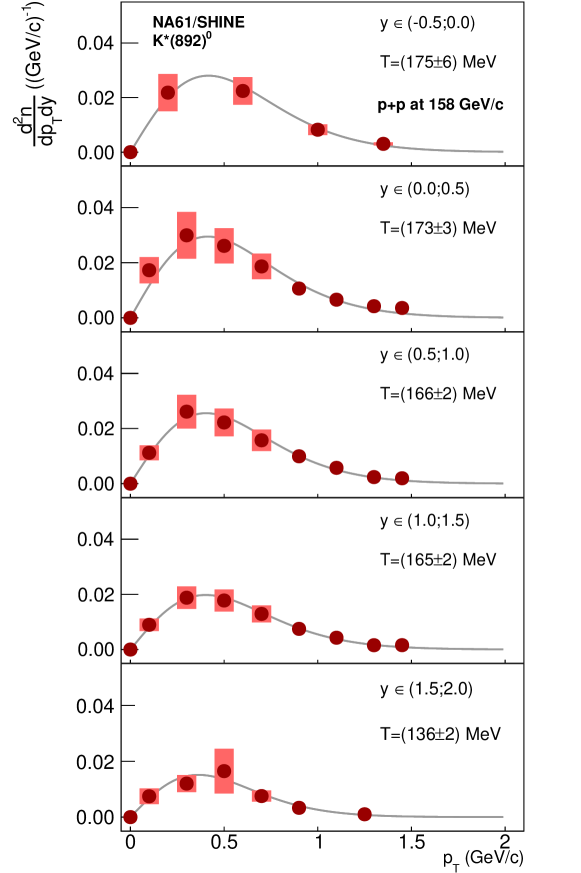
4.3 Transverse momentum and transverse mass spectra
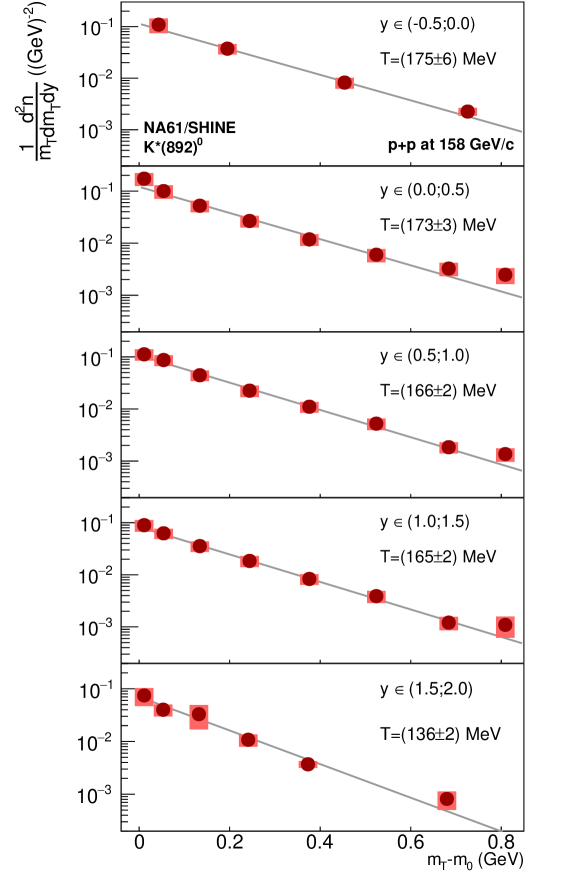
Figure 10 shows the double-differential yields of mesons as function of presented for separate rapidity bins. The corresponding numerical values are listed in Table 3.
In order to measure the inverse slope parameter of transverse momentum spectra and to estimate the yield of mesons in the unmeasured high region, the function:
| (12) |
was fitted to the measurements shown in Fig. 10. The inverse slope parameters obtained from the fits are cited in the figure legends.
| (\GeVc) | (-0.5;0.0) | (0.0;0.5) | (0.5;1.0) |
| (0.0;0.2) | 21.8 1.3 6.7 | 17.28 0.76 4.7 | 11.21 0.35 2.6 |
| (0.2;0.4) | 29.94 0.98 8.4 | 26.13 0.47 6.0 | |
| (0.4;0.6) | 22.4 1.6 5.0 | 26.11 0.85 6.3 | 22.21 0.49 4.9 |
| (0.6;0.8) | 18.65 0.71 4.6 | 15.74 0.41 3.8 | |
| (0.8;1.0) | 8.22 0.60 1.9 | 10.62 0.48 2.6 | 9.94 0.27 2.3 |
| (1.0;1.2) | 6.59 0.38 1.8 | 5.75 0.21 1.4 | |
| (1.2;1.4) | 3.04 0.32 0.51 | 4.22 0.25 1.2 | 2.39 0.15 0.56 |
| (1.4;1.5) | 3.58 0.33 1.2 | 1.97 0.21 0.55 | |
| (\GeVc) | (1.0;1.5) | (1.5;2.0) | |
| (0.0;0.2) | 8.97 0.26 2.2 | 7.46 0.26 2.7 | |
| (0.2;0.4) | 18.79 0.45 4.0 | 12.00 0.49 3.0 | |
| (0.4;0.6) | 17.78 0.43 3.9 | 16.47 0.48 7.9 | |
| (0.6;0.8) | 12.92 0.32 3.0 | 7.54 0.34 1.9 | |
| (0.8;1.0) | 7.49 0.28 1.7 | 3.32 0.25 0.47 | |
| (1.0;1.2) | 4.28 0.20 1.1 | 1.017 0.082 0.38 | |
| (1.2;1.4) | 1.57 0.14 0.44 | ||
| (1.4;1.5) | 1.59 0.16 0.68 | ||
The transverse mass () spectra were calculated based on spectra according to:
| (13) |
The results are shown in Fig. 11 and the numerical values are presented in Table 4.
| (GeV) | (\GeVc) | (-0.5;0.0) | (0.0;0.5) | (0.5;1.0) |
| 0.011 | (0.0;0.2) | 109.0 6.7 34 | 172.8 7.6 47 | 112.1 3.5 26 |
| 0.054 | (0.2;0.4) | 99.8 3.3 28 | 87.1 1.6 20 | |
| 0.134 | (0.4;0.6) | 37.4 2.6 8.3 | 52.2 1.7 13 | 44.42 0.97 9.9 |
| 0.244 | (0.6;0.8) | 26.6 1.0 6.5 | 22.48 0.59 5.5 | |
| 0.376 | (0.8;1.0) | 8.21 0.60 1.9 | 11.81 0.54 2.9 | 11.04 0.30 2.5 |
| 0.524 | (1.0;1.2) | 5.99 0.34 1.6 | 5.23 0.19 1.3 | |
| 0.684 | (1.2;1.4) | 2.25 0.23 0.38 | 3.25 0.19 0.91 | 1.85 0.11 0.43 |
| 0.809 | (1.4;1.5) | 2.47 0.22 0.81 | 1.36 0.15 0.38 | |
| (GeV) | (\GeVc) | (1.0;1.5) | (1.5;2.0) | |
| 0.011 | (0.0;0.2) | 89.7 2.6 22 | 74.6 2.6 27 | |
| 0.054 | (0.2;0.4) | 62.6 1.5 13 | 40.0 1.6 9.9 | |
| 0.134 | (0.4;0.6) | 35.57 0.85 7.8 | 32.95 0.96 16 | |
| 0.244 | (0.6;0.8) | 18.46 0.46 4.3 | 10.77 0.49 2.8 | |
| 0.376 | (0.8;1.0) | 8.33 0.31 1.8 | 3.69 0.27 0.52 | |
| 0.524 | (1.0;1.2) | 3.89 0.18 0.99 | 0.814 0.065 0.31 | |
| 0.684 | (1.2;1.4) | 1.21 0.11 0.34 | ||
| 0.809 | (1.4;1.5) | 1.09 0.11 0.47 | ||
For the mid-rapidity region () the inverse slope parameter of the transverse momentum spectrum was found to be equal to MeV, where statistical uncertainty (the first one) is equal to the uncertainty of the fit parameter, and the systematic uncertainty was estimated in the way described in Sec. 3.10. The NA49 experiment measured the parameter of the spectrum in the rapidity range and reported a value MeV [4].
4.4 -integrated and extrapolated rapidity distribution
The rapidity distribution was calculated by integrating and extrapolating (for the non-measured high- region) the spectrum:
| (14) |
where:
| (15) |
The parameters were taken from the corresponding plots in Fig. 10. The statistical uncertainties of -integrated and extrapolated values were calculated as follows:
| (16) |
The -integrated and extrapolated spectrum of mesons is plotted in Fig. 12 and the numerical values are listed in Table 5.
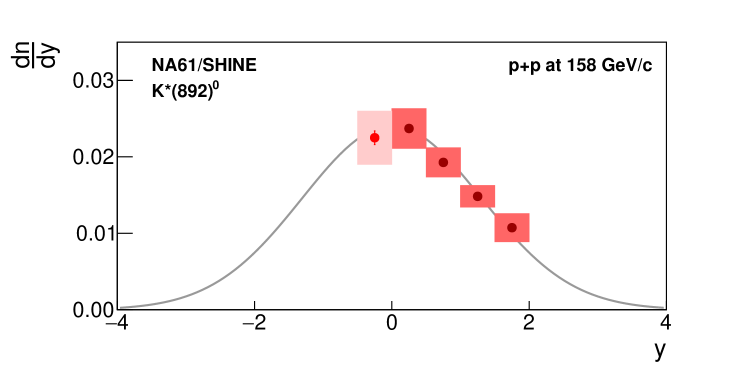
A Gaussian function:
| (17) |
was fitted to the data points to measure the width of the rapidity distribution. The first point with is plotted only to check the symmetry of the distribution and was not included in the fit. The fit was also used to determine the mean multiplicity (see Sec. 4.5 for details of the procedure). The statistical uncertainty of was taken from the fit and the systematic uncertainty was estimated in the way described in Sec. 3.10. The numerical values of and are listed in Table 5.
| (-0.5;0.0) | (22.50 0.89 3.5) |
| (0.0;0.5) | (23.71 0.37 2.6) |
| (0.5;1.0) | (19.27 0.20 1.9) |
| (1.0;1.5) | (14.83 0.17 1.4) |
| (1.5;2.0) | (10.73 0.22 1.8) |
| 1.31 0.15 0.09 | |
| (78.44 0.38 6.0) |
4.5 Mean multiplicity of
The mean multiplicity of mesons was calculated as the sum of measured points in Fig. 12 (the first point, with , was not included in the sum) and the integral of the fitted Gaussian function Eq. (17) in the unmeasured region assuming symmetry around :
| (18) |
where:
| (19) |
The statistical uncertainty of was obtained from the formula:
| (20) |
and the systematic uncertainty was estimated in the way described in Sec. 3.10.
The mean multiplicity of mesons, produced in inelastic p+p collisions at 158 \GeVc, is equal to (78.44 0.38 6.0) , where the first uncertainty is statistical and the second one is systematic.
5 Comparison with world data and model predictions
This section compares the \NASixtyOnemeasurements in inelastic p+p interactions at 158 \GeVcwith publicly available world data as well as with predictions from microscopic and statistical models.
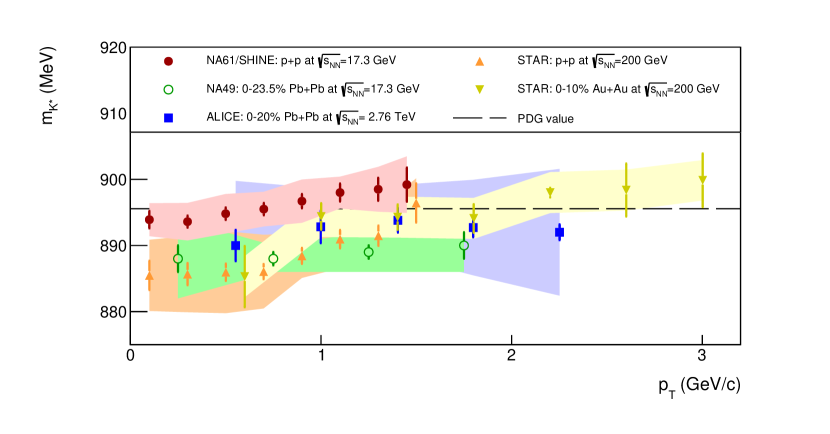
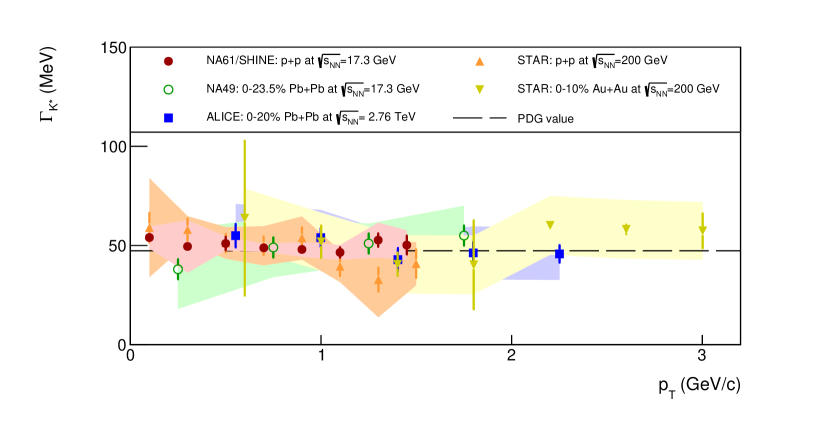
5.1 Mass and width of
Figure 13 shows the comparison of mass and width of mesons obtained in p+p interactions by \NASixtyOne, STAR (top RHIC energy), as well as in Pb+Pb and Au+Au collisions at SPS, RHIC and LHC energies. For the ALICE and STAR experiments the averaged measurements of and mesons are shown. One sees that among the available results (and within the range covered by the figure) the precision of the \NASixtyOnemeasurements is the highest and the results are very close to the PDG values. For p+p collisions the STAR experiment measured lower mass, especially at lower transverse momenta.
5.2 Comparison of rapidity spectra and yields with NA49 and \EposLong
The \NASixtyOnemeasurements of the rapidity spectrum and mean multiplicity were also compared to those predicted by the model of hadron production \EposLong [33]. The results are presented in Fig. 14 and the numerical values of the multiplicity are listed in Table 6. One sees that the \EposLongmodel overestimates production in inelastic p+p collisions at 158 \GeVc.
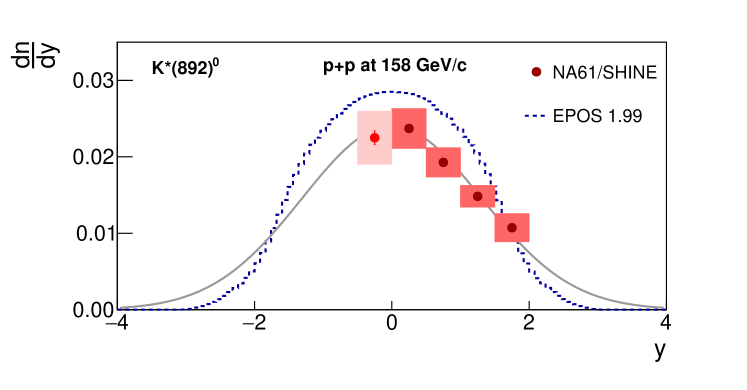
Table 6 also shows the comparison with the NA49 result [4] for the same collision system and beam momentum. Instead of analysing in separate bins, as in \NASixtyOne, the NA49 experiment used one wide bin ( \GeVc). The mean multiplicity of in NA49 was obtained as the integral under the Gaussian function in the range fitted to the distribution [27]. Within the uncertainties shown, the results of both experiments are consistent.
| \NASixtyOne, -integrated and extrapolated | ||
| NA49, in wide bin [4] | ||
| \EposLong, no binning | - |
5.3 System size dependence of at 158 and predictions of HGM
The statistical Hadron Resonance Gas Models (HGM) are commonly used to predict particle multiplicities in elementary and nucleus-nucleus collisions, using as adjustable parameters the chemical freeze-out temperature , the baryochemical potential , strangeness saturation parameter , etc. In the following the measured multplicities are compared with predictions of two HGM models described in Refs. [41, 42].
In Ref. [41] the HGM results for multiplicities were calculated for two versions of the model fits to particle yields. The first one, called fit B, allowed for strangeness under-saturation so the usual parametrization with was applied. For p+p interactions, the fit was carried out without including the multiplicities of and baryons. In the second fit, called A, the parameter was replaced by the mean number of strange quark pairs . For p+p collisions fit A was performed without the meson. For both fits predicted multiplicities were calculated in the Canonical Ensemble (CE) [41]. The measured mean multiplicity of in 158 \GeVcinelastic p+p interactions was divided by HGM predictions based on fit A and B and compared with the value found by NA49 [4]. The results are shown in Fig. 15 for p+p interactions, as well as C+C, Si+Si, and Pb+Pb collisions measured by NA49 [4]. In Ref. [41] the S-Canonical Ensemble (SCE) with exact strangeness conservation and grand-canonical treatment of electric charge and baryon number was used for the heavier C+C and Si+Si systems, and the Grand Canonical Ensemble (GCE) was assumed for Pb+Pb collisions. For C+C and Si+Si interactions all available particles were used in the HGM fits, including meson and multi-strange baryons. For Pb+Pb data only the measured yield was removed from the fitted multiplicities. Note that the centrality of Pb+Pb collisions used in the HGM fits was 0–5% whereas the values in NA49 were obtained for the 0–23.5% most central interactions. Therefore, the HGM yields had to be scaled by a factor corresponding to the respective number of wounded nucleons (see Table 8).
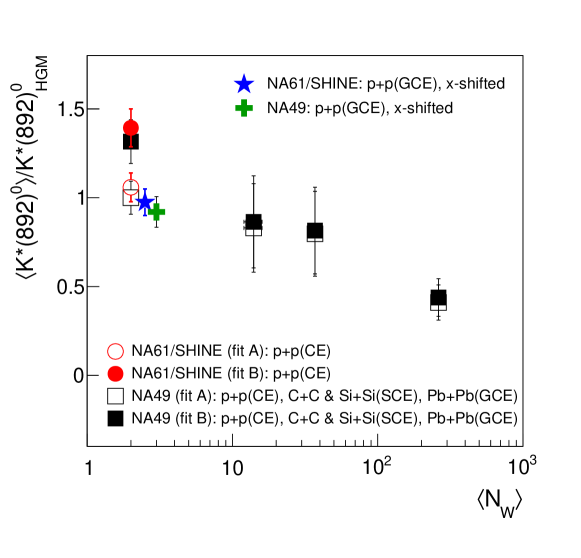
For heavier systems (including C+C and Si+Si), there is no significant difference between fit A and fit B, however the deviation between the HGM predictions and experimental data increases with increasing system size. The p+p measurements are very close to the HGM prediction but only in case of fit A, where the meson was excluded from the fit. In the most recent paper [42], where the HGM fits were done for the NA49 and the new \NASixtyOnemeasurement in p+p interactions, it is also stressed that at SPS energies the meson multiplicities in p+p collisions cannot be well fitted within the CE formulation of the HGM (the quality of CE fits becomes much worse when the meson yield is included). However, the mean multiplicity of mesons in inelastic p+p collisions at 158 \GeVccan also be compared to the HGM prediction based on the Grand Canonical Ensemble formulation [42]. The results for the NA49 and \NASixtyOnemeasurements are shown in Fig. 15 as closed cross and closed star symbols. Surprisingly, the GCE statistical model provides a good description of the yield in the small p+p system. The numerical values of the \NASixtyOnep+p measurement and the statistical models are presented in the Table 7. In Fig. 15 the total uncertainty of was taken as the square root of the sum of squares of statistical and systematic uncertainties. The uncertainty of the ratio shown on vertical axis was taken as the final uncertainty of divided by .
| or | |
| \NASixtyOne, -integrated and extrapolated | |
| HGM, Canonical Ensemble, fit A (no ) [41] | 74.1 |
| HGM, Canonical Ensemble, fit B (with ) [41] | 56.3 |
| HGM, Grand Canonical Ensemble (with ) [42, 43] | 80.5 |
5.4 over charged kaon ratios and time between freeze-outs
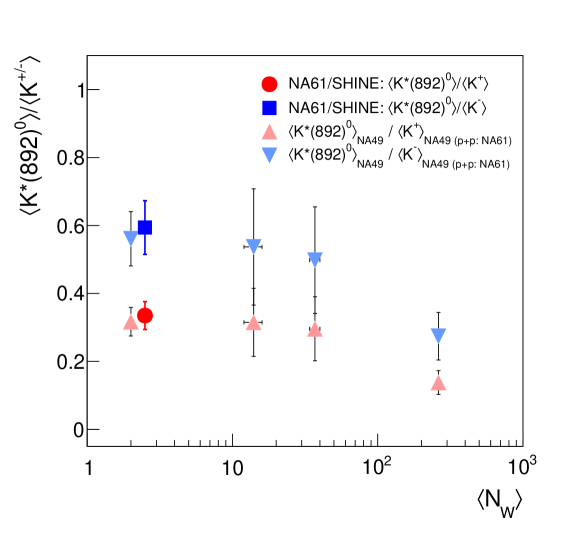
The to charged kaons ratios may allow to estimate the time interval between chemical and kinetic freeze-out in nucleus-nucleus collisions. The mesons have identical quark (anti-quark) content as mesons, but different mass and relative orientation of quark spins. Thus, the and ratios are considered as the least model dependent ratios for studying the production properties as well as the freeze-out conditions.
The system size dependence of the ratio at SPS, RHIC and LHC energies shows a strong decrease with increasing system size and/or multiplicity density (see Sec. 1 for a full list of references). The effect seems to be stronger at the SPS than at RHIC and LHC. Figure 16 presents this dependence at the SPS for the NA49 and \NASixtyOneresults at 158. The numerical values are given in Table 8.
| \NASixtyOne p+p =2 | 0.07840.0060 | 0.2340.022 [14] | 0.1320.014 [14] | 0.3350.041 | 0.5940.079 |
| NA49 p+p =2 | 0.07410.0069 [4] | from \NASixtyOne | from \NASixtyOne | 0.3170.042 | 0.5610.080 |
| NA49 15.3% C+C =142 [4] | 0.800.24 [4] | 2.540.25 [44] | 1.490.16 [44] | 0.310.10 | 0.540.17 |
| NA49 12.2% Si+Si =373 [4] | 2.200.66 [4] | 7.440.74 [44] | 4.420.44 [44] | 0.2960.094 | 0.500.16 |
| NA49 23.5% Pb+Pb =2626 [4] | 10.32.5 [4] | 74.55.1 (from scaling) | 37.62.6 (from scaling) | 0.1380.035 | 0.2740.070 |
| NA49 5% Pb+Pb =3625 [13] | – | 103.07.1 [13] | 51.93.6 [13] | – | – |
The \NASixtyOne and yield ratios for p+p interactions and the corresponding ratios in central Pb+Pb collisions from NA49 can be used to estimate the time interval between chemical and kinetic freeze-outs in Pb+Pb. Following Ref. [5]:
| (21) |
where:
-
-
the ratio in inelastic p+p interactions can be treated as the one at chemical freeze-out,
-
-
the ratio for central Pb+Pb (NA49) interactions can be used as the one at kinetic freeze-out,
-
-
is the mean lifetime of approximately 4.17 fm/c [35],
-
-
is the time interval between chemical and kinetic freeze-outs calculated in the rest frame.
Assuming that the losses of before kinetic freeze-out are due to rescattering effects and that there are no regeneration processes, the time between chemical and kinetic freeze-outs (in the resonance rest frame) can be estimated as 3.7 1.2 fm/ from the ratio and 3.2 1.2 fm/ from the ratio. These numbers correspond to 23.5% of the most central Pb+Pb interactions but the time is similar when using 5% of the most central events.
Following Ref. [12], the above times may be expressed in the collision center-of-mass reference system using the multiplicative Lorentz factor:
| (22) |
where can be used as an approximation for total momentum for the measurements at mid-rapidity. The NA49 experiment published the transverse momentum spectrum for 23.5% of the most central Pb+Pb interactions in the rapidity range [4]. The can be obtained from the fitted exponential function in the range \GeVc. The average transverse momentum of mesons was found to be 0.908 \GeVcthat results in . Finally, the Lorentz boosted time interval between chemical and kinetic freeze-outs can be estimated as 5.3 fm/ for the ratio or 4.6 fm/ for the ratio.
Similar calculations can be performed for the published RHIC ( \GeV) and LHC ( \GeV) data. In the STAR experiment at RHIC, the ratio was found to be for the 10% most central Au+Au collisions, and for p+p interactions [7]. Thus, the time between freeze-outs (calculated in the rest frame) is equal to 2.2 1.0 fm/. The average transverse momentum of mesons in Au+Au collisions at mid-rapidity () was found to be 1.09 \GeVc [7], which corresponds to 1.57. Therefore, the time interval between freeze-outs, determined in the collision center-of-mass reference system, can be estimated as 3.5 fm/. This value is smaller than the ones obtained at SPS.
In the ALICE experiment at LHC, the ratio was found to be for the 5% most central Pb+Pb collisions, and for p+p interactions [10]. Following Eq. (21), can be evaluated as 2.2 0.9 fm/. The of mesons in Pb+Pb collisions at mid-rapidity () was found to be 1.310 \GeVc [10], which corresponds to 1.77. Thus, at LHC energy, the time interval between freeze-outs, determined in the collision center-of-mass reference system, can be estimated as 3.9 fm/.
The above numbers may imply that, in central heavy ion collisions, the lifetime of the hadronic period of the fireball after chemical freeze-out is longer at SPS than at RHIC or even at LHC energies. One should, however, remember that such a conclusion is valid only under the assumption that there are no regeneration processes of mesons before kinetic freeze-out. As the regeneration may happen at all energies, the obtained time interval values should be considered as lower limits of the time between chemical and kinetic freeze-outs.
6 Summary
In this paper the \NASixtyOnemeasurement of meson production via its decay mode in inelastic p+p collisions at beam momentum 158 \GeVc( \GeV) was presented. The template method was used to extract raw signals. In this method the background is described as a sum of two contributions: background due to uncorrelated pairs modeled by event mixing and background of correlated pairs modeled by \EposLong. For production the template method was found to provide a better background description than the standard one which relies on mixed events only. The mass and width of the were extracted from the fits to background subtracted invariant mass spectra. Their values, for different transverse momentum bins, are close to the PDG results, however, a slight increase of the mass with transverse momentum can be observed.
With the large statistics of \NASixtyOnedata (52.53M events selected by the interaction trigger) it was possible to obtain double-differential transverse momentum and rapidity spectra of mesons. The full phase-space mean multiplicity of mesons, obtained from the -integrated and extrapolated rapidity distribution, was found to be , where the first uncertainty is statistical and the second one is systematic. The result agrees with the previous NA49 measurement for the same system and energy.
The \NASixtyOneresult was compared with predictions of statistical Hadron Resonance Gas models in Canonical and Grand Canonical formulations. Surprisingly, the GCE model provides a good description of the \NASixtyOnemeasurement of the multiplicity in p+p collisions. The CE model also agrees provided that the meson is excluded from the fits.
Finally, based on the previous results of NA49 from central Pb+Pb collisions and the new measurements of \NASixtyOneon p+p interactions, an attempt was made to estimate the time between chemical and kinetic freeze-outs in central Pb+Pb reactions at 158. This time was found to be larger than at RHIC, suggesting that either the system life-time between freeze-outs is indeed higher at SPS or the regeneration effects start to play a significant role at higher collision energies.
Acknowledgements
We would like to thank the CERN EP, BE, HSE and EN Departments for the strong support of NA61/SHINE.
This work was supported by the Hungarian Scientific Research Fund (grant NKFIH 123842/123959), the Polish Ministry of Science and Higher Education (grants 667/N-CERN/2010/0, NN 202 48 4339 and NN 202 23 1837), the National Science Centre Poland (grants 2011/03/N/ST2/03691, 2013/11/N/ST2/03879, 2014/13/N/ST2/02565, 2014/14/E/ST2/00018, 2014/15/B/ST2/02537 and 2015/18/M/ST2/00125, 2015/19/N/ST2 /01689, 2016/23/B/ST2/00692, 2017/25/N/ST2/02575, 2018/30/A/ST2/00226), the Russian Science Foundation, grant 16-12-10176, the Russian Academy of Science and the Russian Foundation for Basic Research (grants 08-02-00018, 09-02-00664 and 12-02-91503-CERN), the Ministry of Science and Education of the Russian Federation, grant No. 3.3380.2017/4.6, the National Research Nuclear University MEPhI in the framework of the Russian Academic Excellence Project (contract No. 02.a03.21.0005, 27.08.2013), the Ministry of Education, Culture, Sports, Science and Technology, Japan, Grant-in-Aid for Scientific Research (grants 18071005, 19034011, 19740162, 20740160 and 20039012), the German Research Foundation (grant GA 1480/8-1), the Bulgarian Nuclear Regulatory Agency and the Joint Institute for Nuclear Research, Dubna (bilateral contract No. 4799-1-18/20), Bulgarian National Science Fund (grant DN08/11), Ministry of Education and Science of the Republic of Serbia (grant OI171002), Swiss Nationalfonds Foundation (grant 200020117913/1), ETH Research Grant TH-01 07-3 and the Fermi National Accelerator Laboratory (Fermilab), a U.S. Department of Energy, Office of Science, HEP User Facility. Fermilab is managed by Fermi Research Alliance, LLC (FRA), acting under Contract No. DE-AC02-07CH11359.
References
- [1] J. Rafelski and B. Muller, “Strangeness Production in the Quark - Gluon Plasma,” Phys. Rev. Lett. 48, 1066 (1982) Erratum: [Phys. Rev. Lett. 56, 2334 (1986)] doi:10.1103/PhysRevLett.48.1066, 10.1103/PhysRevLett.56.2334
- [2] C. Markert, G. Torrieri and J. Rafelski, “Strange Hadron Resonances: Freeze-Out Probes in Heavy-Ion Collisions,” AIP Conf. Proc. 631, 533 (2002) doi:10.1063/1.1513698 [hep-ph/0206260]
- [3] C. Blume, “Is there Life after Hadronization? An Experimental Overview,” Acta Phys. Polon. B 43, 577 (2012) doi:10.5506/APhysPolB.43.577 [arXiv:1111.7140 [nucl-ex]]
- [4] T. Anticic et al. [NA49 Collaboration], “ and production in central Pb+Pb, Si+Si, C+C and inelastic p+p collisions at 158 GeV,” Phys. Rev. C 84, 064909 (2011) doi:10.1103/PhysRevC.84.064909 [arXiv:1105.3109 [nucl-ex]]
- [5] J. Adams et al. [STAR Collaboration], “ Resonance Production in Au+Au and p+p Collisions at = 200 GeV at RHIC,” Phys. Rev. C 71, 064902 (2005) doi:10.1103/PhysRevC.71.064902 [nucl-ex/0412019]
- [6] B. I. Abelev et al. [STAR Collaboration], “Hadronic resonance production in d+Au collisions at = 200 GeV at RHIC,” Phys. Rev. C 78, 044906 (2008) doi:10.1103/PhysRevC.78.044906 [arXiv:0801.0450 [nucl-ex]]
- [7] M. M. Aggarwal et al. [STAR Collaboration], “ production in Cu+Cu and Au+Au collisions at GeV and 200 GeV,” Phys. Rev. C 84, 034909 (2011) doi:10.1103/PhysRevC.84.034909 [arXiv:1006.1961 [nucl-ex]]
- [8] M. Nasim [STAR Collaboration], “Probing QCD matter via and resonance production at RHIC,” arXiv:1911.02270 [nucl-ex]
- [9] B. B. Abelev et al. [ALICE Collaboration], “ and production in Pb-Pb collisions at = 2.76 TeV,” Phys. Rev. C 91, 024609 (2015) doi:10.1103/PhysRevC.91.024609 [arXiv:1404.0495 [nucl-ex]]
- [10] J. Adam et al. [ALICE Collaboration], “K and meson production at high transverse momentum in pp and Pb-Pb collisions at = 2.76 TeV,” Phys. Rev. C 95, no. 6, 064606 (2017) doi:10.1103/PhysRevC.95.064606 [arXiv:1702.00555 [nucl-ex]]
- [11] D. S. D. Albuquerque [ALICE Collaboration], “Hadronic resonances, strange and multi-strange particle production in Xe-Xe and Pb-Pb collisions with ALICE at the LHC,” Nucl. Phys. A 982, 823 (2019) doi:10.1016/j.nuclphysa.2018.08.033 [arXiv:1807.08727 [hep-ex]]
- [12] S. Acharya et al. [ALICE Collaboration], “Evidence of rescattering effect in Pb-Pb collisions at the LHC through production of and mesons,” Phys. Lett. B 802, 135225 (2020) doi:10.1016/j.physletb.2020.135225 [arXiv:1910.14419 [nucl-ex]].
- [13] S. V. Afanasiev et al. [NA49 Collaboration], “Energy dependence of pion and kaon production in central Pb + Pb collisions,” Phys. Rev. C 66, 054902 (2002) doi:10.1103/PhysRevC.66.054902 [nucl-ex/0205002]
- [14] A. Aduszkiewicz et al. [NA61/SHINE Collaboration], “Measurements of , K± , p and spectra in proton-proton interactions at 20, 31, 40, 80 and 158 with the NA61/SHINE spectrometer at the CERN SPS,” Eur. Phys. J. C 77, no. 10, 671 (2017) doi:10.1140/epjc/s10052-017-5260-4 [arXiv:1705.02467 [nucl-ex]]
- [15] B. Abelev et al. [ALICE Collaboration], “Production of and in collisions at TeV,” Eur. Phys. J. C 72, 2183 (2012) doi:10.1140/epjc/s10052-012-2183-y [arXiv:1208.5717 [hep-ex]]
- [16] S. Acharya et al. [ALICE Collaboration], “ and production at midrapidity in pp collisions at = 8 TeV,” arXiv:1910.14410 [nucl-ex]
- [17] A. K. Dash [ALICE Collaboration], “Multiplicity dependence of strangeness and hadronic resonance production in pp and p-Pb collisions with ALICE at the LHC,” Nucl. Phys. A 982, 467 (2019) doi:10.1016/j.nuclphysa.2018.11.011 [arXiv:1807.07469 [hep-ex]]
- [18] S. Acharya et al. [ALICE Collaboration], “Multiplicity dependence of K*(892)0 and (1020) production in pp collisions at = 13 TeV,” arXiv:1910.14397 [nucl-ex]
- [19] A. Adare et al. [PHENIX Collaboration], “Measurement of and in , , and collisions at GeV,” Phys. Rev. C 90, no. 5, 054905 (2014) doi:10.1103/PhysRevC.90.054905 [arXiv:1405.3628 [nucl-ex]]
- [20] S. Acharya et al. [ALICE Collaboration], “Multiplicity dependence of light-flavor hadron production in pp collisions at = 7 TeV,” Phys. Rev. C 99, no. 2, 024906 (2019) doi:10.1103/PhysRevC.99.024906 [arXiv:1807.11321 [nucl-ex]]
- [21] M. Aguilar-Benitez et al., “Inclusive particle production in 400 GeV/c pp-interactions,” Z. Phys. C 50, 405 (1991) doi:10.1007/BF01551452
- [22] D. Drijard et al. [Annecy(LAPP)-CERN-College de France-Dortmund-Heidelberg-Warsaw Collaboration], “Production of Vector and Tensor Mesons in Proton Proton Collisions at .5 GeV,” Z. Phys. C 9, 293 (1981) doi:10.1007/BF01548764
- [23] T. Akesson et al. [Axial Field Spectrometer Collaboration], “Inclusive Vector - Meson Production in the Central Region of Collisions at GeV,” Nucl. Phys. B 203, 27 (1982) Erratum: [Nucl. Phys. B 229, 541 (1983)] doi:10.1016/0550-3213(83)90348-6, 10.1016/0550-3213(82)90475-8
- [24] A. Tefelska, PhD thesis, Faculty of Physics, Warsaw University of Technology, under preparation
- [25] N. Abgrall et al. [NA61 Collaboration], “NA61/SHINE facility at the CERN SPS: beams and detector system,” J. Inst. 9, P06005 (2014) doi:10.1088/1748-0221/9/06/P06005 [arXiv:1401.4699 [physics.ins-det]]
- [26] C. Hohne, private communication
- [27] C. Hohne, “System-Size Dependence of Strangeness Production in Heavy-Ion Collisions at 158 GeV,” PhD thesis, University of Marburg (2003), https://edms5.cern.ch/document/816035/1
- [28] N. Abgrall et al. [NA61/SHINE Collaboration], “Measurement of negatively charged pion spectra in inelastic p+p interactions at = 20, 31, 40, 80 and 158 GeV/c,” Eur. Phys. J. C 74, no. 3, 2794 (2014) doi:10.1140/epjc/s10052-014-2794-6 [arXiv:1310.2417 [hep-ex]]
- [29] A. Aduszkiewicz et al. [NA61/SHINE Collaboration], “Multiplicity and transverse momentum fluctuations in inelastic proton-proton interactions at the CERN Super Proton Synchrotron,” Eur. Phys. J. C 76, no. 11, 635 (2016) doi:10.1140/epjc/s10052-016-4450-9 [arXiv:1510.00163 [hep-ex]]
- [30] C. Bovet, R. Maleyran, L. Piemontese, A. Placci and M. Placidi, “The Cedar Counters for Particle Identification in the SPS Secondary Beams: A Description and an Operation Manual,” CERN-82-13, CERN-YELLOW-82-13
- [31] C. Strabel, “Evaluation of particle yields in 30 GeV proton-carbon inelastic interactions for estimating the T2K neutrino flux,” PhD thesis, Frankfurt University (2011), ETH-19538, CERN-THESIS-2011-295
- [32] A. Aduszkiewicz et al. [NA61/SHINE Collaboration], “Two-particle correlations in azimuthal angle and pseudorapidity in inelastic p + p interactions at the CERN Super Proton Synchrotron,” Eur. Phys. J. C 77, no. 2, 59 (2017) doi:10.1140/epjc/s10052-017-4599-x [arXiv:1610.00482 [nucl-ex]]
- [33] K. Werner, F. M. Liu and T. Pierog, “Parton ladder splitting and the rapidity dependence of transverse momentum spectra in deuteron-gold collisions at RHIC,” Phys. Rev. C 74, 044902 (2006) doi:10.1103/PhysRevC.74.044902 [hep-ph/0506232]
- [34] Web page of CRMC package, https://web.ikp.kit.edu/rulrich/crmc.html
- [35] M. Tanabashi et al. [Particle Data Group], “Review of Particle Physics,” Phys. Rev. D 98, no. 3, 030001 (2018) and 2019 update doi:10.1103/PhysRevD.98.030001
- [36] Web page of ROOT package, https://root.cern.ch
- [37] T. Pierog, private communication
- [38] A. Aduszkiewicz, “Energy dependence of negatively charged pion production in proton-proton interactions at the CERN SPS,” PhD thesis, University of Warsaw (2016), CERN-THESIS-2016-010
- [39] R. Brun, F. Carminati, “GEANT Detector Description and Simulation Tool,” CERN Program Library Long Writeup W5013 (1993)
- [40] N. Abgrall et al. [NA61/SHINE Collaboration], “Calibration and Analysis of the 2007 Data,” CERN-SPSC-2008-018 (2008)
- [41] F. Becattini, J. Manninen and M. Gazdzicki, “Energy and system size dependence of chemical freeze-out in relativistic nuclear collisions,” Phys. Rev. C 73, 044905 (2006) doi:10.1103/PhysRevC.73.044905 [hep-ph/0511092]
- [42] V. V. Begun, V. Vovchenko, M. I. Gorenstein and H. Stoecker, “Statistical hadron-gas treatment of systems created in proton-proton interactions at energies available at the CERN Super Proton Synchrotron,” Phys. Rev. C 98, no. 5, 054909 (2018) doi:10.1103/PhysRevC.98.054909 [arXiv:1805.01901 [nucl-th]]
- [43] V. V. Begun, private communication
- [44] C. Alt et al. [NA49 Collaboration], “System-size dependence of strangeness production in nucleus-nucleus collisions at = 17.3 GeV,” Phys. Rev. Lett. 94, 052301 (2005) doi:10.1103/PhysRevLett.94.052301 [nucl-ex/0406031]
- [45] T. Anticic et al. [NA49 Collaboration], “Inclusive production of charged kaons in p+p collisions at 158 GeV/c beam momentum and a new evaluation of the energy dependence of kaon production up to collider energies,” Eur. Phys. J. C 68, 1 (2010) doi:10.1140/epjc/s10052-010-1328-0 [arXiv:1004.1889 [hep-ex]]
The \NASixtyOneCollaboration
A. Aduszkiewicz 15, E.V. Andronov 21, T. Antićić 3, V. Babkin 19, M. Baszczyk 13, S. Bhosale 10, A. Blondel 23, M. Bogomilov 2, A. Brandin 20, A. Bravar 23, W. Bryliński 17, J. Brzychczyk 12, M. Buryakov 19, O. Busygina 18, A. Bzdak 13, H. Cherif 6, M. Ćirković 22, M. Csanad 7, J. Cybowska 17, T. Czopowicz 9,17, A. Damyanova 23, N. Davis 10, M. Deliyergiyev 9, M. Deveaux 6, A. Dmitriev 19, W. Dominik 15, P. Dorosz 13, J. Dumarchez 4, R. Engel 5, G.A. Feofilov 21, L. Fields 24, Z. Fodor 7,16, A. Garibov 1, M. Gaździcki 6,9, O. Golosov 20, V. Golovatyuk 19, M. Golubeva 18, K. Grebieszkow 17, F. Guber 18, A. Haesler 23, S.N. Igolkin 21, S. Ilieva 2, A. Ivashkin 18, S.R. Johnson 25, K. Kadija 3, E. Kaptur 14, N. Kargin 20, E. Kashirin 20, M. Kiełbowicz 10, V.A. Kireyeu 19, V. Klochkov 6, V.I. Kolesnikov 19, D. Kolev 2, A. Korzenev 23, V.N. Kovalenko 21, S. Kowalski 14, M. Koziel 6, A. Krasnoperov 19, W. Kucewicz 13, M. Kuich 15, A. Kurepin 18, D. Larsen 12, A. László 7, T.V. Lazareva 21, M. Lewicki 16, K. Łojek 12, B. Łysakowski 14, V.V. Lyubushkin 19, M. Maćkowiak-Pawłowska 17, Z. Majka 12, B. Maksiak 11, A.I. Malakhov 19, D. Manić 22, A. Marcinek 10, A.D. Marino 25, K. Marton 7, H.-J. Mathes 5, T. Matulewicz 15, V. Matveev 19, G.L. Melkumov 19, A.O. Merzlaya 12, B. Messerly 26, Ł. Mik 13, S. Morozov 18,20, S. Mrówczyński 9, Y. Nagai 25, M. Naskręt 16, V. Ozvenchuk 10, V. Paolone 26, O. Petukhov 18, R. Płaneta 12, P. Podlaski 15, B.A. Popov 19,4, B. Porfy 7, M. Posiadała-Zezula 15, D.S. Prokhorova 21, D. Pszczel 11, S. Puławski 14, J. Puzović 22, M. Ravonel 23, R. Renfordt 6, E. Richter-Wąs 12, D. Röhrich 8, E. Rondio 11, M. Roth 5, B.T. Rumberger 25, M. Rumyantsev 19, A. Rustamov 1,6, M. Rybczynski 9, A. Rybicki 10, A. Sadovsky 18, K. Schmidt 14, I. Selyuzhenkov 20, A.Yu. Seryakov 21, P. Seyboth 9, M. Słodkowski 17, P. Staszel 12, G. Stefanek 9, J. Stepaniak 11, M. Strikhanov 20, H. Ströbele 6, T. Šuša 3, A. Taranenko 20, A. Tefelska 17, D. Tefelski 17, V. Tereshchenko 19, A. Toia 6, R. Tsenov 2, L. Turko 16, R. Ulrich 5, M. Unger 5, F.F. Valiev 21, D. Veberič 5, V.V. Vechernin 21, A. Wickremasinghe 26,24, Z. Włodarczyk 9, O. Wyszyński 12, E.D. Zimmerman 25, and R. Zwaska 24
1 National Nuclear Research Center, Baku, Azerbaijan
2 Faculty of Physics, University of Sofia, Sofia, Bulgaria
3 Ruđer Bošković Institute, Zagreb, Croatia
4 LPNHE, University of Paris VI and VII, Paris, France
5 Karlsruhe Institute of Technology, Karlsruhe, Germany
6 University of Frankfurt, Frankfurt, Germany
7 Wigner Research Centre for Physics of the Hungarian Academy of Sciences, Budapest, Hungary
8 University of Bergen, Bergen, Norway
9 Jan Kochanowski University in Kielce, Poland
10 Institute of Nuclear Physics, Polish Academy of Sciences, Cracow, Poland
11 National Centre for Nuclear Research, Warsaw, Poland
12 Jagiellonian University, Cracow, Poland
13 AGH - University of Science and Technology, Cracow, Poland
14 University of Silesia, Katowice, Poland
15 University of Warsaw, Warsaw, Poland
16 University of Wrocław, Wrocław, Poland
17 Warsaw University of Technology, Warsaw, Poland
18 Institute for Nuclear Research, Moscow, Russia
19 Joint Institute for Nuclear Research, Dubna, Russia
20 National Research Nuclear University (Moscow Engineering Physics Institute), Moscow, Russia
21 St. Petersburg State University, St. Petersburg, Russia
22 University of Belgrade, Belgrade, Serbia
23 University of Geneva, Geneva, Switzerland
24 Fermilab, Batavia, USA
25 University of Colorado, Boulder, USA
26 University of Pittsburgh, Pittsburgh, USA