ALMA uncovers the [C ii] emission and warm dust continuum in a Lyman break galaxy
Abstract
We report on the detection of the [C ii] 157.7 m emission from the Lyman break galaxy (LBG) MACS0416_Y1 at , by using the Atacama Large Millimeter/submillimeter Array (ALMA). The luminosity ratio of [O iii] 88 m (from previous campaigns) to [C ii] is 9.3 2.6, indicative of hard interstellar radiation fields and/or a low covering fraction of photo-dissociation regions. The emission of [C ii] is cospatial to the 850 m dust emission (90 m rest-frame, from previous campaigns), however the peak [C ii] emission does not agree with the peak [O iii] emission, suggesting that the lines originate from different conditions in the interstellar medium. We fail to detect continuum emission at 1.5 mm (160 m rest-frame) down to 18 Jy (3). This non-detection places a strong limits on the dust-spectrum, considering the 137 26 Jy continuum emission at 850 m. This suggests an unusually warm dust component ( K, 90% confidence limit), and/or a steep dust-emissivity index (), compared to galaxy-wide dust emission found at lower redshifts (typically K, ). If such temperatures are common, this would reduce the required dust mass and relax the dust production problem at the highest redshifts. We therefore warn against the use of only single-wavelength information to derive physical properties, recommend a more thorough examination of dust temperatures in the early Universe, and stress the need for instrumentation that probes the peak of warm dust in the Epoch of Reionization.
keywords:
galaxies: formation - galaxies: high-redshift - galaxies: ISM1 Introduction
| UT start time | Baseline lengths | Upper LO frequency | Integration time | PWV | |
|---|---|---|---|---|---|
| (YYYY-MM-DD hh:mm:ss) | (m) | N | (GHz) | (min) | (mm) |
| 2018-09-08 09:07:17 | 15 - 783 | 43 | 203.313 | 45.7 | 1.1 |
| 2018-08-30 08:50:05 | 15 - 783 | 43 | 203.313 | 45.6 | 1.1 |
| 2018-08-22 14:06:36 | 15 - 457 | 43 | 203.313 | 45.6 | 0.6 |
| 2018-11-25 07:42:49 | 15 - 1398 | 43 | 204.298 | 45.1 | 0.6 |
| 2018-11-25 05:20:34 | 15 - 1398 | 43 | 204.298 | 45.1 | 0.7 |
| 2018-11-25 06:32:22 | 15 - 1398 | 43 | 204.298 | 45.1 | 0.7 |
Notes: Reading from the left, the columns are: Column 1 - The starting time of the complete observation run; Column 2 - The distance between nearest and furthest ALMA antennae; Column 3 - The number of integrating antennae; Column 4 - The centre frequency of the upper frequency band, which contained the [C ii] emission at 204.1 GHz; Column 5 - Total on-source integration time; Column 6 - The average precipitable water vapor during the observation run.
Forming a complete picture of star-formation through cosmic time is one of the main challenges of galaxy evolution studies (Madau & Dickinson, 2014). Our current understanding of star-formation at high redshifts () is mostly formed through rest-frame ultraviolet (UV) observations of Lyman-Break Galaxies (LBGs), which directly probe their stellar light (e.g. Bouwens et al. 2015; Finkelstein et al. 2015; McLeod et al. 2015; Oesch et al. 2016; Dunlop et al. 2017; Oesch et al. 2018). These recent UV observations of high-redshift LBGs suggest that most star-formation is not dust-obscured, due to the short amount of cosmic time that is available for its formation, its spatial distribution across the galaxy, and its inter-stellar medium (ISM) (Bouwens et al., 2016; Matthee et al., 2017).
The sensitivity of the Atacama Large Millimeter/submillimeter Array (ALMA) has allowed us to detect UV-selected high-redshift galaxies at submillimetre (sub-mm) wavelengths. Recent observations have revealed far-infrared spectral lines, such as bright doubly-ionized oxygen ([O iii] at 88.3 m) lines detected from LBGs out to redshifts around 8 to 9 (Laporte et al., 2017; Hashimoto et al., 2018, 2019; Tamura et al., 2019). The [O iii] line, however, only probes regions with strong UV radiation fields, close to hot O- and B-stars, which create high radiation pressures and ionized hydrogen (i.e. H ii Regions). A more complete description of the ISM requires multiple spectral line detections, each probing different phases due to their individual critical densities and temperatures. For example, the excitation energy of carbon lies slightly below the 13.6 eV required to ionize hydrogen. As such, carbon-ionizing radiation can also exist within neutral hydrogen, allowing fine-structure lines of singly-ionized carbon (2P3/2 to 2P1/2 transition of C+ at 157.7m) to be emitted from neutral hydrogen regions. In the local Universe, these regions extend over larger volumes than H ii regions, and combined with the prevalence of carbon, this causes the [C ii]-line to be one of the most important cooling lines for the dusty ISM (e.g. Stacey 2011). The bulk of the [C ii] emission line (70 percent according to Stacey et al. 1991; Stacey et al. 2010) is believed to originate from photodissociation regions (PDRs), and the remainder from X-ray-dominated regions (XDRs), cosmic-ray-dominated regions (CRDRs), ionized regions (H ii regions; Meijerink et al. 2007), low-density warm gas, shocks (Appleton et al., 2013) and/or diffuse H i clouds (Madden et al., 1997).
Similarly, ALMA has observed the dust continuum emission of galaxies out to redshifts of 8.38 (Watson et al., 2015; Laporte et al., 2017; Tamura et al., 2019). The amount of dust that exists at high redshifts is fundamentally constrained by the available cosmic time needed to form it. For instance, sources at = 8 have only had 500 million years to form all their dust and to enrich their ISM (Tegmark et al., 1997). This leaves only little time to form dust in the outer shells of AGB stars, and to increase the dust mass by accretion of the ISM (Ferrara et al., 2016). Dust size growth by accretion is also hindered by strong radiation fields, whose photo-ionizing effects make the dust particles become positively charged, causing them to repel each other (Ceccarelli et al., 2018). The only known dust resource would be supernovae (SNe), although dust mass estimates at high redshift require SNe to create dust at maximum efficiency (Asano et al., 2013; Gall et al., 2014; Michałowski, 2015; Leśniewska & Michałowski, 2019). Potentially, stars formed by pristine gas clouds, so-called Population III stars (Nozawa et al., 2014), could be an additional source of dust in the early universe both through the more traditional supernovae or during a potential red super-giant phase, however no such stars - or their tracers - have been confirmed by observations (Sobral et al., 2015, 2019; Bowler et al., 2017; Shibuya et al., 2018).
Thus, providing an adequate description of the ISM conditions, whilst also probing the dust emission properties, are important goals to our understanding of galaxy evolution in the early Universe (Dayal & Ferrara, 2018). This paper reports the detection of [C ii] and the stringent upper limit on the dust continuum emission at 1.5 mm of the Lyman-break galaxy MACS0416_Y1 at redshift 8.312. We describe the target and the observations in Section 2, and present the results in Section 3. We discuss the implications of the [C ii] line strength and lack of dust continuum at 1.5 mm in Section 4, where we also compare the present result against previously observed [O iii] and 850 m dust continuum. We present our conclusions in Section 5.
2 Target and Observations
2.1 Target and previous observations
The target, MACS0416_Y1, was initially identified as a bright -dropout galaxy at (Infante et al., 2015; Laporte et al., 2015, 2016; McLeod et al., 2015; Castellano et al., 2016; Kawamata et al., 2016; González-López et al., 2017a) lying behind the MACS J0416.12403 lensing cluster, one of the Hubble Frontier Fields (Lotz et al., 2017), with only a moderate magnification of = 1.43 0.04 (Kawamata et al., 2016).
Tamura et al. (2019) report the detection of the [O iii] 88 m line emission and 850 m dust continuum emission. The [O iii] emission confirmed the spectroscopic redshift at . The 850 m dust continuum is detected at 137 26 Jy, suggesting a de-lensed total infrared luminosity of LIR = (1.7 0.3) 1011 L⊙, assuming a modified blackbody with a dust-temperature of 50 K and an emissivity index of .111These results are summarised in Table 2.
They further report on a UV to far-infrared spectral energy distribution modelling, where they find a moderately metal-polluted young stellar component ( Myr, Z⊙, M∗ = 2.4 M⊙, assuming the Calzetti extinction law), with a star-formation rate (SFR) of around 60 M⊙/yr. However, an analytic dust mass evolution model assuming only a single episode of star-formation does not reproduce the metallicity and dust mass within these 4 Myr, suggesting a pre-existing evolved stellar component with a Mstar 3 109 M⊙ and an age 300 Myr, around half the age of the Universe at .
2.2 ALMA observations
The ALMA observations were initially carried out in August, September and November 2018 as a Cycle 5 program (Program ID: 2017.1.00225.S, P.I. Y. Tamura). We summarise the observations in Table 1. These observations were executed in the C43-1, -2, -3 and -4 configurations, with baseline lengths ranging from 15 to 1400 meters. The precipitable water vapour (PWV) ranges from 0.6 to 1.2 mm. The local oscillator frequency of the Band 5 receivers (Belitsky et al., 2018) was set from 200.5 GHz to 204.85 GHz, in order to cover the [C ii] 158 m line at = 8.31, which was expected at 204.10 GHz. In total, 272.2 minutes were spent effectively on-source. The phase-tracking center was set to the UV continuum position (, ) = (04h16m094010, 1635470). Two quasars, J03482749 and J04532807, were used for complex gain calibration, and another quasar, J05223627, was used for bandpass calibration.
The calibration and flagging were done using the standard pipeline running on CASA (McMullin et al., 2007) version 5.4.1. A CASA task tclean was used to combine all visibilities into an image, both for the continuum and the [C ii] emission, where the [C ii]-containing channels were omitted in the continuum image. The data cube was sampled at 35 km /s (23.3 MHz) to search for the [C ii] line feature. We used the natural weighting on the tclean task to maximize the point-source flux significance. We integrate the data cube between and +140 km/s around the [C ii] frequency to generate the [C ii]-integrated map222Integrating the data cube between larger velocity widths does not result in a significant increase in the integrated flux., resulting in a beam-size of 046 064 at a position angle of 77 degrees, and an r.m.s. noise of 9 mJy/beam. For the continuum map, the resulting beam-size is 059 078 at a position angle of 81 degrees, and r.m.s. noise is 6 Jy/beam. This and 140 km/s velocity range was chosen because it resulted in the highest signal-to-noise ratio for the [C ii] emission, and agrees with a by-eye inspection of the spectrum. Here, we calculate the r.m.s. noise from the off-source standard deviation of the maps.
3 Results
3.1 Detection of the [C ii] 158 micron emission
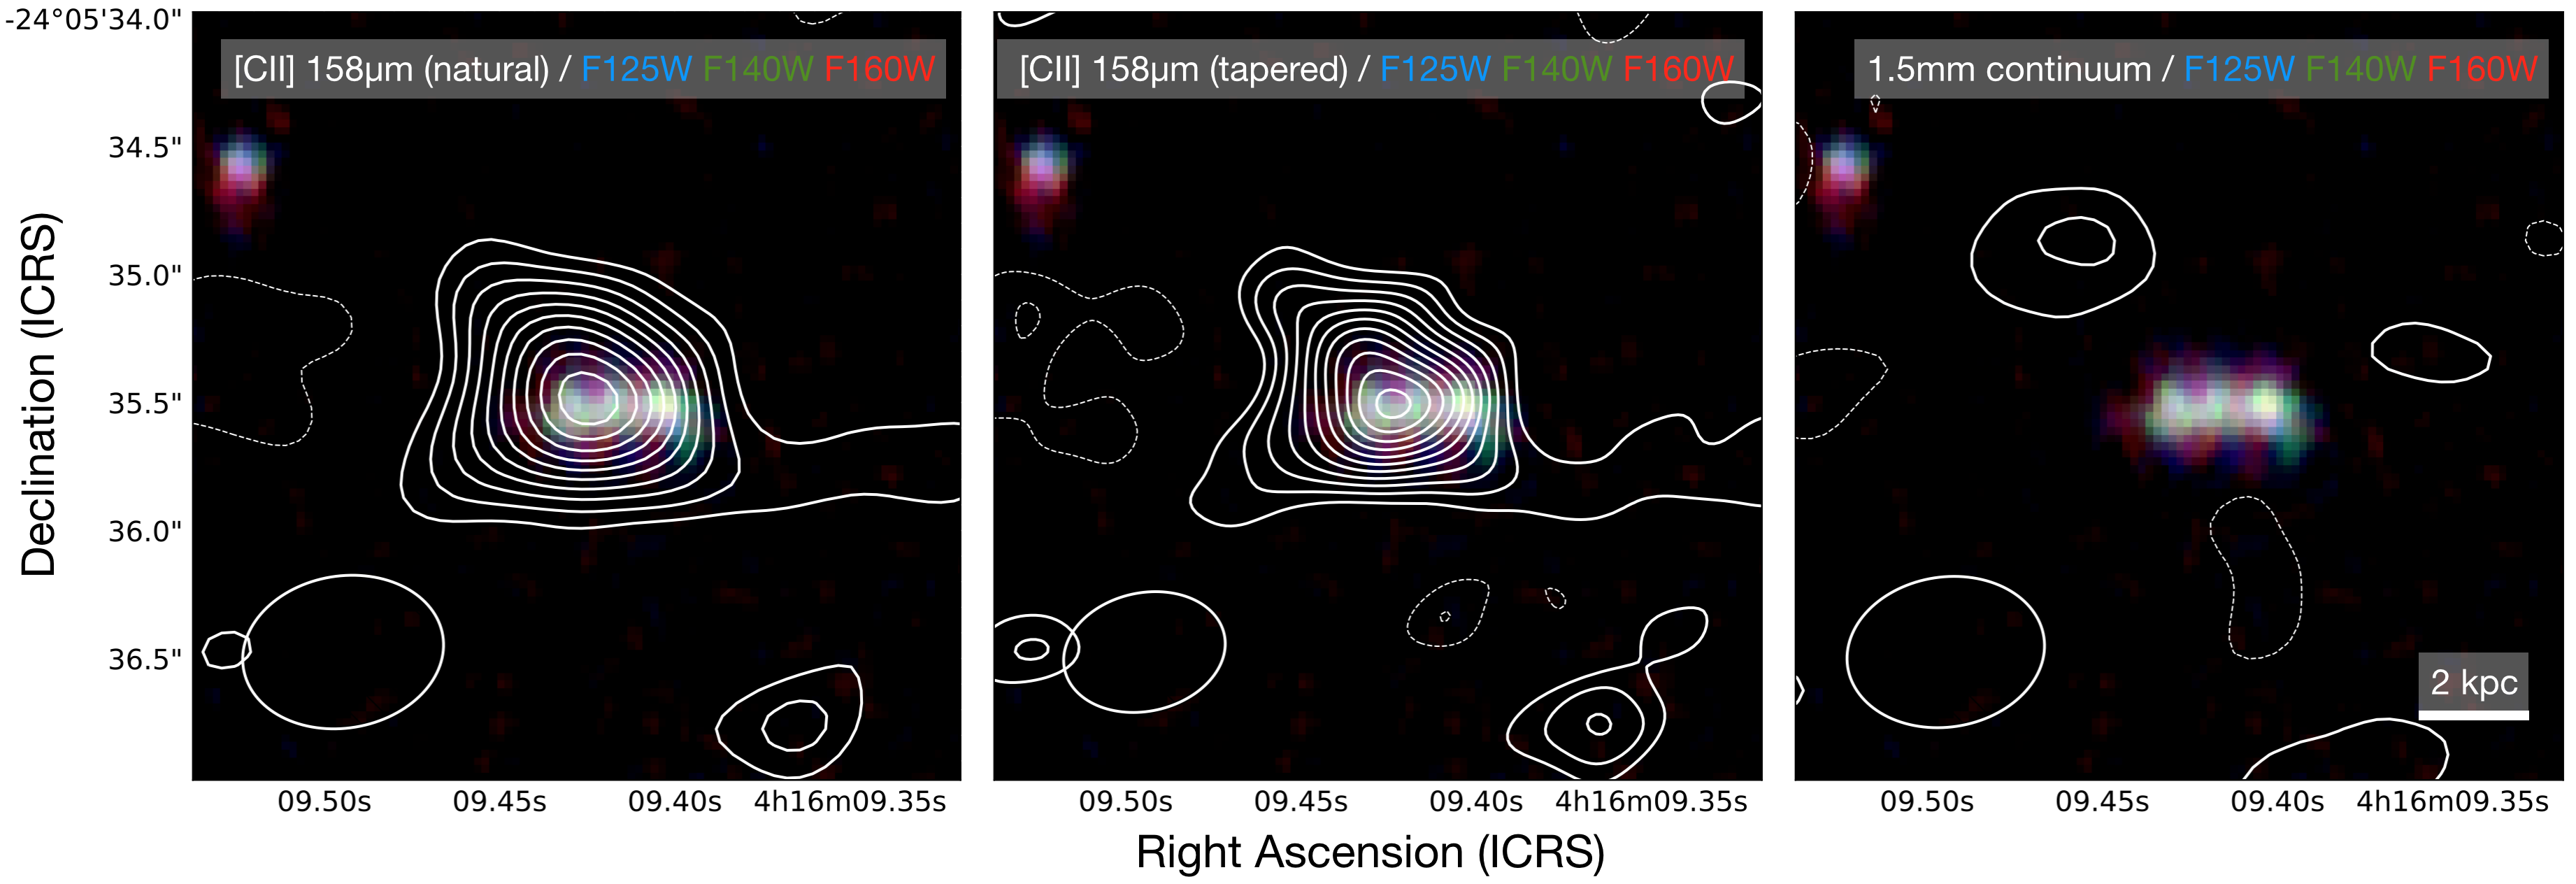
We detect the [C ii] 158 m emission at the position of MACS0416_Y1. Figure 1 shows the Hubble false-colour RGB image, overplotted with the contours of a naturally-weighted [C ii] map (left), a tapered [C ii] (middle), and the [C ii]-subtracted tapered continuum map (right). We create the tapered maps by convolving our naturally-weighted maps using a Gaussian kernel with a full-width at half maximum (FWHM) of 027. We find this FWHM size by maximizing the signal-to-noise of the [C ii] emission for all tapering sizes between 001 and 050, which covers the potential angular sizes of MACS0416_Y1 expected from the [OIII] emission. As noted in Tamura et al. (2019), the Hubble image appears to be a multi-component system, with eastern, central and western components. They note that the 90 m rest-frame dust continuum is centered on the eastern component, whilst the [O iii] 88m emission appears to be more centrally-located.333The astrometry of the Hubble images are set using GAIA stars.
We calculate the central position and total apparent flux by fitting a 2D Gaussian to the naturally-weighted integrated intensity image, since it has the best positional accuracy. The central position of the [C ii] emission is at RAICRS: 04h16m09426 and DECICRS: 0535470 with a positional uncertainty of . This position lies between the eastern and central component of MACS0416_Y1, which was also traced by the dust-component in Tamura et al. (2019). Deconvolution of the [C ii]-emission reveals a barely-resolved source-size of 0.48 0.14 by 0.16 0.25 arcsecond, at a position angle of 36 36 degrees, which agrees with the angular size found in the [O iii] observations, whilst non-axisymmetric spur-like structure is apparent in the image. This corresponds to a physical size of 2.3 0.7 by 0.8 1.2 kpc at .
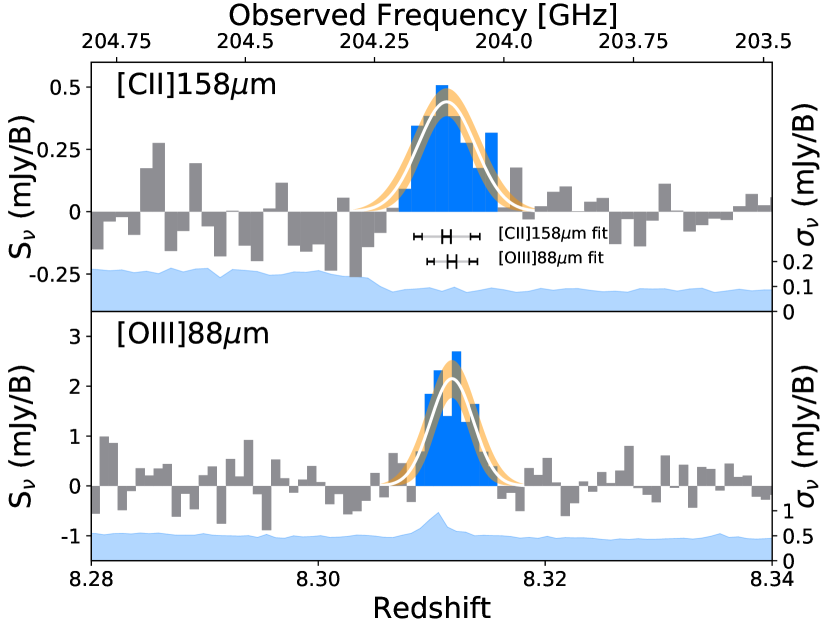
We use this 2D Gaussian fit to measure an apparent [C ii] flux of 130.2 20.4 mJy km/s on the naturally-weighted image. In order to maximise the signal-to-noise ratio of the spectrum and fitted line-profile, we taper the [C ii] map with a 0.27 arcsecond tapering size. The spectrum and a Gaussian fit to the spectrum are shown in Figure 2, where the top panel shows the [C ii] emission, and the bottom panel shows the [O iii] 88m emission from Tamura et al. (2019) in order to compare the line profiles. The filled area at the bottom of each panel represents the uncertainty in each frequency bin, whose axes are shown on the right-hand side of the figure. The two horizontal lines below the [C ii] line indicate the fitted average frequency and line width of both the [C ii] and [O iii] lines.
The best-fit Gaussian profile finds a central frequency at 204.1105 0.0082 GHz, indicating a redshift of 8.31132 0.00037. This central frequency of the [C ii]-line suggests a velocity offset from the [O iii]-line of 15 15 km/s. The combined [O iii] and [C ii] estimated redshift is = 8.31161 0.00023, calculated using
| (1) |
Here, is the redshift of line i, and is the uncertainty in line i. The [C ii] line width (FWHM) is 191 29 km/s, which is slightly larger than the line width measured for [O iii] (141 21 km/s), with a FWHM of 50 36 km/s, and could be due to the difference in regions where [O iii] and [C ii] are predominantly emitted. We derive the line luminosity using
| (2) |
from Solomon & Vanden Bout (2005), where is the velocity-integrated flux corrected for lensing, the luminosity distance, and the observed line frequency. We find (1.40 0.22) for the magnification-corrected [C ii] line luminosity. We do not account for the effect of the Cosmic Microwave Background (CMB) on the [C ii]-luminosity, as this is dependent on the properties of the [C ii]-emitting regions. The high dust temperature we find in Section 4.3 could suggest that the regions where [C ii] is emitted are also warm, significantly decreasing the CMB attenuation (Lagache et al., 2018). Moreover, the effect of the CMB on the [C ii] emission decreases at redshifts greater than 7, suggesting the effect of the CMB is minor. Laporte et al. (2019) reported on the non-detection of [C ii] from a LBG with a similar redshift ( = 8.38), though with only half the star-formation rate of MACS0416_Y1, and suggested the [C ii] luminosity could be under-estimated by a factor of 3 in the most extreme case of CMB attenuation using Lagache et al. (2018).
3.2 Upper-limit of 1.5 mm Dust Continuum
We did not detect the dust continuum emission at 1.5 mm (200 GHz) in either the tapered or naturally-weighted map, after we combine all the spectral windows, excluding the channels that contain the [C ii]-emission. We find a 3 upper limit of 18 Jy at 1.5 mm (160 m rest-frame). This is significantly lower than we expected from the 137 26 Jy dust continuum detected at 850 m (90 m rest-frame). In the case of a modified blackbody with a temperature of Tdust = 50 K and a dust-emissivity of = 1.5, we would expect a 1.5 mm flux of around 36 Jy, well above the detection limit (). We more thoroughly discuss the consequences of this non-detection in Section 4.3.
| Parameter | Value |
|---|---|
| Our observations | |
| ‡ | < 18 Jy (3) |
| FWHM1.5mm‡ | 059 078 |
| ‡ | 130.2 20.4 mJy km/s |
| v | 191 29 km/s |
| 8.31132 0.00037 | |
| (1.40 0.22) 108 | |
| Previous ALMA observations† | |
| ‡ | 137 26 Jy |
| FWHM850μm‡ | |
| ‡ | (2) Jy |
| ‡ | 660 160 mJy km/s |
| v | 141 21 km/s |
| 8.3118 0.0003 | |
| (1.2 0.3) 109 | |
† Values are from Tamura
et al. (2019).
‡ Not corrected for lensing magnification
4 Discussion
4.1 [O iii]-to-[C ii] luminosity ratio
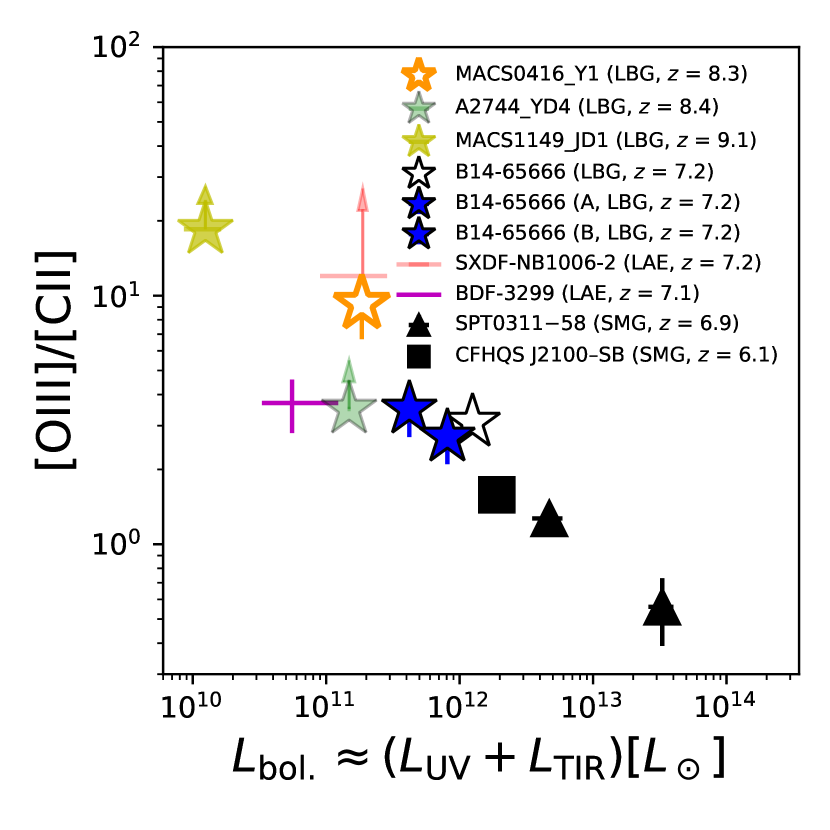
We compare the oxygen to carbon luminosity ratio to the total bolometric luminosity in Figure 3. Here, the [O iii] luminosity is from Tamura et al. (2019), who finds (1.2 0.3) 109 L⊙, resulting in a [O iii]-to-[C ii] luminosity ratio of 9.3 2.6, not taking CMB-dimming into account. The delensed UV luminosity of MACS0416_Y1 is 4.5 1010 L⊙, taken from Laporte et al. (2015). The far-infrared luminosity is 1.7 1011 L⊙, assuming Tdust = 50 K and a dust emissivity factor () of 1.5. While we show in Section 4.3 that this temperature is most likely higher, for fair comparison, we use this temperature for our far-infrared luminosity calculation, since all other sources have assumed dust temperatures in the range of 30 to 60 K.
We compare our galaxy against other high-redshift LBGs, Lyman- Emitters (LAEs) and sub-mm galaxies (SMGs) that have observations targeting both the [O iii] and [C ii] lines. Firstly, we use the [C ii] upper limits, combined with the far-infrared luminosities and [O iii] of the = 8.38 and 9.11 LBGs A2744_YD4 and MACS1149_JD1 (Laporte et al., 2019). We show the = 7.15 LBG B14-65666 as a single luminosity-averaged source, as well as its two resolved components, from Hashimoto et al. (2019). We show the upper limit for the = 7.2 LAE SXDF-NB1006-2 described in Inoue et al. (2016), and the = 7.1 LAE BDF-3299 detailed in Carniani et al. (2017). Finally, we also show three 6 SMGs, the eastern and western components of SPT0311-58, and CFHQS J2100-SB, described in Marrone et al. (2018) and Walter et al. (2018) respectively, in order to compare with more dusty and star-forming galaxies. We find a high [O iii]-to-[C ii] ratio for MACS0416_Y1, compared to other sources with detected [C ii] emission. We note that the downward trend in [O iii]-to-[C ii] for increasing bolometric luminosities, as mentioned in Hashimoto et al. (2019), appears consistent also for fainter sources (e.g. MACS1149_JD1).
Local dwarf galaxy studies (Cormier et al., 2015, 2019) find [O iii]-to-[C ii] luminosity ratios between 2 and 10 for these 0.02 to 1 Z⊙ galaxies. The low metallicity of high-redshift galaxies could thus be contributing to the high ratio, where the low metallicity allows hard radiation fields to extend over longer distances, which is necessary to produce [O iii] emission. The porosity of the neutral media in these high-redshift galaxies such as MACS0416_Y1 could also play a role, since the modeling of dwarf galaxies by Cormier et al. (2019) has showed that almost all dwarf galaxies have H ii regions that are directly exposed to the IGM, without shielding by a PDR. Simulations by Arata et al. (2019) suggest this porosity could be due to the shallow gravitational potential in the recently-formed dark-matter haloes of high-redshift LBGs such as MACS0416_Y1. Their simulations combine cosmological zoom-in hydrodynamic simulations and radiative transfer modeling to investigate three massive galaxies (and their satellites). The total halo masses of these galaxies range between 2.4 to 70 M⊙. For reference, assuming a baryonic mass of 1 M⊙ (Tamura et al., 2019), and a baryonic-to-dark matter ratio of 5-to-27, the halo mass of MACS0416_Y1 is expected to be 6 M⊙. They showed that this shallower gravitational potential allows stellar feedback to regulate star-formation, alternating between a galaxy in an infrared-luminous and a UV-luminous phase. During each phase, the spectrum is dominated either by emission from dust-obscured star-formation inside of PDRs during the infrared-luminous phase or by unobscured emission from exposed H ii regions with little dust obscuration during the UV-luminous phase. Each phase is characterized by a specific [O iii]-to-[C ii] ratio, where the dust-obscured phase has strong [O iii] emission, while the [O iii]-emission becomes faint rapidly during the UV-luminous phase (Arata et al., 2020).
Pallottini et al. (2019), and previously Pallottini et al. (2017a) and Vallini et al. (2017), have modelled the formation and evolution of several LBGs in the early Universe using cosmological zoom-in simulations, accounting for ISM evolution and using radiative transfer modelling. Their one-dimensional radiative transfer modelling showed that the efficiency of [C ii] emission (luminosity over mass) drops for extreme PDR densities greater than 104 cm-3. [C ii] emission from MACS0416_Y1 could also be suppressed by the photo-electric effect of UV photons on the dust, creating free electrons that remove ionized carbon from the ISM by recombination into neutral carbon. These findings are thus consistent with strong interstellar radiation fields, given both the relatively-low [C ii] emission from MACS0416_Y1, and with its warm dust temperature, as we will discuss in Section 4.3.
Simulations are, however, unable to accurately recreate the global [O iii]-to-[C ii] ratios seen in MACS0416_Y1 and other high-redshift galaxies. In Pallottini et al. (2019), small regions of their simulated galaxies show [O iii]-to-[C ii] ratios of around 10, but the global ratio of each galaxy is around 0.3. In their simulations, the most massive galaxy has a stellar mass of 4.2 109 M⊙. They do find that [C ii] is suppressed by the starburst-phase of the galaxy, disrupting and photo-dissociating the emitting molecular clouds around star-formation sites. The simulations by Katz et al. (2019) find only one galaxy with a [O iii]-to-[C ii] ratio greater than unity, although its star-formation rate is less than 1 M⊙/yr, and most galaxies with SFRs > 10 M⊙/yr have ratios ranging from 0.1 down to 0.02. Their simulations are based on a suite of cosmological radiation-hydrodynamics simulations centred on LBGs that follow from adaptive-mesh cosmological simulations assuming the Planck Collaboration et al. (2016) cosmology. These cosmological simulations evolve the inhomogeneities in temperature, density, metallicity, ionisation parameter and spectral hardness. Their three most massive sources range between 4 to 42 109 M⊙ at = 9.
Harikane et al. (2019) also finds a high [O iii]-to-[C ii] ratio for their sources, and they model the origins of this high ratio using the CLOUDY photo-ionization code (Ferland et al., 2017). Their detailed discussion of the potential causes of their high line ratio addresses (A) a higher ionization parameter, (B) a lower gas metallicity, (C) a higher gas density, (D) a lower C/O abundance ratio, (E) a lower PDR covering fraction, (F) CMB attenuation effects, (G) a spatially extended [C ii] halo, and (H) inclination effects. Their modelling suggests that the high [O iii]-to-[C ii] ratio of their sources, and of MACS0416_Y1, can be explained by either the higher ionization parameter (A) or the lower PDR covering fraction (E). Similarly, a combination of a higher gas density (C), a lower C/O abundance ratio (D) and the effect of the CMB (F) are adequate for explaining the high ratio of MACS0416_Y1. Their CLOUDY modelling is able to exclude the low metallicity (B) as an explanation for the high ratio of their sources and of MACS0416_Y1. The [C ii] flux of MACS0416_Y1 does not appear to increase for larger apertures, disqualifying missed [C ii] emission due to a spatially extended [C ii] halo (G) around MACS0416_Y1. Finally, the inclination effects (H) can be disqualified since this should affect both the [C ii] and [O iii] lines of MACS0416_Y1 to a similar extent, especially since the line profiles (Figure 2) suggest they lie in the same plane.
4.2 [C ii] line luminosity, profile and geometry
Line luminosity
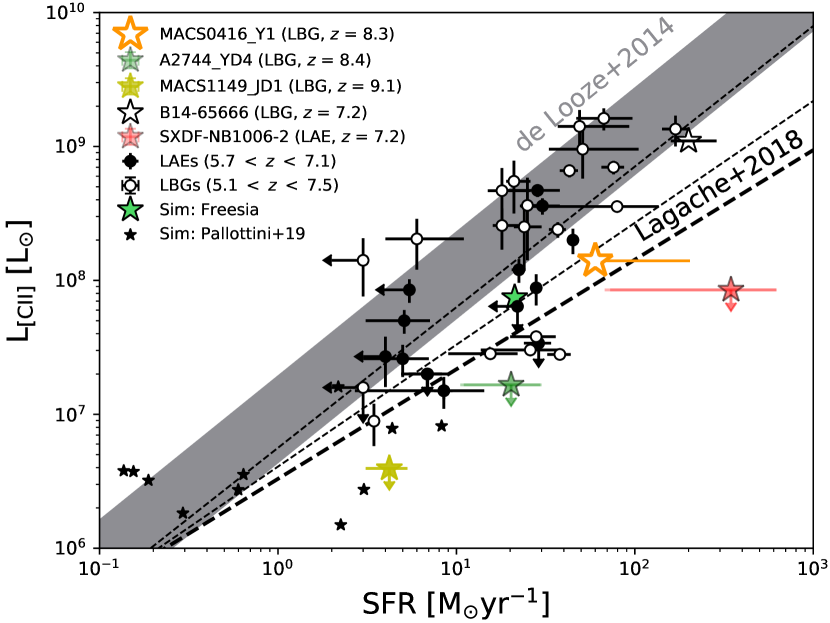
We plot the [C ii] line luminosity against the integrated (UV + IR) star-formation rate (SFR) in Figure 4, where we take the SFR for MACS0416_Y1 from Tamura et al. (2019). They assume a Chabrier IMF to calculate the total star-formation rate (Chabrier, 2003) using UV-to-FIR spectral modelling tool PANHIT444Panchromatic Analysis for Nature of HIgh-z galaxies Tool (PANHIT), http://www.icrr.u-tokyo.ac.jp/m̃awatari/PANHIT/PANHIT.html (Mawatari et al. 2016, Hashimoto et al. 2018, and Mawatari et al. 2020). We compare MACS0416_Y1 against high-redshift observations, simulations from Pallottini et al. (2019) and two [C ii]-SFRFIR scaling relations from de Looze et al. (2014) and Lagache et al. (2018). We show the [C ii] upper-limits and SFR-estimates of the = 8.38 and 9.11 LBGs A2744_YD4 and MACS1149_JD1 from Laporte et al. (2019), where the star-formation rate of the = 8.38 galaxy is calculated by MAGPHYS and of the = 9.11 is calculated using PANHIT model (Hashimoto et al., 2018). We show the = 7.15 LBG B14-65666 from Hashimoto et al. (2019), where the SFR is calculated using the same SED fitting model as MACS0416_Y1. We also show the upper limit for the = 7.2 LAE SXDF-NB1006-2 described in Inoue et al. (2016), and use the star-formation rate calculated using a Chabrier IMF, taken from Harikane et al. (2019). The high-redshift observations refer to a combination of 5.7 7.1 LAEs from Bradač et al. (2017); Carniani et al. (2017, 2018); Kanekar et al. (2013); Matthee et al. (2017); Ota et al. (2014); Smit et al. (2018) and 5.1 7.5 LBGs from Barisic et al. (2017); Capak et al. (2015); Jones et al. (2017); Knudsen et al. (2016); Schaerer et al. (2015); Willott et al. (2015). We compare against simulations by Pallottini et al. (2019), highlighting its most massive galaxy (Freesia, Mstar = 4.2 109 M⊙, Pallottini et al. 2017a, b). The de Looze et al. (2014) scaling relation is based on the star-formation rate derived from UV and mid-IR observations of both low-metallicity local dwarf galaxies. The Lagache et al. (2018) scaling relation is based on the combination of a semi-analytical model (G.A.S., Cousin et al. 2019) and the CLOUDY photo-ionization code (Ferland et al., 2017), where they assume PDRs are the dominant region where the [C ii] is emitted. Their redshift-dependent [C ii] scaling relation agrees with recently-observed, high redshift observations of UV- and blindly-selected sources, although the scaling relation has difficulty in reproducing the [C ii] emission from high-z sub-mm galaxies. Here, we show the scaling relation for (bold dashed line) and for to (thin dashed lines). For lower redshifts, this line steepens and rises.
The [C ii] emission of our LBG, MACS0416_Y1, appears fainter than predicted by the relation of de Looze et al. (2014). This is also seen for the other galaxies, which all appear to lie below the scaling relation from de Looze et al. (2014). The high-redshift LAEs and the simulated LBGs in Pallottini et al. (2019) also exhibit a deficit in the [C ii] emission, while this is not seen for actual observations of LBGs in general. The scaling relation by Lagache et al. (2018) agrees with our [C ii] luminosity, and appears to agree most of the LBGs and the LAEs. The relationship seems to under-predict the [CII] luminosity of the 5.1 z 7.5 LBGs (black-and-white circles), as well as for LBG B14-65666 (black star, Hashimoto et al. 2019).
The LAEs typically lie below the LBGs in Figure 4, except for the LBGs, such as MACS0416_Y1. Lyman- emission originates in hard radiation fields, which deplete the neutral medium, and therefore decrease the [C ii]-luminosity (Cormier et al., 2015, 2019). For increasing redshift, however, it becomes more difficult to detect this Ly- emission since the Universe is not yet ionized at those redshifts ( = 7.7 0.8, Planck Collaboration et al. 2018), and at , MACS0416_Y1 is likely located in a mostly-neutral inter-galactic medium. LBGs such as MACS0416_Y1 could thus more closely resemble lower redshift LAEs than LBGs.
The position of MACS0416_Y1, compared to the de Looze et al. (2014) scaling relation, agrees with the simulations by Pallottini et al. (2019). Their spatially-resolved simulations indicate that the larger molecular clouds shield the [C ii] efficiently, decreasing the [C ii] emission of these regions to around an order of magnitude below the expected behaviour from de Looze et al. (2014). Instead, the Lagache et al. (2018) scaling relation seems to agree with these simulations as well as MACS0416_Y1, and also reproduces the flatter slope in the [C ii]-SFR scaling relation seen in these simulations. The lack of [C ii] emission seen for the = 8.38 and = 9.11 LBGs (Laporte et al., 2019) could be due to the large scatter on the scaling relations ( 0.5 dex), or potentially due to inclination effects, where the added velocity-width of an edge-on galaxy pushes the line peak below the detection limit (e.g. Kohandel et al. 2019). CLOUDY modeling by Ferrara et al. (2019) attributes the lack of [C ii] luminosity compared to the local de Looze et al. (2014) scaling relation for MACS0416_Y1 and other galaxies to three factors, namely (i) bursty star-formation, causing high SFRs for their [C ii] luminosity, (ii) low metallicity, and (iii) low gas density. Only the first factor, bursty star-formation, applies to MACS0416_Y1, as both its star-formation rate and gas density are too high to cause a decrease in [C ii] luminosity. Bursty episodes of star-formation are also seen in modeling by Arata et al. (2019), and this burstiness produces a similar scatter on the [C ii]-SFR diagram as predicted by Ferrara et al. (2019) (Arata et al., 2020).
Velocity profile
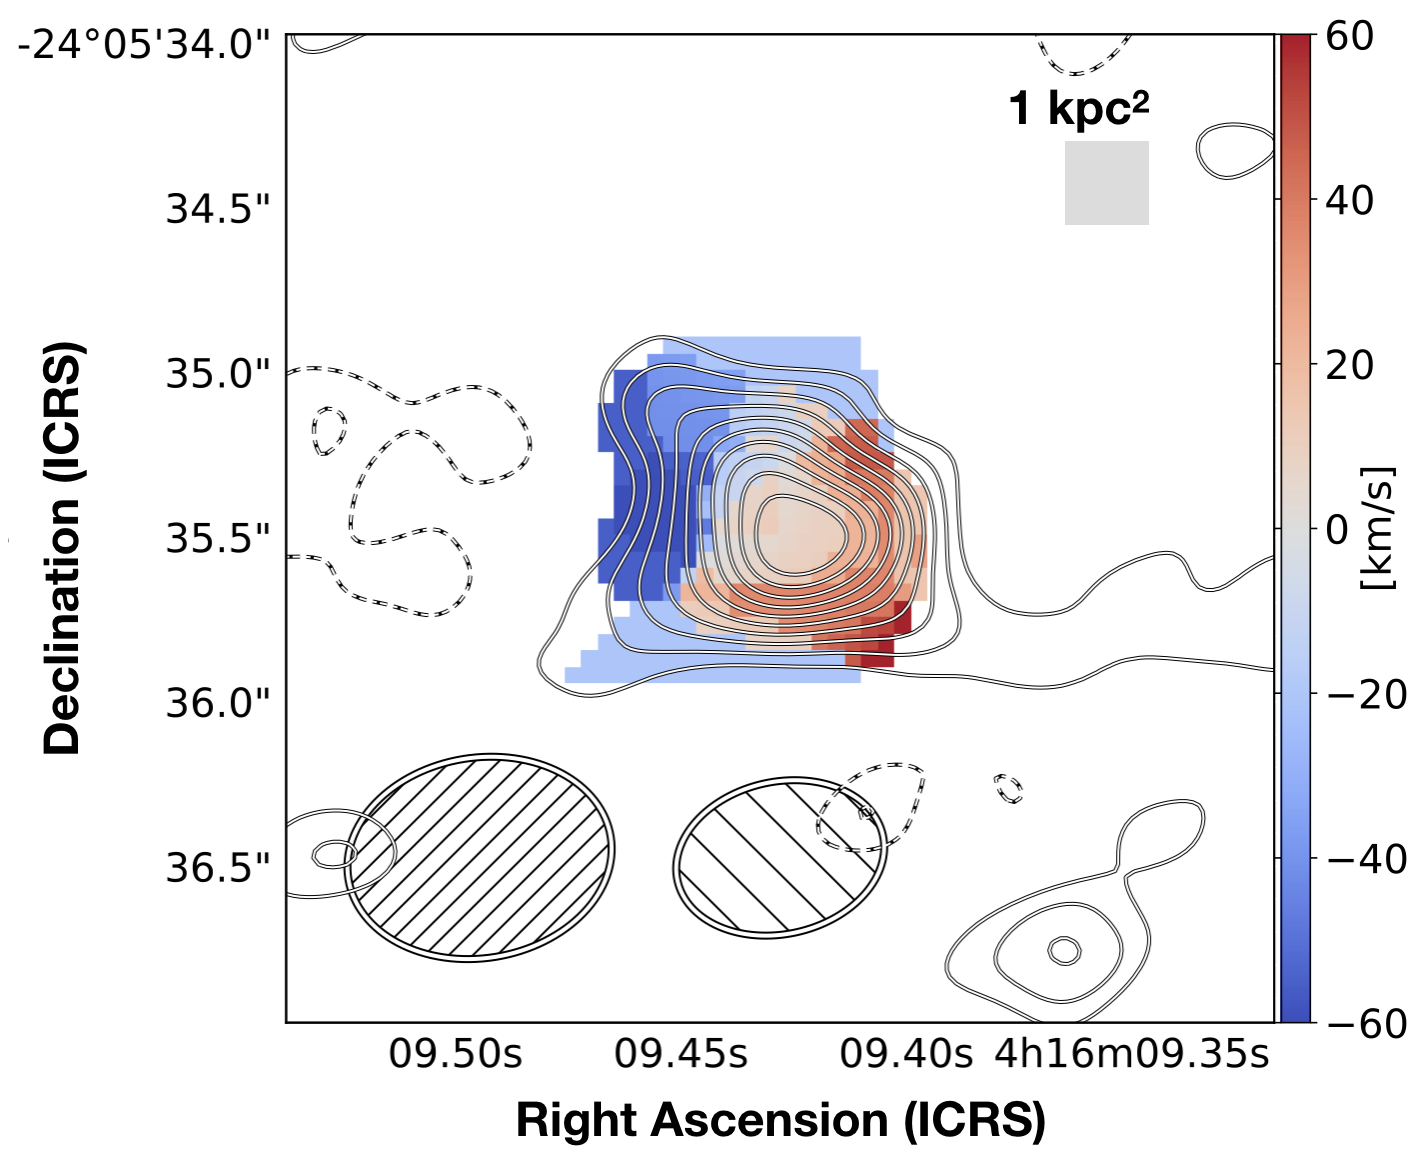
Observationally, one can classify star-forming galaxies into either rotation- or dispersion-dominated systems by their kinematic profile. Typically, rotation-dominated galaxies have v/2 > 0.4 (Förster Schreiber et al., 2009). Here v is the peak-to-peak velocity across the source, and is the line standard deviation. The high signal-to-noise ratio of our [C ii] emission allows us to look for a velocity gradient in the [C ii] emission. Figure 5 shows the velocity component of MACS0416_Y1, created with the immoments task within CASA. The peak-to-peak velocity is around 100 to 120 km/s. This results in v/2 0.6 to 0.7, suggesting a rotationally-dominated disc, similar to what was seen by Smit et al. (2018). They reported on two LBGs at 6.8, with masses around 1.4 to 1.7 109 M⊙.
From this, we can calculate the dynamical mass, , if we assume the virial theorem,
| (3) |
Here, is the half-light radius, is the gravitational constant, and the factor depends on various effects, such as line-of-sight projection, galaxy mass and the contributions from rotational and random motions. This value ranges from 2.25 for an average value of known galactic mass distribution models (Binney & Tremaine, 2008) to 6.7 for dispersion-dominated systems (Förster Schreiber et al., 2009). Given that MACS0416_Y1 is rotationally-dominated, we take to be 3.4 from Erb et al. (2006), which is derived for an average inclination angle of the disk, assuming a rotating system. Since our system is rotationally-dominated, we take the deconvolved major axis as the half-light radius, equalling 1.15 0.35 kpc.
We find a dynamical mass of (1.2 0.4) 1010 M⊙, although we note that the uncertainty in is not accounted for, and could vary by a factor of two. The UV-to-FIR modeling in Tamura et al. (2019) found a young stellar mass of 2.4 108 M⊙ (varying slightly from model to model), and their analytic galaxy evolution model, where dust mass evolution is taken into account, predicts an older stellar component with a mass of Mstar 3 109 M⊙ (Asano et al., 2013). This places the stellar-to-dynamical ratio around 25%, which is similar to Smit et al. (2018), and in line with the star-forming galaxies at (Erb et al., 2006; Gnerucci et al., 2011). The value is an order-of-magnitude larger than seen for a = 7.15 LBG (Hashimoto et al., 2019), although they only take the mass of the young stellar component into account. The galaxy evolution model of Tamura et al. (2019) further predicts a gas mass of M⊙, which is similar to the value we find with the kinematics, suggesting the enclosed mass is baryon-dominated.
Potentially, this apparent rotation could also be explained by other phenomena. For instance, the velocity gradient could also be a bi-polar outflow. This velocity gradient is in the same direction as the spur-like feature seen in the [C ii] emission, although it is along the major axis of the UV-image of the LBG. The distance of the peak positive velocity relative to the centre of the [C ii] emission is 3 kpc, not accounting for projection and lensing magnification effects. There, the typical escape velocity for a halo with a mass of M⊙ is around 85 km/s, which is of the same order as the peak positive velocity (60 km/s) enabling the possibility that the spur-like profile is a galactic outflow. This would agree with the feedback/outflow phase seen in simulations by Arata et al. (2019). Gas column densities in the outflowing regions of the simulated galaxies by Arata et al. (2019) range between 1 and 100 M⊙/pc2. Our current beam-width does not allow us to resolve the individual outflowing regions, however an outflow moving at 60 km/s stretching over 1 square kpc (indicated in Figure 5) with a gas column density of 10 M⊙ (typical in the range from Arata et al. 2019) would result an outflow-rate of 60 M⊙/yr. The outflow rate could thus equal or surpass the star-formation rate (i.e. a mass-loading factor of around or greater than unity), impacting the galaxy evolution at high redshift. There also exists observational indications for outflows at slightly lower redshifts, , which could support the outflow hypothesis for MACS0416_Y1. [C ii]-identified outflows have been suggested for star-forming galaxies (SFR between 10 and 70 M⊙/yr) in Fujimoto et al. (2019) by stacking the ALMA data of 18 galaxies. Similarly, among a sample of 118 normal star-forming galaxies at , Ginolfi et al. (2019) reports high-velocity tails ( 500 km/s) in the stacked [C ii] emission, observed by ALMA. These velocity tails are indicative of outflows, and appear more prominent among more actively-starforming galaxies ( M⊙/yr). This correlation confirms the star formation-driven nature of the outflows, however these [C ii]-line velocities are much larger than the 60 km/s seen in MACS0416_Y1.
The reverse scenario, the inflow of gas, could similarly explain the observed phenomena. However, at = 8.31, the pristine inter-galactic medium is unlikely to be enriched enough to be bright in [C ii] emission. Instead, it could be previously-ejected gas falling back in onto the galaxy, previously enriched by the older stellar population (Tamura et al., 2019). This would place the galaxy at the end of the feedback/outflow phase seen in the simulations by Arata et al. (2019), and would suggest an imminent starburst phase. In this scenario, the free-fall timescale would be around 9 Myr, assuming a total enclosed mass of 1 M⊙, and a radius of 2.3 kpc. The high dust temperature (see Section 4.3) does seem to contradict a late stage feedback/outflow scenario, since the warm dust (80 K) in the centre of the galaxy is expected to cool down efficiently, exacerbating the problem of the high dust temperature seen for MACS0416_Y1.
A final possibility is that this galaxy actually consists of multiple merging sources, smoothed over the beam size. This does agree with the multi-component nature seen in the rest-frame UV Hubble imaging. Currently, the most likely scenario seems a rotation-dominated disk given the observed velocity gradient, although future high-resolution observations of MACS0416_Y1, or a stacked spectrum of multiple LBGs, are required to confirm any of the above scenarios.
[C ii] geometry
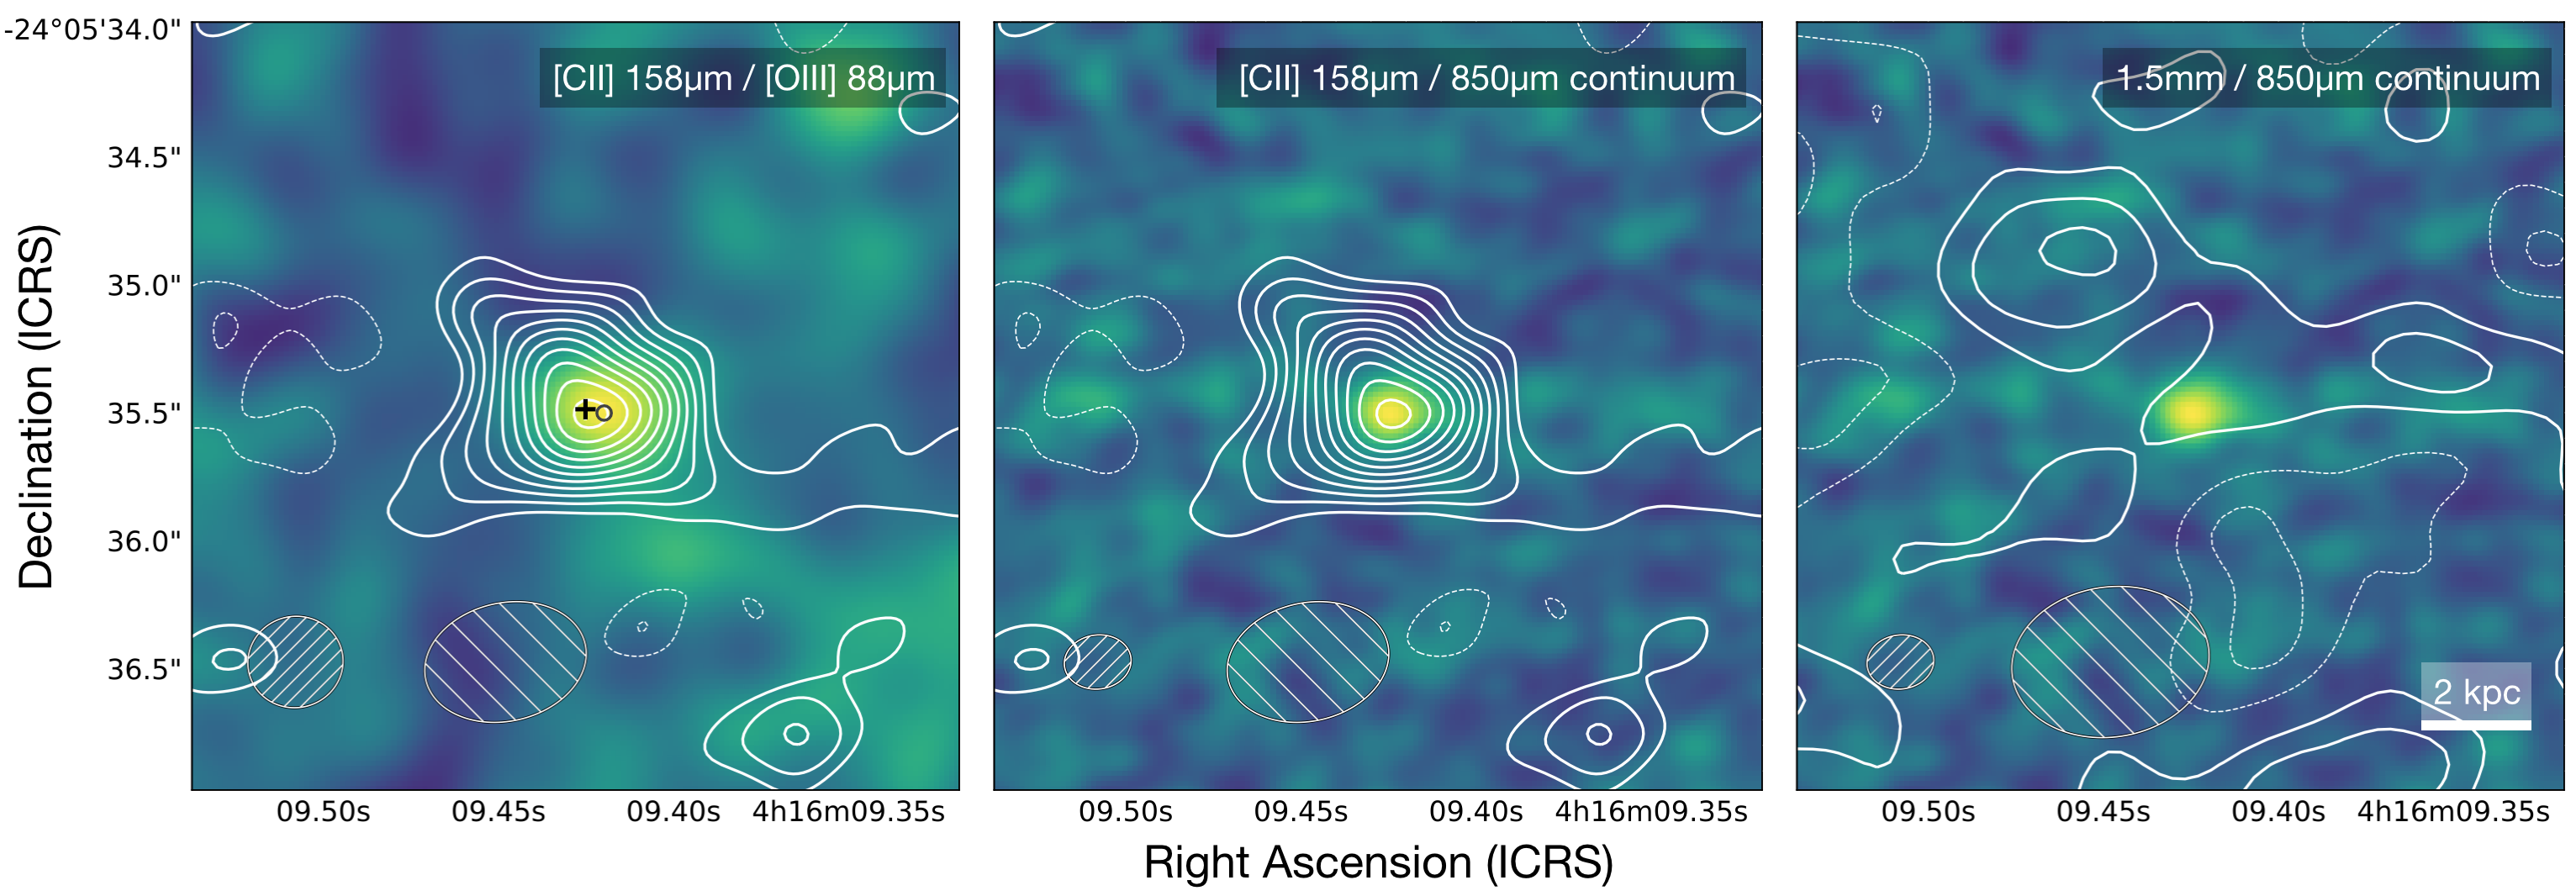
The left panel of Figure 6 shows the [C ii] emission as contours on top of the previously-observed [O iii] emission image. There appears to be a slight angular offset between the [C ii] and [O iii] emission, which could be due to the different place of origin. [C ii] predominantly emerges from PDRs, whereas [O iii] only exists within H ii regions.
The exact position of [O iii] from Tamura et al. (2019) is (, ) = (04h16m09420, 24∘0535495), which is 95 milli-arcseconds offset from the [C ii] emission, where both positions are measured by fitting a 2D Gaussian shape to the line emission. The systematic positional uncertainty in the astrometry for the [C ii] and [O iii] emission are around 20 and 6 milli-arcseconds, respectively. Combined with the positional uncertainties, this is a 2 offset, and if real, would equal a projected distance of 450 parsec.
Similar angular offsets have been seen both in previous observations and in simulations. Carniani et al. (2017) find more extended [C ii] emission, and a 1 kpc offset between the brightest [C ii] and [O iii] clump, for a normal star-forming galaxy at = 7.1. They find both the [C ii] and [O iii] emission are significantly offset (3 to 5 kpc) from the main rest-frame UV emission, find three [O iii] emission clumps with distinct relative velocities, and find the [C ii] emission consisting of a clumpy and an extended component. Recent simulations by Katz et al. (2019) show the positional distribution of infrared lines over a galaxy, and predict an offset between [C ii] and [O iii] due to their different clouds of origin (Carilli & Walter, 2013) at very high redshift (z 10). In one execution of their simulation, they find angular offsets between the peaks of [C ii] and [O iii] emission of 0.5 to 1 kpc. Similarly, recent work by Pallottini et al. (2019) sees a positional (1 kpc) and spectral (100 km/s) offset between [C ii] and [O iii] emission in their simulated galaxies. They show that this is both because [C ii] and [O iii] originate from different environments in the ISM, and because a more extended, but inhomogenous, distribution of [C ii] emission can shift the peak flux away from the peak [O iii] emission.
While we can expect a difference in velocity and velocity width of the [C ii] and [O iii] lines, the errorbars in Figure 2 show that the spectral lines do not appear to differ significantly. Quantitatively, the peak of each line is offset by 15 15 km/s, and the velocity width between the lines differs by 50 36 km/s.
The middle image of Figure 6 suggests the [C ii] emission originates in the same region as 850 m continuum emission. This is similar to what was seen in Pallottini et al. (2019), and in agreement with the statistical relations seen both for high-redshift sources (e.g. Smit et al. 2018) and sub-mm sources in general (e.g. de Looze et al. 2014).
4.3 The lack of 1.5 mm continuum emission
We had expected to detect the 160 m rest-frame emission from MACS0416_Y1, given the assumed spectrum from Tamura et al. (2019). Here, we analyse the significance of the non-detection, and provide explanations for the lack of continuum emission.
Fitting a spectrum
| = 1.5 | = 2.0 | = 2.5 | |||||||||
| Tz=0 | IR Lum. | Mdust | Tz=0 | IR Lum. | Mdust | Tz=0 | IR Lum. | Mdust | |||
| (K) | (1011 L⊙) | - | (106 M⊙) | (K) | (1011 L⊙) | - | (106 M⊙) | (K) | (1011 L⊙) | - | (106 M⊙) |
| 30 | 0.31 | 18.9 | 11 | - | 0.49 | 15.8 | 5.1 | - | 0.76 | 12.2 | 2.28 |
| 50 | 1.34 | 10.3 | 3.0 | - | 2.21 | 6.79 | 1.2 | - | 3.56 | 3.88 | 0.47 |
| 70 | 4.53 | 6.15 | 1.6 | - | 8.11 | 3.40 | 0.6 | - | 14.4 | 1.51 | 0.22 |
| 90 | 12.2 | 4.15 | 1.1 | - | 23.8 | 2.00 | 0.4 | - | 46.4 | 0.64 | 0.14 |
| 110 | 28.5 | 3.07 | 0.8 | - | 59.8 | 1.30 | 0.3 | - | 126.8 | 0.23 | 0.10 |
| 130 | 59.2 | 2.42 | 0.7 | - | 133.4 | 0.90 | 0.2 | - | 310.8 | 0.019 | 0.085 |
| 121 | 46.0 | 2.7 (90%) | 0.74 | 80 | 15.9 | 2.7 (90%) | 0.5 | 60 | 8.95 | 2.7 (90%) | 0.35 |
Notes: For each value of , reading from the left, the columns are: Column 1 - CMB-corrected dust-temperature; Column 2 - Far-infrared luminosity, not corrected for magnification, ; Column 3 - value, measuring quality of fit; Column 4 - Dust mass, not corrected for magnification. The bottom row shows the 90% lower limit on the dust temperature, far-infrared luminosity and dust mass for each , found by interpolating the to a value of 2.7 (Avni, 1976).
The basic theoretical description of a sub-mm spectrum of a dusty source is determined exclusively by the dust temperature and the dust-emissivity index, (e.g. Dunne & Eales 2001). At higher redshifts, the CMB becomes an important component in the heating of the dust. Throughout this analysis, we use the adjustment equations from da Cunha et al. (2013) to include the effects of CMB, both accounting for the CMB dust heating and the contrast of the emission against the CMB. This allows us to discuss CMB-corrected dust temperatures and observed flux densities, as though the source were affected by the CMB at redshift 0 (i.e. Tz=0, with TCMB = 2.73 K).
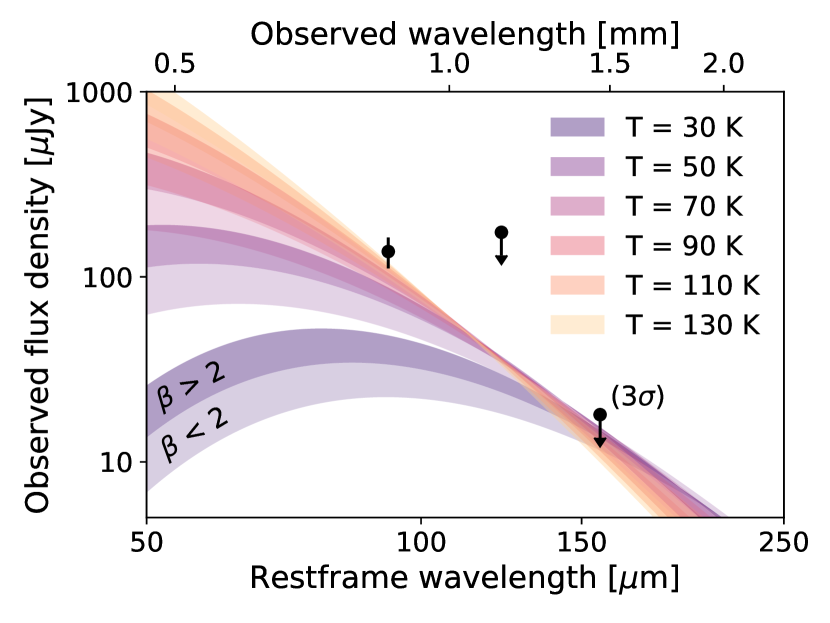
In Figure 7, we show the results from fitting a single-temperature modified blackbody with different for a range of possible temperatures. We fit these modified blackbodies by adjusting the normalization, , such that we minimize the chi-squared, . Our data are the single 850 m (rest-frame 90 m) continuum detection and two continuum upper limits at 1.1 and 1.5 mm (rest-frame 120 and 160 m). The 120 m non-detection is from a Band 6 ALMA project (P.I. F. Bauer, 2013.1.00999.S) aiming to constrain the photometry of sources behind strong-lensing clusters (González-López et al., 2017b). The 160 m non-detection, with an r.m.s. noise down to 6 Jy, provides a significant upper-bound on the dust parameter space probed by these observations. The upper limits are taken into account as discussed in Sawicki (2012), where an adjustment on the is demonstrated to be
| (4) |
In this equation, we calculate for over all non-detections j, and integrate the Gaussian flux distribution along flux, , up to the detection criterion, which is set to the measured standard-deviation () plus the value observed at the central position (). The adjustment to the measures the probability that the model-predicted value () is scattered below the detection limit due to random fluctuations.
The fitted spectra in Figure 7 appear to favour higher temperatures and -values, and the 1.5 mm continuum upper-limit seems to exclude any temperature less than 90 K for < 2, although for increasing > 2, slightly cooler temperatures are possible.
Table 3 quantifies the results, by showing the value for different fixed temperature and values, which we use as a measure of the fitting quality. Given the degeneracy between and temperature, we cannot fit these values directly, as this fit results in physically-unrealistic temperatures (e.g. Tdust 200 K or 4). Instead, we find the 90% confidence limit from the value. From Avni (1976), we use that a 90% confidence limit can be placed on a single varied parameter if the fitting of a model results in a value of 2.7. For each value of , we calculate the 90% lower limit for the dust temperature, which we show in the final row of the table. We linearly-interpolate the temperature for the two nearest values to 2.7 for each value of . This calculates the 90% lower limit on the temperature, luminosity and dust mass. The resulting from the two constraining data points (at 850 and 1500 m) agree with the visual analysis of Figure 7, suggesting dust temperatures 80 K for = 2. We estimate the dust mass according to equation 1 in Magdis et al. (2011),
| (5) |
Here, Sν is the observed flux density, is the luminosity distance, is the spectroscopic redshift, is the rest-frame dust mass absorption coefficient at the observed wavelength and is the black-body radiation expected for a [K] source at . The dust emissivity is assumed such that = ( /)β, where = 353 GHz, and = 0.15 m2/kg (Draine, 2003). The black-body emission is corrected for its contrast against the CMB, and the dust temperature is corrected for the heating by the CMB.
We note that the dust temperature has a significant impact on the dust mass. The magnified dust mass estimate in Tamura et al. (2019) from Band 7 ALMA observations is 5.6 106 M⊙. This dust mass is very temperature-dependent, where even the lower-limit on the dust temperature suggests magnified dust-masses of around 0.5 106 M⊙, a ten-fold decrease in dust mass from the estimate in Tamura et al. (2019). The effect of the dust emissivity coefficient, , on the dust mass is less strong, changing the dust mass by 50 per cent. We discuss the consequences of the variance in dust mass with dust temperature below.
Comparison of [C ii] emission to dust temperature
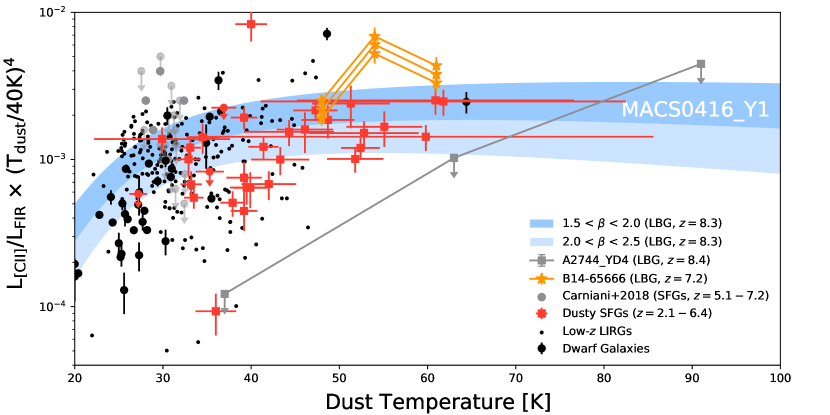
We show a modified version of the [C ii] to far-infrared luminosity ratio as a function of temperature for MACS0416_Y1 in Figure 8. Since the luminosity is very temperature-dependent, we use the temperature-corrected luminosity in order to compare the [C ii] to far-infrared luminosity ratio for MACS0416_Y1 over a large range of temperatures (20 - 100 K, Malhotra et al. 1997; Gullberg et al. 2015). We calculate this temperature-corrected ratio by multiplying the [C ii] to far-infrared luminosity ratio by the temperature normalised at 40 K to the fourth power.555We choose 40 K, similar to Gullberg et al. (2015), since this is a typical dust temperature in the local Universe, which ensures that the temperature-corrected luminosity ratios are of the same order as non-corrected ratios.
We compare our single-temperature fit of MACS0416_Y1 to high- and low-redshift sources. The temperatures of all the high-redshift galaxies are derived from either one or two wavelength observations. Hashimoto et al. (2019) provide the luminosity for three different and temperature values ([Tdust, ] = [48 K, 2.0], [54 K, 1.75], and [61 K, 1.5]) for the entire source B14-65666 ( LBG), and for the two separate components. The upper-limit on [C ii] emission of A2744_YD4 ( LBG) is shown for three different temperatures, since modeling by Behrens et al. (2018) suggests a significantly higher dust temperature (93 K) than the initial observations of Laporte et al. (2017) indicate (37 - 63 K). Furthermore, an ALMA Band-5 upper limit (Laporte et al., 2019) suggests a 3 dust temperature lower-limit of 43 K. Carniani et al. (2018) report the dust temperature, far-infrared luminosity, and [C ii] emission of 5 sources (and 16 upper limits) at = 5 to 7. The luminosity was calculated for a 30 K, = 1.5 single-temperature modified black-body, although for graphing purposes we plot them with temperatures ranging from 25 K to 35 K. Whilst the temperature in their analysis is fixed, the temperature-corrected luminosity ratio is similar across the temperature range, given the flatness of the blue fill, especially for higher temperatures. We show several dusty star-forming galaxies (DSFGs) at 2.1 6.4. These consist of twenty sources detected with the South Pole Telescope (SPT), and fourteen other DSFGs selected from various sub-mm/mm surveys (Gullberg et al., 2015). The low-redshift luminous infrared galaxies (LIRGs) are from the Great Observatories All-Sky LIRG Survey (GOALS) sample (Armus et al., 2009; Díaz-Santos et al., 2013), where we calculate the temperature using Eq. 2 in Díaz-Santos et al. (2017). The dwarf galaxies are from the Herschel Dwarf Galaxy Survey (Madden et al., 2013; Cormier et al., 2015).
We find a good agreement between the temperature-corrected [C ii]-to-FIR luminosity ratio for MACS0416_Y1 compared to other sources over a large range of potential dust temperatures. Our agreement with the previously-observed data does not depend on , as adjusting the from 1.5 to 2.5 only changes the luminosity ratio by a factor of 3. The graph further shows that the non-detection of A2744_YD4 (Laporte et al., 2019) does not appear to require a significantly-lower [C ii] luminosity than expected, especially when the temperature would be greater than 60 K, as a simulation in Behrens et al. (2018) indicated.
High or high dust temperature?
Table 3 suggests either a high dust emissivity index () or dust temperature ( K). Typical ULIRGs appear to have (Clements et al., 2018), and the Milky Way has an average around 1.6 (Planck Collaboration et al., 2014). Similarly, only a few of the galaxies in Figure 8 have dust temperatures beyond 50 K, and temperatures beyond 70 K appear out of the ordinary for anything but the recent simulation by Behrens et al. (2018) (e.g. Faisst et al. 2017).
The high-redshift nature of MACS0416_Y1 will almost certainly result in a different chemical composition of the ISM due to the restricted number of elemental pathways for nucleosynthesis, when compared to low-redshift galaxies that allow for pathways that require more time, such as lower-mass stars (e.g. Maiolino & Mannucci 2019). A different composition of dust grains could have caused a high in MACS0416_Y1. For example, Demyk et al. (2013) finds dust grain values ranging from 0.8 to 3, depending strongly on the specific chemical composition of the dust grains. They provide an overview of the physics of dust emission, studied both with theoretical models and in laboratory experiments. Furthermore, the dust has to, almost exclusively, rely on supernovae for its origin. At , the first stars have only been around for 500 Myr (Tegmark et al., 1997), so the time for 0.6 - 8 M⊙ stars to reach their AGB phase is restricted (100 Myr), and dust accretion growth is hindered by photo-ionization, the low metallicity and the restricted time.
MACS0416_Y1 would not be the first observed galaxy with a 2. For example, ALMA observations by Kato et al. (2018) indicate a = 2.3 0.2 in a Ly- blob at = 3.1. They suggest their high is due to the chemical composition (Demyk et al., 2013). In the local Universe, Smith et al. (2012) finds a high (3) in the galaxy core of Andromeda, and discusses its origin due to grain coagulation or icy mantles on the surface of grains in denser regions.
The dust produced in the initial episode of star formation in MACS0416_Y1, at around 15 (Tamura et al., 2019), could have been formed by Population iii stars (Nozawa et al., 2014). De Rossi et al. (2018) suggest that this interstellar dust created by Population III stars would be silicate-rich, and the resulting far-infrared spectrum would appear substantially warmer than expected. They are able to match their predicted SED to Haro 11, a local, moderately low-metallicity galaxy (0.25 Z⊙) undergoing a very young and vigorous starburst. These conditions suggest this galaxy approximates the relevant conditions for young Population III stars at high redshift. The existence of Population III stars has not been directly confirmed, however, and still remain controversial (e.g. Sobral et al. 2015, 2019; Bowler et al. 2017; Shibuya et al. 2018).
Of course, our observations of MACS0416_Y1 can only probe the dust that emits light, and therefore they probe the luminosity-weighted dust temperature (Scoville et al., 2016). Modeling by Behrens et al. (2018) showed that this might significantly differ from the mass-weighted dust temperature distribution, especially for high redshift sources. For the = 8.38 source A2744_YD4, they find the hot dust to be mostly situated around compact young stellar clusters, whose strong interstellar radiation fields heat the dust efficiently due to the small optical depth. In their case, only 25% of the dust is at Tdust > 60 K, but it contributes to more than 80% of the luminosity. Thus, perhaps we are only witnessing a small portion of the dust that is exceptionally warm, with the majority of the dust existing at lower temperatures.
The size of the dust grains could further impact the dust temperature we see for MACS0416_Y1. Since dust growth is potentially suppressed by photo-ionization and does not have the time to coagulate in the early Universe, dust grain sizes of high-redshift galaxies might be smaller than in the local Universe. Ferrara et al. (2017) find that the grain size could change the temperature of the dust, with an increase in average dust temperature from 45K for grains 0.1m to 60 K for grains smaller than 0.1m.
Computer models are also suggesting that the high dust temperatures in MACS0416_Y1 are not an anomaly. Simulations by Arata et al. (2019) also find that dust temperatures of galaxies could increase to 70 K, and that the star-forming central region of their simulated galaxy appears to have the hottest dust. Their analysis shows a time-variable far-infrared luminosity, and with it the temperature. Due to stellar feedback processes, the simulated galaxy oscillates between a dust-obscured star-forming galaxy and UV-dominated galaxy with a reduced star-formation rate. They also report on the difference between the mass- and luminosity-weighted dust temperature, and find a similar result as Behrens et al. (2018). The analytical model of primordial dust emission from De Rossi & Bromm (2019) also finds the central region to become brighter, relative to the total luminosity, for higher redshift galaxies. High redshift systems are more concentrated (i.e. higher dust densities in the centre), enhancing the heating efficiency by stellar radiation, and increasing the luminosity-weighted temperature.
Finally, the high temperature in MACS0416_Y1 agrees with the high [O iii]-to-[C ii] ratio we find, as well as the relatively-low metallicity (0.2 Z⊙) inside this galaxy. The correlation between dust temperature and [O iii]-to-[C ii] ratio was also seen in observations by Díaz-Santos et al. (2017) and Walter et al. (2018), who show a correlation between this ratio and the dust temperature at both low and high redshift. Faisst et al. (2017) finds an anti-correlation between the metallicity and dust temperature, by studying a selection of lower-redshift analogues of galaxies with low metallicity. This might not be a fair comparison, since (i) the dust temperatures of these sources do not exceed 60 K, (ii) the most significant high-redshift source in Walter et al. (2018) is a quasar, which could potentially influence the heating mechanisms and the origin of the [O iii] emission, and (iii) the [O iii]-to-[C ii] ratios of all sources in these studies range from 0.05 to 2.
Astronomical consequences
Our investigations of MACS0416_Y1 have only targeted the 90 and 160 m rest-frame emission, as the [O iii] 88m and [C ii] 158m spectral lines are the only available bright lines visible in the atmospheric windows. Due to the long integration times required to detect MACS0416_Y1 and other high-redshift sources, most studies present a far-infrared luminosity with a single assumed temperature (e.g. Watson et al. 2015 and Carniani et al. 2017). The luminosity varies significantly as a function of temperature, which not only poses a problem for the analysis in the previous section, but also for astronomical studies in general.
One of the main conclusions from Tamura et al. (2019) is the existence of an older stellar population in MACS0416_Y1, determined using a dust evolution model to explain its dust mass and metallicity. The increase in dust temperature, combined with the potential change in , can increase the per-mass luminosity of dust by 100-fold, as can be seen in Table 3, allowing the dust temperature to significantly impact the study of high-redshift objects in general. Moreover, the amount of dust seen in MACS0416_Y1 and other high-redshift galaxies (e.g. Hashimoto et al. 2019; Laporte et al. 2019) suggests an extreme dust-production scenario, where SNe have to produce dust at their maximum observed efficiency to reproduce the previously-observed dust masses (Leśniewska & Michałowski, 2019). The increase in dust temperatures reduces the required dust masses, and significantly relaxes the constraints on the dust production mechanisms at high redshift.
For MACS0416_Y1 in particular, the decrease in dust mass is not expected to significantly influence the age of the older stellar component (300 Myr). While both the high metallicity and high dust mass of MACS0416_Y1 seemed to require a high age (Tamura et al., 2019), lowering the dust mass would still leave an intact metallicity-based lower limit on the age. However, determining the effects of a decrease in dust temperature on the older stellar population requires extensive modelling using stellar population synthesis models and dust production mechanisms, which is beyond the scope of this paper.
The reduction of dust mass in MACS0416_Y1 and other high-redshift galaxies due to increasing dust temperatures and/or , however, does not mean that the dust-obscured star-formation becomes less important. Arguably, it becomes more important, as the dust spectrum would peak at shorter wavelengths ( 40 - 70 m), which still remain largely unprobed in the high-redshift Universe, both due to the lack of sensitive instrumentation (as well as atmospheric opacity) in this wavelength range, and the lack of bright spectral lines in this wavelength range (although [O iii] at 52m and [O i] at 63m are available). These spectral lines are often the main observational goal, where the dust continuum detection occurs almost serendipitously. We therefore advise towards a more thorough examination of dust temperatures in the early Universe, as well as the need for future instrumentation that can probe the peak of warm dust in the Epoch of Reionization, such as the planned Origins Space Telescope666https://asd.gsfc.nasa.gov/firs/ mission (Meixner et al., 2019).
5 Conclusions
We have detected the [C ii]-emission of an LBG at = 8.3116, and provide a stringent upper-limit on the 1.5 mm continuum emission. The [C ii]-emission compared to [O iii]-emission indicates strong interstellar radiation fields and/or a low PDR covering fraction, which is also seen for nearby dwarf galaxies with high [O iii]-to-[C ii] ratios. A spatial offset between the [C ii]- and [O iii]-emission suggests that the emission originates from a different part of the ISM. The [C ii]-emission traces the previously-detected 850 m dust continuum, suggesting it originates from the same ISM. The far-infrared to [C ii] luminosity ratio is in line with previously found ratios for sub-mm galaxies, suggesting a normal dusty ISM, when corrected for dust temperature. The velocity gradient across MACS0416_Y1 suggests it is a rotationally-dominated, with a low stellar-to-dynamical gas mass ratio, although we also discuss the potential of an outflow or inflow of gas.
No dust-continuum was detected at 1.5 mm down to 18 Jy (3). Combined with the 137 Jy dust continuum at 850 m, this indicates a significantly warmer dust component than local or mid-redshift galaxies, and would also necessitate a very high value of dust emissivity index () of 2, or potentially higher. We further discuss the risks of basing a far-infrared luminosity on one or two continuum measurements, and advise towards probing the short-wavelength part of the dust continuum.
Acknowledgements
This paper makes use of the following ALMA data: ADS/JAO.ALMA 2017.1.00225.S, 2016.1.00117 and 2013.1.00999.S. ALMA is a partnership of ESO (representing its member states), NSF (USA) and NINS (Japan), together with NRC (Canada), MOST and ASIAA (Taiwan), and KASI (Republic of Korea), in cooperation with the Republic of Chile. The Joint ALMA Observatory is operated by ESO, AUI/NRAO and NAOJ. We would like to thank Nicholas Laporte for his insightful comments. TB and YT acknowledge funding from NAOJ ALMA Scientific Research Grant Numbers 2018-09B and JSPS KAKENHI No. 17H06130. EZ acknowledges funding from the Swedish National Space Board. TO is financially supported by MEXT KAKENHI Grant (18H04333) and the Grant-in-Aid (19H01931). T.H. was supported by Leading Initiative for Excellent Young Researchers, MEXT, Japan.
References
- Appleton et al. (2013) Appleton P. N., et al., 2013, ApJ, 777, 66
- Arata et al. (2019) Arata S., Yajima H., Nagamine K., Li Y., Khochfar S., 2019, MNRAS, p. 1825
- Arata et al. (2020) Arata S., Yajima H., Nagamine K., Abe M., Khochfar S., 2020, arXiv e-prints
- Armus et al. (2009) Armus L., et al., 2009, PASP, 121, 559
- Asano et al. (2013) Asano R. S., Takeuchi T. T., Hirashita H., Inoue A. K., 2013, Earth, Planets, and Space, 65, 213
- Avni (1976) Avni Y., 1976, ApJ, 210, 642
- Barisic et al. (2017) Barisic I., et al., 2017, ApJ, 845, 41
- Behrens et al. (2018) Behrens C., Pallottini A., Ferrara A., Gallerani S., Vallini L., 2018, MNRAS, 477, 552
- Belitsky et al. (2018) Belitsky V., et al., 2018, A&A, 611, A98
- Binney & Tremaine (2008) Binney J., Tremaine S., 2008, Galactic Dynamics: Second Edition
- Bouwens et al. (2015) Bouwens R. J., et al., 2015, ApJ, 803, 34
- Bouwens et al. (2016) Bouwens R. J., et al., 2016, ApJ, 833, 72
- Bowler et al. (2017) Bowler R. A. A., McLure R. J., Dunlop J. S., McLeod D. J., Stanway E. R., Eldridge J. J., Jarvis M. J., 2017, MNRAS, 469, 448
- Bradač et al. (2017) Bradač M., et al., 2017, ApJ, 836, L2
- Capak et al. (2015) Capak P. L., et al., 2015, Nature, 522, 455
- Carilli & Walter (2013) Carilli C. L., Walter F., 2013, ARA&A, 51, 105
- Carniani et al. (2017) Carniani S., et al., 2017, A&A, 605, A42
- Carniani et al. (2018) Carniani S., et al., 2018, MNRAS, 478, 1170
- Castellano et al. (2016) Castellano M., et al., 2016, A&A, 590, A31
- Ceccarelli et al. (2018) Ceccarelli C., Viti S., Balucani N., Taquet V., 2018, MNRAS, 476, 1371
- Chabrier (2003) Chabrier G., 2003, PASP, 115, 763
- Clements et al. (2018) Clements D. L., et al., 2018, MNRAS, 475, 2097
- Cormier et al. (2015) Cormier D., et al., 2015, A&A, 578, A53
- Cormier et al. (2019) Cormier D., et al., 2019, A&A, 626, A23
- Cousin et al. (2019) Cousin M., Guillard P., Lehnert M. D., 2019, A&A, 627, A131
- Dayal & Ferrara (2018) Dayal P., Ferrara A., 2018, Phys. Rep., 780, 1
- De Rossi & Bromm (2019) De Rossi M. E., Bromm V., 2019, ApJ, 883, 113
- De Rossi et al. (2018) De Rossi M. E., Rieke G. H., Shivaei I., Bromm V., Lyu J., 2018, ApJ, 869, 4
- Demyk et al. (2013) Demyk K., et al., 2013, in Proceedings of The Life Cycle of Dust in the Universe: Observations. p. 44
- Díaz-Santos et al. (2013) Díaz-Santos T., et al., 2013, ApJ, 774, 68
- Díaz-Santos et al. (2017) Díaz-Santos T., et al., 2017, ApJ, 846, 32
- Draine (2003) Draine B. T., 2003, ApJ, 598, 1017
- Dunlop et al. (2017) Dunlop J. S., et al., 2017, MNRAS, 466, 861
- Dunne & Eales (2001) Dunne L., Eales S. A., 2001, MNRAS, 327, 697
- Erb et al. (2006) Erb D. K., Steidel C. C., Shapley A. E., Pettini M., Reddy N. A., Adelberger K. L., 2006, ApJ, 647, 128
- Faisst et al. (2017) Faisst A. L., et al., 2017, ApJ, 847, 21
- Ferland et al. (2017) Ferland G. J., et al., 2017, Rev. Mex. Astron. Astrofis., 53, 385
- Ferrara et al. (2016) Ferrara A., Viti S., Ceccarelli C., 2016, MNRAS, 463, L112
- Ferrara et al. (2017) Ferrara A., Hirashita H., Ouchi M., Fujimoto S., 2017, MNRAS, 471, 5018
- Ferrara et al. (2019) Ferrara A., Vallini L., Pallottini A., Gallerani S., Carniani S., Kohandel M., Decataldo D., Behrens C., 2019, MNRAS, 489, 1
- Finkelstein et al. (2015) Finkelstein S. L., et al., 2015, ApJ, 810, 71
- Förster Schreiber et al. (2009) Förster Schreiber N. M., et al., 2009, ApJ, 706, 1364
- Fujimoto et al. (2019) Fujimoto S., et al., 2019, arXiv e-prints, p. arXiv:1902.06760
- Gall et al. (2014) Gall C., et al., 2014, Nature, 511, 326
- Ginolfi et al. (2019) Ginolfi M., et al., 2019, arXiv e-prints, p. arXiv:1910.04770
- Gnerucci et al. (2011) Gnerucci A., et al., 2011, A&A, 528, A88
- González-López et al. (2017a) González-López J., et al., 2017a, A&A, 597, A41
- González-López et al. (2017b) González-López J., et al., 2017b, A&A, 597, A41
- Gullberg et al. (2015) Gullberg B., et al., 2015, MNRAS, 449, 2883
- Harikane et al. (2019) Harikane Y., et al., 2019, arXiv e-prints, p. arXiv:1910.10927
- Hashimoto et al. (2018) Hashimoto T., et al., 2018, Nature, 557, 392
- Hashimoto et al. (2019) Hashimoto T., et al., 2019, PASJ, p. 70
- Infante et al. (2015) Infante L., et al., 2015, The Astrophysical Journal, 815, 18
- Inoue et al. (2016) Inoue A. K., et al., 2016, Science, 352, 1559
- Jones et al. (2017) Jones G. C., Willott C. J., Carilli C. L., Ferrara A., Wang R., Wagg J., 2017, ApJ, 845, 175
- Kanekar et al. (2013) Kanekar N., Wagg J., Chary R. R., Carilli C. L., 2013, ApJ, 771, L20
- Kato et al. (2018) Kato Y., et al., 2018, PASJ, 70, L6
- Katz et al. (2019) Katz H., et al., 2019, MNRAS, 487, 5902
- Kawamata et al. (2016) Kawamata R., Oguri M., Ishigaki M., Shimasaku K., Ouchi M., 2016, ApJ, 819, 114
- Knudsen et al. (2016) Knudsen K. K., Richard J., Kneib J.-P., Jauzac M., Clément B., Drouart G., Egami E., Lindroos L., 2016, MNRAS, 462, L6
- Kohandel et al. (2019) Kohandel M., Pallottini A., Ferrara A., Zanella A., Behrens C., Carniani S., Gallerani S., Vallini L., 2019, MNRAS, 487, 3007
- Lagache et al. (2018) Lagache G., Cousin M., Chatzikos M., 2018, A&A, 609, A130
- Laporte et al. (2015) Laporte N., et al., 2015, A&A, 575, A92
- Laporte et al. (2016) Laporte N., et al., 2016, ApJ, 820, 98
- Laporte et al. (2017) Laporte N., et al., 2017, ApJ, 837, L21
- Laporte et al. (2019) Laporte N., et al., 2019, MNRAS, 487, L81
- Leśniewska & Michałowski (2019) Leśniewska A., Michałowski M. J., 2019, A&A, 624, L13
- Lotz et al. (2017) Lotz J. M., et al., 2017, ApJ, 837, 97
- Madau & Dickinson (2014) Madau P., Dickinson M., 2014, ARA&A, 52, 415
- Madden et al. (1997) Madden S. C., Poglitsch A., Geis N., Stacey G. J., Townes C. H., 1997, ApJ, 483, 200
- Madden et al. (2013) Madden S. C., et al., 2013, PASP, 125, 600
- Magdis et al. (2011) Magdis G. E., et al., 2011, ApJ, 740, L15
- Maiolino & Mannucci (2019) Maiolino R., Mannucci F., 2019, A&ARv, 27, 3
- Malhotra et al. (1997) Malhotra S., et al., 1997, ApJ, 491, L27
- Marrone et al. (2018) Marrone D. P., et al., 2018, Nature, 553, 51
- Matthee et al. (2017) Matthee J., et al., 2017, ApJ, 851, 145
- Mawatari et al. (2016) Mawatari K., Yamada T., Fazio G. G., Huang J.-S., Ashby M. L. N., 2016, PASJ, 68, 46
- Mawatari et al. (2020) Mawatari K., et al., 2020, ApJ, 889, 137
- McLeod et al. (2015) McLeod D. J., McLure R. J., Dunlop J. S., Robertson B. E., Ellis R. S., Targett T. A., 2015, MNRAS, 450, 3032
- McMullin et al. (2007) McMullin J. P., Waters B., Schiebel D., Young W., Golap K., 2007, in Shaw R. A., Hill F., Bell D. J., eds, Astronomical Society of the Pacific Conference Series Vol. 376, Astronomical Data Analysis Software and Systems XVI. p. 127
- Meijerink et al. (2007) Meijerink R., Spaans M., Israel F. P., 2007, A&A, 461, 793
- Meixner et al. (2019) Meixner M., et al., 2019, arXiv e-prints, p. arXiv:1912.06213
- Michałowski (2015) Michałowski M. J., 2015, A&A, 577, A80
- Nozawa et al. (2014) Nozawa T., Yoon S.-C., Maeda K., Kozasa T., Nomoto K., Langer N., 2014, ApJ, 787, L17
- Oesch et al. (2016) Oesch P. A., et al., 2016, ApJ, 819, 129
- Oesch et al. (2018) Oesch P. A., Bouwens R. J., Illingworth G. D., Labbé I., Stefanon M., 2018, ApJ, 855, 105
- Ota et al. (2014) Ota K., et al., 2014, ApJ, 792, 34
- Pallottini et al. (2017a) Pallottini A., Ferrara A., Gallerani S., Vallini L., Maiolino R., Salvadori S., 2017a, MNRAS, 465, 2540
- Pallottini et al. (2017b) Pallottini A., Ferrara A., Bovino S., Vallini L., Gallerani S., Maiolino R., Salvadori S., 2017b, MNRAS, 471, 4128
- Pallottini et al. (2019) Pallottini A., et al., 2019, MNRAS, 487, 1689
- Planck Collaboration et al. (2014) Planck Collaboration et al., 2014, A&A, 571, A11
- Planck Collaboration et al. (2016) Planck Collaboration et al., 2016, A&A, 594, A13
- Planck Collaboration et al. (2018) Planck Collaboration et al., 2018, arXiv e-prints, p. arXiv:1807.06209
- Sawicki (2012) Sawicki M., 2012, PASP, 124, 1208
- Schaerer et al. (2015) Schaerer D., Boone F., Zamojski M., Staguhn J., Dessauges-Zavadsky M., Finkelstein S., Combes F., 2015, A&A, 574, A19
- Scoville et al. (2016) Scoville N., et al., 2016, ApJ, 820, 83
- Shibuya et al. (2018) Shibuya T., et al., 2018, PASJ, 70, S15
- Smit et al. (2018) Smit R., et al., 2018, Nature, 553, 178
- Smith et al. (2012) Smith M. W. L., et al., 2012, ApJ, 756, 40
- Sobral et al. (2015) Sobral D., Matthee J., Darvish B., Schaerer D., Mobasher B., Röttgering H. J. A., Santos S., Hemmati S., 2015, ApJ, 808, 139
- Sobral et al. (2019) Sobral D., et al., 2019, MNRAS, 482, 2422
- Solomon & Vanden Bout (2005) Solomon P. M., Vanden Bout P. A., 2005, ARA&A, 43, 677
- Stacey (2011) Stacey G. J., 2011, IEEE Transactions on Terahertz Science and Technology, 1, 241
- Stacey et al. (1991) Stacey G. J., Geis N., Genzel R., Lugten J. B., Poglitsch A., Sternberg A., Townes C. H., 1991, ApJ, 373, 423
- Stacey et al. (2010) Stacey G. J., Hailey-Dunsheath S., Ferkinhoff C., Nikola T., Parshley S. C., Benford D. J., Staguhn J. G., Fiolet N., 2010, ApJ, 724, 957
- Tamura et al. (2019) Tamura Y., et al., 2019, ApJ, 874, 27
- Tegmark et al. (1997) Tegmark M., Silk J., Rees M. J., Blanchard A., Abel T., Palla F., 1997, ApJ, 474, 1
- Vallini et al. (2017) Vallini L., Ferrara A., Pallottini A., Gallerani S., 2017, MNRAS, 467, 1300
- Walter et al. (2018) Walter F., et al., 2018, ApJ, 869, L22
- Watson et al. (2015) Watson D., Christensen L., Knudsen K. K., Richard J., Gallazzi A., Michałowski M. J., 2015, Nature, 519, 327
- Willott et al. (2015) Willott C. J., Carilli C. L., Wagg J., Wang R., 2015, ApJ, 807, 180
- da Cunha et al. (2013) da Cunha E., et al., 2013, ApJ, 766, 13
- de Looze et al. (2014) de Looze I., et al., 2014, A&A, 568, A62