A new and unusual LBV-like outburst from a Wolf-Rayet star in the outskirts of M33
Abstract
MCA-1B (also called UIT003) is a luminous hot star in the western outskirts of M33, classified over 20 yr ago with a spectral type of Ofpe/WN9 and identified then as a candidate luminous blue variable (LBV). Palomar Transient Factory data reveal that this star brightened in 2010, with a light curve resembling that of the classic LBV star AF And in M31. Other Ofpe/WN9 stars have erupted as LBVs, but MCA-1B was unusual because it remained hot. It showed a WN-type spectrum throughout its eruption, whereas LBVs usually get much cooler. MCA-1B showed an almost four-fold increase in bolometric luminosity and a doubling of its radius, but its temperature stayed 29 kK. As it faded, it shifted to even hotter temperatures, exhibiting a WN7/WN8-type spectrum, and doubling its wind speed. MCA-1B is reminiscent of some supernova impostors, and its location resembles the isolated environment of SN 2009ip. It is most similar to HD 5980 (in the Small Magellanic Cloud) and GR 290 (also in M33). Whereas these two LBVs exhibited B-type spectra in eruption, MCA-1B is the first clear case where a Wolf-Rayet (WR) spectrum persisted at all times. Together, MCA-1B, HD 5980, and GR 290 constitute a class of WN-type LBVs, distinct from S Doradus LBVs. They are most interesting in the context of LBVs at low metallicity, a possible post-LBV/WR transition in binaries, and as likely Type Ibn supernova progenitors.
keywords:
circumstellar matter — stars: evolution — stars: massive — stars: winds, outflows — stars: Wolf-Rayet1 INTRODUCTION
Luminous blue variables (LBVs) are evolved massive stars that are the brightest blue irregular variables in star-forming galaxies. Originally recognised as the classic Hubble-Sandage variables in M31 and M33 (Hubble & Sandage, 1953), these were later grouped together with a diverse collection of irregular variable stars and referred to as “LBVs” by Conti (1984). LBVs have the highest mass-loss rates of any stars, and this can profoundly affect a massive star’s late-time evolution (Smith, 2014). However, their role in the evolution of massive stars in general is uncertain. In particular, the central idea that their mass loss is the gateway to H-poor Wolf-Rayet (WR) stars in single-star evolution (Conti, 1976; Maeder & Conti, 1994; Smith & Owocki, 2006; Groh et al., 2014) is problematic because LBVs appear to be massive blue stragglers (Smith & Tombleson, 2015). “Massive blue stragglers” in this context means that they appear overluminous or too young for single-star evolution, as compared to surrounding stars; see Smith & Tombleson (2015) and Aghakhanloo et al. (2017) for details.
Our current understanding of LBVs is in flux, and many established ideas about LBVs have turned out to be incorrect or incomplete. Since LBVs are quite rare (only a handful are known in the Milky Way), many ideas about LBVs have been shaped by detailed study of a few prototypical objects and then imposed upon the class as a whole. However, continued study of nearby LBVs and extraglactic transients has shown that numerous hallmarks of LBVs seem to break down upon closer examination, and LBVs are phenomenologically diverse (see Smith 2017a, and references therein).
Particularly relevant to the current paper is one of the traditionally adopted defining characteristics of LBVs: their S Doradus outbursts show a brightening at visible wavelengths as a result of temperature shifts due to a cooler pseudophotosphere forming in the denser wind. The pseudophotosphere was the presumed explanation for why LBVs, at maximum brightness, reside along a constant-temperature strip (Humphreys & Davidson, 1994). This was thought to be the explanation for a shift in energy distribution from the ultraviolet (UV) to the optical, causing a dramatic brightening at constant bolometric luminosity (Humphreys & Davidson, 1994). However, the notion that the cool temperature is caused by a pseudophotosphere due to increased mass loss, and the idea that these temperature changes occur at constant , both appear to be incorrect. Investigations with quantitative spectroscopy (de Koter et al., 1996; Lamers, Snow, & Lindholm, 1995; Groh et al., 2006, 2009a, 2009b; Mehner et al., 2017) disproved the conjecture that S Doradus brightening events are caused by opaque winds, because the mass-loss rates are not high enough to make such large pseudophotospheres. Moreover, bolometric luminosities during S Doradus eruptions are actually not constant. There are also some well-studied exceptions to the traditional behaviour of cool temperatures in LBV eruptions, most notably in the eruption of the massive eclipsing binary HD 5980 in the Small Magellanic Cloud (SMC) and Romano’s star (GR 290) in M33, which are discussed below. A limiting factor in understanding LBVs is that there are few of them, and there is considerable diversity even among this small group, making it difficult to identify the physics of their instability more generally. Moreover, with revised distances from Gaia DR2, many LBVs do not reside on the S Doradus instability strip (Smith et al., 2019), as generally assumed.
LBV candidates are more numerous than confirmed LBVs (Massey et al., 2007) and may hold additional clues to their nature. LBV candidates occupy a similar part of the Hertzsprung-Russell (HR) diagram as quiescent LBVs and have similar spectral properties, but have not been caught demonstrating the tell-tale dramatic photometric variability. Some have resolved circumstellar nebulae that seem to indicate a past LBV-like eruptive mass-loss episode (Stahl, 1986), and they are often presumed to be dormant LBVs.
Chief among the LBV candidates are the Ofpe/WN9 stars, intermediate between Of-type stars and WN stars (Walborn, 1977, 1982a; Bohannan & Walborn, 1989). The Ofpe/WN9 stars were first recognised as a class based on about ten objects in the Large Magellanic Cloud (LMC), but have also been found in a number of nearby galaxies. Ofpe/WN9 stars are luminous, typically log() = 5.5–6.5, implying high initial masses; also, they have hot temperatures of roughly 29–30 kK, and wind speeds of roughly 400 km s-1 (Crowther et al., 1995a). Their spectra are similar to those of classical LBVs in their hot quiescent state, and many of the LBV candidates with shell nebulae are Ofpe/WN9 stars. There is actually a direct connection between Ofpe/WN9 stars and confirmed LBVs. Two of the prototypical LBVs that have classic S Doradus cycles — AG Carinae in the Milky Way and R127 in the LMC — both appear as Ofpe/WN9 stars in their hot quiescent state (Walborn, 1982b; Wolf & Stahl, 1982; Stahl et al., 1983, 2001). Following these examples, one expects a hot Ofpe/WN9 star to become cooler (i.e., an F supergiant) as it brightens if it has a 1–2 mag LBV eruption. This brings us to the variable Ofpe/WN9 star in M33 that we discuss here, which flagrantly defies this expectation.
The first Ofpe/WN9 star identified in M33 was MCA-1B, which was found accidentally (Willis et al., 1992). It was identified spectroscopically when it was observed instead of the intended target, the fainter neighbouring WC star MCA-1 (Massey, Conti, & Armandroff, 1987), which is only about 2″ away. Since then, a handful of additional Ofpe/WN9 stars were found in M33 (Massey et al., 1996; Bianchi et al., 2004).
MCA-1B was studied in detail shortly after its initial discovery by Willis et al. (1992), and a quantitative spectroscopic analysis was performed on high-resolution spectra (Crowther et al., 1995b; Smith, Crowther, & Willis, 1995). The estimated physical parameters were a stellar temperature of 29 kK, a bolometric luminosity of log() = 5.8, a mass-loss rate of yr-1, a wind terminal speed of = 420 km s-1, and a probable initial mass of around 50 , based on its position on the HR diagram compared to single-star evolutionary models. Those authors noted its similarity to other Ofpe/WN9 stars in the LMC, especially the classic Ofpe/WN9 star R84 (which was presumed to be a dormant LBV), and they concluded that MCA-1B was likely to be a dormant LBV as well. The star is one of the brightest stars in M33 in the UV (it is also named UIT003), and its UV spectrum obtained in 2000 December has been studied in detail by Bianchi et al. (2004). Those authors derived somewhat different values in their analysis of the UV/optical spectrum: = 30 kK, log() = 5.55, = yr-1, = 1000 km s-1, and a likely initial mass around 25 . Since these UV/optical observations of MCA-1B were obtained several years after the spectrum analyzed by Smith, Crowther, & Willis (1995), the different derived values may be a consequence of real variability, but may also be attributable to a somewhat lower reddening value adopted by Bianchi et al. (2004). Some differences in -band magnitude have been reported in the literature for MCA-1B: mag in 1992 with 08 seeing (Smith, Crowther, & Willis, 1995), mag in 1993 with 14–17 seeing (Massey et al., 1996), and mag in 2000 with 09 seeing (Massey et al., 2006). Because MCA-1B is in a crowded region (this is discussed later in the paper), however, it is plausible that these differences are in part due to different amounts of contamination by neighbouring stars (i.e., the dates with poorer seeing give brighter magnitudes). Significantly brighter -band magnitudes were derived from low-resolution ( mm-1) photographic plates from the 1980s (Kurtev et al., 1999), but the contamination from surrounding stars is probably severe in those data. Thus, it remains uncertain if there was significant photometric variability of MCA-1B before the recent epoch reported here.
In this paper we discuss the identification by the Palomar Transient Factory (PTF) of the variable source PTF10vyq in M33, which turns out to be a nonperiodic brightening of the well-known Ofpe/WN9 star MCA-1B. The onset of its irregular variability suggests that MCA-1B is in fact an LBV, and was previously therefore a dormant LBV as Crowther et al. (1995b) and Smith, Crowther, & Willis (1995) suspected. Upon examination, however, the new outburst is peculiar compared with traditional S Doradus outbursts of LBVs.
MCA-1B/PTF10vyq is located in the western outskirts of M33, and is therefore of additional interest, since some recent peculiar SNe related to LBVs, such as SN 2009ip (Smith, 2016), are found in environments that are surprisingly remote for the high luminosity and high implied masses of their progenitors. The remote location combined with the metallicity gradient of M33 (Magrini et al., 2007) also suggests that MCA-1B may provide intriguing clues to LBV behaviour at low metallicity. Throughout, we adopt a distance to M33 of 830 kpc, following Massey (2013). This is between estimates of 800 kpc (McConnachie et al., 2009; Patel et al., 2017) and 960 kpc (Bonanos et al., 2006); adopting either of these these would only slightly alter the absolute magnitudes and implications for the initial mass of the star.
In Section 2 we present the discovery and follow-up of PTF10vyq, which is a brightening of the Ofpe/WN9 star MCA-1B. We discuss its remote location in Section 3, and crowding in its vicinity in Section 4. Its physical parameters and their variability are presented in Section 5. We summarise the main results in Section 6.
| UT Date | Day | Tel./Instr. | grating | He IIa |
|---|---|---|---|---|
| (lines mm-1) | ||||
| 2010 Oct 01 | 1 | Lick3m/Kast | 600/830 | * |
| 2010 Oct 10 | 10 | KPNO4m/RCSP | 316 | * |
| 2010 Nov 05 | 36 | Keck1/LRIS | 600/400 | * |
| 2010 Nov 07 | 38 | Keck2/DEIMOS | 600 | * |
| 2010 Nov 07 | 38 | Keck2/DEIMOS | 1200 | |
| 2011 Jan 12 | 104 | MMT/Blue | 1200 | |
| 2011 Jun 26 | 269 | MMT/Blue | 1200 | |
| 2012 Jan 30 | 487 | MMT/Blue | 1200 | |
| 2012 Jan 30 | 487 | MMT/Blue | 300 | |
| 2012 Oct 15 | 746 | MMT/Blue | 1200 | |
| 2012 Oct 16 | 747 | MMT/Blue | 300 | |
| 2012 Nov 24 | 786 | MMT/Blue | 300 | * |
| 2013 Oct 11 | 1107 | Keck2/DEIMOS | 830 | * |
| 2014 Jan 02 | 1190 | MMT/Blue | 1200 | |
| 2014 Sep 28 | 1459 | Bok/BC | 300 | * |
| 2014 Oct 15 | 1476 | MMT/Blue | 1200 | |
| 2014 Oct 31 | 1492 | Bok/BC | 300 | * |
| 2015 Oct 12 | 1838 | MMT/Blue | 1200 | |
| 2015 Oct 22 | 1848 | Bok/BC | 300 | |
| 2015 Nov 23 | 1880 | LBT/MODS | 400/250 | * |
| 2015 Nov 30 | 1887 | MMT/Blue | 1200 | |
| 2015 Dec 03 | 1890 | MMT/Blue | 300 | * |
| 2016 Jan 01 | 1919 | Bok/BC | 300 | |
| 2016 Jan 28 | 1946 | Bok/BC | 300 | |
| 2016 Feb 16 | 1965 | MMT/Blue | 1200 | |
| 2016 Nov 07 | 2230 | Bok/BC | 300 | * |
| 2016 Nov 07 | 2230 | MMT/Blue | 1200 | |
| 2017 Jan 06 | 2290 | MMT/Blue | 1200 | |
| 2017 Jun 29 | 2464 | MMT/Blue | 1200 | |
| 2017 Aug 29 | 2556 | Bok/BC | 300 | |
| 2017 Oct 08 | 2565 | MMT/Blue | 1200 | |
| 2017 Oct 10 | 2567 | Bok/BC | 300 | |
| 2017 Oct 26 | 2583 | MMT/Blue | 1200 | |
| 2017 Nov 19 | 2607 | MMT/Blue | 1200 | |
| 2017 Dec 15 | 2633 | MMT/Blue | 1200 | |
| 2018 Jan 18 | 2667 | MMT/Blue | 1200 | |
| 2018 Sep 05 | 2900 | MMT/Blue | 300 | * |
| 2018 Sep 12 | 2907 | MMT/Blue | 1200 |
aObservations with an asterisk in this column denote epochs with blue coverage when the seeing was good and resulting contamination from the neigboring WC star MCA-1 (judged by the broad red and blue WR bumps) was minimal. These epochs were used to measure the strength of He ii 4686 and other blue lines.
2 DISCOVERY AND FOLLOW-UP OBSERVATIONS
2.1 PTF Discovery
On 2010 Sep. 21 (UT dates are used throughout this paper; JD = 2,455,460.5), PTF10vyq was discovered in PTF images of M33 obtained in the -band filter with the Palomar 48-in telescope (P48) as part of the PTF survey. Even though a previously known source was present at this position, the transient designation was triggered when it brightened in difference images made by subtracting a template constructed from images obtained in 2009.
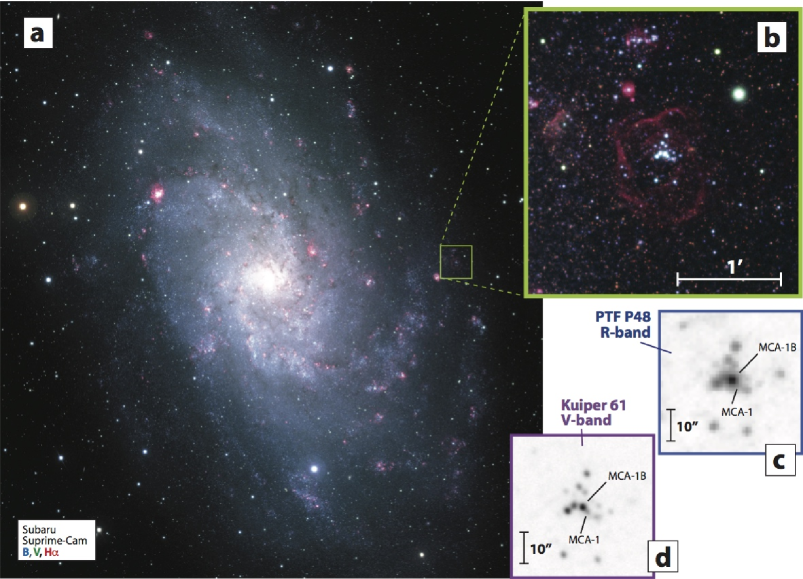
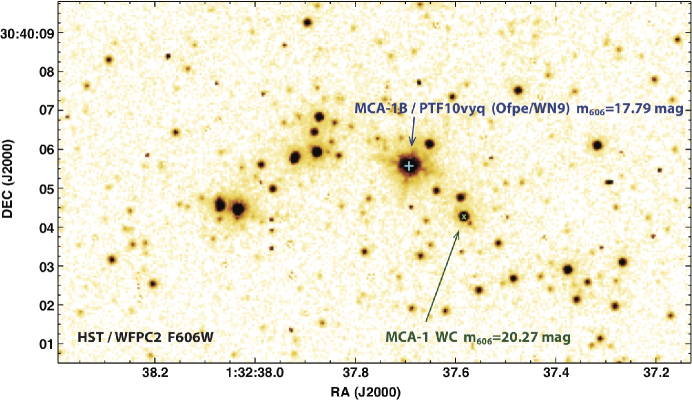
This new transient source was named PTF10vyq, and was located in a small star cluster at the centre of a faint shell-like H ii region, located in the western outskirts of M33. We discuss the surrounding environment more below. A wide-field colour image from a publically available Subaru/Suprime-Cam image showing its location in M33 is included in Figure 1. Figure 2 shows a detail of the star cluster in which MCA-1B resides as seen in an archival image taken with the Hubble Space Telescope (HST) Wide Field Planetary Camera 2 (WFPC2) in July 1994.
There were two previously known stellar sources within 2″ of each other that were near the position of the new transient PTF10vyq: the WC star MCA-1 (Massey, Conti, & Armandroff, 1987) and the Ofpe/WN9 star MCA-1B (Willis et al., 1992). These are unresolved in P48 images, and are only marginally resolved in Kuiper 61-in (K61) images (see Figures 1c and 1d), but are clearly resolved by HST (Figure 2). Since our first spectra (see below) revealed that the transient resembled an Ofpe/WN9 star with narrow H emission lines in the spectrum, we concluded that the transient source was probably a brightening of the Ofpe/WN9 star MCA-1B, and was not associated with an outburst of the WC star MCA-1. Later images with better seeing (where both sources were resolved) confirmed that this was correct. The Ofpe/WN9 star MCA-1B was already an LBV candidate (Smith, Crowther, & Willis, 1995), and this new brightening provides another case of an Ofpe/WN9 star that has transitioned into an eruptive state.
2.2 1994 HST/WFPC2 Photometry
The location of MCA-1B was observed in the F606W filter with HST/WFPC2 on 1994 July 30 (GO-5494; PI Bianchi). We obtained this image from the archive, and the reduced F606W image is shown in Figure 2. From this image, we measure an apparent F606W magnitude of mag for MCA-1B in July 1994 (Vega mag). This is mag fainter than ground-based magnitudes estimated at a similar epoch ( mag; Smith, Crowther, & Willis 1995). As noted in Section 1, ground-based magnitudes were mag in 1992 with 08 seeing (Smith, Crowther, & Willis, 1995) and mag in 1993 with 14–17 seeing (Massey et al., 1996). The HST image does show several other fainter sources nearby; there are a few within ″, but there are several more stars (and brighter ones) within ″. Although we cannot rule out real photometric variability of MCA-1B over 1–2 yr timescales, these nearby stars might contribute 10–20% of the total light at that epoch in a ground-based aperture, depending on the seeing (compare Figure 2 to panels c and d of Figure 1). For example, the nearby WC Wolf-Rayet star MCA-1 has an apparent F606W magnitude of in this same HST/WFPC2 image. It is fairly well resolved from MCA-1B in our K61 ground-based images (Fig. 1d), but MCA-1 is blended with MCA-1B in PTF P48 images (Fig. 1c) and in Super-LOTIS photometry (see below). The influence of these neighbouring stars is discussed in more detail in Section 4.
2.3 Follow-up Photometry
We continued to monitor MCA-1B/PTF10vyq as part of the ongoing PTF (and then iPTF) survey of M33 with the P48 in for the next several years. We also obtained some late-time images in the SDSS and bands with P60. We obtained photometry from the PTF images using point-spread-function (PSF) photometry with a 3″ PSF fitting radius. As mentioned above and described below, it is likely that the PTF photometry has some contamination from several nearby point sources in the host cluster.
We obtained late-time imaging photometry using the Mont4k camera on K61 ( band) starting in late 2014. The images were obtained in binning mode, resulting in a final scale of 043 pixel-1. The K61 photometry is valuable in this crowded region, since the typical image quality (1″) is better than the median image quality of the P48, and the 043 pixels are smaller than the coarser 1″ pixels of PTF. Using PSF-fitting photometry, we were able to clearly separate MCA-1B from its neighbouring WC star MCA-1, as well as a few other, fainter point sources (although not the faint neighbours within 1″ in HST images).
We also obtained late-time photometry starting in late 2016 using Super-LOTIS (updated Livermore Optical Transient Imaging System), which is a 0.6-m robotic telescope on Kitt Peak that uses a CCD camera with 05 pixels and a 17′ field of view.111http://slotis.kpno.noao.edu/LOTIS/index.php Super-LOTIS images have typical seeing of 2″ and are comparable in quality to P48 images, so they also do not resolve MCA-1B from its immediate neighbours in the host cluster.
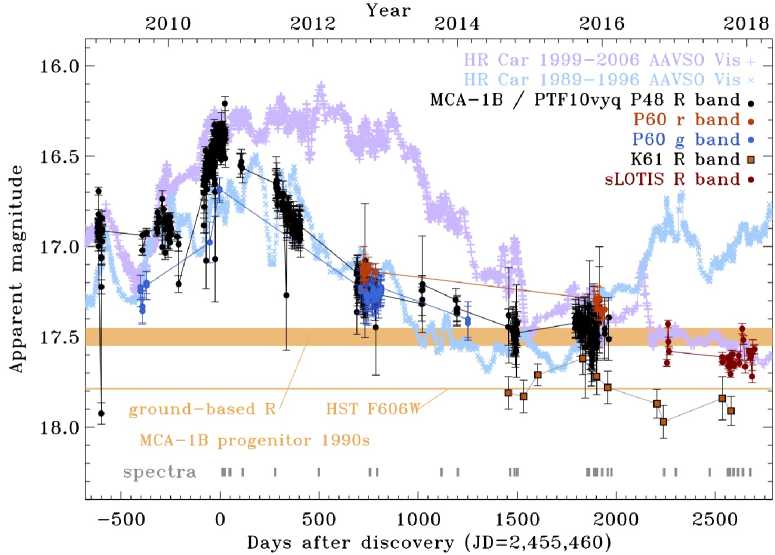
A summary of the visual-wavelength photometry from PTF, K61, and Super-LOTIS is provided in Figure 3. This figure also denotes the apparent magnitude of the progenitor Ofpe/WN9 star in the early/mid 1990s from both ground-based and HST photometry (orange bars). For comparison, we show the visible light curve of the Galactic LBV star HR Car during S Doradus cycles in 1989–1996 (light blue) and 1999–2006 (lavender). These are apparent visual magnitude estimates of HR Car from the American Association of Variable Star Observers (AAVSO).222https://www.aavso.org/lcg
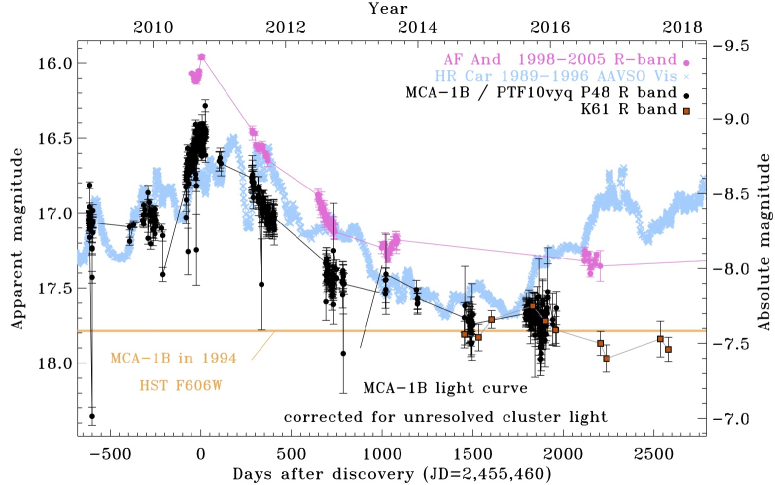
Since MCA-1B is in a crowded region, the apparent magnitude is contaminated by neighbouring stars in ground-based photometry, with different amounts of contamination for different image quality and pixel scales. Figure 4 shows a simplified version of the light curve of MCA-1B, where we have attempted to correct for contamination by subtracting a baseline flux estimated from neigbouring stars in the HST F606W image. This is discussed further below. While the precise amount of contamination is difficult to quantify, Figure 4 gives a better representation of the true visible-light variations of MCA-1B’s outburst than does Figure 3.
2.4 Follow-up Spectroscopy
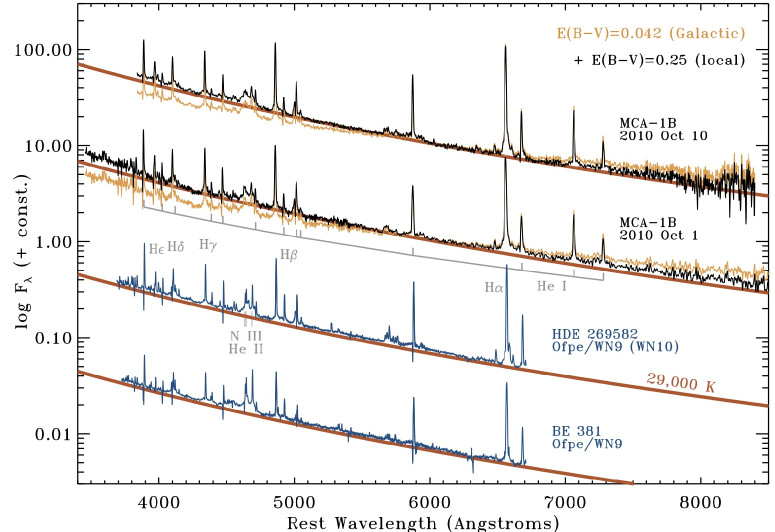
A few weeks after PTF’s discovery of the September 2010 brightening, we obtained visual-wavelength spectra of MCA-1B/PTF10vyq using the Kast spectrograph (Miller & Stone, 1993) on the Lick 3 m Shane reflector (2010 Oct. 1), and using the RC Spectrograph333https://www.noao.edu/kpno/manuals/rcspec/rcsp.html on the Kitt Peak National Observatory (KPNO) 4 m Mayall telescope (2010 Oct. 10). These two spectra were obtained near the time of peak brightness, and both covered the full optical range from below 4000 Å to about 1 m with moderate spectral resolution (). They were reduced using standard tasks in IRAF, and the resulting calibrated spectra are shown in Figure 5.
Subsequently, a long series of follow-up spectra spanning several years was obtained using the Boller & Chivens (B&C) Spectrograph mounted on the 2.3 m Bok telescope on Kitt Peak, and the Bluechannel (BC) spectrograph on the 6.5 m Multiple Mirror Telescope (MMT). The Bok spectra were all obtained with a low-resolution grating (300 lines mm-1; ) covering most of the optical range, whereas the MMT spectra used either low resolution (300 lines mm-1 grating; ) over a wide wavelength range (4000–8000 Å) or moderately high resolution (1200 lines mm-1 grating; ) over a smaller range (typically 5700–7100 Å, although at some epochs a different central wavelength was chosen). We also obtained spectra using the Low Resolution Imaging Spectrometer (LRIS; Oke et al. 1995) and the Deep Imaging Multi-Object Spectrograph (DEIMOS; Faber et al. 2003) at Keck Observatory. Finally, we obtained one late spectral epoch (2015 Nov. 23) using the Multi-Object Double Spectrograph (MODS; Byard & O’Brien 2000) on the Large Binocular Telescope (LBT). All spectra were obtained with the long slit at the parallactic angle (Filippenko , 1982), to minimise the effects of atmospheric dispersion. Details of the spectral observations are listed in Table 1, and the spectra are plotted in Figure 6.
Figure 5 shows our two spectra of MCA-1B shortly after the discovery of PTF10vyq. Although there may be some minimal contamination from the red and blue Wolf-Rayet (WR) bumps, the spectra at times near peak brightness are clearly consistent with standard Ofpe/WN9 stars (BE 381 and HDE 269582 in the LMC are shown for comparison). This hot spectrum at peak brightness is very unusual for LBVs. These spectra of MCA-1B are shown corrected for Milky Way line-of-sight reddening of mag (orange) and also for an additional amount of local host reddening (black). The value shown is an extra reddening correction of mag (for a total of mag). This is the amount chosen to make the continuum of PTF10vyq match the continuum slope of a typical Ofpe/WN9 star at 29,000 K. Values of 28–30 kK are usually quoted for Ofpe/WN9 stars. 444The hot temperature at peak brightness is inferred from the Ofpe/WN9-like spectral properties at that time (including strong He i emission lines), not from the shape of the dereddened spectrum. The choice of therefore does not influence the main result that MCA-1B stays hot at peak. The continuum slope and may differ slightly due to mass-loss rate and local reddening of course; the precise value of here is less important than the fact that it showed little change.
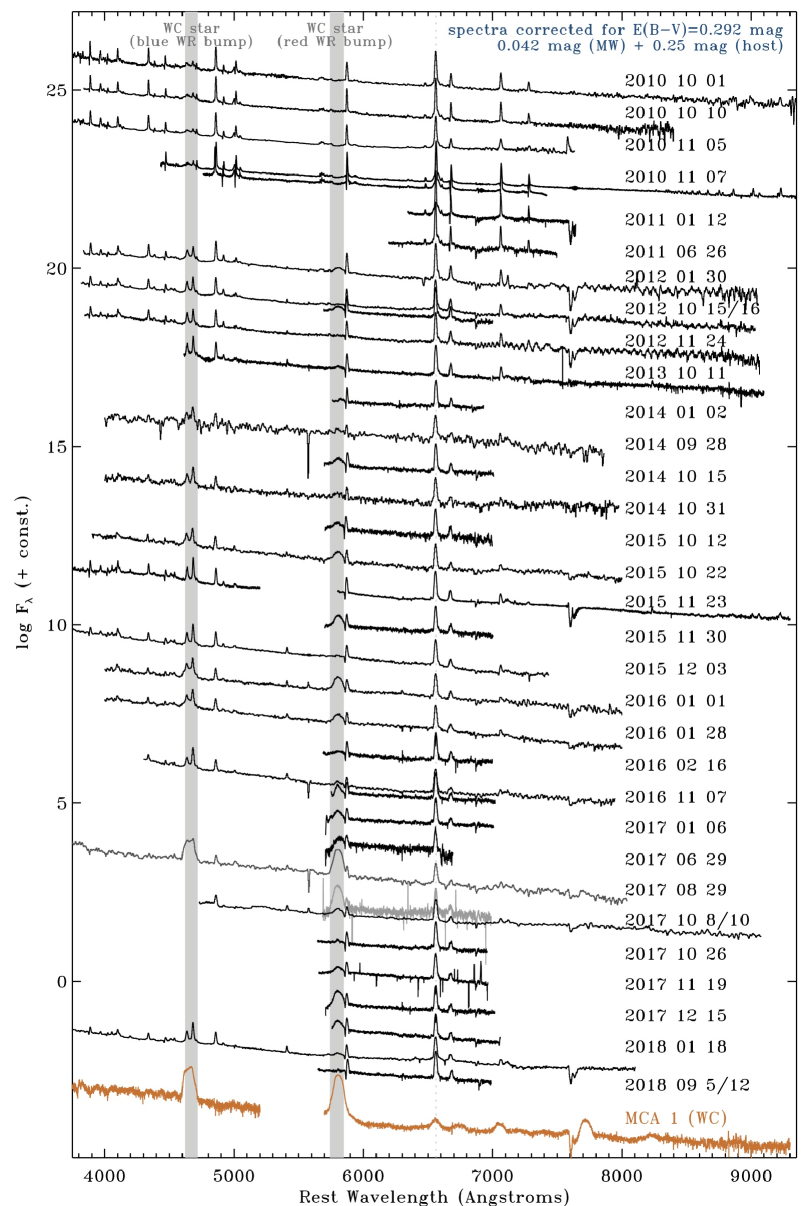
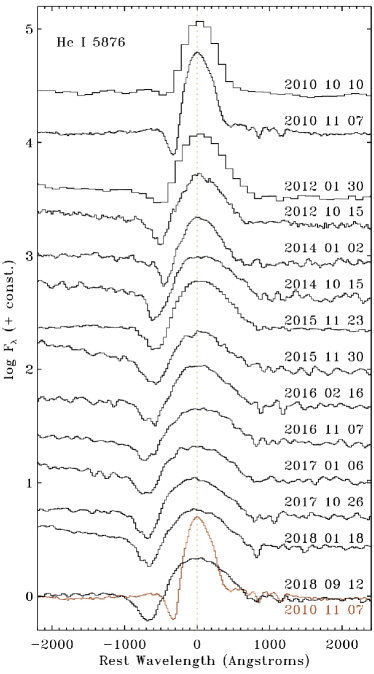
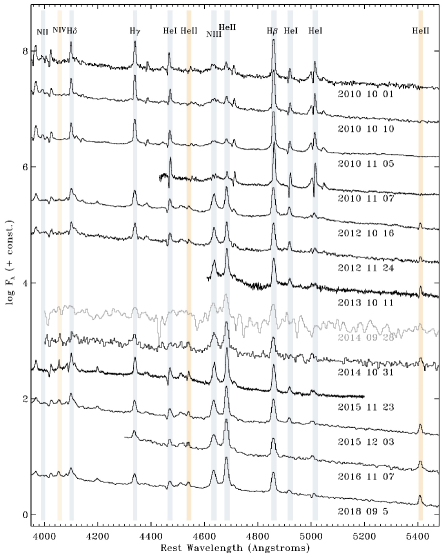
Figure 6 shows the full series of optical spectra we obtained of MCA-1B, all corrected for mag of reddening. Line profiles of the strong, narrow emission lines H, He i 6678, and He i 5876 are shown in Figures 7, 8, and 9, respectively. In these figures, we favour epochs with higher spectral resolution and we omit redundant epochs of lower resolution spectra. Many of the spectra are contaminated by light from the nearby WC star MCA-1, especially at later times. Although the WC star is much fainter in the continuum than MCA-1B, its broad emission lines are bright, and some of this emission was unavoidably included in extractions of the spectrum of our main target. The amount of contamination from the WC star varies depending on the exact slit position angle and seeing. Although we always set the slit at the parallactic angle, the resulting position angle on the sky varied. The relative contamination is barely noticable at early times when the transient was bright, but it worsened as MCA-1B faded.
For reference, we include an LBT/MODS spectrum of the WC star taken on 2015 Nov. 23 (shown in orange in Figure 6); this was taken on a night with good seeing when tracings of the two sources could be reliably separated, and when we placed the slit at a position angle that included both targets. The brightest contaminating features are the blue and red WR emission bumps in WC stars, which are marked with grey vertical bands to help identify this contamination in all the spectra of MCA-1B. Note that the WC star MCA-1 does not exhibit bright, broad emission lines of He i or H, so contamination from MCA-1B does not contribute to the broadening of those emission lines as MCA-1B faded, which we report in this paper. Epochs judged to have minimal contamination from the nearby WC star are denoted with an asterisk in the last column of Table 1.
3 LOW-METALLICITY ENVIRONMENT
MCA-1B resides in the western outskirts of M33 (Figure 1a), where the metallicity gradient implies a relatively low local metallicity. MCA-1B is located about 5.8–6 kpc from the centre of M33, correcting for the projected inclination. It is close (a few arcmin on the sky) to the H ii region LGC HII 3, for which Magrini et al. (2007) report an oxygen abundance of 12 + log(O/H) = , consistent with the value of 12 + log(O/H) = 8.2 expected from their fit to the overall metallicity gradient at a radius of kpc. This translates to about 0.35 , based on an adopted solar oxygen abundance of 12 + log(O/H) = 8.69 (Asplund et al., 2009), placing the local metallicity of MCA-1B in between that of the LMC and SMC. This relatively low metallicity might be relevant for interpreting peculiarities of its eruption.
Although MCA-1B is in the somewhat remote western regions of M33, it is not completely isolated; it is found amid a cluster or association of a dozen or so luminous blue stars. The cluster is roughly at the centre of a large and evolved H ii region shell nebula (Figure 1b). This shell has a diameter of roughly 60″, or about 240 pc. The shell-like H ii region is faint and filamentary, and relatively devoid of H emission in its interior (see Figure 1b); this implies that it is an old and evolved H ii region. With a radius of 120 pc and expanding with a typical speed of 15–20 km s-1, this shell would have an age of (very roughly) 6–8 Myr, commensurate with stellar lifetimes for initial masses of 20–30 .
It is interesting that MCA-1B is in a relatively young ( Myr) and blue cluster, because this is unlike most LBVs (Smith & Tombleson, 2015). Given its high luminosity, however, it may be overluminous for the age of its host cluster, depending on the true age of the region; the rough age estimate of the nebula noted here is not precise enough to determine if it is a massive blue straggler. Future imaging photometry of the cluster with HST may allow a more precise isochrone age, which could reveal if MCA-1B is a massive blue straggler like other LBVs. An initial mass of 50 was implied by the luminosity of the quiescent progenitor star as compared to single-star evolutionary tracks (Smith, Crowther, & Willis, 1995).
It is useful to place the environment of MCA-1B in context. Images reveal a surrounding H ii region shell and an associated star cluster that is crowded enough to corrupt the ground-based photometry, as discussed next. These clues about a crowded environment, however, follow from the luxury that M33 is less than 1 Mpc away. If MCA-1B were in a more distant galaxy that is typical of supernova (SN) studies, we might cast its surroundings somewhat differently.
Take the case of SN 2009ip, for example, which has been noted to reside in a remarkably isolated environment (Smith et al., 2016). This is surprising for its presumably high-mass, LBV-like progenitor. SN 2009ip is found about 5 kpc from the centre of its modest spiral host galaxy, similar to the location of MCA-1B at kpc from the centre of M33. Deep late-time HST images did not resolve a star cluster and did not detect a bright extended H ii region around SN 2009ip (Smith et al., 2016). However, the host galaxy of SN 2009ip, NGC 7259, is at a much larger distance of 20.4 Mpc, about 25 times farther away than M33. If MCA-1B and its environment were moved to that distance, it is doubful that an HST image would detect the surrounding faint stars if MCA-1B exploded — the whole cluster would only be a few HST pixels across, and could easily be hidden in the glare of the fading SN. At 25 times more distant, the thin H ii region shell around MCA-1B might easily fall below the surface brightness detection limits in HST images like the ones used to search for H ii regions around SN 2009ip, which could have detected large and bright nebulae like the Carina Nebula or 30 Dor, but not much fainter ones. The associated cluster and H ii regions would certainly not be detectable in typical ground-based images if MCA-1B were located so far away. Thus, despite the issues with a crowded environment noted below, it is worth remembering that MCA-1B is nevertheless characteristic of some of the more remote environments found for core-collapse supernovae (SNe).
4 IN A CROWDED REGION
MCA-1B resides in a small cluster or association with several neighbouring stars within a few arcseconds (Figure 2). This means that its nearest neighbours potentially impact our photometric and spectroscopic observations, depending on the relative brightness as MCA-1B changes, but also depending on seeing, pixel scale, and photometry parameters, as well as spectroscopic slit width and orientation. This complicates the interpretation of the light curve and spectral evolution. The crowded region is also interesting from the perspective that it is actually quite unusual for LBVs; most LBVs appear to shy away from crowded regions with clusters of O-type stars (Smith & Tombleson, 2015). This is thought to be the result of binary evolution, either through kicks from a companion’s SN explosion or by rejuventation555“Rejuvenation” (Dray & Tout, 2007; de Mink et al., 2013; Justham et al., 2014; Schneider et al., 2016) refers to a star that accretes through mass transfer in a binary or undergoes a merger, evolving thereafter as if it were a younger, more massive, rapidly rotating, and more luminous star (i.e., a massive blue straggler). (Aghakhanloo et al., 2017; Smith & Tombleson, 2015; Smith, 2016, 2019). Interestingly, Smith & Tombleson (2015) also found that WC stars were more isolated than expected from single-star evolution. Here we have both an LBV and a WC star in the same cluster, offering the opportunity to constrain the age of the cluster and thus the initial mass of both the LBV and WC star.
4.1 Crowded photometry
The most direct impact of this contaminating light is on the photometry and light curve. For PSF-fitting photometry in the PTF images, which had 2″ typical image quality and 1″ pixels, and used an initial 3″ PSF-fitting radius, there is more contaminating flux from neighbouring stars than in the K61 images with 1″ typical image quality and 043 pixels (compare Figures 1c and 1d). This is why the late-time PTF magnitudes are brighter than K61 magnitudes in Figure 3.
We are interested in the true variability amplitude of MCA-1B, so we must make some correction for contaminating light. The sharpest available image is the HST/WFPC2 F606W image taken in 1994 (Figure 2). It is clear that there are several neighbouring stars within 2–3″. We experimented with photometry in various-sized apertures and with PSF fitting on blurred images to make a rough assessment of the contamination that might be present in the different ground-based images. Depending on conditions, we find it likely that roughly 30% of the total flux in PTF and super-LOTIS images at late times is contributed by neighbouring stars (requiring a correction of 0.3 mag).
Guided by this likely contamining flux estimated from the HST image, we therefore adopted a baseline flux level to subtract from all of the PTF photometry. This is not a precise correction because it is a different filter, and because the seeing and therefore contamination varied from one epoch to the next. However, the variability timescale is much slower than our typical PTF cadence, so the average trend in the data gives a good representation of the average light curve. This chosen correction allows the K61 and PTF photometry to agree at late times. The resulting adjusted light curve from the PTF and K61 photometry is shown in Figure 4. We think that the light curve in Figure 4 is a much better representation of the true variability of MCA-1B than the raw photometry with no correction in Figure 3.
There are two key consequences of including these corrections. First, the full amplitude of variability is greater, because the relative correction is small when MCA-1B is bright and larger when it has faded. Second, with this correction applied, it appears that in the last few years, MCA-1B has settled down to be roughly comparable to its pre-outburst quiescent magnitude (or even fainter), signaling the end of its current eruption. Compared to its state in the early 1990s and its post-outburst quiescent state, MCA-1B brightened by about 1.4 mag. The amplitude is comparable to that of classical LBV eruptions of S Doradus variables. We show the light curve of the classic Galactic LBV star HR Car again for comparison in Figure 4, although there is considerable diversity among the light curves of LBVs (see, e.g., van Genderen 2001). We also show the -band light curve of the classic Hubble-Sandage variable AF And in M31 (Joshi et al., 2019). AF And in M31 and MCA-1B in M33 are remarkably similar in terms of their peak amplitude, duration, decay rate, and long post-eruption quiescence.
4.2 Crowded spectroscopy
The other main observational effect of the crowded region is its impact on the spectrum, which changes depending on observing conditions and instrument parameters. Nearby main-sequence OB stars in the host cluster don’t matter very much for the appearance of the spectrum; they are relatively faint at visible wavelengths and have mostly hot continuum plus some weak absorption lines. This contamination can influence the measured line equivalent widths (EWs), just as it does the broadband photometry, because it adds continuum flux without adding emission-line flux. We found significant night-to-night variations in line EW measurements, and it was generally true that the EWs were relatively weaker (up to about 40% in some cases) on nights with poorer seeing; this is as expected, because there would be more contaminating continuum light from the cluster when the seeing is bad. The LBV spectrum is mostly free from contamination at early times when it outshines the cluster light.
In terms of spectral features, the most important source of contaminating light that influenced the appearance of the spectrum is MCA1, a luminous WC star located 2″ away. This star has very strong, broad emission lines that can be seen in two-dimensional long-slit spectra when the slit position angle includes light from this star, or when the seeing was relatively poor, as noted earlier.
In general, the relative contamination of the spectrum by the WC star grows with time as the transient fades slowly, although it varies considerably from one spectroscopic observation to the next. The most noticable contaminating features in the spectrum are the blue and red “WR bumps” that are known to be strong emission features in WC stars. These are due primarily to He ii 4686 in the blue WR bump and C iv 5808 in the red WR bump. These are noted by grey vertical shaded bars in Figure 6. We also show the spectrum of the neighbouring WC star itself at the bottom of Figure 6 in orange. The continuum slope of the WC star is roughly the same as that of the primary target (both are sampling the Rayleigh-Jeans tail of a hot star), so its contaminating continuum light does not alter the apparent shape of the continuum for the LBV. Looking through the series of spectra of MCA-1B in Figure 6, one can see that some epochs have strong contamination from the WR bumps, especially on 2016 Jan. 1, 2017 Aug. 29, 2017 Oct. 8/10, and 2017 Dec. 15, for example. Overall, then, the apparent changes in the broad WR bumps at late times should be ignored by the reader. The red WR bump is especially noticable, and is present to some degree in all the spectra after the early-time peak. In the early epochs during the main peak in 2010, the contamination from the neighbouring WR star is negligible, because the LBV is much brighter.
Narrow emission lines in the spectrum are all due to the LBV, and their profiles are largely unaffected by the contaminating cluster or WC star light in the spectrum. (Their equivalent widths, however, could be affected if there is extra continuum included in the slit; we return to this later in Section 5.2.) No narrow lines are seen in the WC star on nights with good seeing when its spectrum can be well separated, and no broad lines are seen in the LBV on those same nights except for moderately broad electron-scattering wings of strong narrow lines.
The strong WC contamination of the red WR bump, however, complicates the measurement of the narrow He i 5876 line that we discuss below. This is exacerbated by the consistent presence of P Cygni absorption in He i 5876. These effects can alter the measured EW and full width at half-maximum intensity (FWHM) of the narrow He i 5876 emission. We note appropriate caution below.
5 Physical Parameters
5.1 The 1990s progenitor
Prior to the PTF discovery of eruptive variability in 2010, MCA-1B was not known to be significantly variable. The quiescent progenitor star was, however, subjected to close scrutiny and quantitative spectroscopic analysis.
Based on detailed studies and quantitative analysis of the spectrum in the 1990s, physical parameters have been estimated for the quiescent Ofpe/WN9 progenitor star MCA-1B. Crowther et al. (1995b) estimated log() = 5.9 and = 29 kK, and in a related study, Smith, Crowther, & Willis (1995) similarly estimated log() = 5.84, = 29 kK, yr-1, and a terminal wind speed of = 420 km s-1. In both studies, the derived bolometric luminosity depends on the effective temperature, but is tied to the visual magnitude. Both of these studies adopted mag and mag.
However, as noted above, a comparison of HST and various ground-based images reveals some contamination from nearby stars in ground-based photometry. Adopting instead an approximate -band apparent magnitude of 17.79 indicated by HST imaging around the same time, the luminosity would be scaled down by mag or dex, to about log() = 5.72. Based on comparing the luminosity to single-star evolution models, Smith, Crowther, & Willis (1995) estimated that this corresponds to an initial mass for MCA-1B of around 50 , although with the lower luminosity that has been corrected for contaminating light of nearby stars, the initial mass implied by single-star evolutionary models would be more like 40–45 .
5.2 The hot temperature and bolometric luminosity at peak
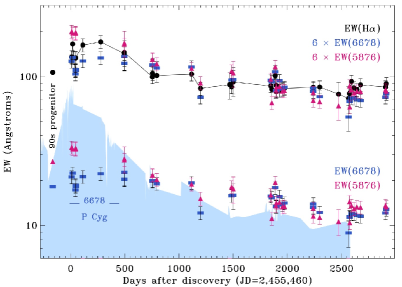
The overall spectral evolution of MCA-1B is shown in Figure 6, while details of the line-profile variation of H, He i 6678, and He i 5876 are shown in Figures 7, 8, and 9, respectively. The temporal evolution of emission-line EWs of He i 5876, 6678, and H is shown in Figure 10.
The spectral evolution of MCA-1B exhibits subtle changes in the intrinsic spectrum, at least compared to the much more dramatic temperature shifts usually seen in LBVs. It retains a late WN-type spectrum throughout its eruption. The continuum slope remains constant throughout the eruption, from which we infer that the fading from peak is not attributable to dust formation. There are some apparent changes in Figure 6 that can, however, be attributed to contamination from nearby sources if we account for two effects that have been noted above.
First, the emission-line morphology is dominated by the narrow-line spectrum of the LBV, except for the two WR bumps. As noted earlier, these broad features are due to contamination from the nearby WC star MCA-1. This is clearly evident when one considers the fact that on certain dates with good seeing conditions, such as the LBT spectrum on 2015 Nov. 23, these broad WR bumps are absent from the LBV spectrum, and on that same date it is clear that those lines are fully attributable to the WC star. Ignoring contamination from these broad WC lines, the morphology of the spectrum remains consistent with a hot Ofpe/WN9 star at peak, retaining a late-WN type at all times.
Second, we know from comparing HST and ground-based imaging photometry, discussed above, that as the LBV fades, there is an increase in the relative contamination of continuum light from unresolved neighbours. This contamination is negligible at peak when the LBV is bright, but we estimated that in ground-based data, unresolved neighbours may contribute roughly 30% of the visible-wavelength continuum at late times. This extra continuum can cause a quantitative change in the measured EWs with time, but will vary with seeing conditions and slit widths of the spectroscopic observations. Even if the intrinsic spectrum of the LBV had no change from peak to quiescence, we would expect that the emission-line EWs of various lines should decrease at late times. This is in fact what is observed, except that the change is larger (about a factor of 2) than can be explained by 30% contaminating continuum light alone. Examining the time dependence of EWs for He i 5876, 6678, and H (Figure 10), the measured EWs decrease in-step by about a factor of 2 from peak to quiescence. Emission lines are indeed stronger in brighter phases of the eruption.
The ratio of H to these He i lines is roughly constant as the LBV fades. In addition to measured EWs, Figure 10 shows EWs of the two He i lines scaled up by a factor of 6. This artificial shift makes their EWs appear comparable to that of H for comparison. As the LBV fades, this relative offset between He i lines and H stays roughly the same.
Since emission lines of He i require relatively high excitation in the wind compared to H, the ratio of H to these He i lines is sensitive to temperature changes (Crowther et al., 1995b; Smith, Crowther, & Willis, 1995). The EW evolution for each of the two He i lines shown in Figure 10 behaves somewhat differently with time, however. The EW of He i 5876 maintains a constant ratio of about 1/6 of EW(H) within the uncertainties, whereas the EW of He i 6678 is below this trend for the first days during and after peak, but then follows the same trend as the EW of He i 5876 for the remainder of the observations. This time period when He i 6678 seems to have a weaker EW coincides with a time period when this line also has a relatively strong P Cygni absorption feature, as can be seen in Figure 8. The time period with this deficit is annotated as “6678 P Cyg” in Figure 10, after which the P Cyg absorption disappears. He i 5876 shows blueshifted P Cygni absorption in its profile as well (Figure 9), but in this case the P Cygni absorption remains present at all epochs. Since the EW(H)/EW(He i) ratios remain roughly constant (except for the early period with extra P Cygni absorption in He i 6678), it is likely that the temperature in the line-forming region of the wind never drops below about 29 kK during the eruption. In fact, the star gets even hotter at late times (see below).
Unlike He i 5876 and 6678, the He i 7065 line does change its relative strength with time, being relatively stronger when the LBV is near the peak of its eruption (see Figure 6). This may be a density effect, since the He i 7065/5876 flux ratio is sensitive to density, with relatively stronger 7065 emission at higher densities (Almog & Netzer, 1989). This implies a higher mass-loss rate in eruption.
While there are subtle temperature shifts that cause MCA-1B to vary among the late-WN subtypes, as discussed in the next section, it is clear that this eruption does not fit the traditional description of an S Doradus outburst. In particular, this is unlike previously studied cases where an Ofpe/WN9 star was observed to undergo a standard S Doradus LBV eruption, when the temperature became much cooler and the star became an F-type supergiant, as in the classic cases of AG Car in the Milky Way and R127 in the LMC (Wolf & Stahl, 1982; Stahl et al., 1983).
At the peak of its eruption, its spectral morphology seemed consistent with the Ofpe/WN9 progenitor in the 1990s (Crowther et al., 1995b; Smith, Crowther, & Willis, 1995). This implies that — in contrast to standard LBVs that show dramatic temperature variations as they erupt — MCA-1B appears to have brightened by mag while staying at roughly constant temperature. Moreover, that temperature was hot (29 kK) as compared to the usual cool eruptive states of LBVs (7500–8500 K).
If the effective temperature was roughly constant as it brightened, then MCA-1B’s constant temperature requires a significant (factor of 3–4; mag) increase in bolometric luminosity. As such, the outburst of MCA-1B is more like a giant eruption than an S Doradus event. Some giant eruptions do evolve to cooler temperature at peak, as in the case of light echoes from Car (Rest et al., 2012; Prieto et al., 2014). Other cases remain uncertain; for example, we have no information about the temperature evolution in P Cygni’s 1600–1650 CE eruption. There are some known examples of extragalactic LBV eruptions and SN impostors that show relatively hot temperatures throughout their evolution. These include V1 in NGC 2366 (Drissen et al., 2001), HD 5980 in the SMC (Drissen et al., 2001; Barba et al., 1995), GR 290 in M33 (Polcaro et al., 2016), SN2000ch (Smith et al., 2011), and the progenitor outbursts of SN 2009ip (Smith et al., 2010), although most of these objects did not exhibit WN-type spectra at maximum brightness. In a decade-long HST study of bright variables in M51, Conroy et al. (2018) detected several bright blue variable stars that brighten or fade by 1 mag without a strong colour change (see their Figure 13). Thus, MCA-1B seems to be a member of a growing class of LBV eruptions that do not conform to standard expectations of cooler peak temperatures. The fact that MCA-1B was an Ofpe/WN9 star that underwent an eruption, even though it remained hot, makes an interesting counterpoint to other LBV eruptions where an Ofpe/WN9 star erupts but becomes much cooler. The physical mechanims that control the temperature evolution (hot or not) during an LBV eruption remain poorly understood, but might be related to low metallicity or binarity.
5.3 The even hotter post-eruption star
We noted above how little the temperature changed during the eruption of MCA-1B, at least compared to classical LBV eruptions. MCA-1B retained a late-WN spectrum at all times and never became much cooler as classical S Dor variables do when they exhibit F-type spectra. A closer look, however, reveals subtle temperature variation, shifting among late-WN subtypes.
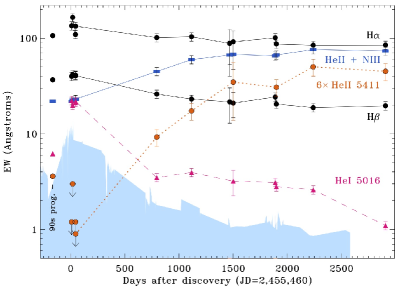
This is evident when looking at lines in the blue spectrum, around H and the blue WR bump, during the long decline for several years after peak brightness. This portion of the spectrum is shown in Figure 11, although note that only some of our spectral epochs covered the relevant blue wavelengths, and several of those (not shown in Figure 11) had significant contamination from the nearby WC star. In Figure 11 we only show epochs judged to have little contamination from that WC star.
Although MCA-1B had a late-WN spectrum at all times, the changes to note in particular concern the relative strengths of He i and He ii lines, plus H and N lines. At early times (October 2010), He i lines like 4492 and 5016 are quite strong, but they weaken or disappear at later epochs. In contrast, He ii 5411 was absent at early times and He ii 4542 was a barely-detected P Cygni profile, but these lines become stronger at late times with He ii 5411 clearly in emission. Notably, the blue WR bump (He ii 4686 + N iii 4634) is present at early times in eruption, but much weaker than H. After about 2012, He ii 4686 becomes as strong as (or stronger than) H.
Measured EWs of some of these blue lines are shown in Figure 12. While H has a gradual decline qualitatively like H, it is quite clear that the blue He i lines show a dramatic anticorrelation with He ii, with the He ii lines strengthening as He i lines fade much more quickly than Balmer lines. Notice the different behaviour with time of He i 5016 as compared to He ii 5411. These changes require temperature shifts rather than just changes in mass-loss rate. Examining spectral classification criteria for WN stars (Crowther et al., 1995b; Smith, Crowther, & Willis, 1995), MCA-1B resembles a subtype of WN10 or WN11 at times near and shortly after the peak of the eruption in 2010, and then after 2012 it shifts to a hotter subtype more like WN8 or even WN7. These changes in WN subtype would correspond roughly to a shift in temperature from around 29 kK near the peak of the eruption, to hotter temperatures around 40 kK or more at late times (Hamann, Koesterke, & Wessolowski, 1995; Hamann, Gräfener, & Liermann, 2006). MCA-1B in its post-eruption state is significantly hotter than the S Dor instability strip for its luminosity. The precise value of the stellar temperature indicated by the spectrum requires a more detailed analysis and careful modeling of the spectrum, but the changes in WN subtype described here are sufficient to note that the post-eruption star shifted to significantly higher temperatures than for the 1990s progenitor or the peak of the eruption. These changes are extremely unusual for an LBV-like eruption, and they constitute the first case where an outbursting massive star retained a WN spectrum throughout its eruption.
5.4 Changing outflow speed and radius
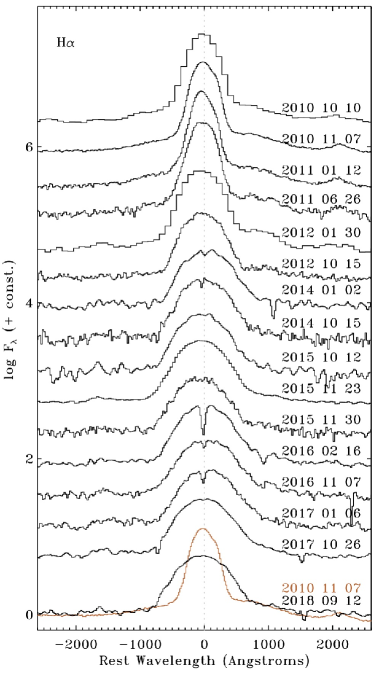
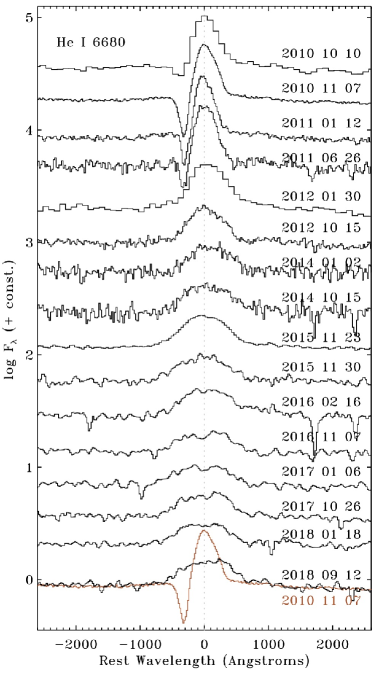
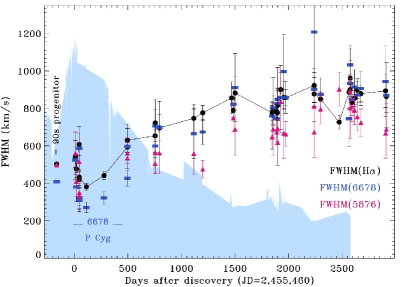
Figures 7, 8, and 9 show the evolution of emission-line profiles for H, He i 6678, and He i 5876, respectively. In each panel, the top few spectra coincide with times around maximum luminosity in MCA-1B’s eruption, and the lower portion of each panel traces the late-time quiescent phase. It is apparent from these figures that the emission lines were narrower at early times, and broader at later times when the outburst faded. In each panel, the bottom tracing corresponding to the last epoch (black) is overplotted with the first epoch (orange) at times near peak. This direct comparison shows clearly that the lines were narrower near peak luminosity. This is most apparent in the He i 5876 line, which shows P Cygni absorption at all epochs, and where the centre of the P Cygni trough has clearly shifted to higher blueshifted velocity at late times.
Figure 13 shows the measured FWHM of each of these three emission lines as a function of time. While each line has a slightly different width because they are formed at different depths in the wind, all three show the same trend of steadily increasing velocity with time as the brightness faded (the shaded blue area is a representation of the light curve for comparison). Note that at times near peak, He i 6678 shows P Cygni absorption that then goes away, making the overall contrast in width larger for this line, because the P Cygni absorption reduces the emission component’s width an additional amount near peak. (H shows no P Cyg absorption at any epoch, and He i 5876 shows P Cyg absorption at all epochs.) The wind speed near peak was around 300–400 km s-1, while the lines broadened to more like 800–900 km s-1 at late times when the star faded. The H FWHM was around 500 km s-1 for the 1990s progenitor (Smith, Crowther, & Willis, 1995).
Thus, while MCA-1B did not show a major shift to cooler temperatures at peak brightness, it did exhibit a clear change in wind speed. In the radiation-driven winds of hot stars, one expects the wind speed to be roughly proportional to the star’s escape speed. Typically for hot stars above 21 kK, one expects (Lamers, Snow, & Lindholm, 1995). Since the temperature did not drop substantially, this approximate ratio should hold throughout the eruption. As the star’s radius changes, the outflow speed should scale roughly as .
First, we compare the pre-eruption star to the properties at the peak of the eruption. MCA-1B brightened by 1.4 mag at roughly constant emitting temperature compared to the 1990s progenitor. The star must have increased its bolometric luminosity by a factor of 3.0–3.6. Without any significant change in temperature from the 1990s progenitor to the eruption peak, this increase in also requires an inflation of the star’s photospheric radius by a factor of 1.7–1.9. This larger radius would reduce the star’s escape speed and presumably its wind terminal speed to about 75% of its pre-outburst value. This is in reasonable agreement with the drop in H FWHM from around 500 km s-1 to 400 km s-1 (80%), or the drop in the He i 6678 width from 420 km s-1 to 300 km s-1 (70%).
Next, consider the several years during MCA-1B’s post-eruption decline in brightness, when emission-line widths steadily increased. The wind speed roughly doubled, with the H FWHM rising from around 400 km s-1 up to 800–900 km s-1 (Figure 13). As noted earlier, the velocity of the P Cygni trough of He i 5876 also increased in speed from about km s-1 to roughly km s-1. Instead of returning to the temperature of the 1990s progenitor, MCA-1B became even hotter while fading to roughly the same visual magnitude. This implies that the star was even more compact after the eruption than before, and hence, had an even higher escape velocity. The effective temperature after eruption is uncertain, but may have plausibly been 40 kK or more (Hamann, Gräfener, & Liermann, 2006), based on the WN8 or WN7 spectral type indicated by blue emission-line ratios. If the bolometric luminosity dropped by a factor of from peak to post-eruption quiescence, and the temperature increased from about 29 kK to 40 kK or more, then we should expect the wind velocity to increase by a factor of 1.8–1.9 from peak to the post-eruption state, just from the change in stellar radius. This is not far from the factor of increase in wind speed that is observed.
The slower wind speed at peak luminosity might also help account for the changes in observed emission-line strengths. While the line ratios of strong He i lines (like 5876 and 6678) to H did not change much during the eruption, the larger EW values at peak brightness mean that all these emission-line fluxes were stronger at peak. The EW values were about 2 times higher at peak (Figure 10) when the continuum was about 3.6 times brighter, indicating a factor of 7–8 increase in emission-line fluxes at peak as compared to late-time quiescence. A slower wind can make emission lines stronger, even with no change in mass-loss rate, because the emissivity of these lines varies with electron density as . If the wind speed at maximum luminosity slowed to half of the quiescent value, the wind density would have been 2 times higher, and the lines could have been 4 times stronger (this assumes that the lines form at radii much larger than the photospheric radius, which is also changing). The relatively strong He i 7065 emission in eruption, noted above as a density effect (Almog & Netzer, 1989), is consistent with a denser eruption wind.
The larger emission-line strengths at peak may indicate, very roughly, an increase in the star’s mass-loss rate by a modest factor of around 2 during eruption. A more precise quantitative constraint on the mass-loss rate and emitting temperature would require a more detailed model of the spectrum. This was already done for the Ofpe/WN9 progenitor, yielding a mass-loss rate of roughly yr-1 (Smith, Crowther, & Willis, 1995). This mass-loss rate is already near the upper limit of what can be achieved with standard line-driven winds (Smith & Owocki, 2006), and so an increase in both and the mass-loss rate above the quiescent value may indicate a transition to a super-Eddington continuum-driven wind (Owocki et al., 2004). Massive stars already reach appreciable values of to 0.5 in their late main sequence (Schaller et al., 1992; Smith & Conti, 2008), so an increase in the bolometric luminosity by a factor of a few would plausibly have driven MCA-1B to a mildly super-Eddington state.
5.5 On the HR diagram
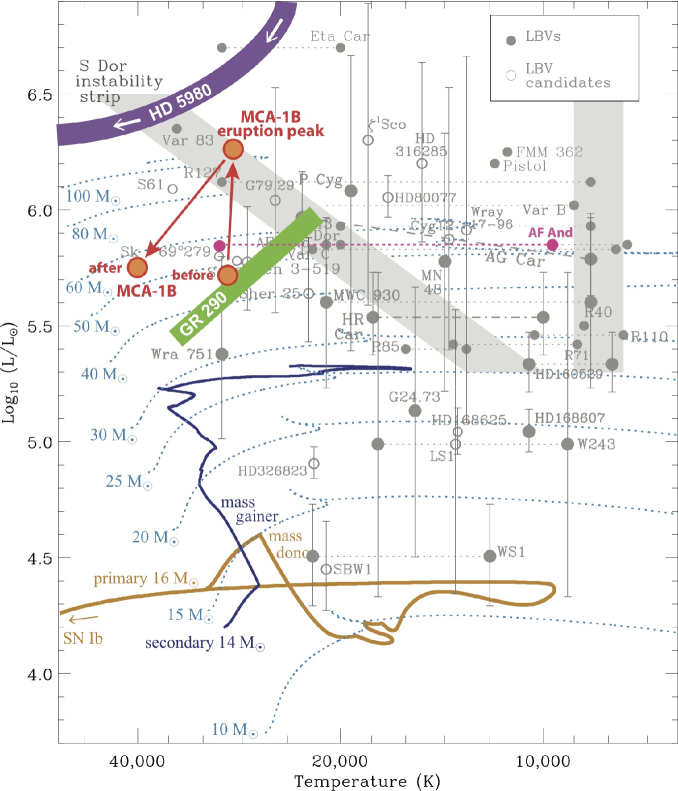
It is instructive to compare the properties of MCA-1B at quiescence and eruption to other LBVs placed on the HR diagram. Following Crowther et al. (1995b) and the discussion above we adopt a constant temperature of about 29 kK for the progenitor and eruption peak, then transitioning to a hotter temperature of around 40 kK or more in the years after eruption. We adopt a quiescent luminosity of log() = 5.72 and a luminosity at the peak of its eruption in late 2010 of log() = 6.28. While admittedly the temperature may not be precisely constant before and during eruption (we have not actually derived a quantitative temperature value at each epoch of spectra), it clearly does not drop below kK like other eruptive LBVs. With this assumed temperature behaviour, MCA-1B is shown on the HR diagram in Figure 14, along with several other known LBVs (from Smith et al. 2019).
In its hot quiescent state, MCA-1B does not reside on the S Dor instability strip, as LBVs are traditionally expected to do; instead, the progenitor is well below and/or hotter than the strip (Fig. 14). With revised distances or quantitative spectroscopic analysis, several other LBVs and LBV candidates are also located in this area, such as the LBV candidates Hen 3-519 in the Milky Way and Sk 279 and S119 in the LMC, as well as the LBVs AF And and Wra 751 (see Smith et al. 2019 and references therein).
Interestingly, when MCA-1B brightened in outburst, it did then move onto the S Dor instability strip. This is very unusual behaviour for LBV-like stars; LBVs generally reside on the S Dor strip in their hot quiescence, and they are thought to move horizontally to cool temperatures. Those temperature shifts at (assumed) constant bolometric luminosity are indicated by the dashed horizontal lines for other LBVs in Figure 14. It is very clear that MCA-1B did not take on a cooler F-type supergiant spectrum in this way. When its eruption ended, MCA-1B moved to even hotter temperatures far from the S Dor instability strip.
Consider the two contrasting cases of MCA-1B in M33 and the classic Hubble-Sandage variable AF And in M31. Both stars sit in a similar location on the HR diagram at quiescence. The -band light curves of eruptions from these two stars are almost identical in terms of amplitude, duration, decay rate, and a long period of post-eruption quiescence, except that AF And is a bit brighter at all times (Figure 4). The stark difference is that at peak brightness, MCA-1B retained its hot Ofpe/WN9 spectrum, whereas AF And has been seen to cool in its brighter phases to around 10 kK (Gallagher et al., 1981), as traditionally expected for S Dor variables. It was thought to cool similarly in its most recent eruptions based on photometric colours (Joshi et al., 2019), although spectra of these cooler phases in the most recent eruption have not been published. Another difference is that MCA-1B transitioned to even hotter temperatures (a WN7/8 subtype) after eruption.
This behaviour of MCA-1B is thus far almost unprecedented among well-studied LBVs. While we noted above some cases of LBV-like eruptions that remained hot at peak (SN 2009ip, SN 2000ch, and V1 in NGC 2366), these are more dramatic cases of SN impostors or pre-SN outbursts; they were not as hot and did not show WN-type spectra at their eruption peak, and their properties in their quiescent states were not as well characterised. As noted earlier, there are luminous and blue variable stars in M51 that move vertically in a colour-magnitude diagram (i.e., they brighten at constant colour; Conroy et al. 2018). Perhaps these are something similar, although they have not been studied spectroscopically yet. There are, however, two intriguingly similar cases among spectroscopically studied LBVs, discussed next.
5.5.1 HD 5980 in the SMC
One similar case is the massive LBV system HD 5980 in the SMC, which is a multiple massive-star system containing an eclipsing binary of two WN stars, of which the erupting member has retained significant hydrogen in its atmosphere. It is the most luminous star in the SMC, and had a dramatic LBV eruption in 1994; see the recent detailed study of its post-eruption behaviour by Hillier et al. (2019), and previous reviews and investigations of its evolution during and after eruption (Barba et al., 1995; Moffat et al., 1998; Drissen et al., 2001; Koenigsberger et al., 1994; Koenigsberger, 2004; Koenigsberger et al., 2014; Georgiev et al., 2011). Although it is the most luminous star in the SMC, it is unexpectedly isolated, being located 30 pc outside the massive central cluster of NGC 346, and 20 pc from any other known O-type star (Smith & Tombleson, 2015).
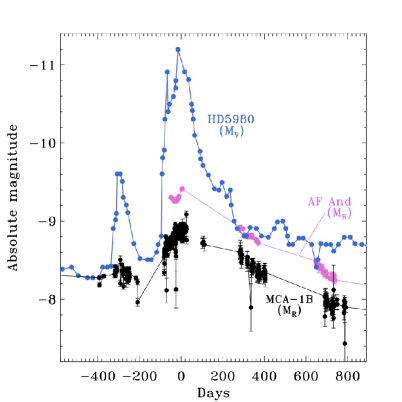
The light curve of HD 5980’s eruption is shown in Figure 15, where it is compared with AF And and MCA-1B. Although these are different filters (visual estimates for HD 5980, and for MCA-1B and AF And), both HD 5980 and MCA-1B experienced little colour change because they remained hot and optical bands are on the Rayleigh-Jeans tail. All three eruptions have similar shape and timescale, but HD 5980 has a larger increase in luminosity. This plot even makes it seem as though HD 5980 and MCA-1B both have a weaker precursor eruption at around days relative to the main peak, although it is difficult to interpret the significance of this with available data.
The erupting star in HD 5980 has since transitioned to an earlier WN type after the eruption and the wind speed has increased as the star became hotter (Hillier et al., 2019), qualitatively similar to the behaviour of MCA-1B in its latest phases reported here. The approximate post-eruption trajectory of HD 5980 on the HR diagram is indicated by the purple arc in Figure 14. Unlike MCA-1B, the eruption spectrum of HD 5980 was described as B-type (B1.5 Ia+) with a cooler temperature of roughly 23 kK (Drissen et al., 2001; Barba et al., 1995). The WR features significantly weakened or disappeared in eruption (Barba et al., 1995; Koenigsberger, 2004), although a WN11-like spectrum during eruption was also reported (Moffat et al., 1998). There are some indications that He ii 4686 was present in the erupting star, not the companion (Hillier et al., 2019). In any case, HD 5980 was similar to MCA-1B in the sense that it clearly did not transition to a very cool temperature (F-type, K) in outburst. In terms of its overall observed properties, the 2010 eruption of MCA-1B seems quite similar to the 1994 eruption of HD 5980 (although MCA-1B is less luminous). Both are shown on the HR diagram in Fig. 14.
The interpretation of HD 5980 is complicated by the fact that it is known to be a member of a short-period (19.3 day) eclipsing binary containing a massive WNE companion (Koenigsberger et al., 2014). Of course, we cannot rule out the possibility that MCA-1B shares similar complications, and this may be an important clue to understanding this peculiar subset of LBV behaviour in binaries. It could be interesting to monitor MCA-1B to search for radial-velocity variations. (Our lower resolution spectra are not adequate for this, but some of our higher resolution spectra are. Note that the line profiles in Figures 7, 8, and 9 have been shifted to emphasise line profile width and shape. A future paper will analyze possible radial-velocity variations after we obtain more data and subtract contaminating emission from the WC star MCA-1.)
5.5.2 Romano’s star (GR 290) in M33
Romano’s star (Romano, 1978), also called GR 290 or v532, is a luminous and peculiar LBV that is sometimes referred to as an LBV candidate because it does not quite fit expectations for typical LBVs — namely, it stays hot and shows little or no colour variation during eruptions, like MCA-1B. This LBV has been studied in detail; see the recent overview by Maryeva et al. (2019) and several other studies (Romano, 1978; Polcaro et al., 2003, 2016; Kurtev et al., 2001; Fabrika et al., 2005; Viotti et al., 2006, 2007).
GR 290 also resides in M33, and like MCA-1B is also found in its somewhat remote outer parts ( kpc from the centre), but on the eastern side of the galaxy. Like most LBVs, it is also relatively isolated, located about 125 pc from the nearest OB association OB89 (Maryeva et al., 2019).
GR 290 had a major eruptive episode that peaked in 1994, although its photometric evolution was much slower than that of MCA-1B and HD 5980. GR 290 shows a late WN-type spectrum at most epochs, although at the peak of its eruption in 1994 it showed a mid to late B-type spectrum (Polcaro et al., 2016), somewhat cooler than MCA-1B and more like HD 5980. As it faded for many years after its eruption, it slowly cascaded through late WN types, from WN10/11 to WN8, very much as MCA-1B did. The post-eruption trajectory of GR 290, adapted from Maryeva et al. (2019), is shown by the green diagonal bar on Figure 14. (Note that Polcaro et al. 2016 also document its post-outburst evolution, but have luminosity values shifted about 0.1 dex higher.) This behaviour resembles that of MCA-1B, and seems like a less luminous version of HD 5980. It is not yet known if GR 290 is a member of a binary system. GR 290 has been discussed as an LBV or a post-LBV object in transition to the WN phase, although such speculation about its age and evolution were based on single-star evolutionary models that might be inapplicable to these objects.
5.6 A subclass of WN-type LBVs
The class of massive stars known as LBVs is already a hodgepodge of irregular and eruptive variables that includes traditional S Dor variables, Car variables or giant eruptions, SN impostors, Cygni variables, P Cygni stars, and so on (Conti, 1984). Given the distinct similarities between MCA-1B, HD 5980, and GR 290, it seems worthwhile to proliferate yet another subset of LBVs that is distinct from normal S Dor variables. While these three stars provide a few well-studied examples, there may be many more; we noted earlier that an unbiased study of variables in M51 found many luminous blue stars that show little colour change as they brighten and fade (Conroy et al., 2018). Some key observed characteristics shared by MCA-1B, HD 5980, and GR 290, which set them apart from other LBVs, are as follows.
(1) In their fainter quiescent states, they have late WN-type spectra (WN7–WN9). Although some other S Dor-type LBVs have Ofpe/WN9-type spectra in quiescence, the WN-type LBVs reside well off the S Dor instability strip (below and to hotter temperatures).
(2) When experiencing significant eruptive episodes where they brighten by roughly 1 mag or more, they do not shift to much cooler temperatures (8–10 kK) as S Dor variables do. Instead, the WN-type LBVs stay well above 20 kK at all times, exhibiting late WN-type spectra at most times (WN10–WN11), with some showing B-type spectra at their coolest and brightest epochs.
(3) With their significant brightening and with little or no colour-temperature shift, these stars experience a substantial (factor of several) increase in bolometric luminosity during outburst. They do not, however, develop very cool temperatures as some LBV giant eruptions do (as in the case of the giant eruption of Car; Rest et al. 2012).
(4) Although they have WN-type spectra, they have retained some amount of hydrogen in their envelopes that may, nevertheless, indicate a lower H/He abundance ratio than other LBVs.
(5) Somewhat more speculatively, these objects seem to prefer relatively low metallicity, with HD 5980 residing in the SMC, and both MCA-1B and GR 290 in the low-metallicity outskirts of M33.
In addition to the possibility that this behaviour occurs in binary systems (certainly the case for HD 5980), two key issues stand out in the context of these unusual LBV eruptions. One is the relatively low-metallicity environments, where wind mass-loss may generally be weaker, and where the potential role of the Fe opacity bump in triggering the LBV instability (Jiang et al., 2018) may be diminished or may have different consequences for the amount of envelope inflation. It is quite likely that the lower metallicity may play an important role in the lack of observed temperature shifts in eruption. This may also significantly influence their evolution and instability, although there are still few examples of well-studied LBVs at low metallicity. Another issue is the possibility that such eruptive events may play an important role in the post-LBV transition to a WR star. MCA-1B and HD 5980 suggest that, at low metallicity at least, the eruptive LBV instability may persist into the early stages of the WR phase of evolution.
Lastly, an LBV-like eruption where the star remains hot and retains a WN-type spectrum at all times has possible links to certain peculiar SNe. Specifically, Type Ibn SNe represent a class of explosions that encounter strong interaction with circumstellar material (CSM), as in SNe IIn, but where the CSM is H-poor, causing an optical spectrum dominated by He i lines (Pastorello et al., 2008; Hosseinzadeh et al., 2017; Smith, 2017b). The best-studied case so far was SN 2006jc, which had a pre-SN outburst detected 2 yr before the SN, with a He-rich CSM shell expanding at around 1000 km s-1. This led to suggestions of a progenitor that had an LBV-like eruption, but in a hydrogen-deficient WR star (Pastorello et al., 2007; Foley et al., 2007; Smith et al., 2008).666Note, however, that evidence suggests not all SNe Ibn necessarily come from massive WR stars (Hosseinzadeh et al., 2019; Sanders et al., 2013). Cases have been seen with a range of H/He line strengths, suggesting that explosions occur in a continuum of stages caught between the LBV and WR phases (Smith et al., 2012; Pastorello et al., 2015). MCA-1B, GR 290, and HD 5980 are therefore valuable as potential analogs for the progenitor systems of such SNe Ibn, provided that they erupt shortly before death.
6 SUMMARY
We present the discovery of a new LBV-like star in M33, indicated by a nonperiodic brightening in 2010, and we present long-term follow-up photometry and spectroscopy. The progenitor star, named MCA-1B, was already known to be an Ofpe/WN9 star in the 1990s, and had been studied in detail (Willis et al., 1992; Smith, Crowther, & Willis, 1995; Bianchi et al., 2004). At that time, Smith, Crowther, & Willis (1995) proposed that it was a dormant LBV, which is now confirmed.
The 2010–2011 eruption brightened by 1.4 mag, but has since faded, returning approximately to its pre-outburst brightness. The evolution of the light curve was very similar to the classic LBV star AF And in M31 (Joshi et al., 2019), and to some other well-studied LBVs like HR Car. It is located in a small star cluster in M33’s remote western outskirts where the metallicity is roughly between that of the LMC and SMC, and we discussed the influence that these neighbouring stars (especially the WC star MCA-1) exert on the ground-based photometry and spectra. Observations require that the star increased its bolometric luminosity by almost a factor of 4 during the eruption, and increased its radius by about a factor of 2. MCA-1B may have reached or exceeded its Eddington limit during outburst.
Overall, the eruption of MCA-1B appears to show several of the hallmarks of an LBV giant eruption, with an increase in bolometric luminosity, an inflation of the photospheric radius, a slowing of the wind speed, an Ofpe/WN9 spectrum in its quiescent state, and possibly a modest increase in the mass-loss rate during eruption. Additionally, the overall appearance of the light curve is nearly identical to that of an eruption of the classic LBV star AF And in M31 (MCA-1B is just mag fainter).
It is therefore quite interesting and surprising that this eruption of MCA-1B did not exhibit one of the most commonly cited properties of LBV eruptions, which is a shift to cool apparent temperatures (8000–10,000 K) at peak brightness. Instead, MCA-1B retained its hot WN spectral type throughout its eruption. This behaviour is almost unprecedented among well-studied LBVs, with the closest analogues being HD 5980 in the SMC and GR 290 in M33. It is tempting to speculate that this lack of a temperature shift might be related to its relatively low metallicity, suggested by its remote location in the outskirts of M33. Like HD 5980, it may also be related to the progenitor residing in a short-period binary system, although information about possible binarity is not yet available for MCA-1B. In any case, the LBV-like eruption of a WN star is potentially important for understanding the progenitors of SNe Ibn, which based on their H-poor circumstellar shells, are inferred to have WR progenitors that erupted like LBVs. Moreover, it has been suggested that SN Ibn progenitors may have been caught in a brief post-LBV/WR transition when they erupted and then exploded, as inferred for MCA-1B, GR 290, and HD 5980.
We noted that there are some possible analogues that brighten without an accompanying colour change in a recent photometric study of M51 (Conroy et al., 2018), although these cases lack follow-up spectroscopy. We also noted a few SN impostors that exhibit hot temperatures at peak brightness (SN 2000ch, SN 2009ip, and V1 in NGC 2366), but these are more extreme phenomena. The location in the outskirts of M33 is intriguing in this regard, because it is very reminiscent of the isolated environment of SN 2009ip (Smith et al., 2016), which was also thought to be a massive LBV before death (Smith et al., 2010; Foley et al., 2011; Mauerhan et al., 2013, 2014; Graham et al., 2014, 2017; Reilly et al., 2017).
In studies of the variability of LBVs, it is often taken for granted that they shift to cool temperatures at peak, while maintaining constant bolometric luminosity (Humphreys & Davidson, 1994; Humphreys et al., 1999). As for HD 5980 and GR 290, MCA-1B suggests that this is not a safe assumption without corroborating evidence from spectra or colours, even if the light curve otherwise resembles a normal S Dor phase. The fraction of LBVs that lack a significant colour change and may be WN-type LBVs is not yet quantified. This, therefore, underscores the diversity in the class of LBVs, and that some past definitions of LBVs might have been too narrow. If MCA-1B were not regarded as a true LBV, then it would require the invention of yet another new subclass of luminous, blue, eruptive variables. The original intent of the term “LBV” (Conti, 1984) was to group all such observed phenomena together.
Acknowledgements
We thank Dovi Poznanski and Eran Ofek for assistance with the PTF photometry, and Yi Cao, Brad Cenko, Ryan Foley, and Shri Kulkarni for assistance with both photometric and spectroscopic observations obtained through PTF. We are grateful to Yogesh Joshi for sending a table of photometry for AF And prior to publication, and we thank Paul Crowther for providing spectra of the Ofpe/WN9 comparison stars in Figure 5. Support for N.S. was provided by NSF award AST-1515559, and by the National Aeronautics and Space Administration (NASA) through HST grant AR-14316 from the Space Telescope Science Institute, which is operated by AURA, Inc., under NASA contract NAS5-26555. A.V.F.’s research has been generously supported by the TABASGO Foundation, the Christopher R. Redlich Fund, and the Miller Institute for Basic Research in Science (U.C. Berkeley).
This paper is based in part on observations obtained with the Samuel Oschin Telescope and the 60 inch Telescope at the Palomar Observatory as part of the Palomar Transient Factory project, a scientific collaboration between the California Institute of Technology, Columbia University, Las Cumbres Observatory, the Lawrence Berkeley National Laboratory, the National Energy Research Scientific Computing Center, the University of Oxford, and the Weizmann Institute of Science. Observations using Steward Observatory facilities were obtained as part of the observing program AZTEC: Arizona Transient Exploration and Characterization, which receives support from NSF grant AST-1515559. Some of the data presented herein were obtained at the W. M. Keck Observatory, which is operated as a scientific partnership among the California Institute of Technology, the University of California, and NASA; the observatory was made possible by the generous financial support of the W. M. Keck Foundation. Research at Lick Observatory is partially supported by a generous gift from Google. Some observations reported here were obtained at the MMT Observatory, a joint facility of the University of Arizona and the Smithsonian Institution. This paper uses data taken with the MODS spectrographs built with funding from NSF grant AST-9987045 and the NSF Telescope System Instrumentation Program (TSIP), with additional funds from the Ohio Board of Regents and the Ohio State University Office of Research. We are grateful for the assistance of the staffs at the various observatories where data were obtained.
Facilities: HST (WFPC2), Keck:I (LRIS), Keck II (DEIMOS), LBT (MODS), MMT (Bluechannel), Lick: 3m (Kast), PO:1.2m, 1.5m, SO: Bok (B&C, SPOL), SO:Kuiper (Mont4K) SO:Super-LOTIS
References
- Almog & Netzer (1989) Almog Y, Netzer H. 1989, MNRAS, 238, 57
- Aghakhanloo et al. (2017) Aghakhanloo M, Murphy J, Smith N, Hlozek R. 2017, MNRAS, 472, 591
- Asplund et al. (2009) Asplund A, Ryon JE, Messa M, et al. 2009, ApJ, 841, 131
- Barba et al. (1995) Barba RH, Niemala VS, Baume G, Vazquez RA. 1995, ApJL, 446, L23
- Bianchi et al. (2004) Bianchi L, Bohlin R, Massey P. 2004, ApJ, 601, 228
- Bohannan & Walborn (1989) Bohannan B, Walborn NR. 1989, PASP, 101, 520
- Bonanos et al. (2006) Bonanos A. Z. et al., 2006, ApJ, 652, 313
- Brott et al. (2011) Brott, I., Evans, C. J., Hunter, I., et al. 2011, A&A, 530, A115
- Byard & O’Brien (2000) Byard PL, O’Brien TP. 2000, in Iye M., Moorwood A. F. M., eds, Proc. SPIE Conf. Ser. Vol. 4008, Optical and IR Telescope Instrumentation and Detectors. SPIE, Bellingham, p. 934
- Conroy et al. (2018) Conroy C, Strader J, van Dokkum P, Dolphin AE, Weisz DR, Murphy JW, Dotter A, Johnson BD, Cargile P. 2018, ApJ, 864, 111
- Conti (1976) Conti PS. 1976, Mem. Soc. R. Sci. Lie’ge, 9, 193
- Conti (1984) Conti PS. 1984. IAUS, 105: 233
- Crowther & Smith (1997) Crowther PA, Smith LJ. 1997, A&A, 320, 500
- Crowther et al. (1995a) Crowther PA, Hiilier DJ, Smith LJ. 1995a, A&A, 293, 172
- Crowther et al. (1995b) Crowther PA, Smith LJ, Willis AJ. 1995b, IAU Symp., 163, 331
- de Koter et al. (1996) de Koter A, Lamers HJGLM, Schmutz W. 1996, A&A, 306, 501
- de Mink et al. (2013) de Mink SE, Langer N, Izzard RG, Sana H, de Koter A. 2013, ApJ, 764, 166
- Dray & Tout (2007) Dray LM, Tout CA. 2007, MNRAS, 376, 61
- Drissen et al. (2001) Drissen L., Crowther P. A., Smith L. J., Robert C., Roy J. R., Hillier D. J., 2001, ApJ, 546, 484
- Faber et al. (2003) Faber SM, et al. 2003, Proc. SPIE, 4841, 1657
- Fabrika et al. (2005) Fabrika S, Sholukhova O, Becker T, Afanasiev V, Roth M, Sanchez SF. 2005, A&A, 437, 217
- Filippenko (1982) Filippenko AV. 1982, PASP, 94, 715
- Foley et al. (2007) Foley R. J., Smith N., Ganeshalingam M., Li W., Chornock R., Filippenko AV. 2007, ApJ, 657, L105
- Foley et al. (2011) Foley RJ, Berger E, Fox O, Levesque EM, Challis PJ, Ivans II, Rhoads JE, Soderberg AM. 2011, ApJ, 732, 32
- Gallagher et al. (1981) Gallagher JS, Kenyon SJ, Hege EK. 1981, ApJ, 249, 83
- Georgiev et al. (2011) Georgiev L, Koenigsberger G, Hillier JD, Morrll N, Barba R, Gamen R. 2011, AJ, 142, 191
- Graham et al. (2014) Graham ML, Sand DJ, Valenti S, et al. 2014, ApJ, 787, 163
- Graham et al. (2017) Graham ML, Bigley A, Mauerhan JC, et al. 2017, MNRAS, 469, 1559
- Groh et al. (2006) Groh JH, Hillier DJ, Damineli A. 2006, ApJ, 638, L33
- Groh et al. (2009a) Groh JH, Damineli A, Hillier DJ, et al. 2009a, ApJ, 705, L25
- Groh et al. (2009b) Groh JH, Hillier DJ, Damineli A, et al. 2009b, ApJ, 698, 1698
- Groh et al. (2014) Groh JH, Meynet G, Ekstrom S, Georgy C. 2014, A&A, 564, A30
- Hamann, Gräfener, & Liermann (2006) Hamann WR, Gräfener G, Liermann A. 2006, A&A, 457, 1015
- Hamann, Koesterke, & Wessolowski (1995) Hamann WR, Koesterke L, & Wessolowski U. 1995, A&A, 299. 151
- Hillier et al. (2019) Hillier DJ, Koenigsberger G, Naze Y, Morrell N, Barba RH, Gamen R. 2019, MNRAS, 486, 725
- Hosseinzadeh et al. (2017) Hosseinzadeh G, et al. 2017, ApJ, 836, 158
- Hosseinzadeh et al. (2019) Hosseinzadeh G, et al. 2019, ApJL, 871, L9
- Hubble & Sandage (1953) Hubble E, Sandage A. 1953, ApJ, 118, 353
- Humphreys & Davidson (1994) Humphreys RM, Davidson K. 1994, PASP, 106, 1025
- Humphreys et al. (1999) Humphreys RM, Davidson K, Smith N. 1999, PASP 111, 1124
- Jiang et al. (2018) Jiang YF, Cantiello M, Bildsten L, Quataert E, Blaes O, Stone J. 2018, Nature, 561, 498
- Jones & Sterken (1997) Jones AF, Sterken C. 1997, J. Astron. Data, 3, 4
- Joshi et al. (2019) Joshi YC, Sharma K, Gangopadhyay A, Gokhale R, Misra K. 2019, AJ, 158, 175
- Justham et al. (2014) Justham S., Podsiadlowski P., Vink J. S., 2014, ApJ, 796, 121
- Koenigsberger et al. (1994) Koenigsberger G., Moffatt AFJ, St-Louis N, Auer LH, Drissen L, Seggewiss W. 1994, ApJ, 436, 301
- Koenigsberger (2004) Koenigsberger, G. 2004, RevMexAA, 40, 107
- Koenigsberger et al. (2014) Koenigsberger G, Morrell N, Hillier DJ, Gamen R, Schneider FRN, González-Jimenez N, Langer N, Barba R. 2014, AJ, 148, 62
- Kurtev et al. (1999) Kurtev RG, Corral LJ, Georgiev L. 1999, A&A, 349, 796
- Kurtev et al. (2001) Kurtev RG, Sholukhova O, Borissova J, Georgiev L. 2001, Rev. Mex. AA, 37, 57
- Lamers, Snow, & Lindholm (1995) Lamers HJGLM, Snow TP, Lindholm DM. 1995, ApJ, 455, 269
- Langer & Kudritzki (2014) Langer N, Kudritzki RP. 2014, A&A, 564, A52
- Maeder & Conti (1994) Maeder A, Conti PS. 1994, ARA&A, 32, 227
- Magrini et al. (2007) Magrini L, Vilchez JM, Mampaso A, Corradi RLM, Leisy P. 2007, A&A, 470, 865
- Maryeva et al. (2019) Maryeva O, Viotti RF, Koenigsberger G, Calabresi M, Rossi C, Gualandi R. 2019, Galaxies, 7, 79
- Massey (2013) Massey P. 2013, New Astron. Rev., 57, 14
- Massey, Conti, & Armandroff (1987) Massey P, Conti PS, Armandroff TE. 1987, AJ, 94, 1538
- Massey et al. (1996) Massey P, Bianchi L, Hutchings JB, Stecher TP. 1996, ApJ, 469, 629
- Massey et al. (2006) Massey P, Olsen KAG, Hodge PW, Strong SB, Jacoby GH, Schlingman W, Smith RC. 2006, AJ, 131, 2478
- Massey et al. (2007) Massey P, et al. 2007, AJ, 134, 2474
- Mauerhan et al. (2013) Mauerhan JC, et al. 2013, MNRAS, 430, 1801
- Mauerhan et al. (2014) Mauerhan JC, et al. 2014, MNRAS, 442, 1166
- McConnachie et al. (2009) McConnachie AW, et al. 2009, Nature, 461, 66
- Mehner et al. (2017) Mehner A, Baade D, Groh JH, Rivinius T, Hambsch FJ, Bartlett ES, Asmus D, Agliozzo C, Szeifert T, Stahl O. 2017, A&A, 608, A124
- Miller & Stone (1993) Miller JS, Stone RPS. 1993, Lick Obs. Tech. Rep. 66, Lick Observatory, Santa Cruz
- Moffat et al. (1998) Moffat AFJ, Marchenko SV, Bartzakos P, Niemela VS, Cerruti MA, Magalhaes AM, Balona L, St-Louis N, Seggewiss W, Lamontagne R. 1998, ApJ, 257, 116
- Oke et al. (1995) Oke JB, et al. 1995, PASP, 107, 375
- Owocki et al. (2004) Owocki SP, Gayley KG, Shaviv NJ. 2004, ApJ, 616, 525
- Pastorello et al. (2007) Pastorello A, et al., 2007, Nat, 447, 829
- Pastorello et al. (2008) Pastorello A, et al., 2008, MNRAS, 389, 113
- Pastorello et al. (2015) Pastorello A, et al. 2015, MNRAS, 449, 1921
- Patel et al. (2017) Patel E, Besla G, Sohn ST. 2017, MNRAS, 464, 3825
- Polcaro et al. (2016) Polcaro VF, et al. 2016, AJ, 151, 149
- Polcaro et al. (2003) Polcaro VF, Gualandi R, Norci L, Rossi C, Viotti RF. 2003, A&A, 411, 193
- Prieto et al. (2014) Prieto JL, et al. 2014, ApJ, 787, 8
- Reilly et al. (2017) Reilly E, Maund JR, Baade D, et al. 2017, MNRAS, 470, 1491
- Rest et al. (2012) Rest A, et al. 2012, Nature, 482, 375
- Romano (1978) Romano G. 1978, A&A, 67, 291
- Sanders et al. (2013) Sanders N, et al. 2013, ApJ, 769, 39
- Schaller et al. (1992) Schaller G, Schaerer D, Meynet G, Maeder A. 1992, A&AS, 96, 269
- Schneider et al. (2016) Schneider FRN, Podsiadlowski P, Langer N, Castro N, Fossati L. 2016, MNRAS, 457, 2355
- Smith, Crowther, & Willis (1995) Smith LJ, Crowther PA, Willis AJ. 1995, A&A, 302, 830
- Smith (2014) Smith N. 2014, ARAA, 52, 487
- Smith (2016) Smith N. 2016, MNRAS, 461, 3353
- Smith (2017a) Smith N. 2017a, Phil. Trans. R. Soc. A, 375, 20160268
- Smith (2017b) Smith N., 2017b, in Alsabti A. W., Murdin P., eds, Interacting Supernovae: Types IIn and Ibn, Springer International Publishing, p. 403
- Smith (2019) Smith N. 2019, MNRAS, 489, 4378
- Smith & Conti (2008) Smith N, Conti PS. 2008, ApJ, 679, 1467
- Smith & Owocki (2006) Smith N, Owocki SP. 2006, ApJ, 645, L45
- Smith & Tombleson (2015) Smith N, Tombleson R. 2015, MNRAS, 447, 602
- Smith et al. (2008) Smith N, Foley RJ, Filippenko AV. 2008, ApJ, 680, 568
- Smith et al. (2010) Smith N. et al., 2010, AJ, 139, 1451
- Smith et al. (2011) Smith N, Li W, Silverman JM, Ganeshalingam M, Filippenko AV. 2011, MNRAS, 415, 773
- Smith et al. (2012) Smith N, Mauerhan JC, Silverman JM, Ganeshalingam M, Filippenko AV, Cenko SB, Clubb KI. 2012, MNRAS, 426, 1905
- Smith et al. (2016) Smith N, Andrews JE, Mauerhan JC. 2016, MNRAS, 463, 2904
- Smith et al. (2019) Smith N, Aghakhanloo M, Murphy JW, Drout MR, Stassun KG, Groh JH. 2019, MNRAS, 488, 1760
- Stahl (1986) Stahl, O. 1986, A&A, 164, 321
- Stahl et al. (1983) Stahl O, Wolf B, Klare G, Cassatella A, Krautter J, Persi P, & Ferrari-Toniolo M. 1983, A&A, 127, 49
- Stahl et al. (2001) Stahl O, Jankovics J, Kovacs J, Wolf B, Schmutz W, Kaufer A, Rivinius T, & Szeifert T. 2001, A&A, 375, 54
- Szeifert et al. (1996) Szeifert T, Humphreys RM, Davidson K, et al., 1996, A&A, 314, 131
- van Genderen (2001) van Genderen A. 2001, A&A, 366, 508
- Viotti et al. (2006) Viotti RF, Rossi C, Polcaro VF. 2006, A&A, 458, 225
- Viotti et al. (2007) Viotti RF, Galleti S, Gualandi R. 2007, A&A, 464, L53
- Walborn (1977) Walborn NR. 1977, ApJ, 215, 53
- Walborn (1982a) Walborn NR. 1982a, ApJ, 256, 452
- Walborn (1982b) Walborn NR. 1982b, IAU Circ. 3767
- Willis et al. (1992) Willis AJ, Schild H, Smith LJ. 1992, A&A, 261, 419
- Wolf & Stahl (1982) Wolf B & Stahl O. 1982, A&A, 112, 111