Median shift: a L1-wasserstein clustering algorithm, supplementary materials
We illustrate here by more results the median shift algorithm. We performed two more experiments: one on synthetic data, with a pure illustrative purpose, and one on real aeronautical data.
| Method | Adjusted Rand Index (Simulated) | Adjusted Rand Index (Real) |
|---|---|---|
| Affinity Propagation | 0.24 | 0.49 |
| Spectral Clustering | 0.11 | 0.44 |
| Ward | 0.0 | 0.41 |
| Agglomerative Clustering | 0.0 | 0.0 |
| DBSCAN | 0.0 | 0.0 |
| Gaussian Mixture | 0.97 | 0.41 |
| kmeans L2 | 0.0 | 0.41 |
| Birch | 0.0 | 0.41 |
| kmeans WS | 0.74 | |
| mean shift L2 | 0.3315 | 0.15 |
| median shift | 1.0 | 0.78 |
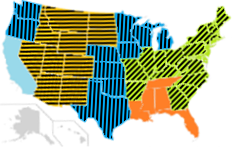
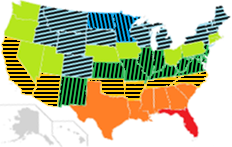
We worked on public climate data from the American National Oceanic and Atmospheric Administration 111The data we used are available at https://www.ncdc.noaa.gov/monitoring-references/maps/us-climate-divisions.php. For each state (except Alaska and Hawaii for which data are missing), we built the histogram of rainfall and of temperatures over the years as a feature. Then, we used these features to look for groups of states having similar behavior. We tested classical mean shift and our Wasserstein median median shift. We cannot compute the ARI indicator because there is no ground truth in this case, but we can look at the obtained results and qualitatively assess their relevance with respect to the different climates present in the USA. The results of a clustering based on temperatures are given on Figure 2. We see that Wasserstein median shift, as expected, isolates California and splits the north and south part of the east coast, which is not achieved by classical mean shift.
 |
 |
| Wasserstein median shift | Mean shift |
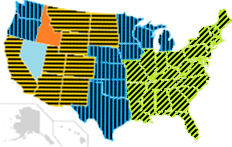
On Figure 3 the clustering is based on temperatures. The results are not as clear as with rainfalls, both methods returning horizontal slices more due to global temperature increase from north to south than to complicated histogram shape variations.
 |
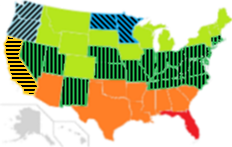 |
| Wasserstein median shift | Mean shift |
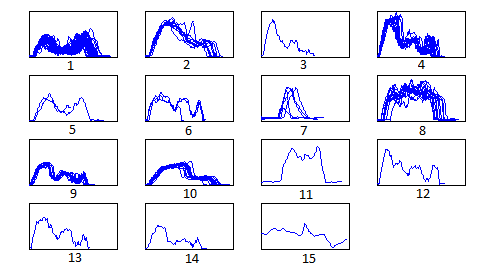
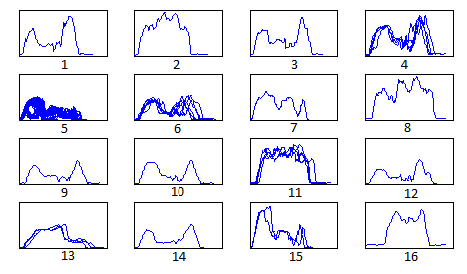
The histograms obtained for the seven categories of missions are displayed on Figure LABEL:fig::trajdata. We see that classical mean shift is not adapted to the problem: it gathers almost all flights in cluster 5. Conversely, all the true clusters are among those returned by the Wasserstein median shift. The ARI obtained for the mean shift is 0.15, as the ARI of our algorithm is 0.78. Even if the result is not perfect, our algorithm clearly outperform the classical mean shift in this practical case.
References
- [1] William M Rand. Objective criteria for the evaluation of clustering methods. Journal of the American Statistical association, 66(336):846–850, 1971.