A computational study of positive streamers interacting with dielectrics
Abstract
We use numerical simulations to study the dynamics of surface discharges, which are common in high-voltage engineering. We simulate positive streamer discharges that propagate towards a dielectric surface, attach to it, and then propagate over the surface. The simulations are performed in air with a two-dimensional plasma fluid model, in which a flat dielectric is placed between two plate electrodes. Electrostatic attraction is the main mechanism that causes streamers to grow towards the dielectric. Due to the net charge in the streamer head, the dielectric gets polarized, and the electric field between the streamer and the dielectric is increased. Compared to streamers in bulk gas, surface streamers have a smaller radius, a higher electric field, a higher electron density, and higher propagation velocity. A higher applied voltage leads to faster inception and faster propagation of the surface discharge. A higher dielectric permittivity leads to more rapid attachment of the streamer to the surface and a thinner surface streamer. Secondary emission coefficients are shown to play a modest role, which is due to relatively strong photoionization in air. In the simulations, a high electric field is present between the positive streamers and the dielectric surface. We show that the magnitude and decay of this field are affected by the positive ion mobility.
1 Introduction
Electric discharges in electronic devices and HV (high-voltage) equipment often occur along dielectric materials. In the regions of HV stress around an insulator, electron avalanches and streamer discharges can develop. These partial discharges may eventually result in surface flashover of the insulator, i.e., electric breakdown. In [1] it was found that around atmospheric pressure, surface flashover voltages were 10%-50% lower than flashover voltages in pure gas gaps. A dielectric present in the vicinity of the electrodes not only modifies the fields between the electrodes, but also serves as a possible source or sink of electrons during the breakdown process. Studying the interaction between dielectrics and streamer discharges is therefore important to understand surface flashover.
Early studies of surface discharges focused on the measurement of flashover voltage [2, 3]. In the past few decades, the use of high-speed cameras has revealed more details about the early stages of surface discharges. In several experiments, streamer discharges were observed to have an affinity to propagate along dielectric surfaces rather than through the background gas only [4, 5]. This affinity for a dielectric surface was reported to depend on the discharge gap geometry [6], gas composition, pressure [7], and dielectric properties [8, 9].
To gain more insight into the physics of surface discharges, different types of numerical simulations have been performed, see e.g. [7, 10, 11, 12, 13, 14, 15]. Studies on the interaction between plasmas and dielectrics have often been performed at lower pressure and in noble gases, where the discharge mechanisms are relatively well understood [16, 17]. Several authors have also studied surface discharges in atmospheric air. An incomplete list is given below.
Jorgenson et al. [10] investigated the role of photoemission in the surface breakdown process. With Monte Carlo simulations, they concluded that photoemission plays a role at low field values near the breakdown threshold. Celestin et al. [18] studied dielectric barrier discharges in air both experimentally and computationally, and highlighted the importance of surface charge. Jánský et al. [11] presented simulations of an air plasma discharge at atmospheric pressure, initiated by a needle anode set inside a dielectric capillary tube. Meyer et al. [19] studied surface streamers with a plasma fluid model in a 2D geometry. Agreement with empirical estimates for streamer propagation lengths was found, and it was observed that the surface charge quickly reaches so-called ‘saturation charge’ conditions. Babaeva et al. [20, 12] performed a computational investigation of nanosecond pulsed surface discharges of positive and negative polarity. A hybrid fluid-Monte Carlo model was used to more accurately capture secondary electron emission caused by positive ions and photons. Sima et al. [15] presented 2D axisymmetric fluid simulations of discharges spreading radially over a dielectric surface in a N2/O2 mixture. Furthermore, several computational studies of plasma-liquid interaction and plasma-tissue interaction have been performed at atmospheric pressure, see for example [21, 22]. In such studies, the liquid or skin is often modeled as a dielectric, sometimes with a finite conductivity.
The studies mentioned above have greatly improved our understanding of surface discharges in air. Here, this past work is extended in several ways. We consider a different geometry, namely a flat dielectric placed between parallel-plate electrodes. Streamers in this geometry can propagate along the dielectric or through the gas, in contrast to surface dielectric barrier discharges (SDBD), in which electrodes are completely separated by a dielectric [12, 23, 24]. This allows us to investigate the whole streamer-dielectric interaction, including discharge inception, attachment to the dielectric and propagation over the surface. Moreover, this geometry resembles some actual HV insulation applications [9, 25], e.g., insulators inserted between HV and ground electrodes in gas-insulated switchgear. Our focus here is on positive surface streamers, which can be computationally expensive to simulate. We have therefore developed an efficient fluid model with adaptive mesh refinement. For simplicity and efficiency, 2D simulations are used here, as full 3D simulations would still be very costly.
The content of the paper is as follows. The simulation model is described in section 2. In section 3.1, we focus on the attraction of streamers to dielectrics, and we look at the differences between surface and gas-phase streamers. Afterwards, several discharge parameters are varied, to study their effect on the streamer’s inception time, propagation velocity and morphology:
2 Simulation Model
The 2D fluid model used in this paper is based on Afivo-streamer [26, 27], which is an open-source plasma fluid code for streamer discharges that features adaptive mesh refinement (AMR), geometric multigrid methods for Poisson’s equation, and OpenMP parallelism. For a recent comparison of six streamer simulation codes, including Afivo-streamer, see [28]. We have made several modifications to be able to simulate surface streamers:
-
•
Electrons, ions and photons can be absorbed by dielectric surfaces.
-
•
Surface densities and fluxes are stored separately from their equivalents in the gas.
-
•
The electric field computation takes the surface charge into account.
-
•
A new Monte Carlo photoemission module was implemented, and the photoionization routines were adjusted to account for the dielectric.
These changes are described in more detail below.
With our 2D model, we effective simulate planar surface discharges. This leads to some differences compared to a full 3D description. First, the electric fields and charge densities in 3D are typically higher, as the streamer heads have a stronger curvature. Second, it is often observed that both surface and gas streamers are present in experiments [8, 29]. We do not observe these two components in our 2D model, but have seen them in preliminary 3D simulations that are still under development.
2.1 Fluid Model
The fluid model used here is of the drift-diffusion-reaction type with the local field approximation [30]. The model keeps track of the electron density ne, the positive ion density n and the negative ion density n, which involve in time as
| (1) | |||
| (2) | |||
| (3) | |||
Here, fluxes are indicated by a , is the electron mobility, the electron diffusion coefficient, the electric field, and the positive/negative ion mobilities. Furthermore, several source terms are present. The electron impact ionization and electron attachment terms are given by and , respectively, where and are the ionization and attachment coefficients. The production of photoelectrons from photoionization is included with the term . Secondary electron emission due to the impact of both ions and photons is accounted for by the term , defined below.
The local field approximation is used, so that , , and are functions of the local electric field strength. Electron transport and reaction coefficients for air (, ) were generated with Monte Carlo particle swarm simulations (see e.g. [31]), using Phelps’ cross sections [32]. The positive ion mobility is here considered to be constant, but in section 3.5 it is varied to investigate its effect on surface discharges. For simplicity, the negative ion mobility is set to zero () throughout the paper.
We assume that electrons and ions attach to the surface when they flow onto a dielectric. They do not move or react on the surface, but secondary electron emission from the surface is taken into account. For the impact of positive ions, a SEE (secondary electron emission) coefficient is used. When a photon hits a dielectric surface, we assume that the photon is absorbed. A SEE photoemission coefficient is used to determine the photoemission flux, see section 2.3. The effect of these SEE coefficients is studied in section 3.4, elsewhere they are set to zero. The secondary electron emission source term in equation (1) is non-zero only in cells adjacent to the dielectric surface. In these cells, it is given by
| (4) |
where is flux of positive ions onto the surface, and is the photoemission flux coming from the surface. By definition, both these fluxes are non-zero only at the surface.
Secondary emission leaves behind positive surface charge on the dielectric. Therefore, the surface charge density changes in time as
| (5) |
where is the elementary charge and the other terms correspond to the fluxes onto the dielectric surface: for electrons, for negative ions, for positive ions, and for photons. We study positive streamers, which means that electrons generally move away from dielectrics. Therefore, an accurate description of the electron flux towards the surface [33] is not required here.
2.2 Electric Field
The electric field is calculated by first solving Poisson’s equation for the electric potential :
| (6) |
where is the dielectric permittivity, is the volume charge density, and maps the surface charge on the gas-dielectric interface to the grid cells adjacent to the dielectric. Afterwards, the electric field is computed as
| (7) |
At the dielectric interface, we ensure that the normal component of the electric field satisfies the classic jump condition
| (8) |
where and denote the permittivities on both sides of the interface, and and the electric field components normal to the interface.
Details about the numerical implementation, which is compatible with adaptive mesh refinement, will be presented in a forthcoming paper.
2.3 Photoionization and Photoemission
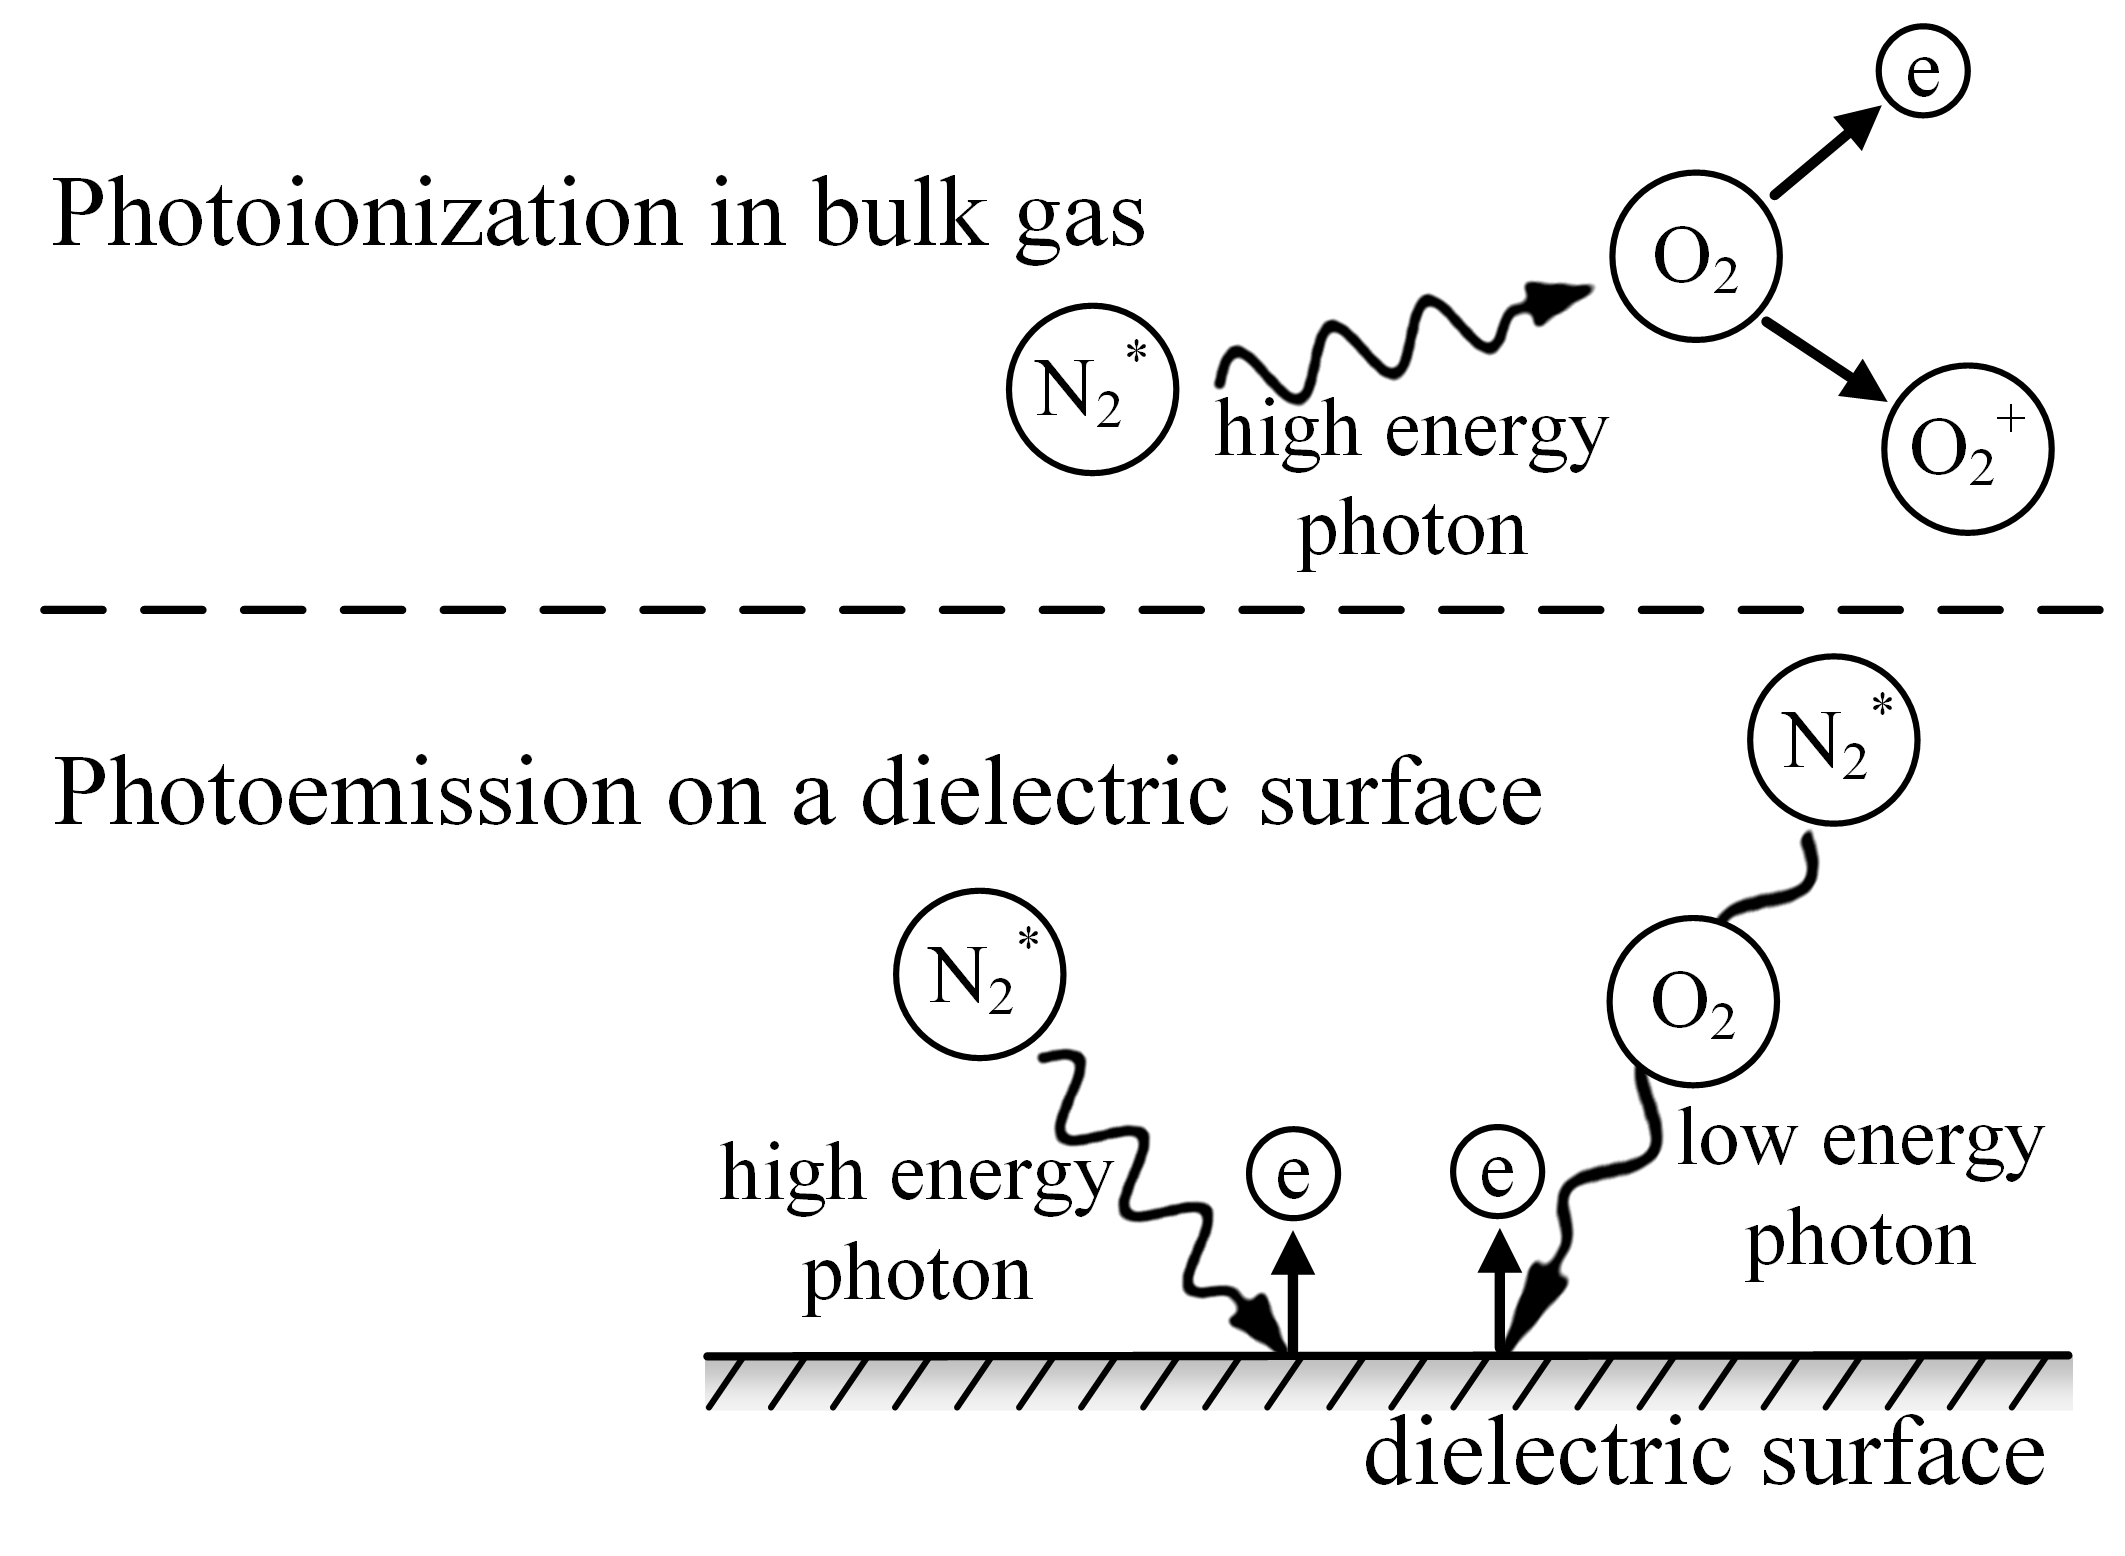
Positive streamer discharges need a source of free electrons ahead of them in order to propagate. Photons can generate such free electrons through photoionization in the gas or photoemission from a dielectric surface. In – mixtures, non-local photoionization can take place when an excited nitrogen molecule emits a UV photon in the 98 to 102.5 nm range, which has enough energy to ionize an oxygen molecule. Photoionization often plays an important role in electrical discharges, see e.g. [34, 35].
The role of photoemission in surface discharges is less well understood. Photons can be emitted from several excited states. The probability of photoemission not only depends on the photon energy, but also on the surface properties [10]. For simplicity, we consider only two types of photons in this paper: high-energy photons, which can generate photoionization and photoemission, and low-energy photons, which can only contribute to photoemission and are not absorbed in the gas. These processes are illustrated in figure 1.
Photoionization and photoemission are here modeled with a Monte Carlo (MC) method. We use the same Monte Carlo photoionization model as described in [36] and chapter 11 of [37]. The idea is to approximate the photoionization source term and the photon flux onto the dielectric by randomly sampling discrete photons. For computational efficiency, these terms are updated every , where is the time step used for solving equation (1).
First, the number of ionizing (high-energy) photons produced per grid cell during a time is determined. We use Zheleznyak’s model [38], in which the number of ionizing photons is proportional to the number of impact ionization events. The corresponding proportionality factor is set to , where is a numerical factor, is the gas pressure and is the collisional quenching pressure. We remark that should in principle depend on the electric field [38], but that it is here approximated by a constant, as in [36]. Per cell, a random number is drawn to determine how many photons are generated, see [37].
Since simulations are here performed in 2D, the discrete photons do not correspond to (single) physical photons. Instead, the total photon number is fixed, so that the MC method always uses photons. The weight factor of these photons is given by , where
| (9) |
is the volume-integrated production rate of ionizing photons.
For simplicity, the number of produced low-energy photons is assumed to be equal to the number of high-energy photons. As the low-energy photons only contribute to photoemission, their effect can be controlled through the corresponding photoemission coefficient.
Second, an isotropically distributed direction is sampled for each photon. Afterwards, absorption lengths are determined. The absorption length of high-energy photons is sampled from the absorption function for air, see e.g. [36]. Low-energy photons are not absorbed by the gas, so their absorption length is set to a large value, making sure they always end up outside the computational domain.
Third, we determine which photons hit a dielectric surface, and where they do so. These photons are absorbed by the surface, where they contribute to the local photoemission flux . For the low-energy and high-energy photons, photoemission coefficients and are used, respectively. If a surface cell of area is hit by and low-energy and high-energy photons, then
| (10) |
The effect of photoemission is investigated in section 3.4; elsewhere in the paper photoemission is not taken into account (so that ).
Fourth, the remaining high-energy photons that are absorbed in the gas contribute to photoionization source term . If photons are absorbed in a grid cell with volume , then
| (11) |
Low-energy photons and high-energy photons that are absorbed outside the computational domain have no effect.
2.4 Computational domain and initial conditions
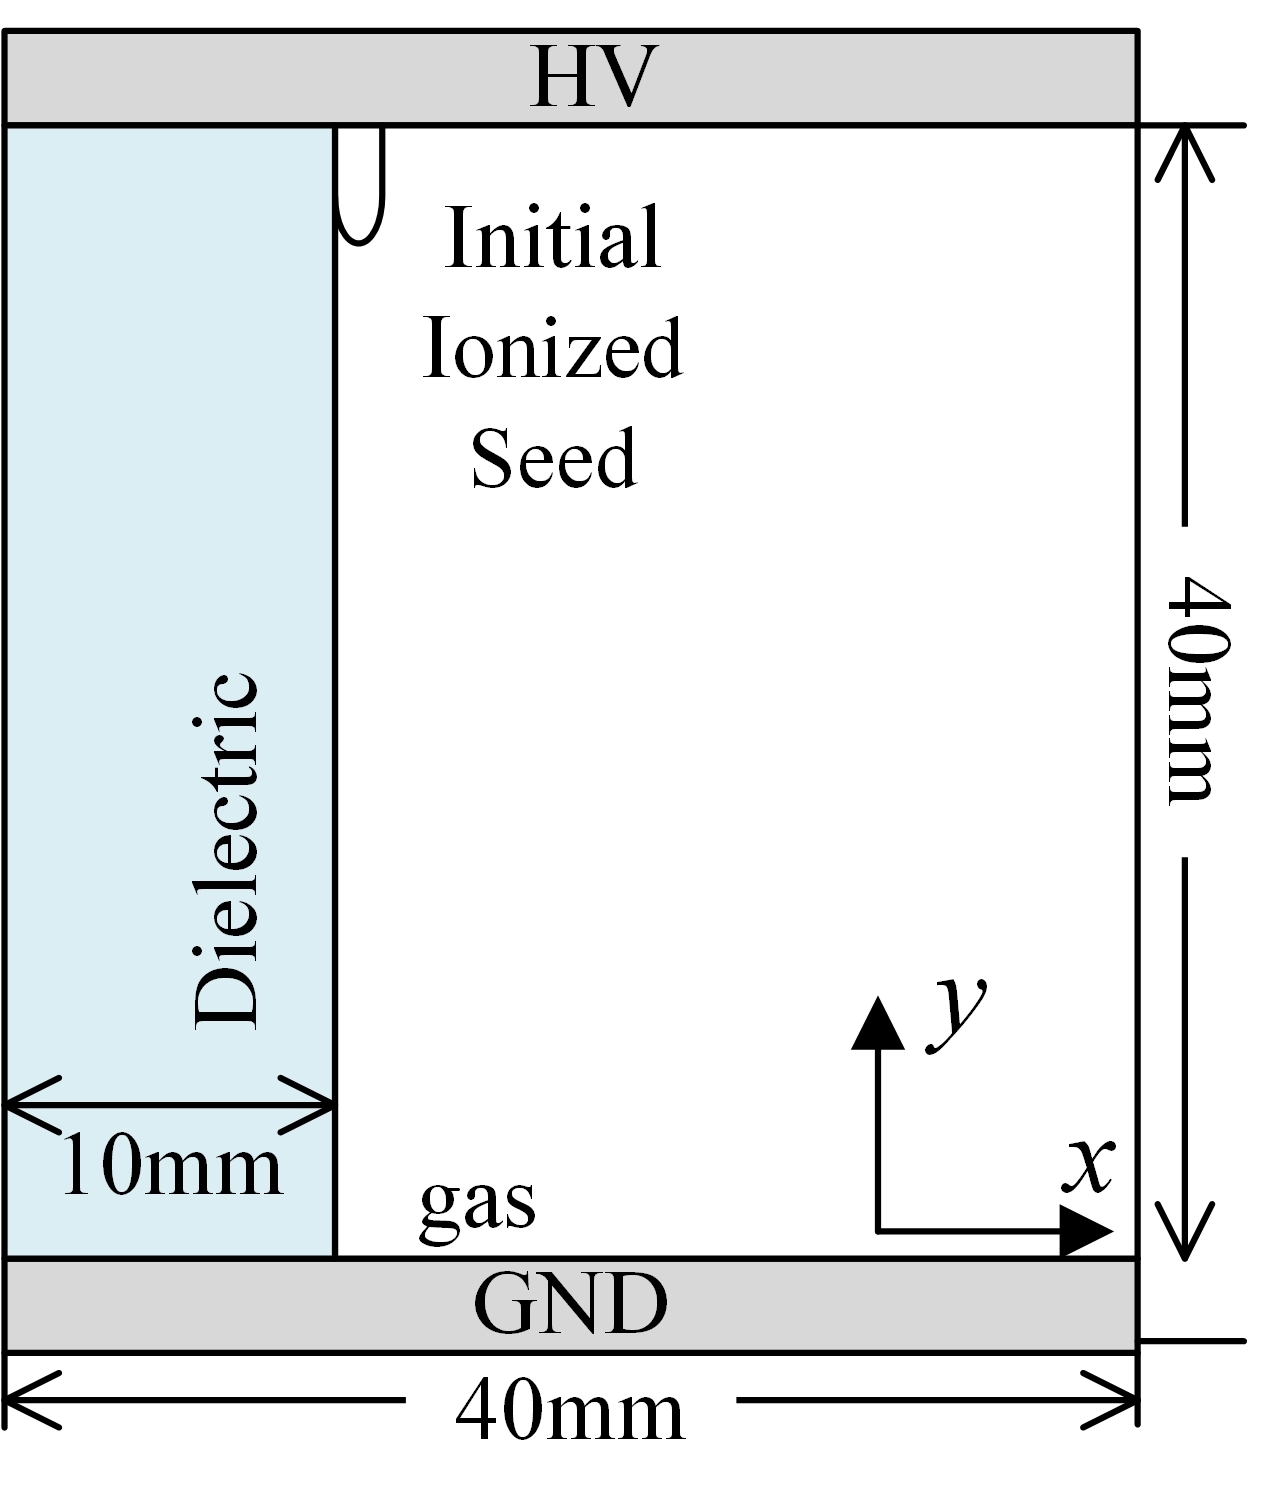
We use a parallel-plate electrode geometry with a flat dielectric in between, as shown in Figure 2. The computational domain measures (40 mm)2, and a dielectric is present on the left side with a width of . The dielectric permittivity is set to , but in section 3.3 it is varied to investigate its effect on surface discharges.
As a gas, artificial air (80% N2 and 20% O2) at 1 bar and 300 K is used. For the electric potential, Dirichlet boundary conditions are applied at the upper and lower boundaries, and Neumann zero boundary conditions on the left and right side. A voltage of is applied. In section 3.2, this voltage is varied. The background densities of electrons and positive ions are set to 1010 m-3 [39].
To start a discharge, the background field has to be locally enhanced. We do this by placing an ionized seed of about long with a radius of about 0.4 mm. The electron and positive ion density are 51018 m-3 at the center, and they decay at distances above with a so-called smoothstep profile: up to , where . When the electrons from a seed drift upwards, the electric field at the bottom of the seed is enhanced so that a positive streamer can form.
3 Results & discussion
| Section | d (mm) | (kV) | (m2/Vs) | |||
|---|---|---|---|---|---|---|
| 3.1 | 100 | 2 | 0 | 0 | ||
| 3.2 | 0.5 | 2 | 0 | 0 | ||
| 3.3 | 0.5 | 100 | 0 | 0 | ||
| 3.4.1 | 0.4 | 100 | 2 | 0 | ||
| 3.4.2 | 100 | 2 | 0 | |||
| 3.5 | 0.5 | 100 | 2 | 0 | 0 |
In section 3.1, the initial seed is placed at different distances from the dielectric to study the streamer-dielectric interaction. We also point out the main differences between surface and gas streamers. Next, we systematically study the effect of several parameters on the surface discharges: the applied voltage (section 3.2), the dielectric permittivity (section 3.3), the secondary electron emission coefficients (section 3.4), and finally the ion mobility (section 3.5). The parameters investigated and their values in each section are shown in table 1.
3.1 Streamer-dielectric interaction
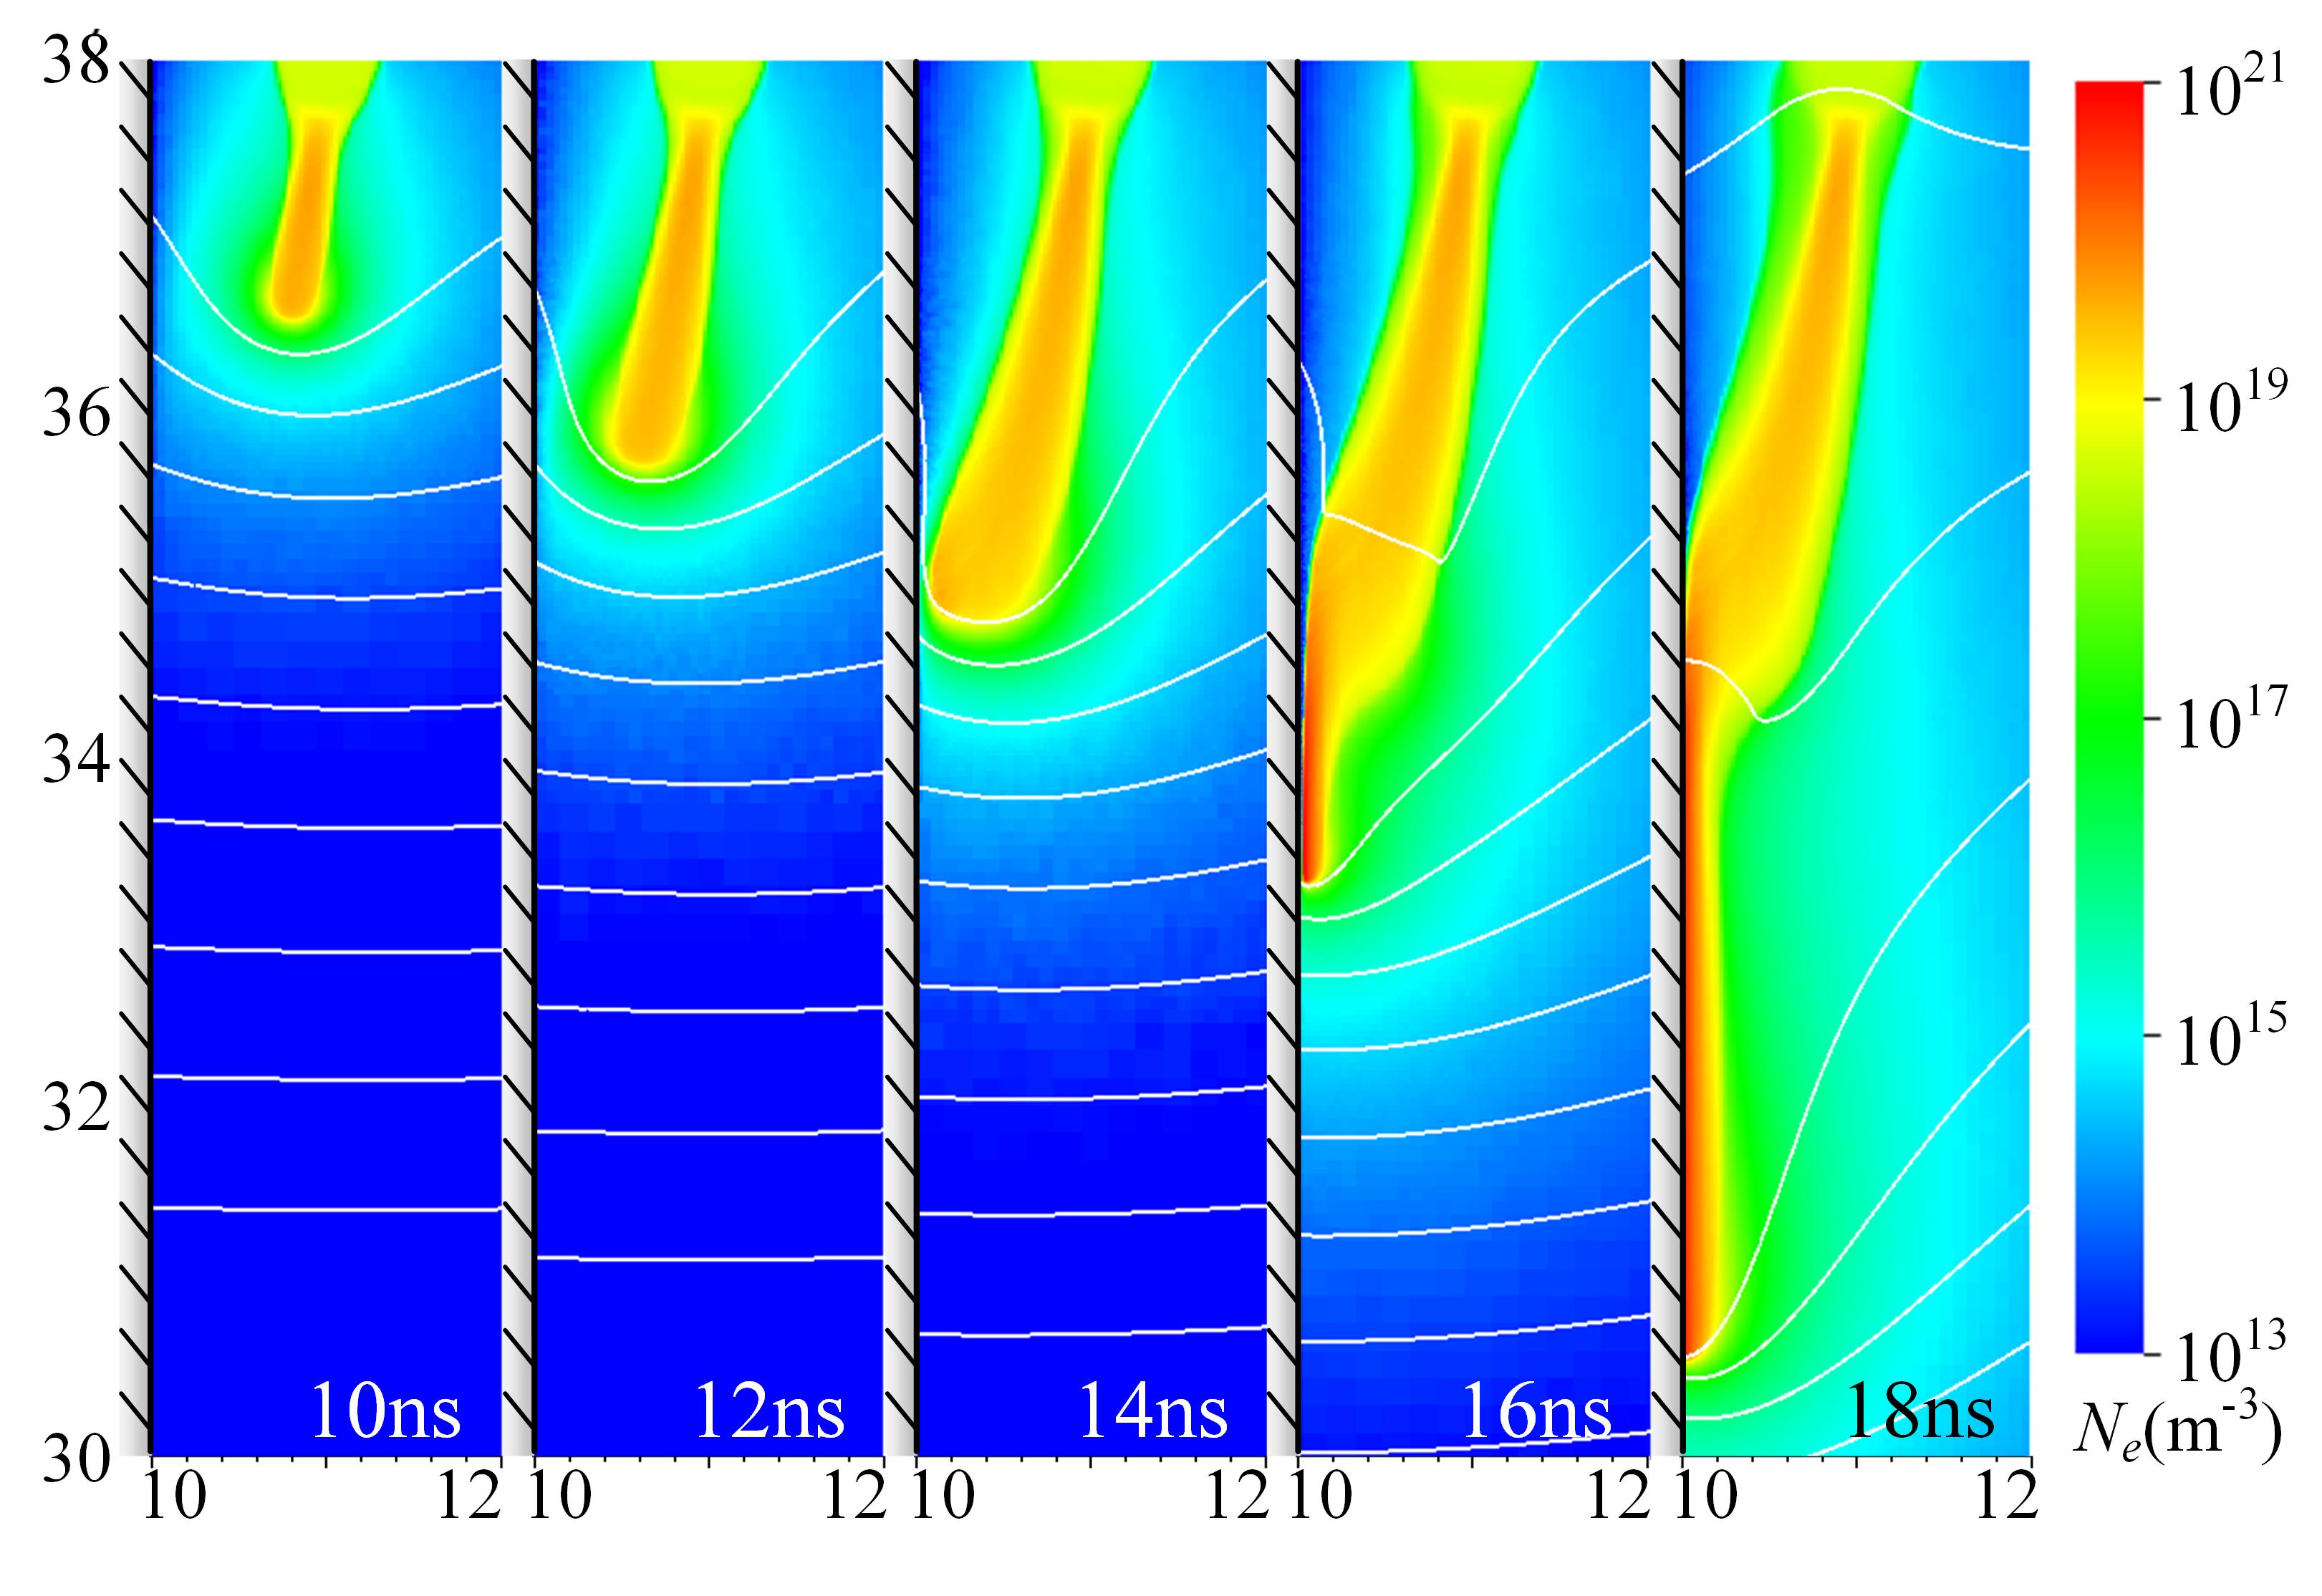
Previous experiments have revealed that dielectrics attract positive streamers, see e.g. [4, 5]. This attraction is also present in our numerical model. Figure 3 shows the evolution of the electron density for an initial ionized seed placed away from the dielectric. It can be seen that the streamer start to grow in air and then gradually develops towards the dielectric. After connecting with the dielectric, the streamer propagates down over its surface. The evolution shown here is in qualitative agreement with the discharge photographs in [4].
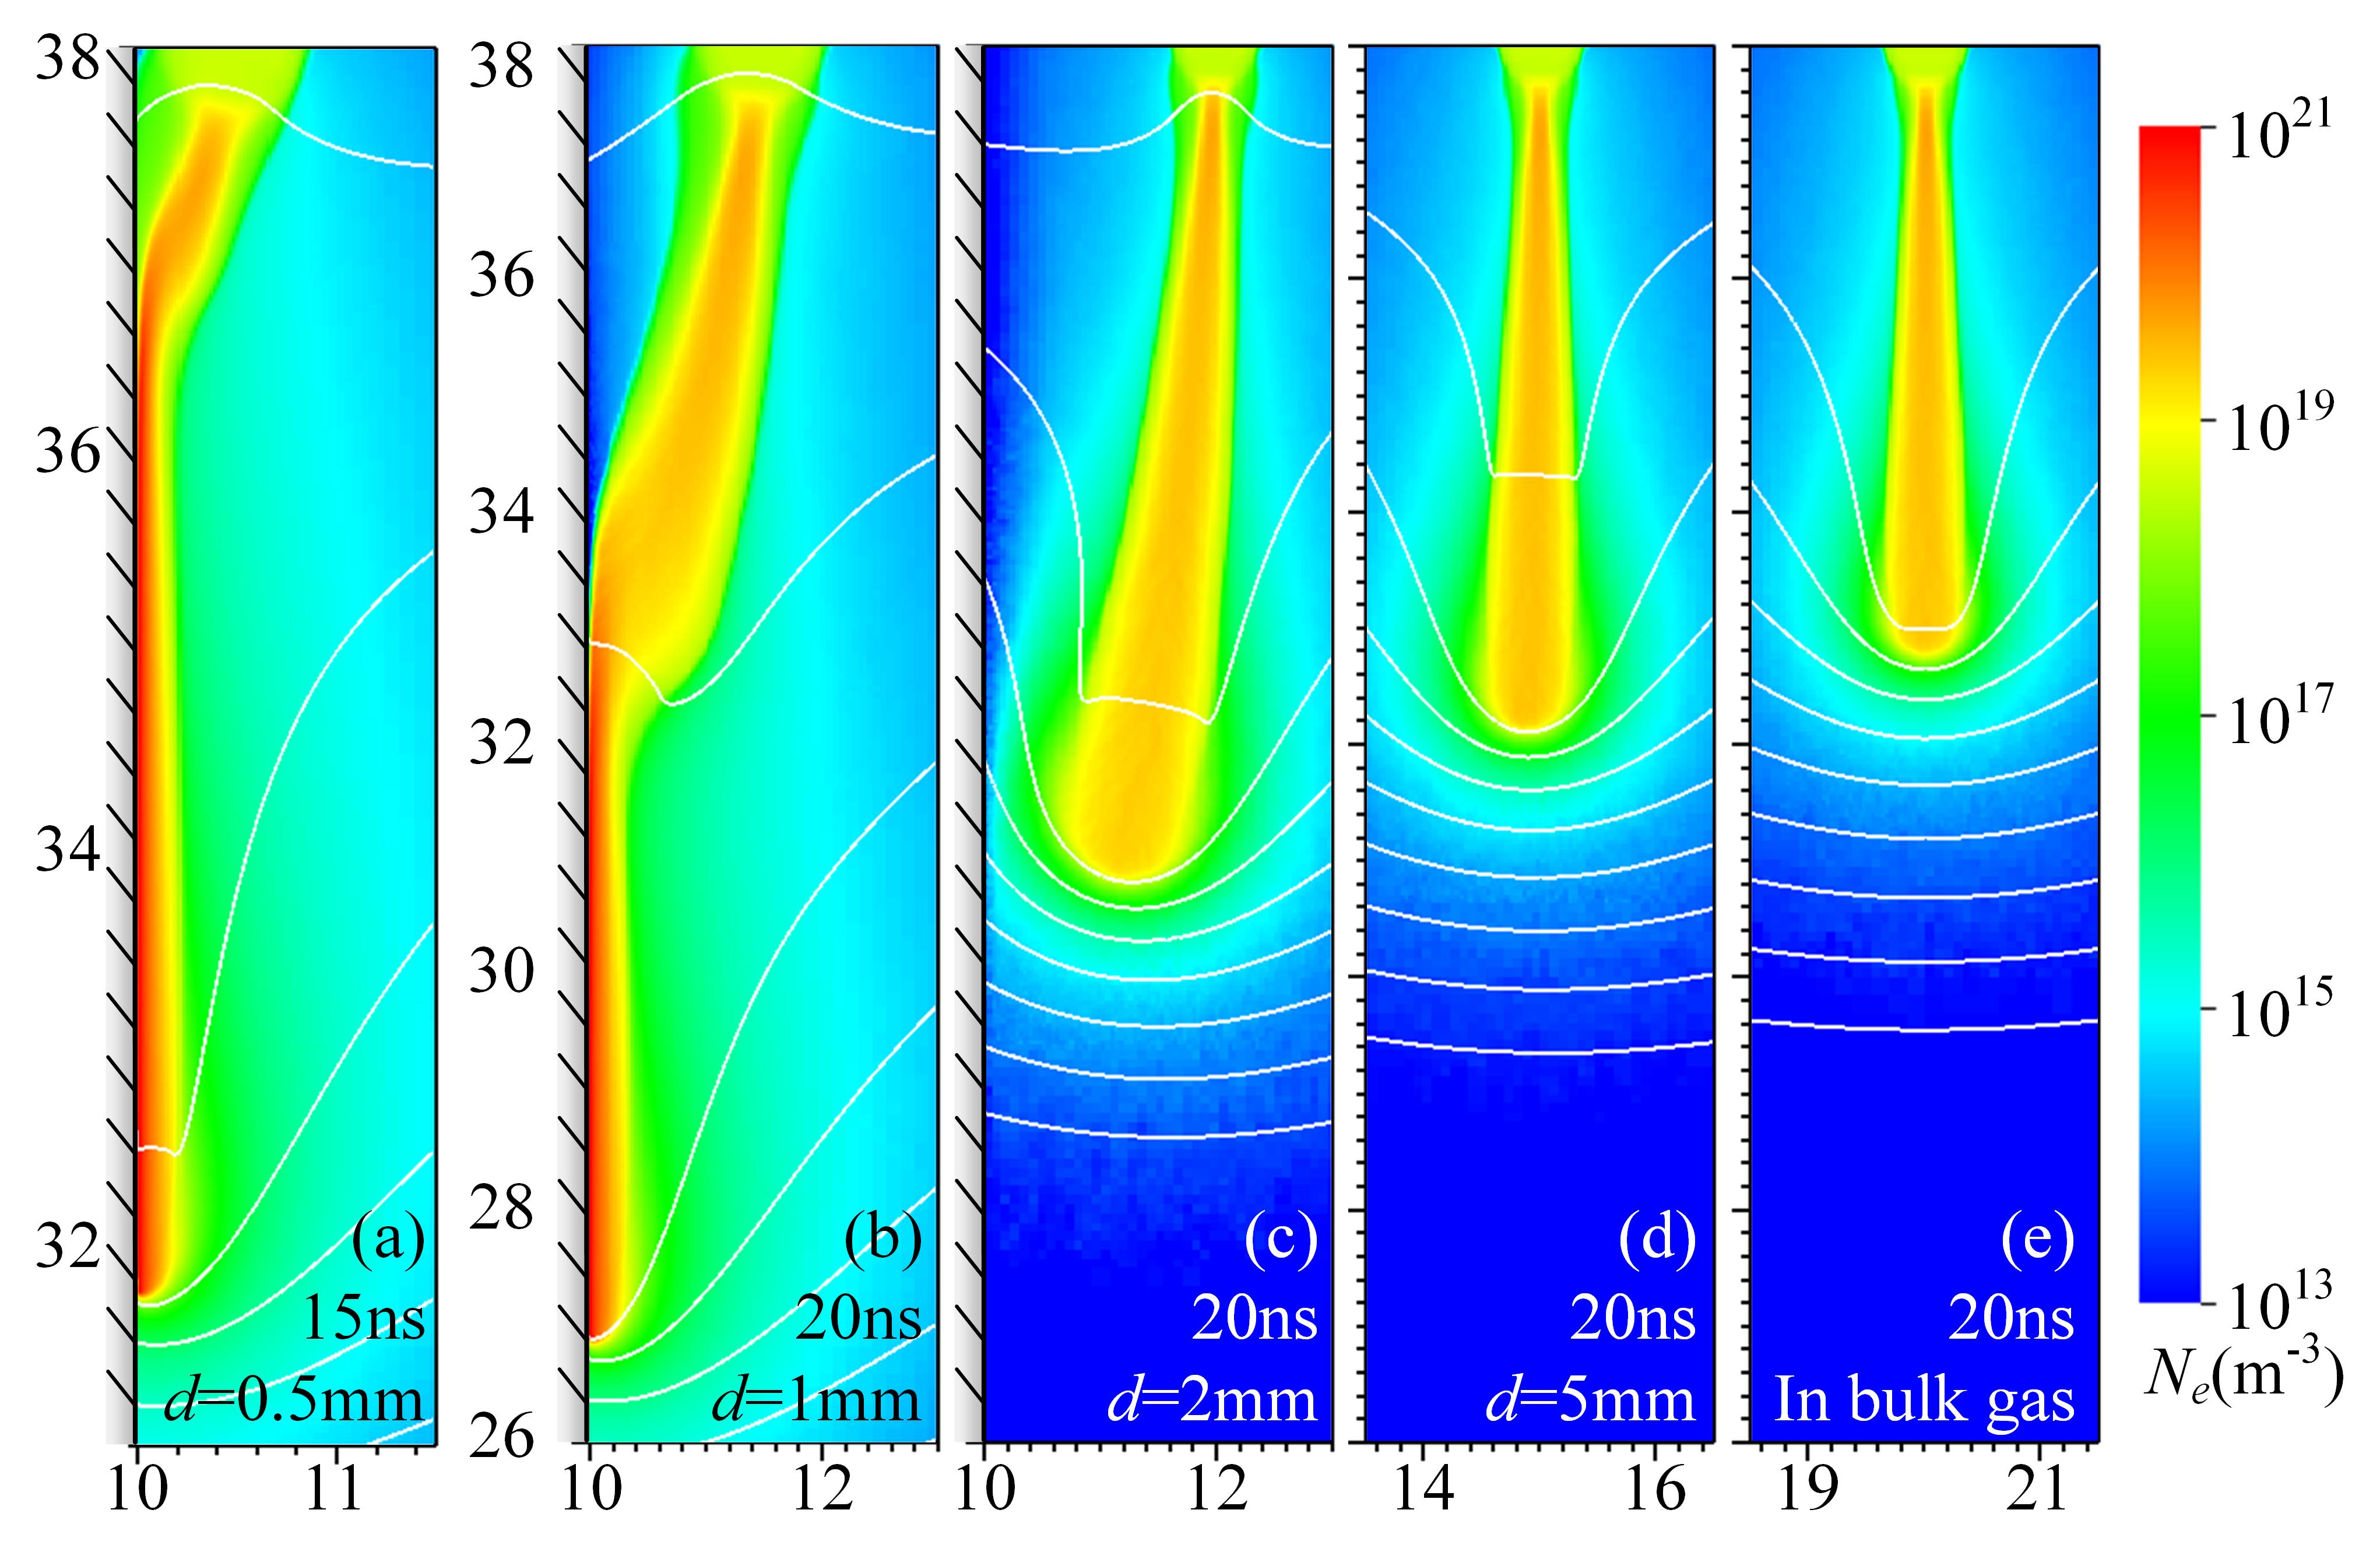
To study the streamer-dielectric attraction, we have placed the initial ionized seed at different distances from the dielectric. Figures 4a–d show the electron density for seeds placed at , , and from the dielectric. For comparison, the electron density for a streamer in bulk gas is also shown in figure 4e. In this simulation the dielectric was removed, so that the whole computational domain contained gas, and the initial seed was placed at . Figure 4a shows the electron density at , for the other cases, which develop more slowly, results at are shown. The closer the streamer is located to the dielectric, the stronger the attraction to the dielectric becomes. It can also be seen that a nearby dielectric increases the streamer’s velocity in the gas, and that streamers here propagate faster on the surface than in the gas.
3.1.1 Attraction to the dielectric
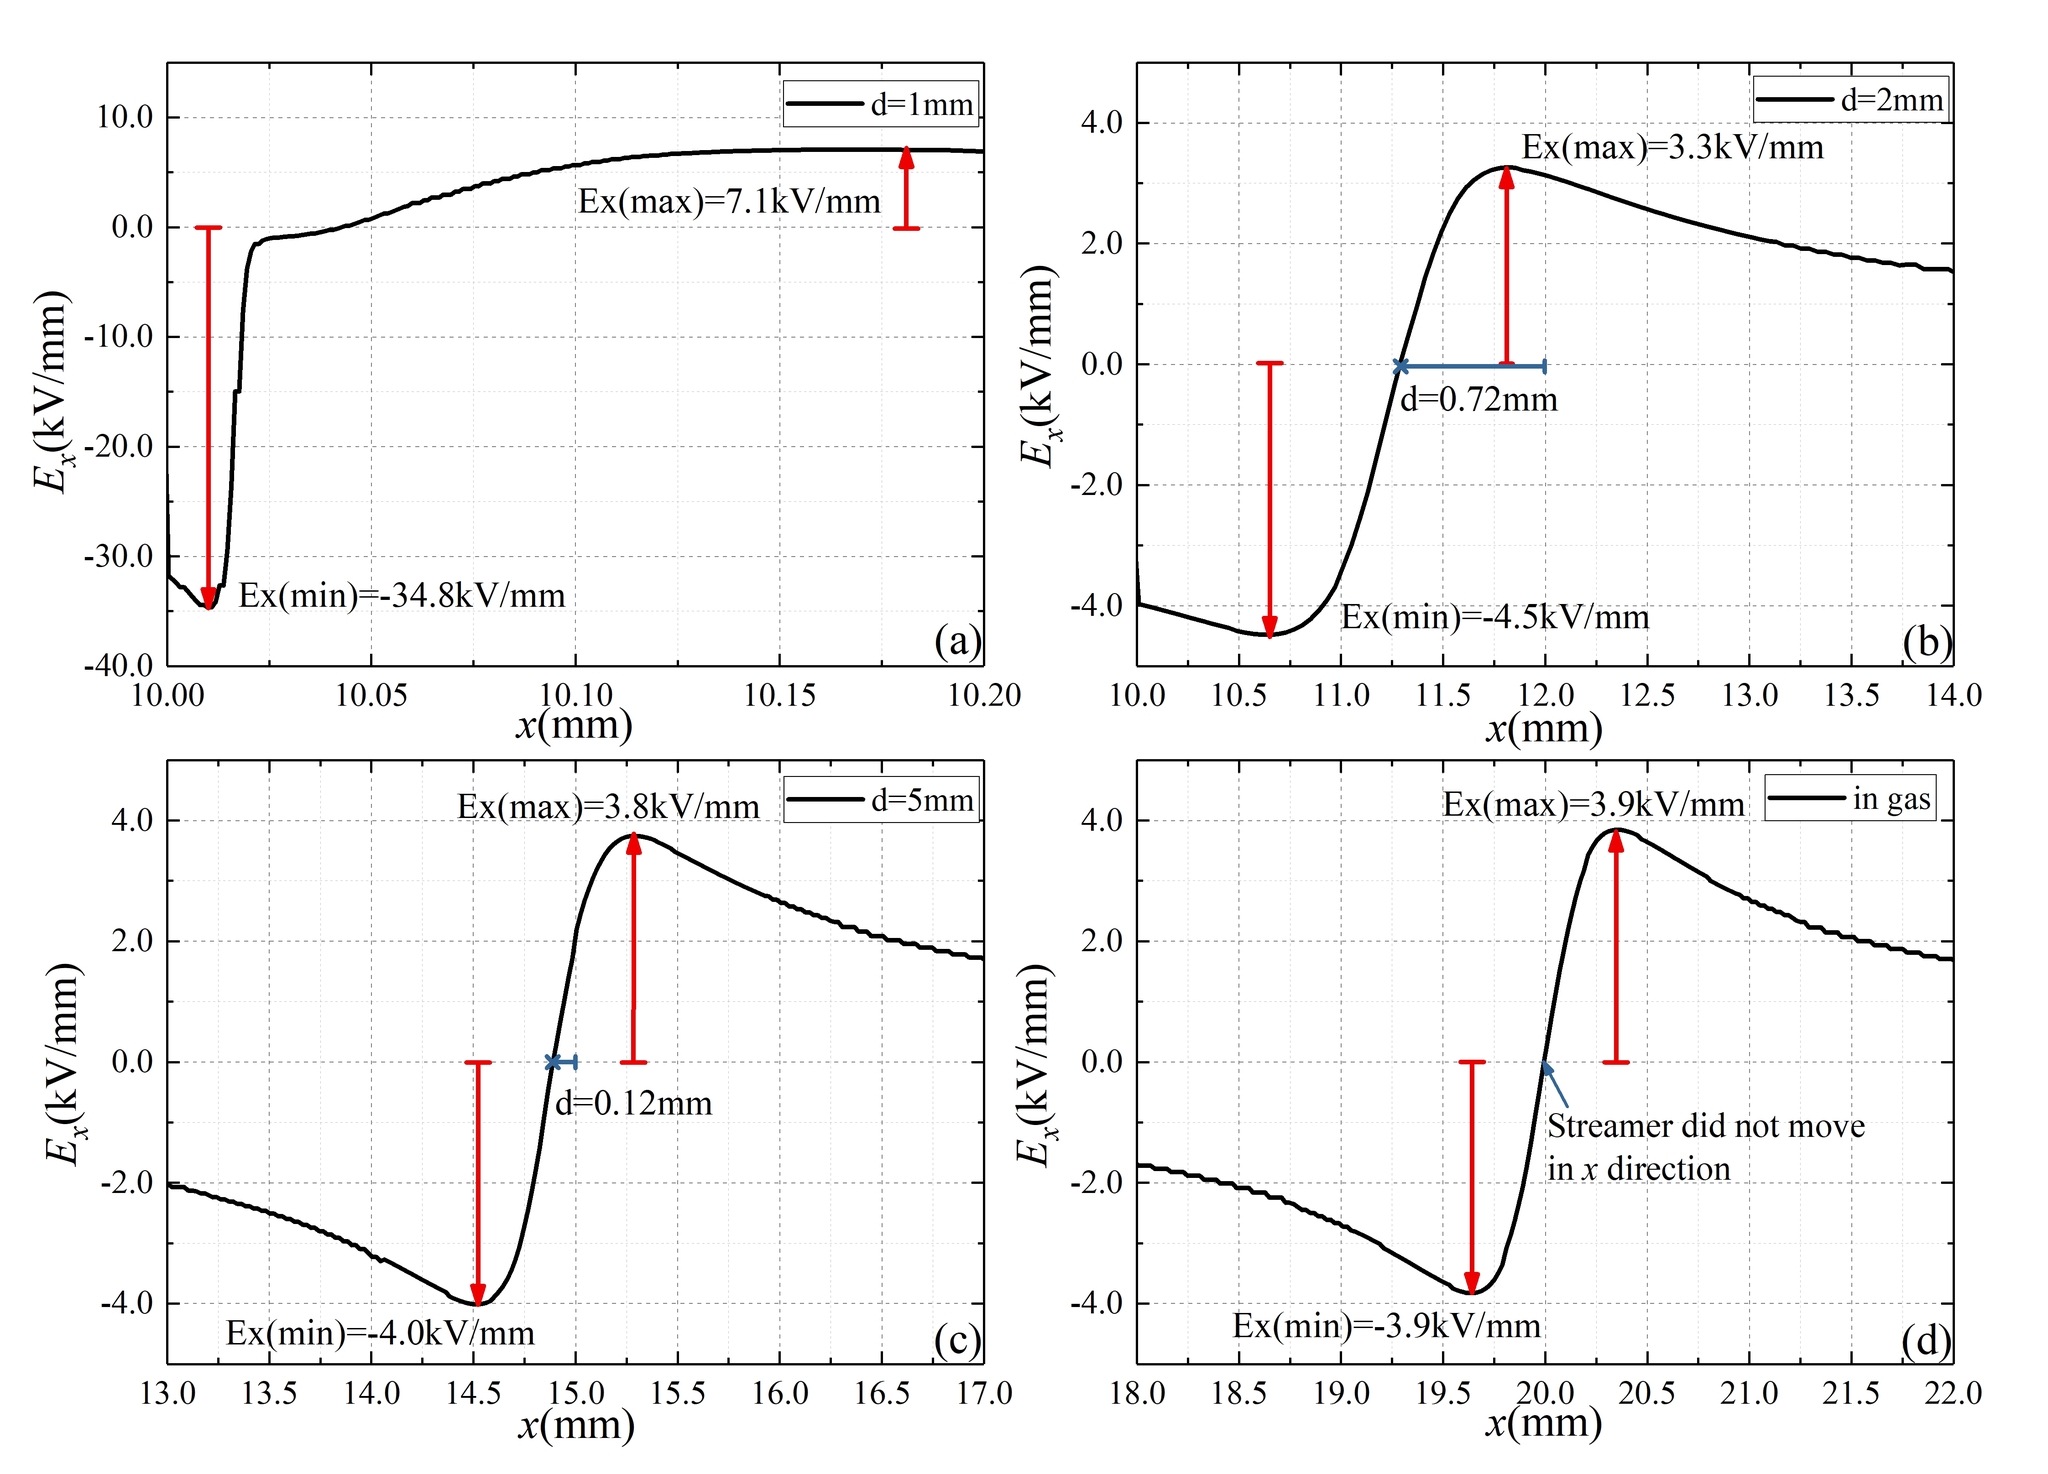
As photoemission is disabled here (see table 1), the attraction of the streamer to the dielectric is purely electrostatic. The net charge in the streamer head polarizes the dielectric, which increases the electric field between the streamer and the dielectric. This effect is illustrated in figure 5, which shows the horizontal electric field () around the streamer heads. With a dielectric present, increases on the dielectric side, and it is reduced on the other side. The closer the streamer is to a dielectric, stronger this effect becomes. Eventually, the streamer will turn into a surface streamer. As shown in figure 4, such a surface streamer is thinner and quite asymmetric compared to a gas streamer.
In past research, the attraction of streamers to dielectrics could often be explained by the enhanced static field between pointed electrodes and dielectrics, see e.g. [4, 6]. In contrast, the attraction to the dielectric is here due to the space charge from the streamer itself, since in our plate-to-plate geometry, the electric field has no horizontal component before a discharge is present. Assuming that streamers propagate approximately along electric field lines [40], we can therefore state that streamers lead themselves to the dielectric: their space charge modifies the background field and causes a horizontal field component that attracts them to the dielectric.
Surface charge on the dielectric could also play a role in attracting streamer discharges, by modifying the background electric field. However, there is negligible surface charge here, as secondary electron emission is disabled in this section and electrons move away from the dielectric. Positive ions do move towards the dielectric, but there are initially few of them near the dielectric, and they drift with a relatively low mobility, so that they hardly contribute to the surface charge.
3.1.2 Effect on streamer velocity
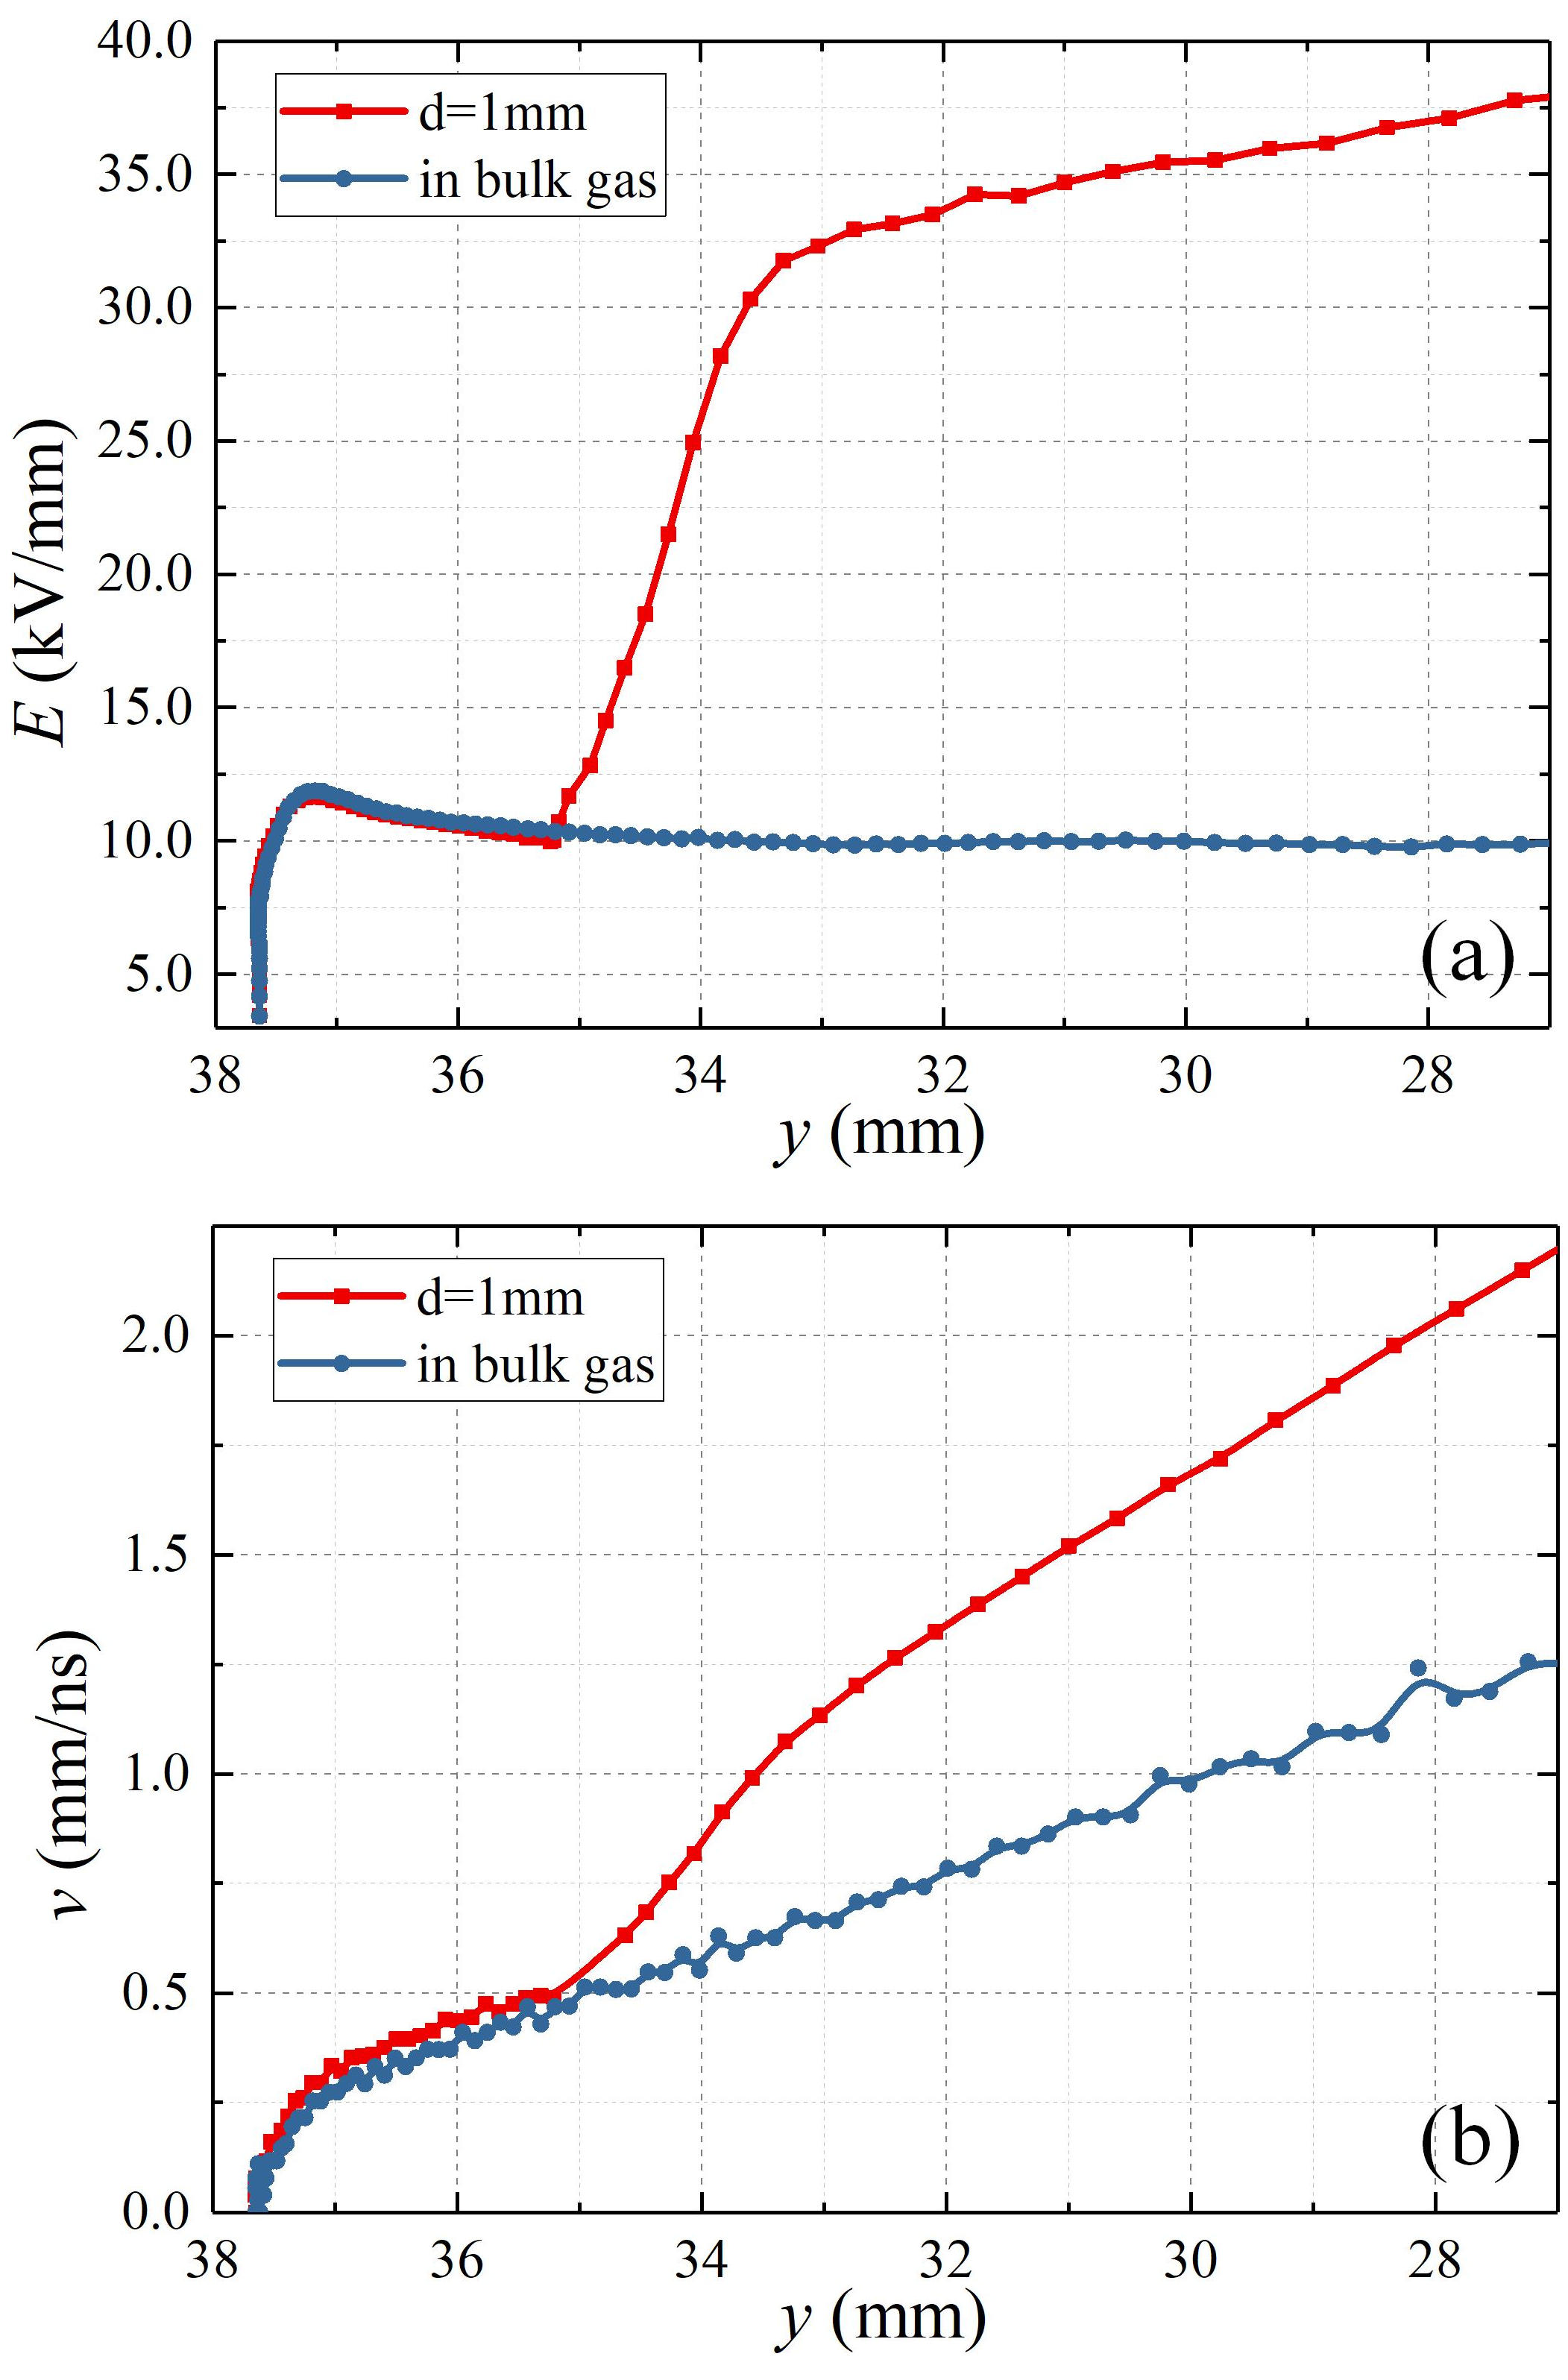
Several experimental studies have found that surface discharges are faster than bulk gas streamers [5, 8, 41]. Their increased velocity was attributed to increased ionization rates near the dielectric, accumulated negative charge and electron emission from the dielectric surface. Electron emission from the dielectric is not included here (it is in section 3.4), but we still find that the surface streamers are significantly faster. Figure 6 shows the streamer velocity and its maximal electric field for the case . Note that both the velocity and the maximal electric field increase when the surface streamer forms, at around . Even though the higher field is mostly in the horizontal direction, see figure 5, it still contributes to a faster vertical growth.
As can be seen in figure 4, the electron density inside a surface streamer ( to ) is higher than in a gas streamer () when the discharge conditions are otherwise similar. This was also observed in for example [23]. We remark that besides the presence of a dielectric, the electron density inside a streamer discharge also depends on other factors, such as the applied voltage, the streamer radius, the gas composition, the amount of photoionization etc. Also note that we use a Cartesian 2D model, in which there is less field enhancement around the streamer heads than in full 3D, reducing the electron density in both surface and gas streamers.
There seem to be several related effects that lead to the increased surface streamer velocity. The strong electric field between a surface streamers and a dielectric pulls surface streamers towards the dielectric. This reduces their radius (as shown in figure 4), and results in an asymmetric streamer head shape, which also leads to stronger electric field enhancement. The result is that the ionization rate is increased, that the streamer has a higher degree of ionization, and that it propagates faster. This behavior is quite distinct from gas streamers, which typically propagate faster when they have a larger radius [42].
3.1.3 Cathode sheath
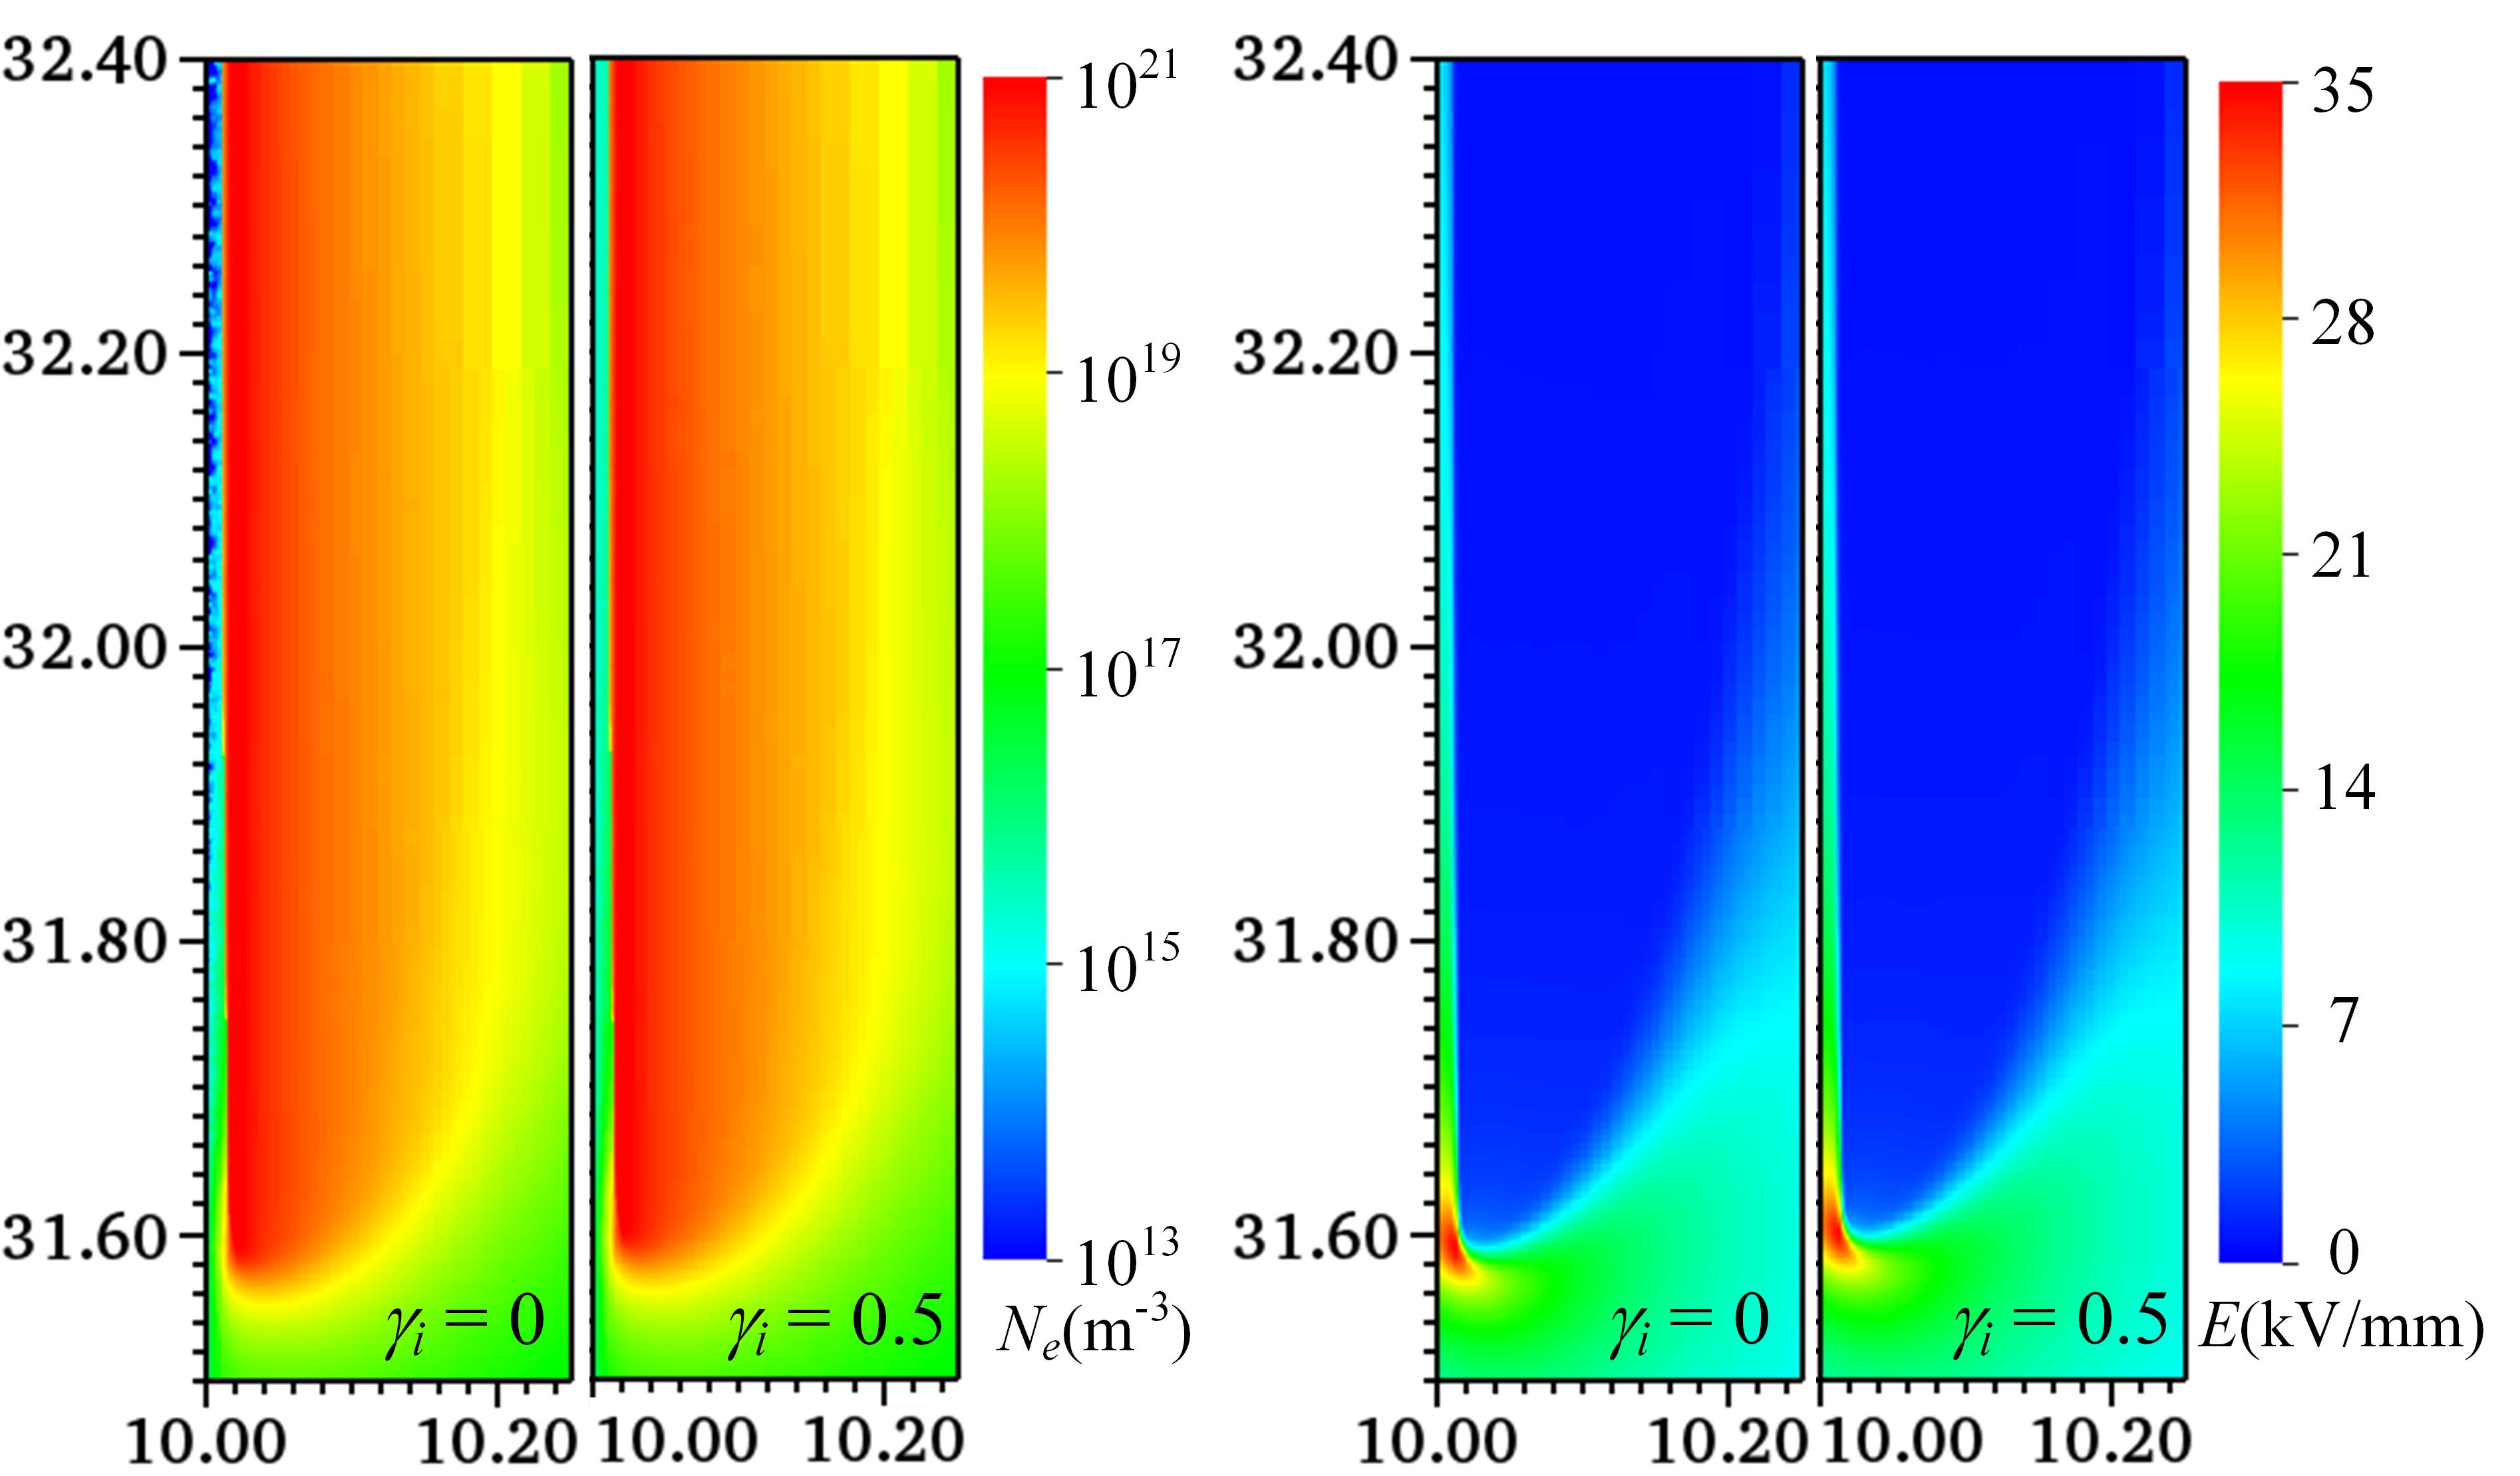
As shown in figure 7, the surface streamer ‘hovers’ over the dielectric surface without fully connecting to it. This phenomenon was also observed in simulations of dielectric barrier discharges [43, 12, 44, 45], and it only occurs for positive streamers. The reason is that positive streamers grow from incoming electron avalanches, but such avalanches require sufficient distance before they reach ionization levels comparable to the discharge. Positive streamers can therefore not immediately connect to the dielectric surface. Due to the net charge in the streamer head, a very high electric field is present in the narrow gap between streamer and dielectric. The effect of secondary electron emission on these dynamics is studied in section 3.4, and the role of the positive ion mobility is investigated in section 3.5.
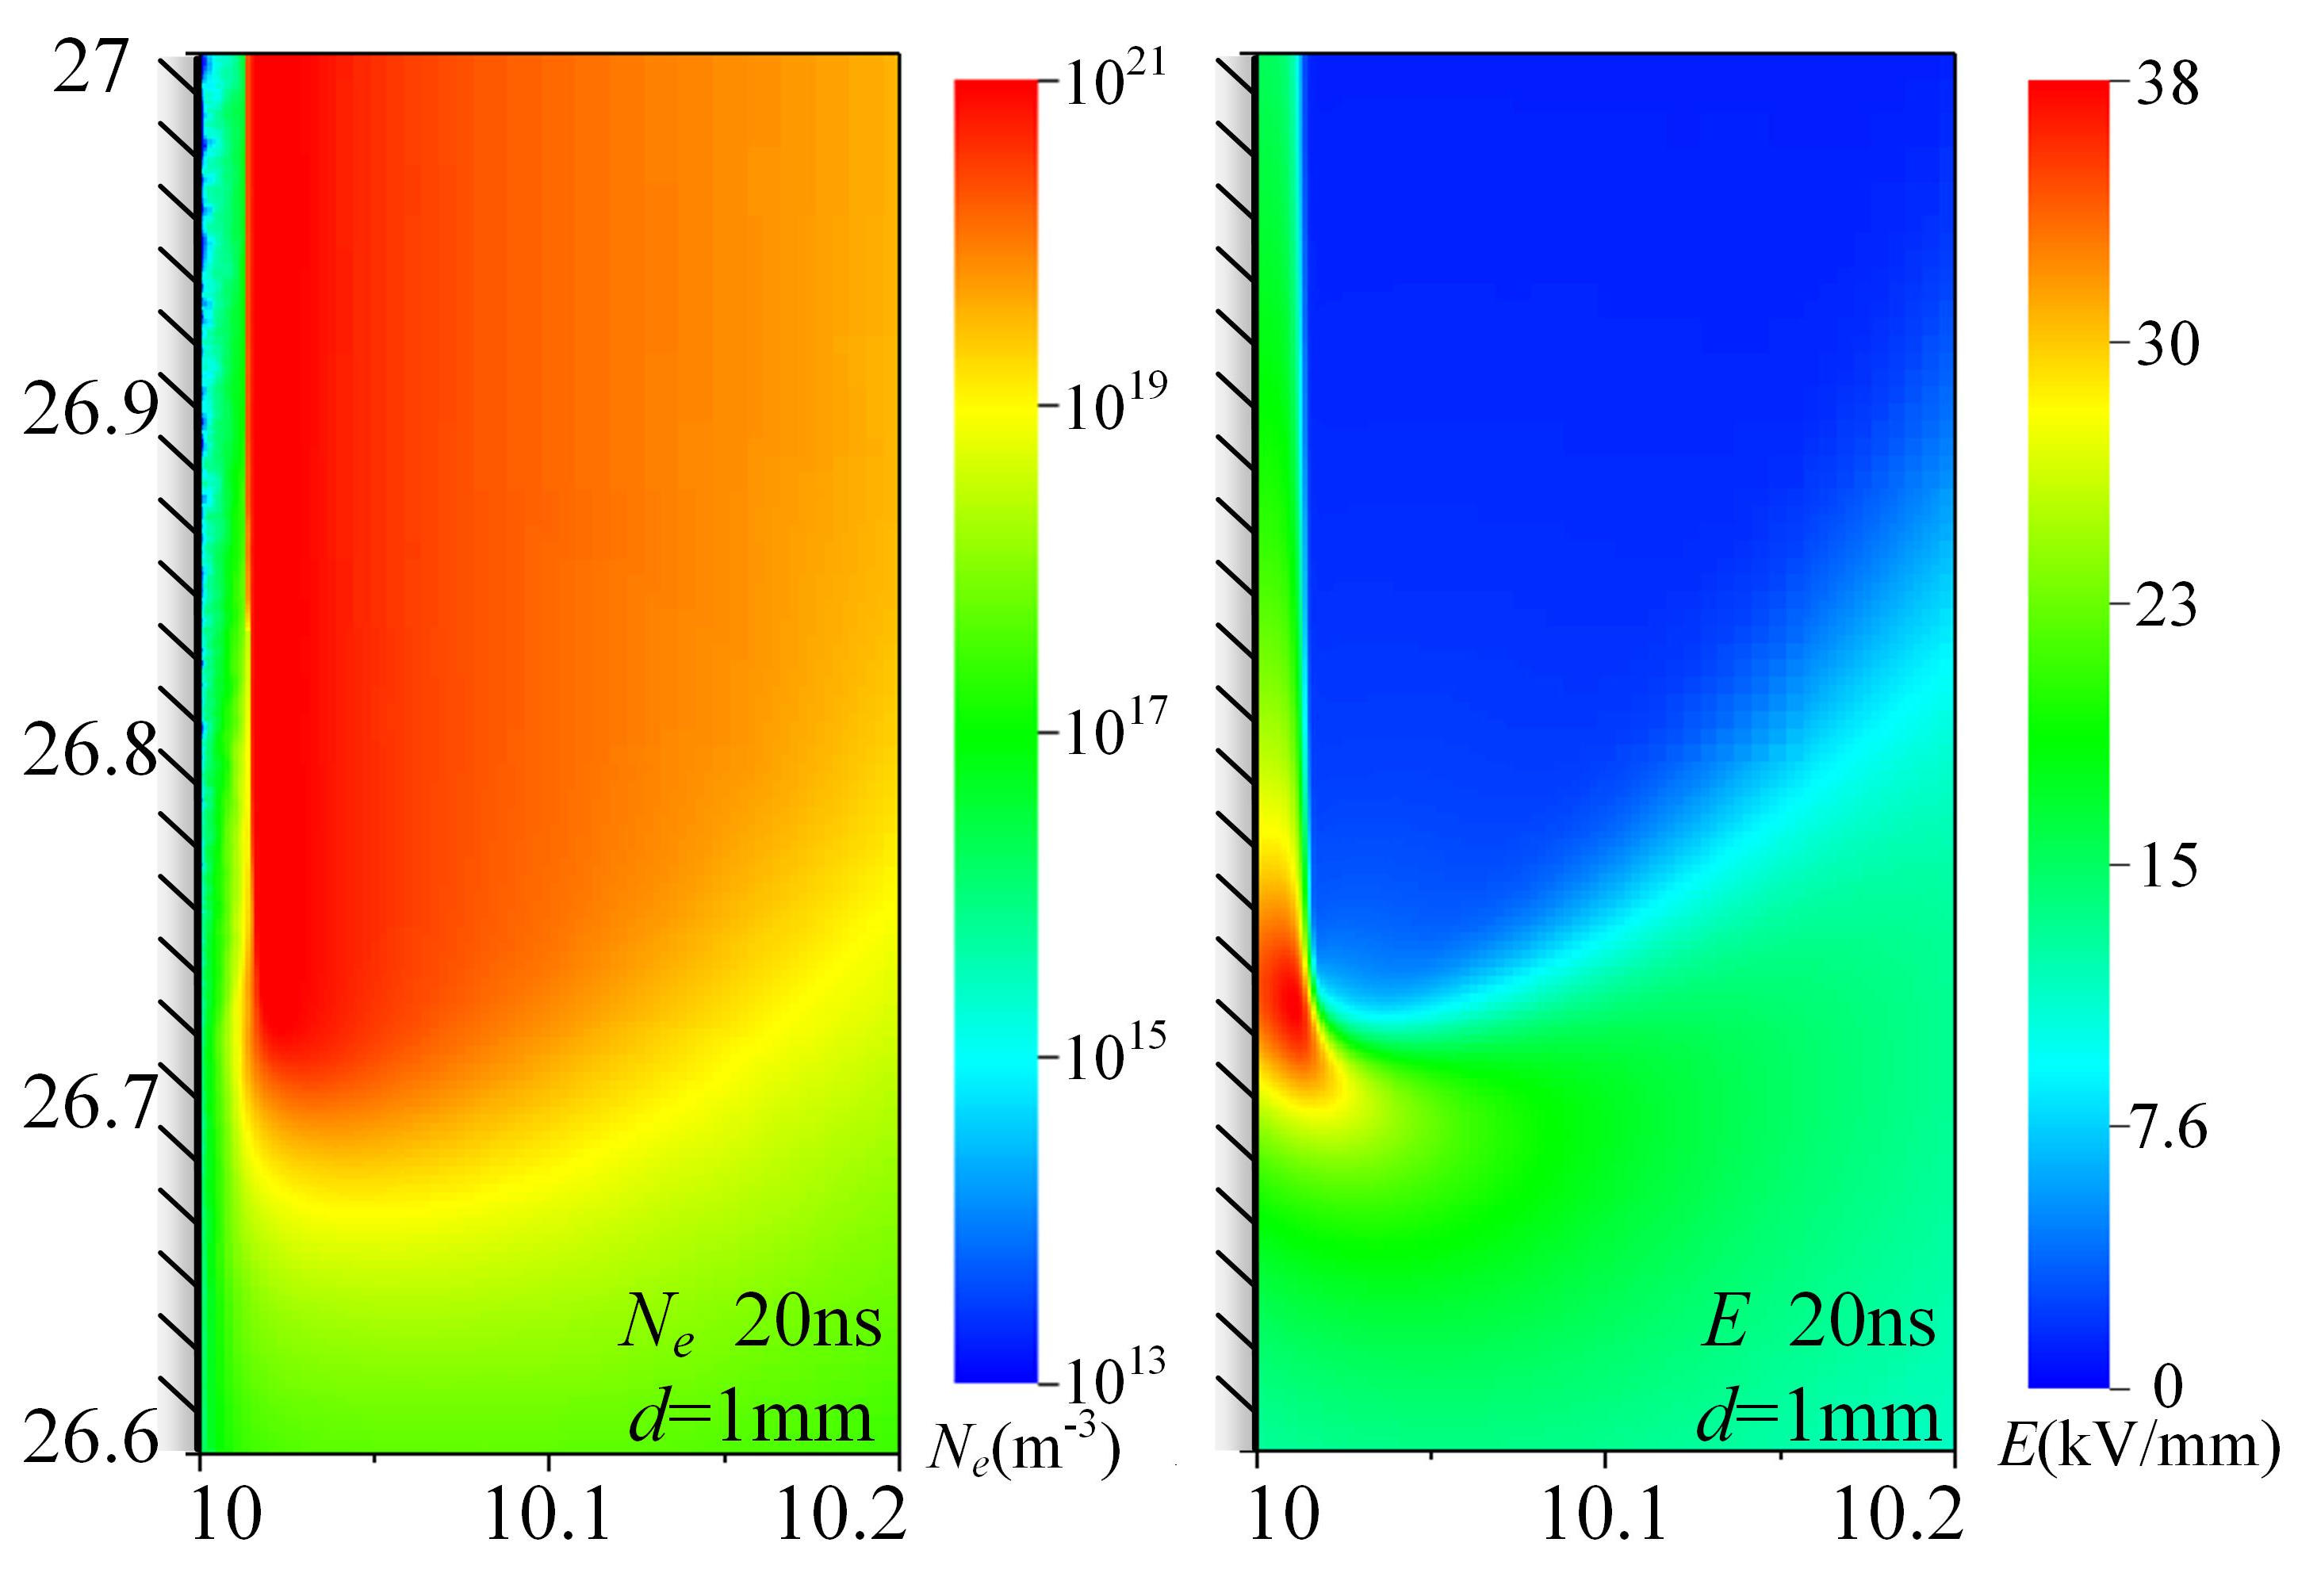
We remark that the maximum electric field of a positive surface streamer can rapidly rise to very high values, as shown in figures 6a and 7. These high-field areas typically contain a low electron density, but they still pose a problem for plasma fluid simulations. In the present fluid simulations, the transport and reaction coefficients (e.g., the ionization coefficient or the electron mobility) are functions of the local electric field strength. These coefficients are tabulated up to a certain maximum electric field, which is here ; for higher fields, we use the tabulated value at . More generally, the validity of the local field approximation is questionable when there are such high electric fields (and corresponding strong gradients). For future studies in such ultra-high electric fields, particle-in-cell simulations could therefore be more suitable, as was also observed in [20]. Finally, we remark that a potential physical limitation for this maximum electric field is field emission of electrons from the surface.
3.2 Effect of applied voltage
To study the effect of the applied voltage on surface discharges, we have performed simulations for applied voltages of , and , which correspond to background electric fields of , and , respectively. In all cases, the initial seed was located at from the dielectric, and the evolution up to was simulated. Figure 8 shows the maximum electric field versus time, and figure 9 shows the electron density for three cases at and . Both figures reveal the following stages in the streamer’s development:
-
I
The inception stage, in which the maximum electric field is from 0 to about in our setup and the streamer is hardly propagating, as shown in figure 9a.
- II
- III
-
IV
The surface propagation stage. The growth of the maximum electric field is slowing down, and the streamer propagates along the dielectric, as shown in figure 9c.
Figure 8 shows that when the voltage is changed, the streamers still exhibit similar behavior in these four stages. The main difference is that the inception stage becomes shorter. For background fields of , and , the inception stages last , and , respectively. The second stage also becomes slightly shorter for a higher applied voltage.
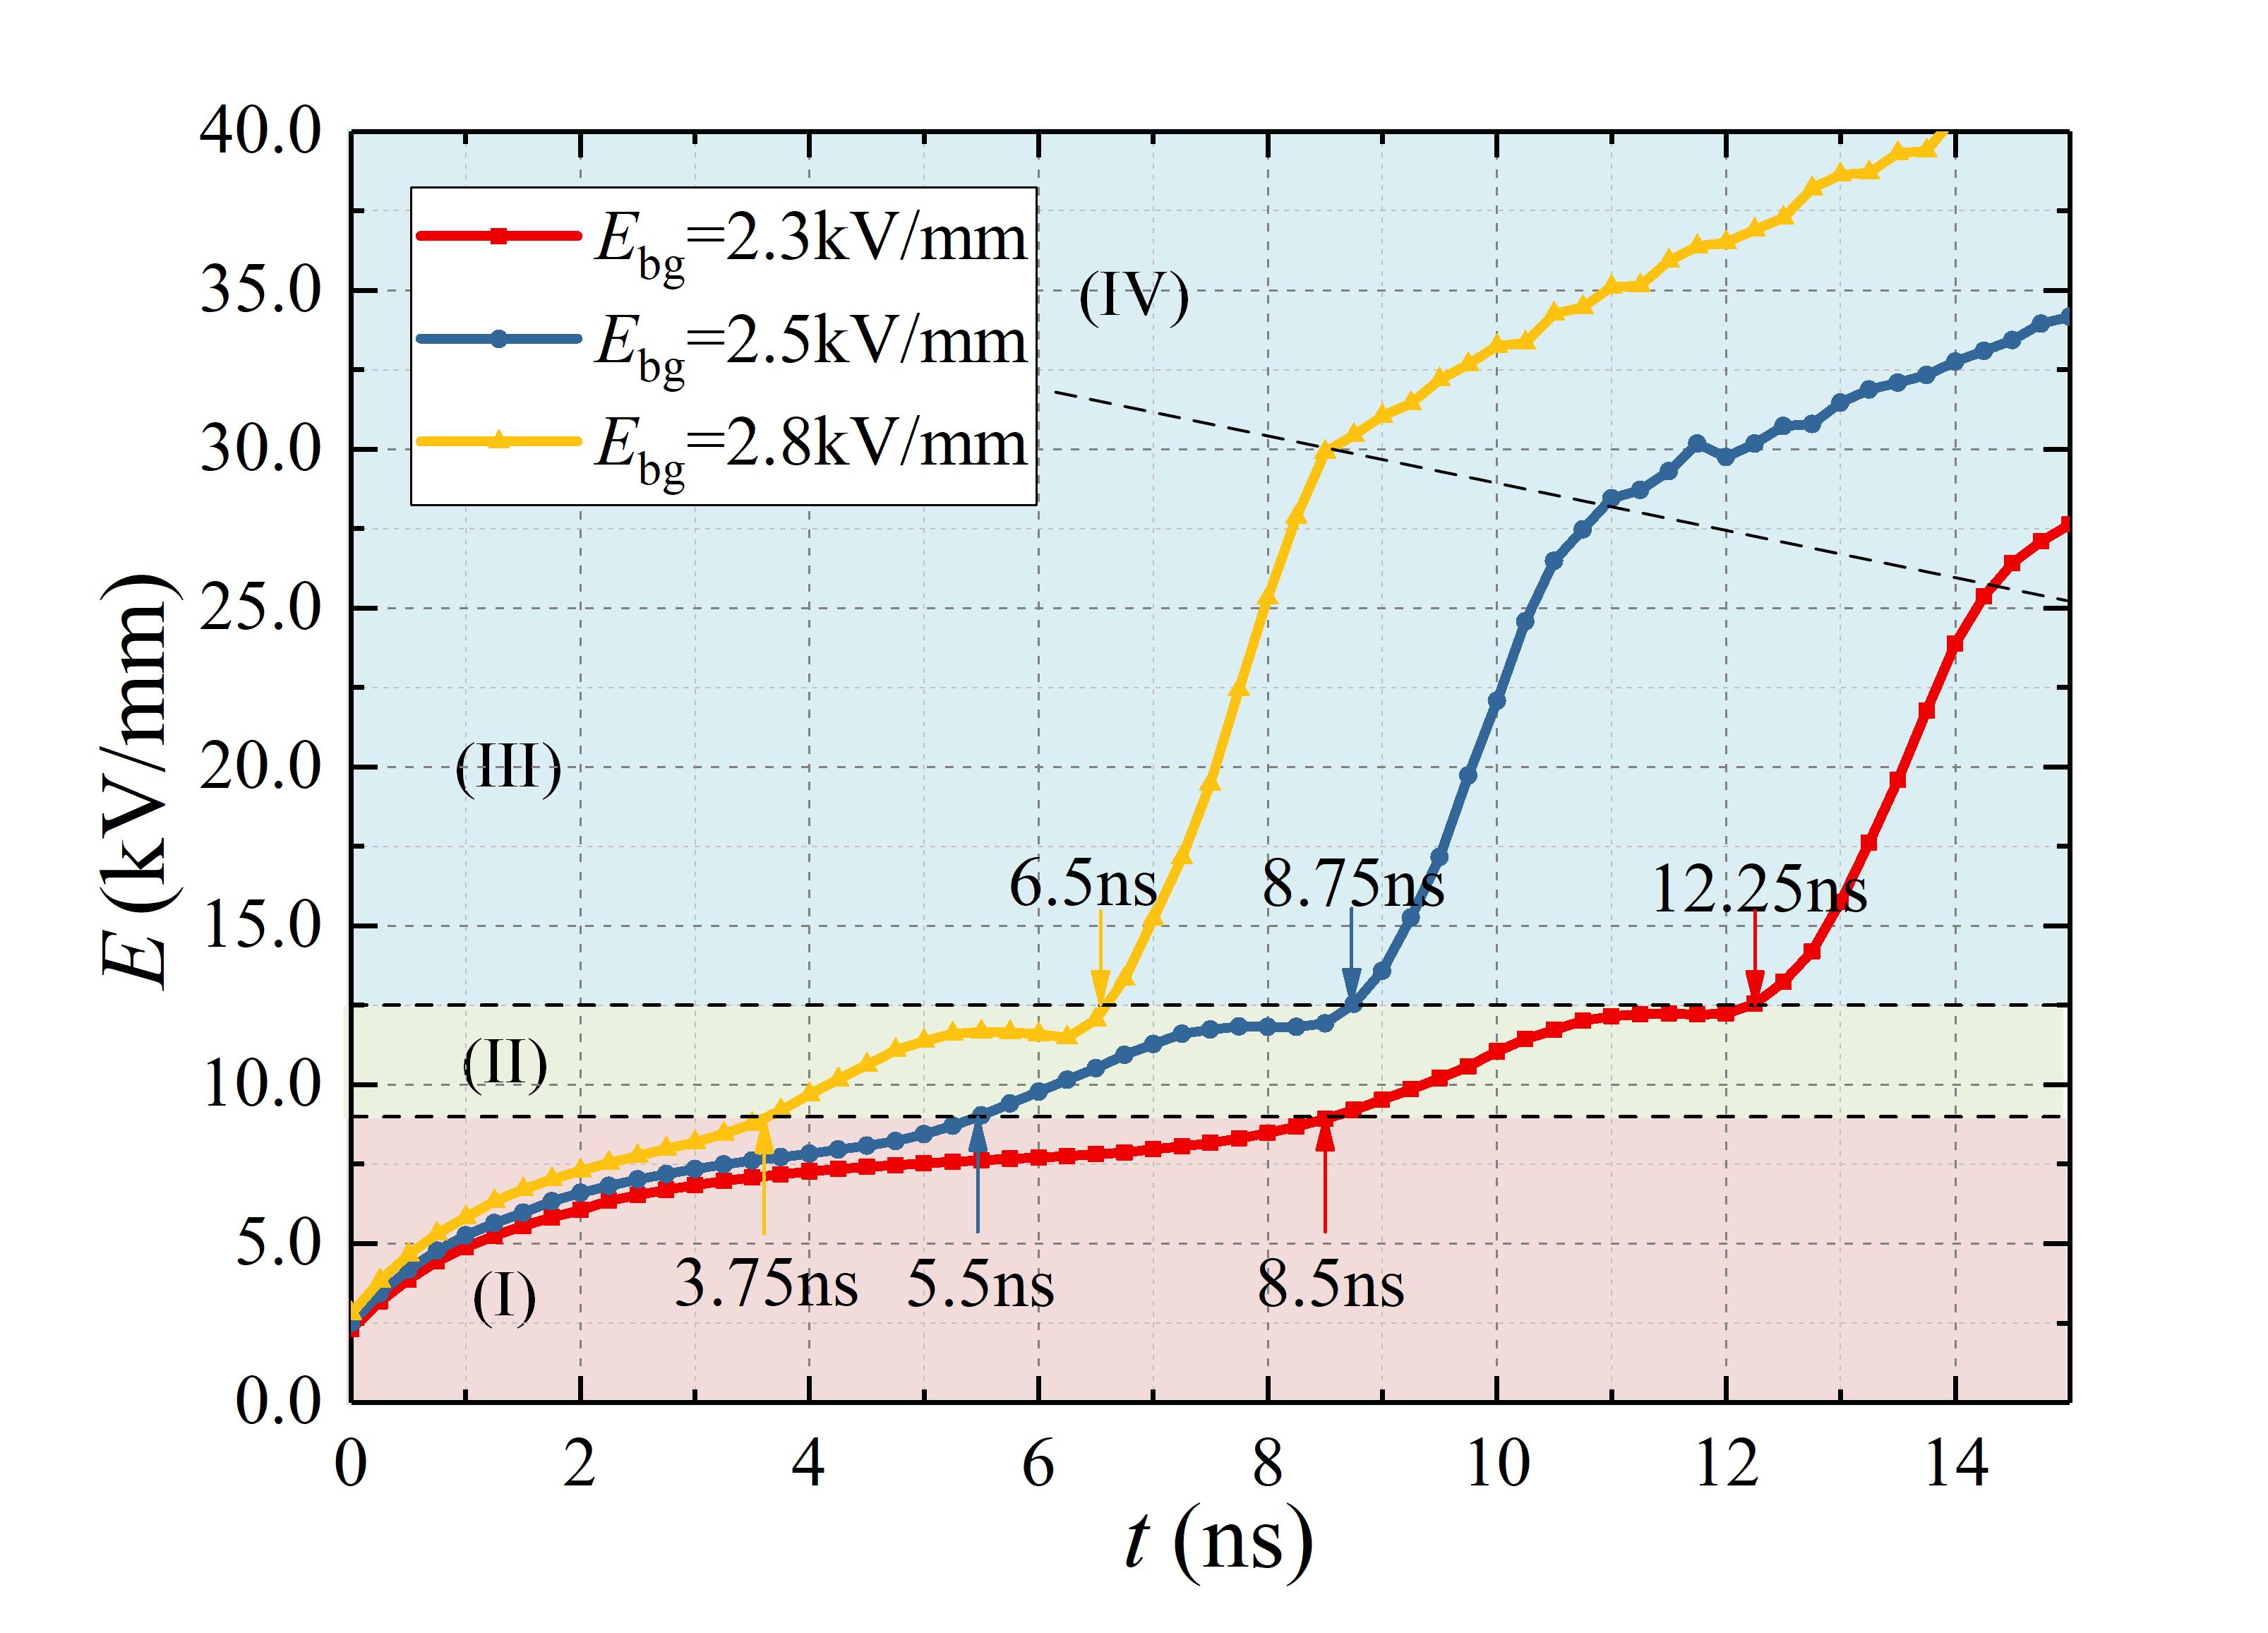
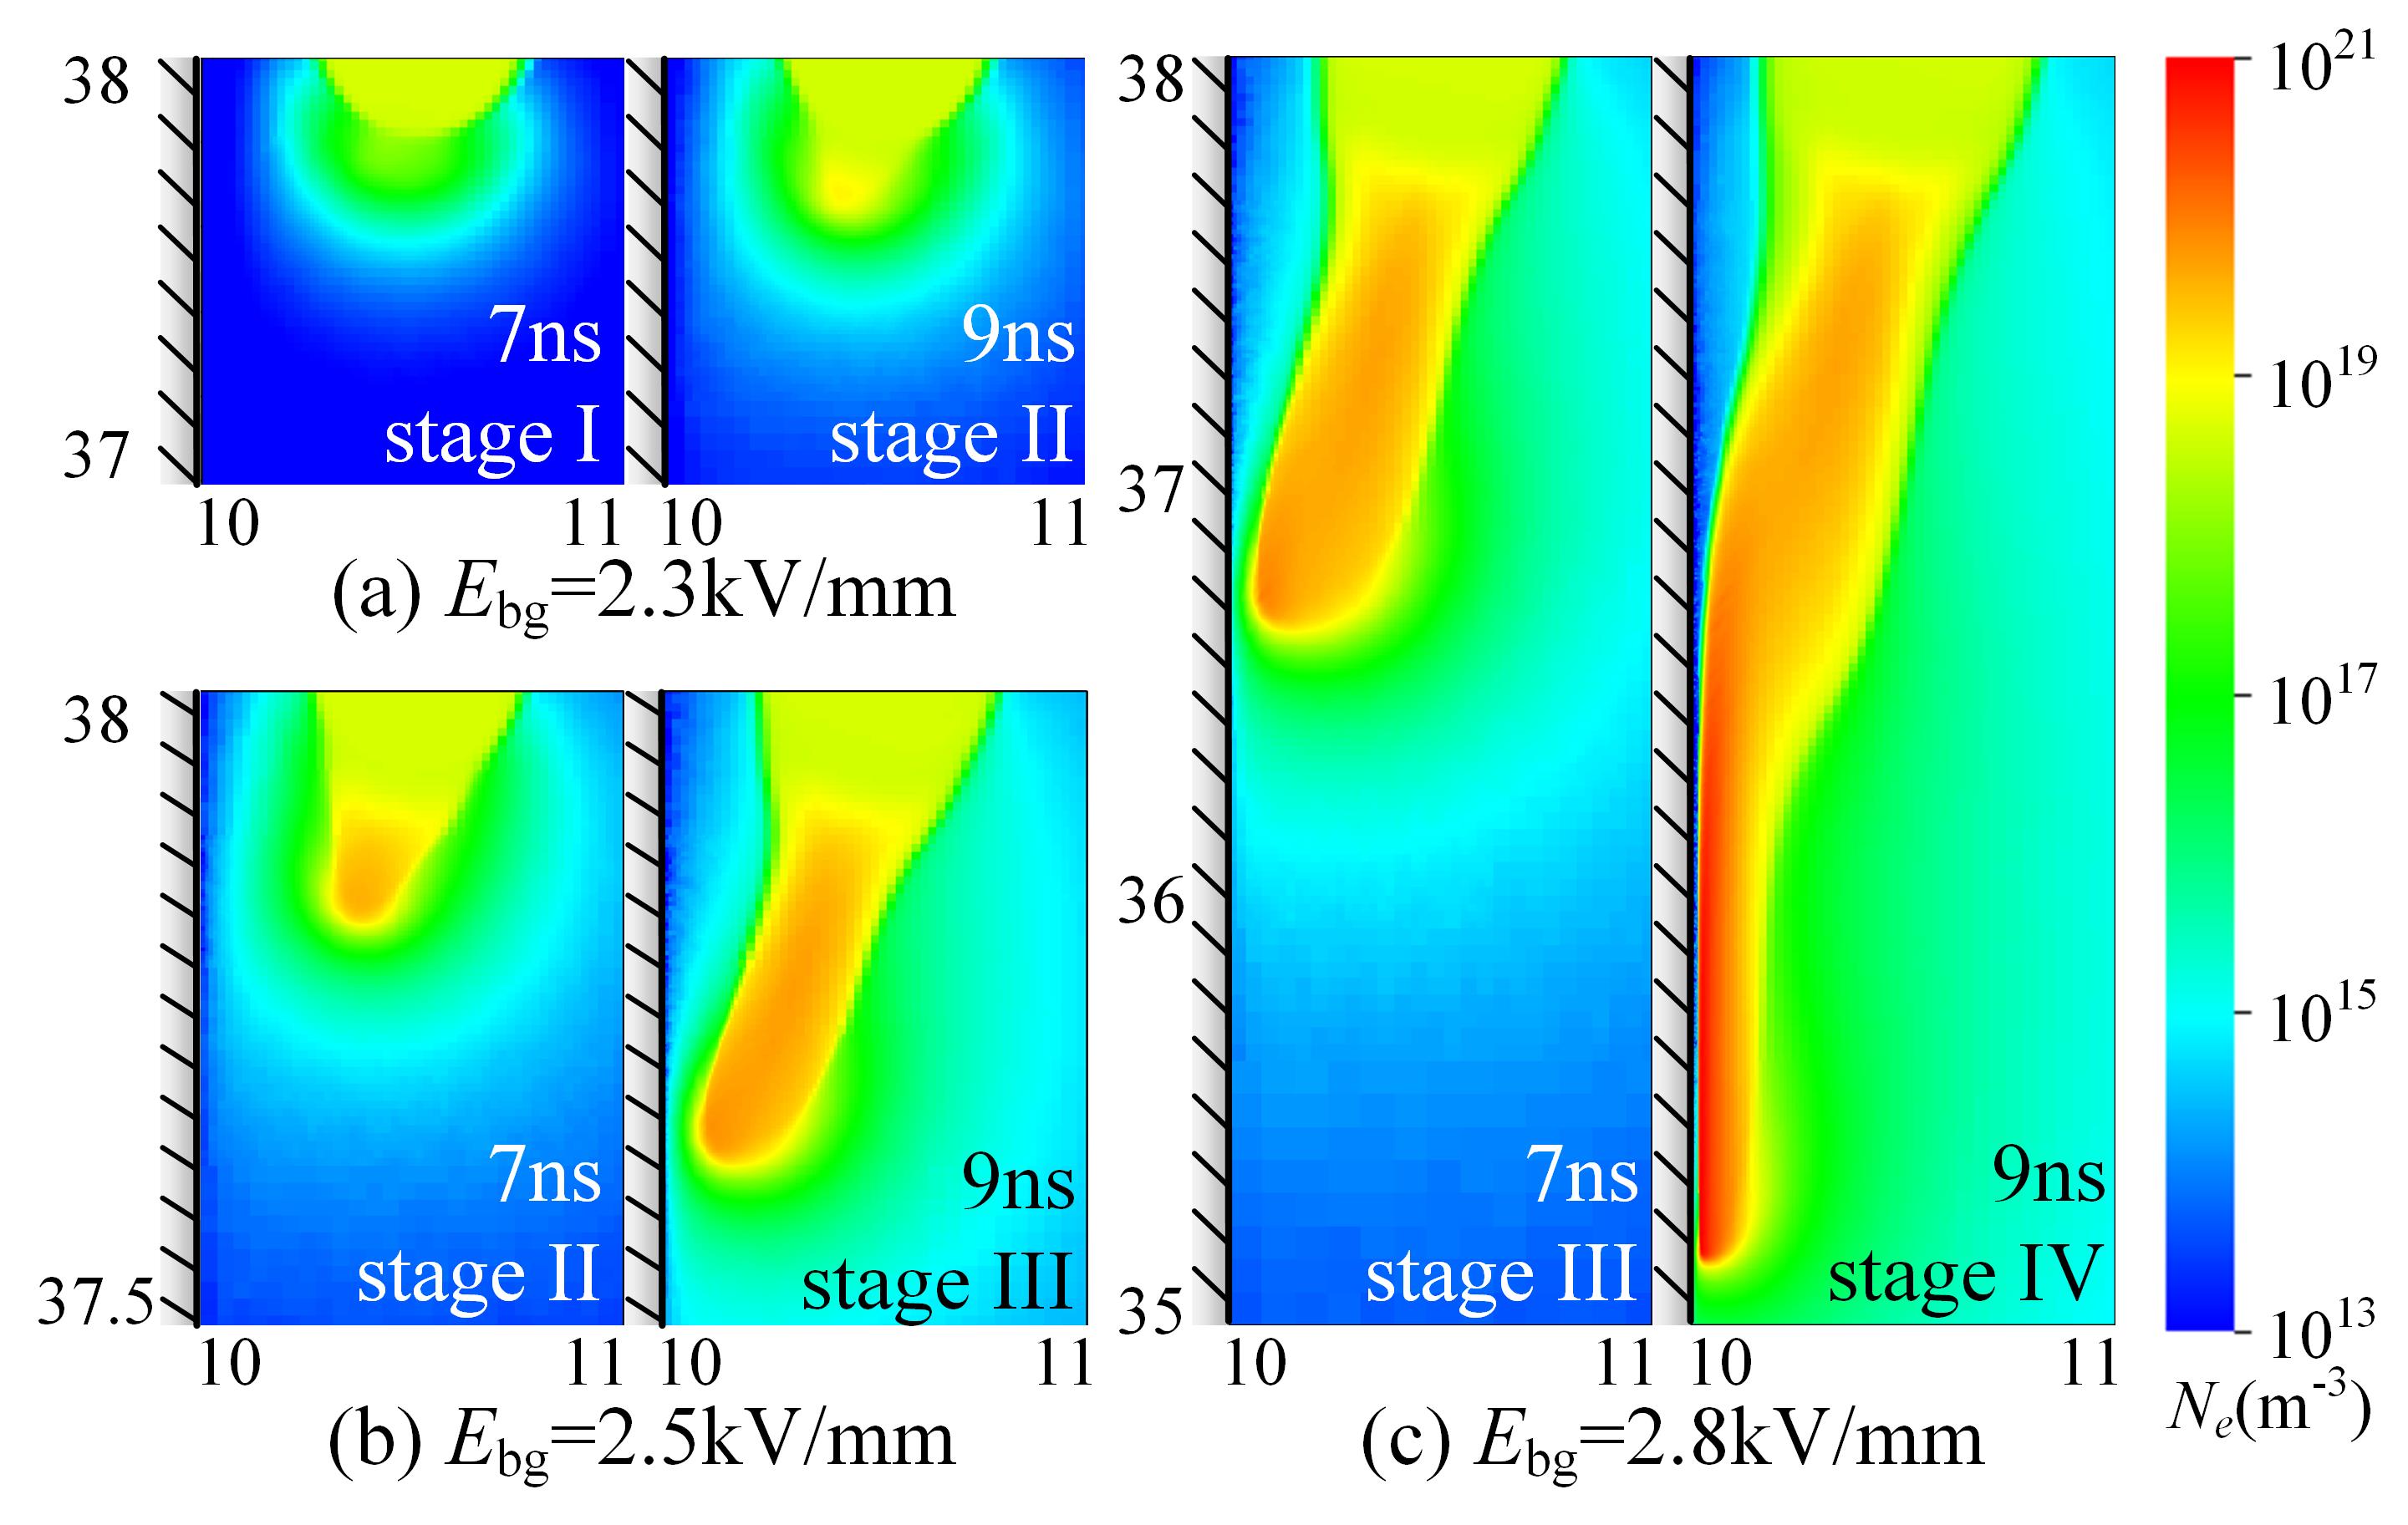
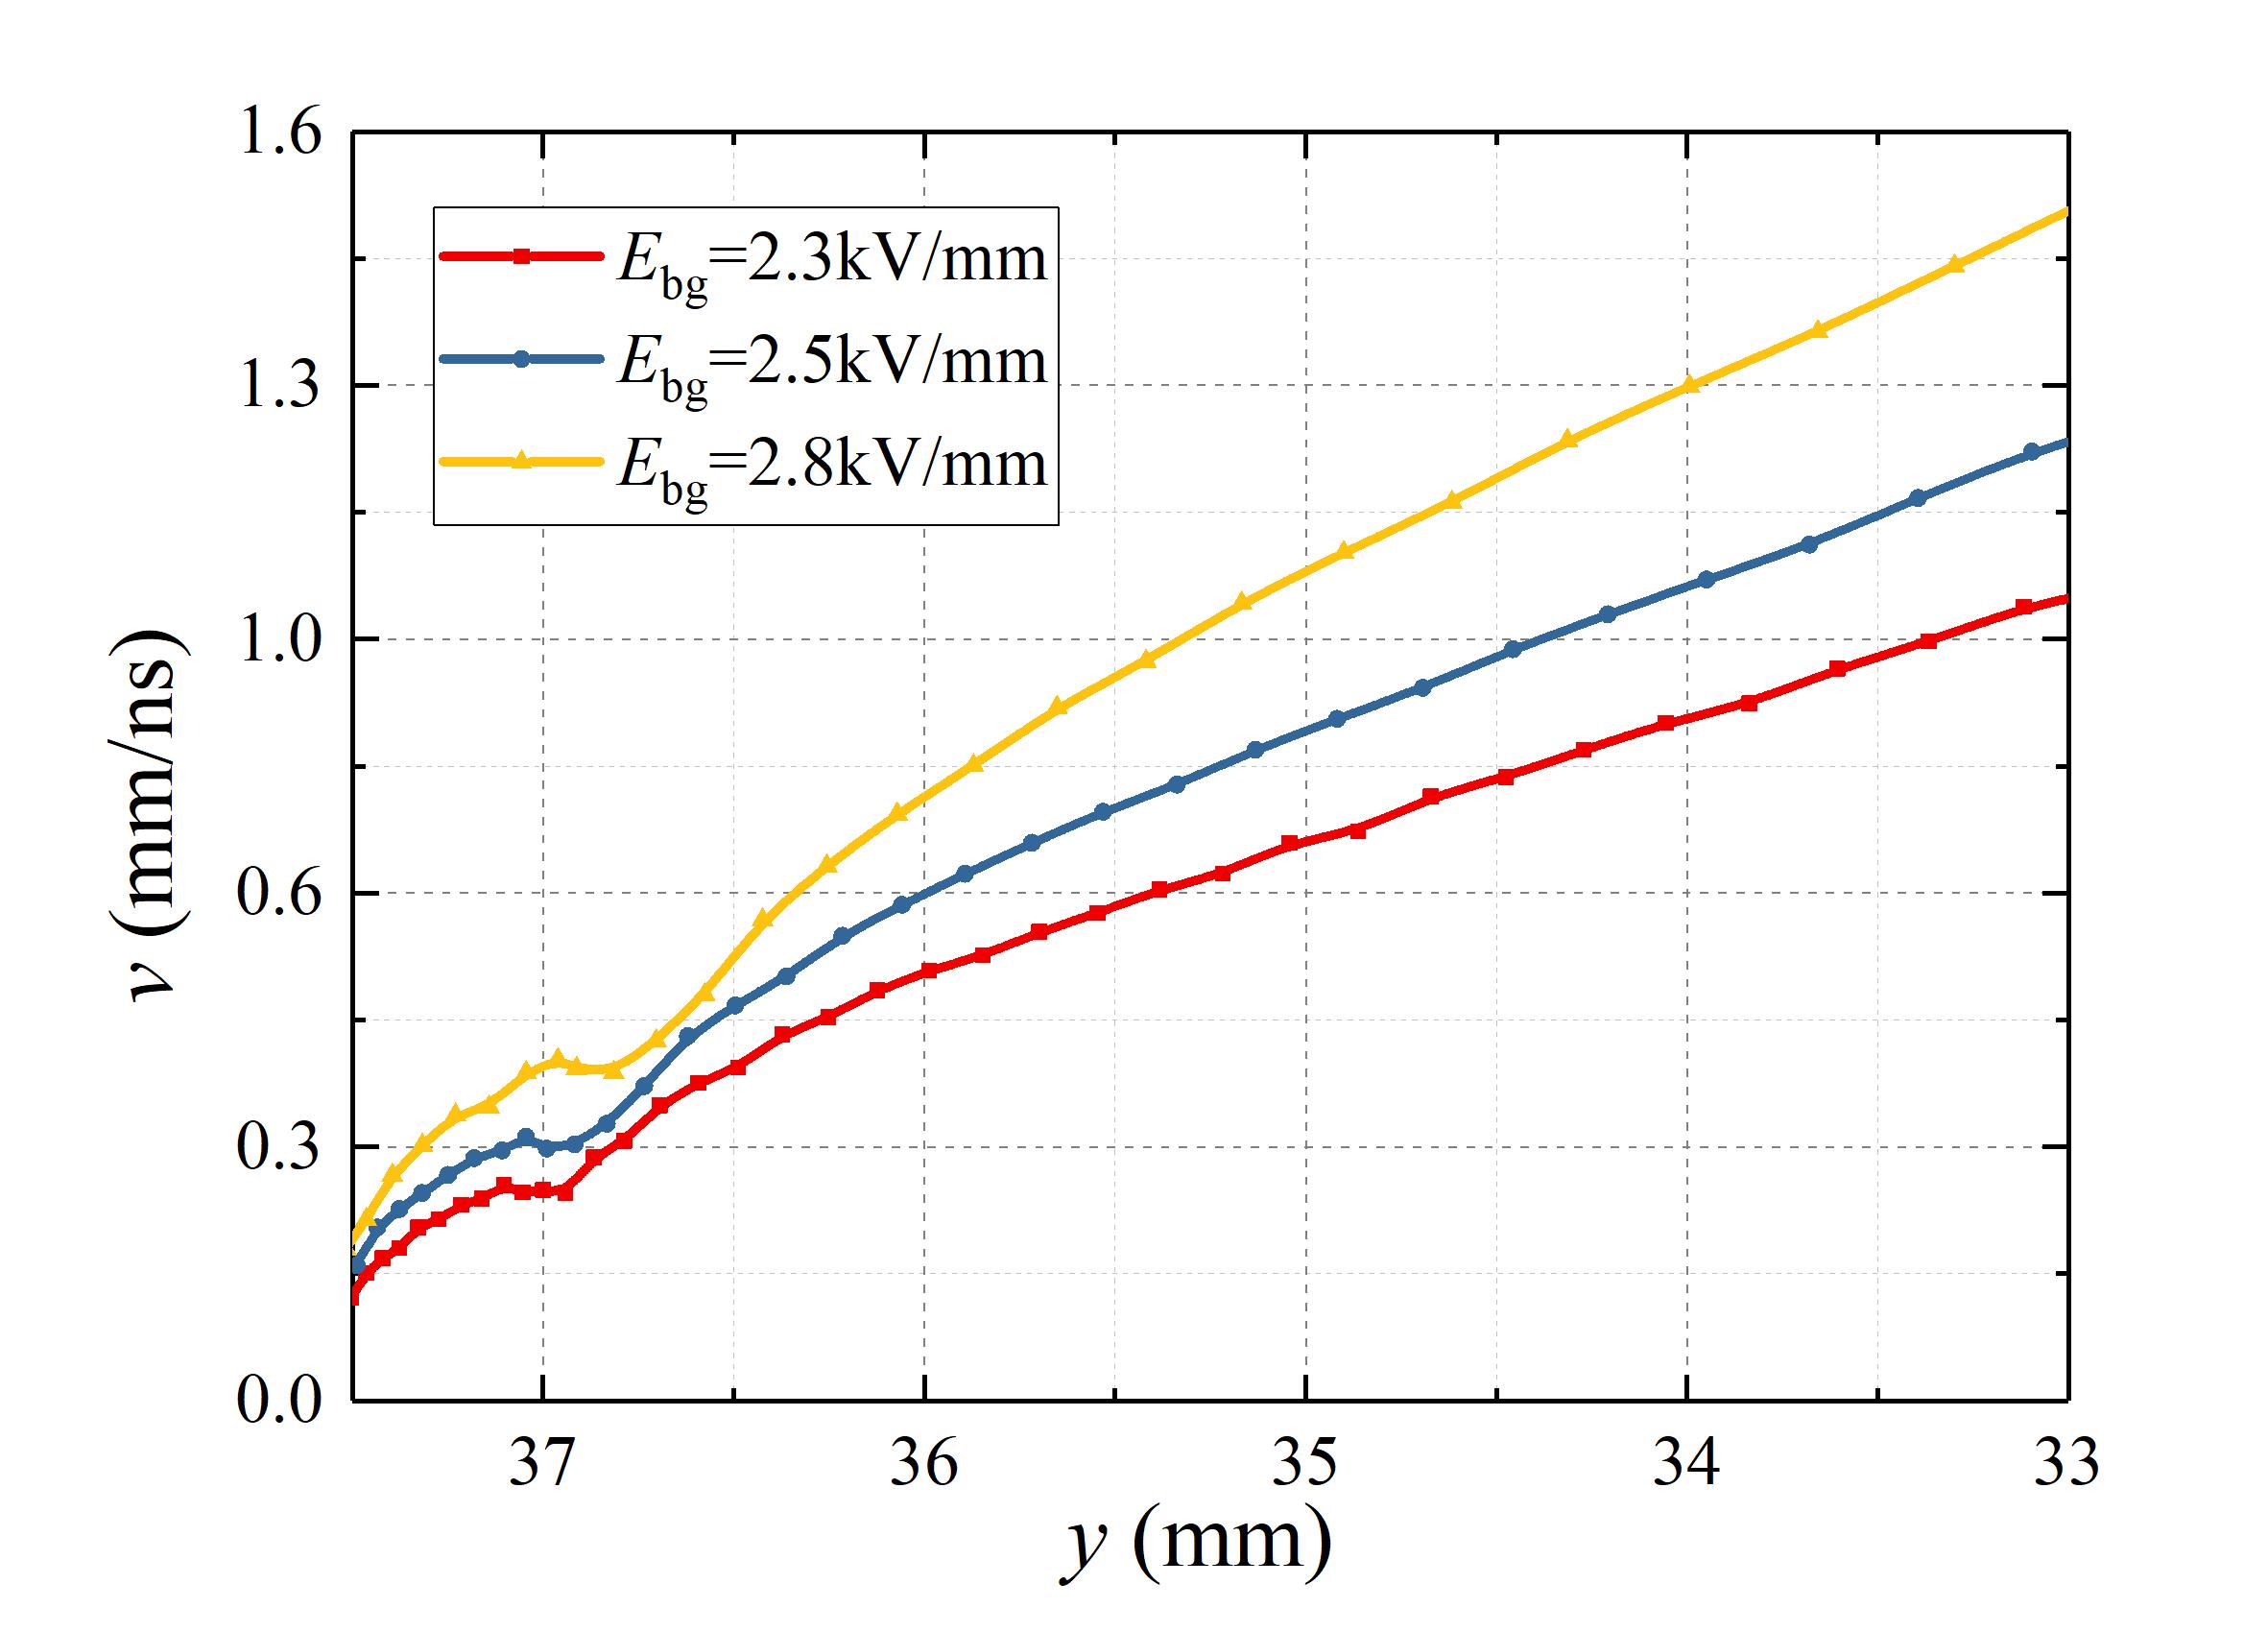
Figure 10 shows the streamer velocities versus their vertical location for the three applied voltages. As expected, a higher background electric field leads to a higher streamer velocity for streamers of the same length, in agreement with the experimental results of [9].
3.3 Effect of dielectric permittivity
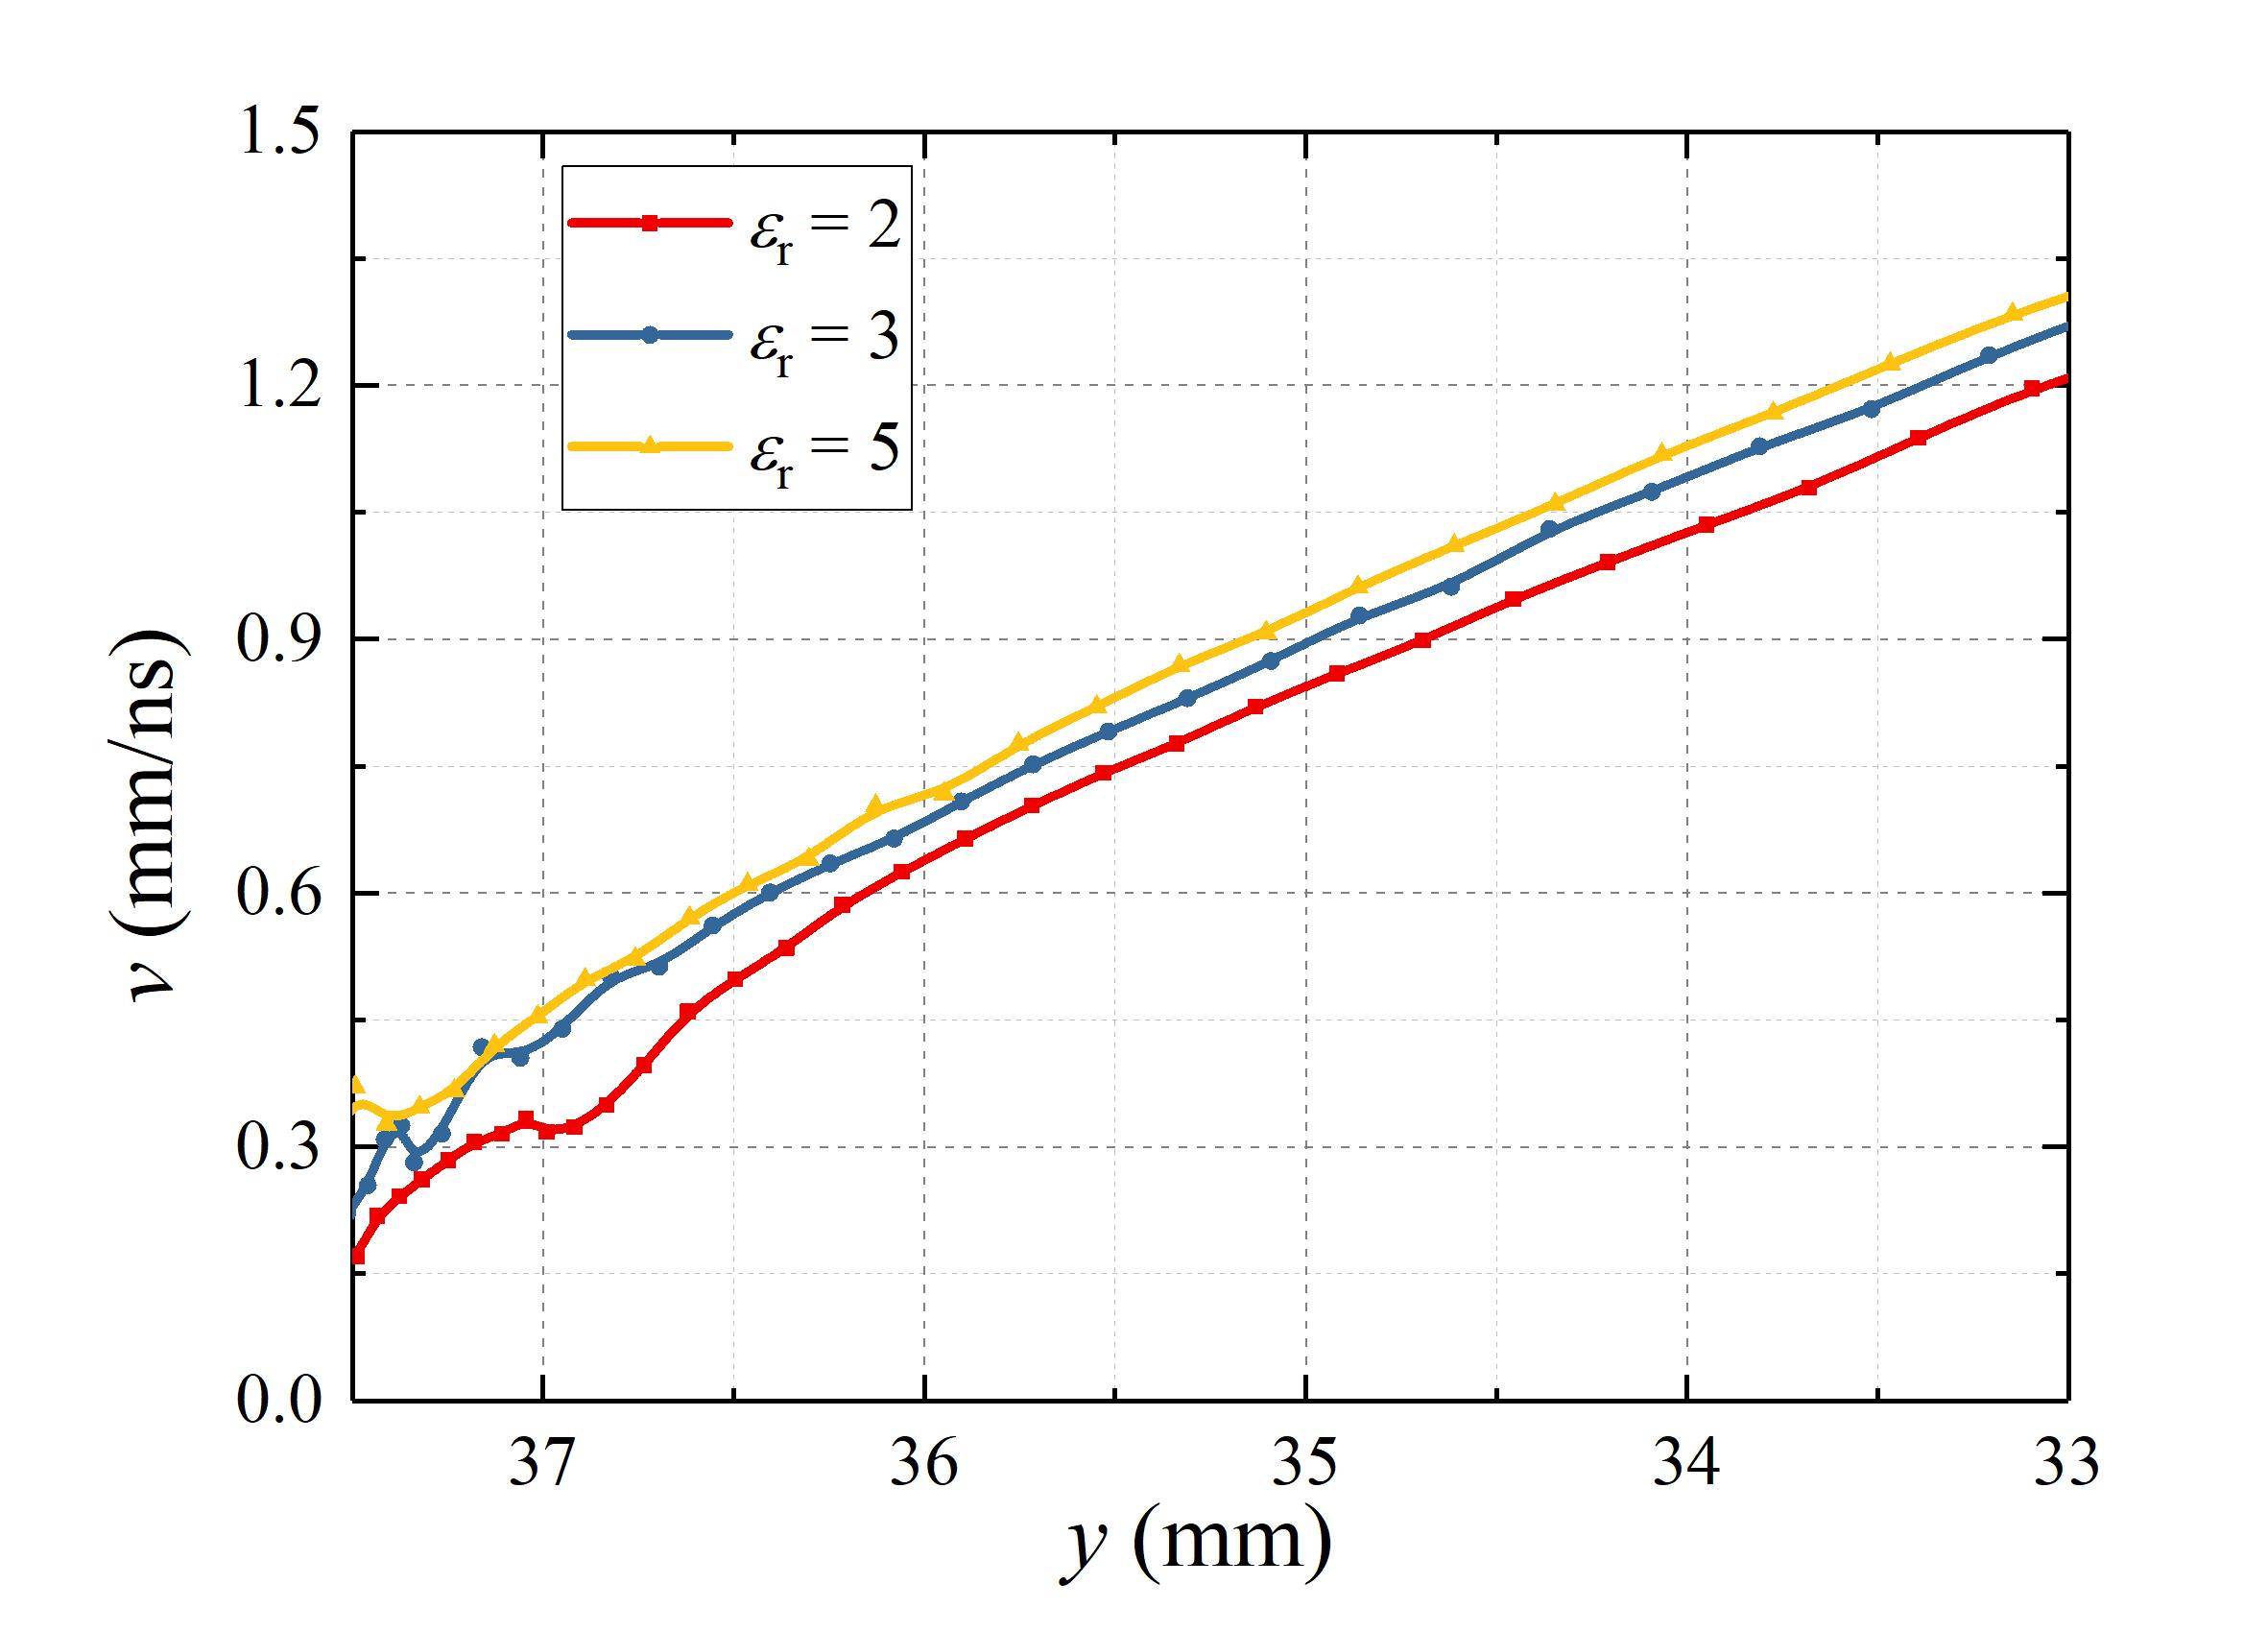
The relative permittivity of dielectric materials varies over a wide range. To study how affects surface discharges, we have performed simulations with set to 2, 3 and 5. As before, the initial seed was placed at from the dielectric, and simulations were performed up to .
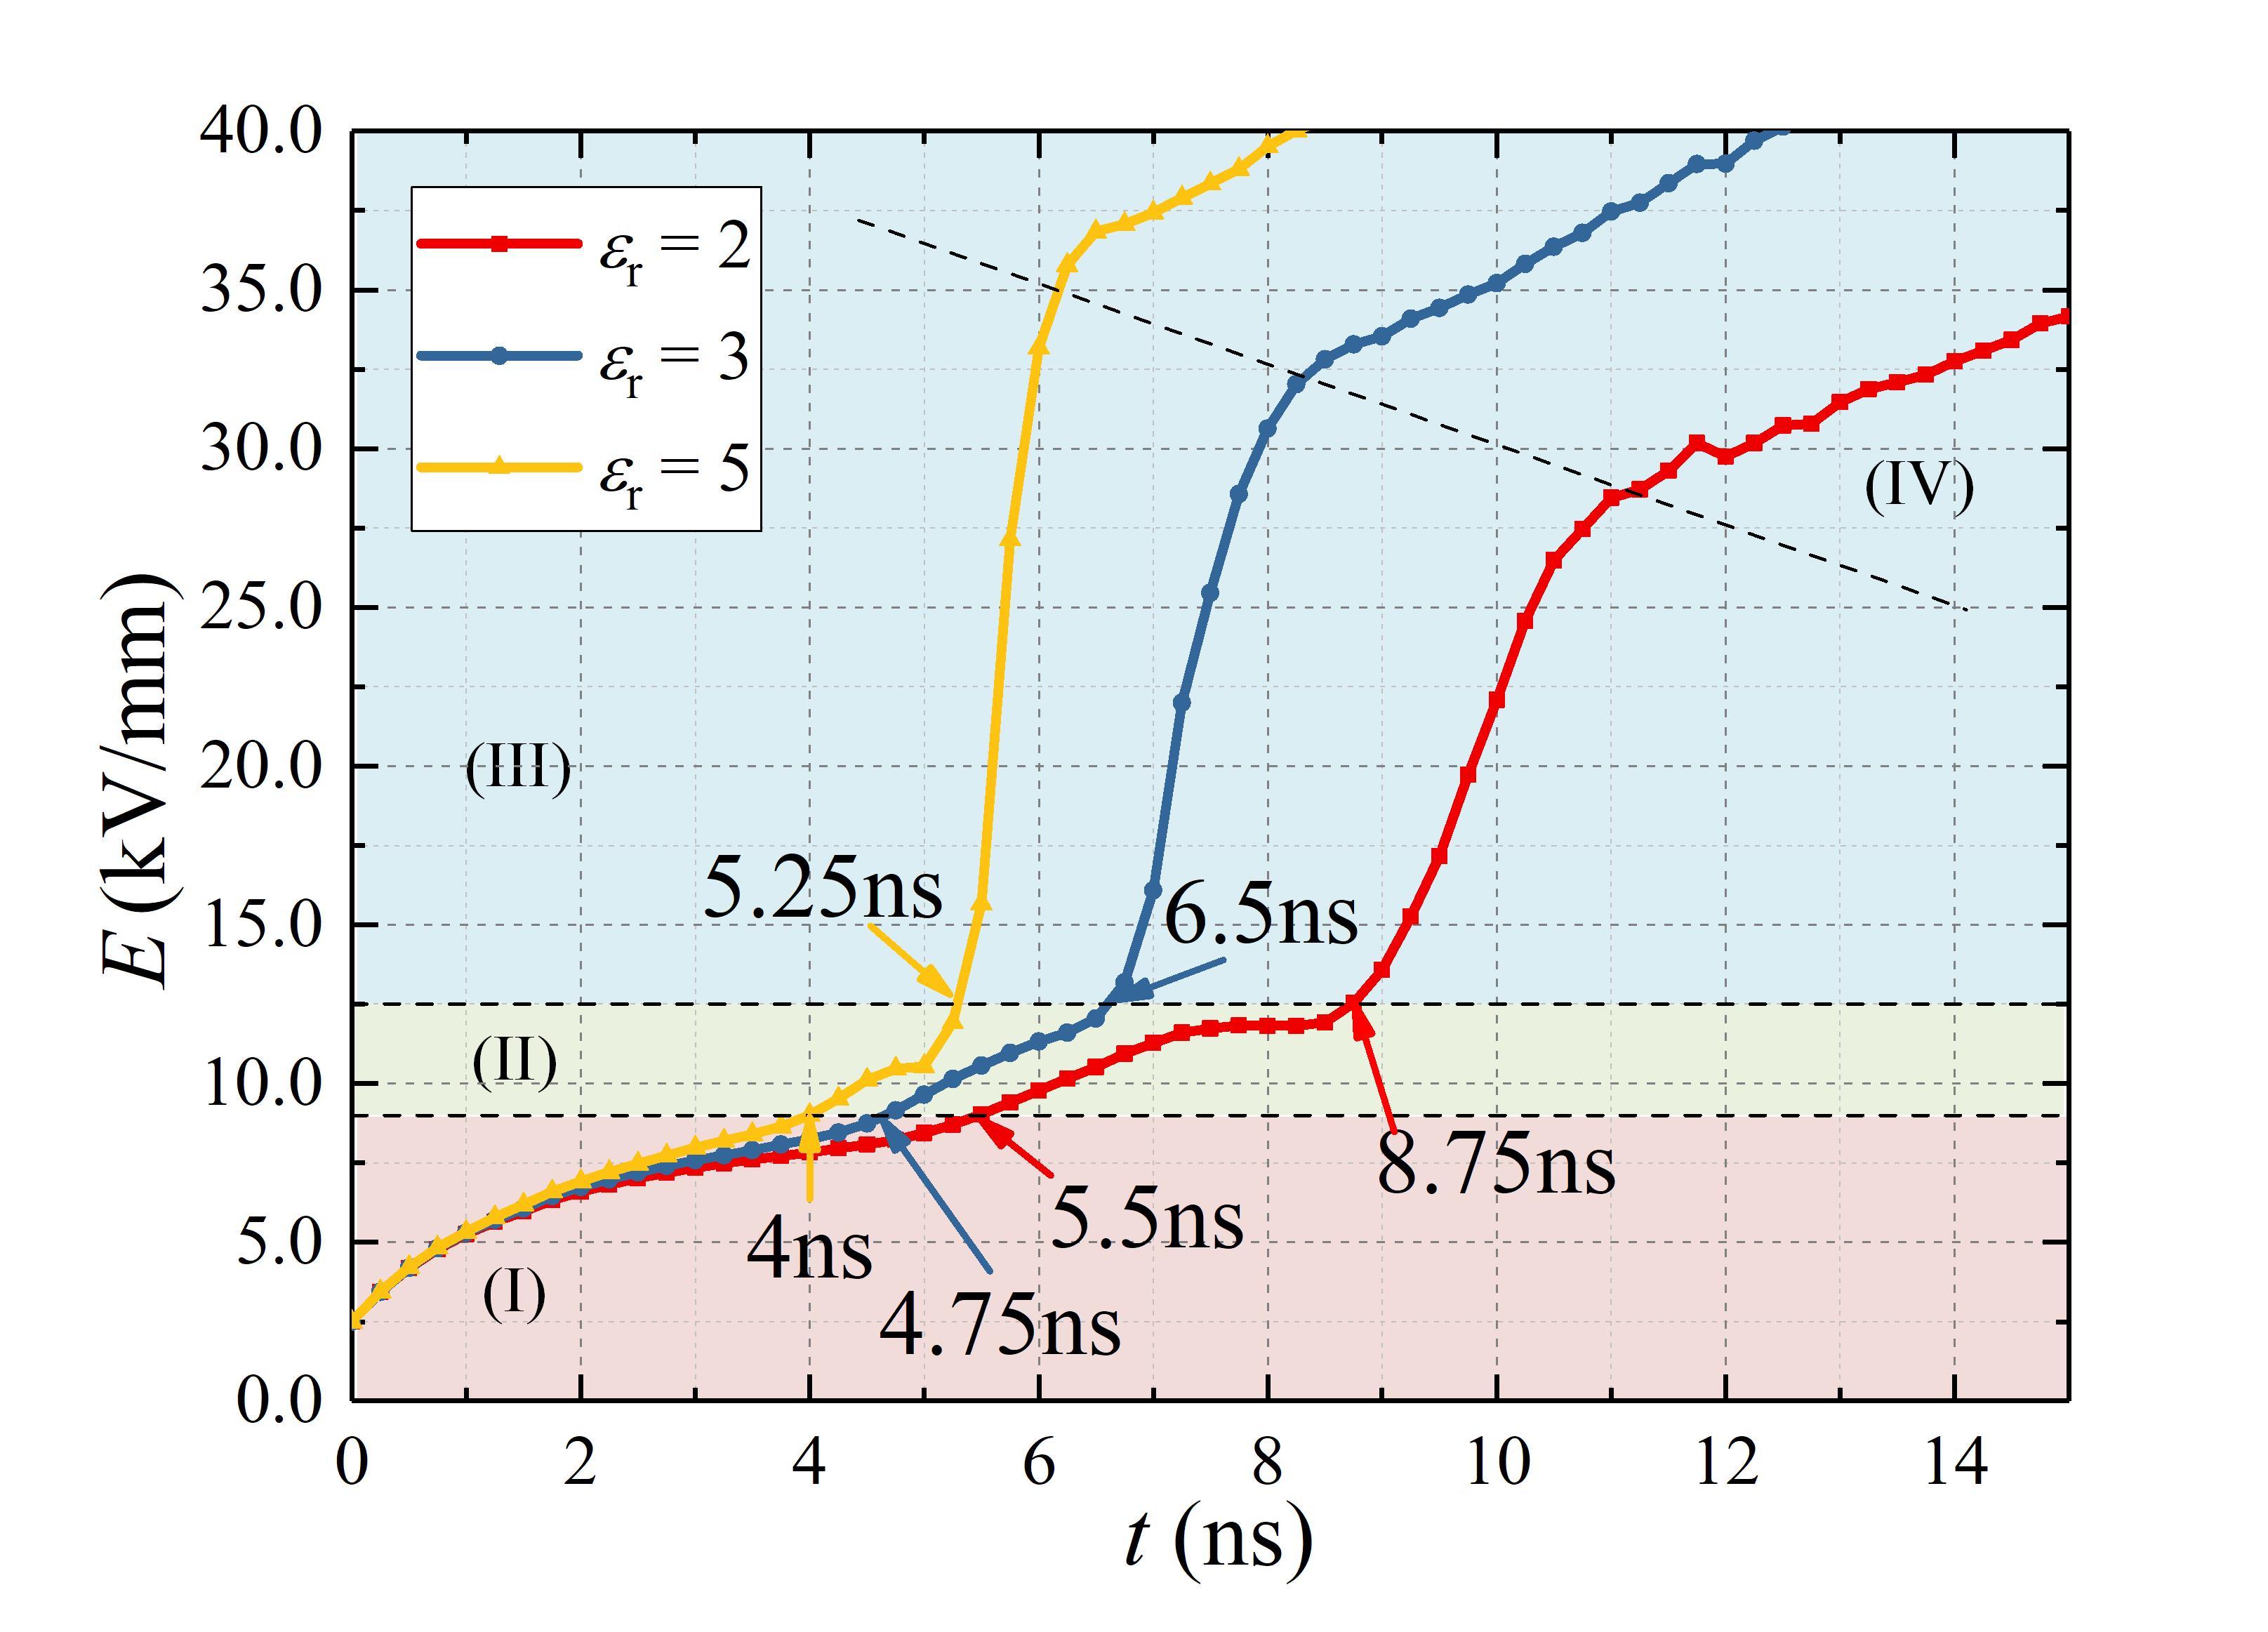
The maximum electric field versus time for the three permittivities is shown in figure 11. The main difference we observe is that the second and third stages are shorter for a higher permittivity. A higher means the dielectric polarizes more strongly, which leads to a stronger attraction of streamers to the dielectric. Streamers therefore start the surface propagation stage earlier, and their maximum electric field increases more rapidly. Note that their maximum electric field is also higher during the surface propagation stage. In summary, we can conclude that a higher permittivity leads to a faster transition into a surface streamer, and a higher maximum field during the surface propagation stage.
Figure 12 shows the electron density for these three cases when all the streamers are at . It can clearly be seen that the streamers attach more rapidly to the dielectric with a higher permittivity. Notice also that the surface streamer’s radius is smaller wither a higher dielectric permittivity, a result of the stronger electrostatic attraction.
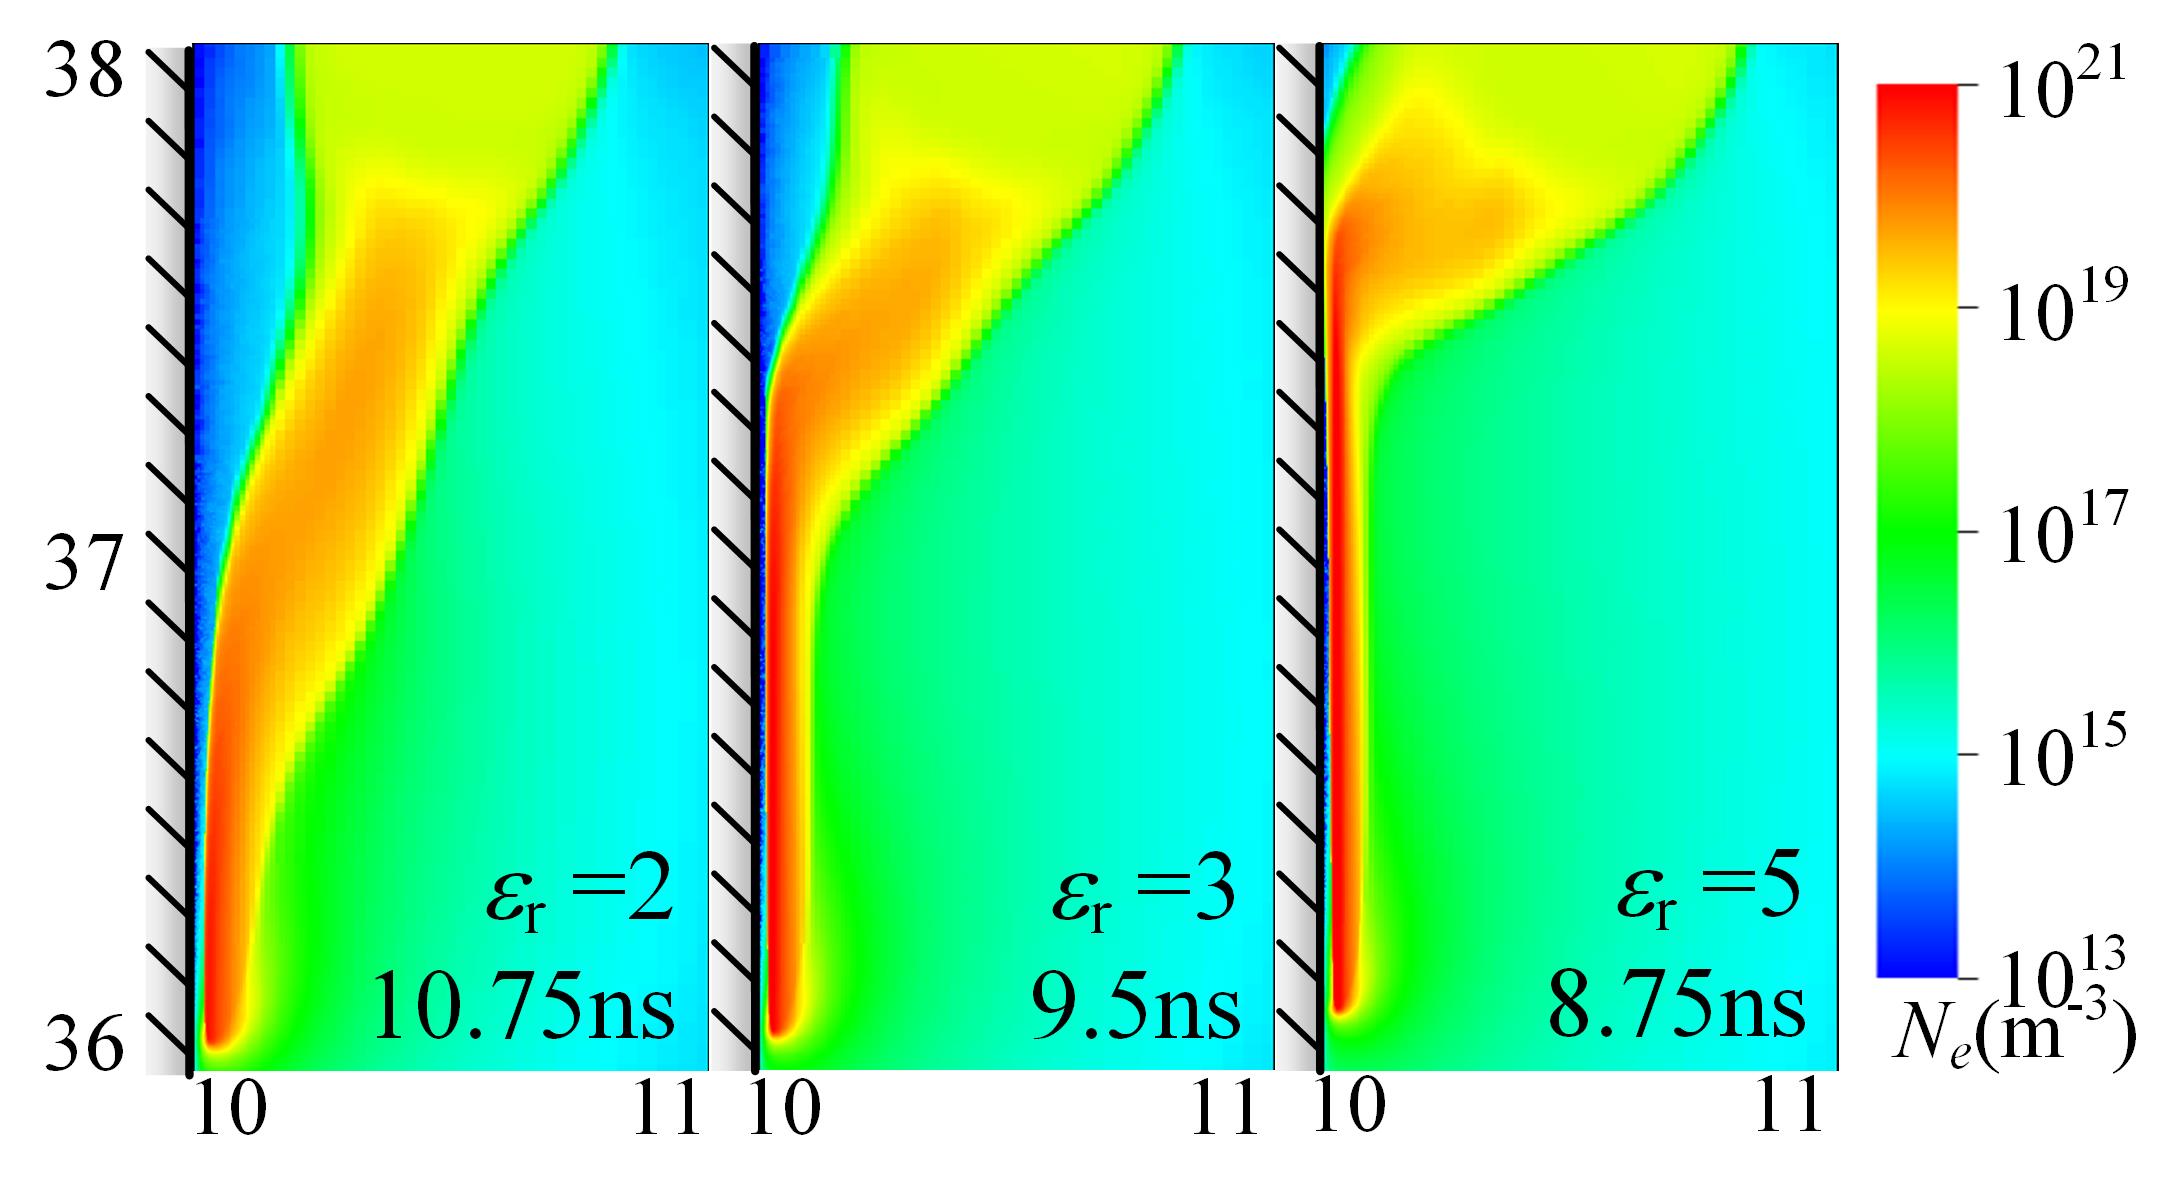
Figure 13 shows the velocity versus the streamer’s vertical position for the different . The permittivity has only a small effect on the streamer’s velocity, in agreement with the experimental observations of [6]. In contrast, a negative correlation between the permittivity and the streamer velocity was found in [9]. The discrepancy could come from the different geometry that was used, in which multiple surface and gas streamers propagated next to a cylindrical dielectric.
3.4 Effect of Secondary Electron emission from Dielectrics
Electron emission from dielectrics may influence streamer velocities [46] and affect the high electric field in the dielectric-plasma gap [47]. In this section, we study how secondary electron emission affects surface streamers in our computational geometry. Both ion-induced secondary emission (ISEE) and photo-emission are considered.
3.4.1 Ion-induced secondary electron emission
The ion-induced secondary electron emission (ISEE) yield can vary over a wide range [48, 49, 50]. Here we consider two cases, and (i.e., no secondary emission). In this section, the initial ionized seed’s center is placed away from the dielectric, so that streamers start directly next to the dielectric. Figure 14 shows the electron density and electric field distribution at for both ISEE coefficients. It can be seen that ISEE here has little effect on the streamer length and the electric field. The electron density in the streamer-dielectric gap is slightly higher behind the head for the streamer with , but this has negligible influence on the electric field in the gap. We can conclude that the ISEE yield hardly affects the streamer head and its propagation (the latter is mainly determined by the former). The reason for this is that positive ions have a much lower mobility than electrons. Most positive ions are generated close to the streamer head, and they will not reach the dielectric in time to affect the rapidly propagating streamer head. Most ISEE electrons are therefore released after the streamer has passed by.
3.4.2 Photoemission
The photo-emission coefficient for typical dielectric materials varies between 10-4 to 10-1 for photon energies of 5–20 eV [51, 52]. This yield can be higher if the material contains stains or defects, or when it is negatively charged [10, 48]. The measurement of of dielectrics in air is often quite challenging [53]. We here use several values for to demonstrate how photoemission affects positive streamers.
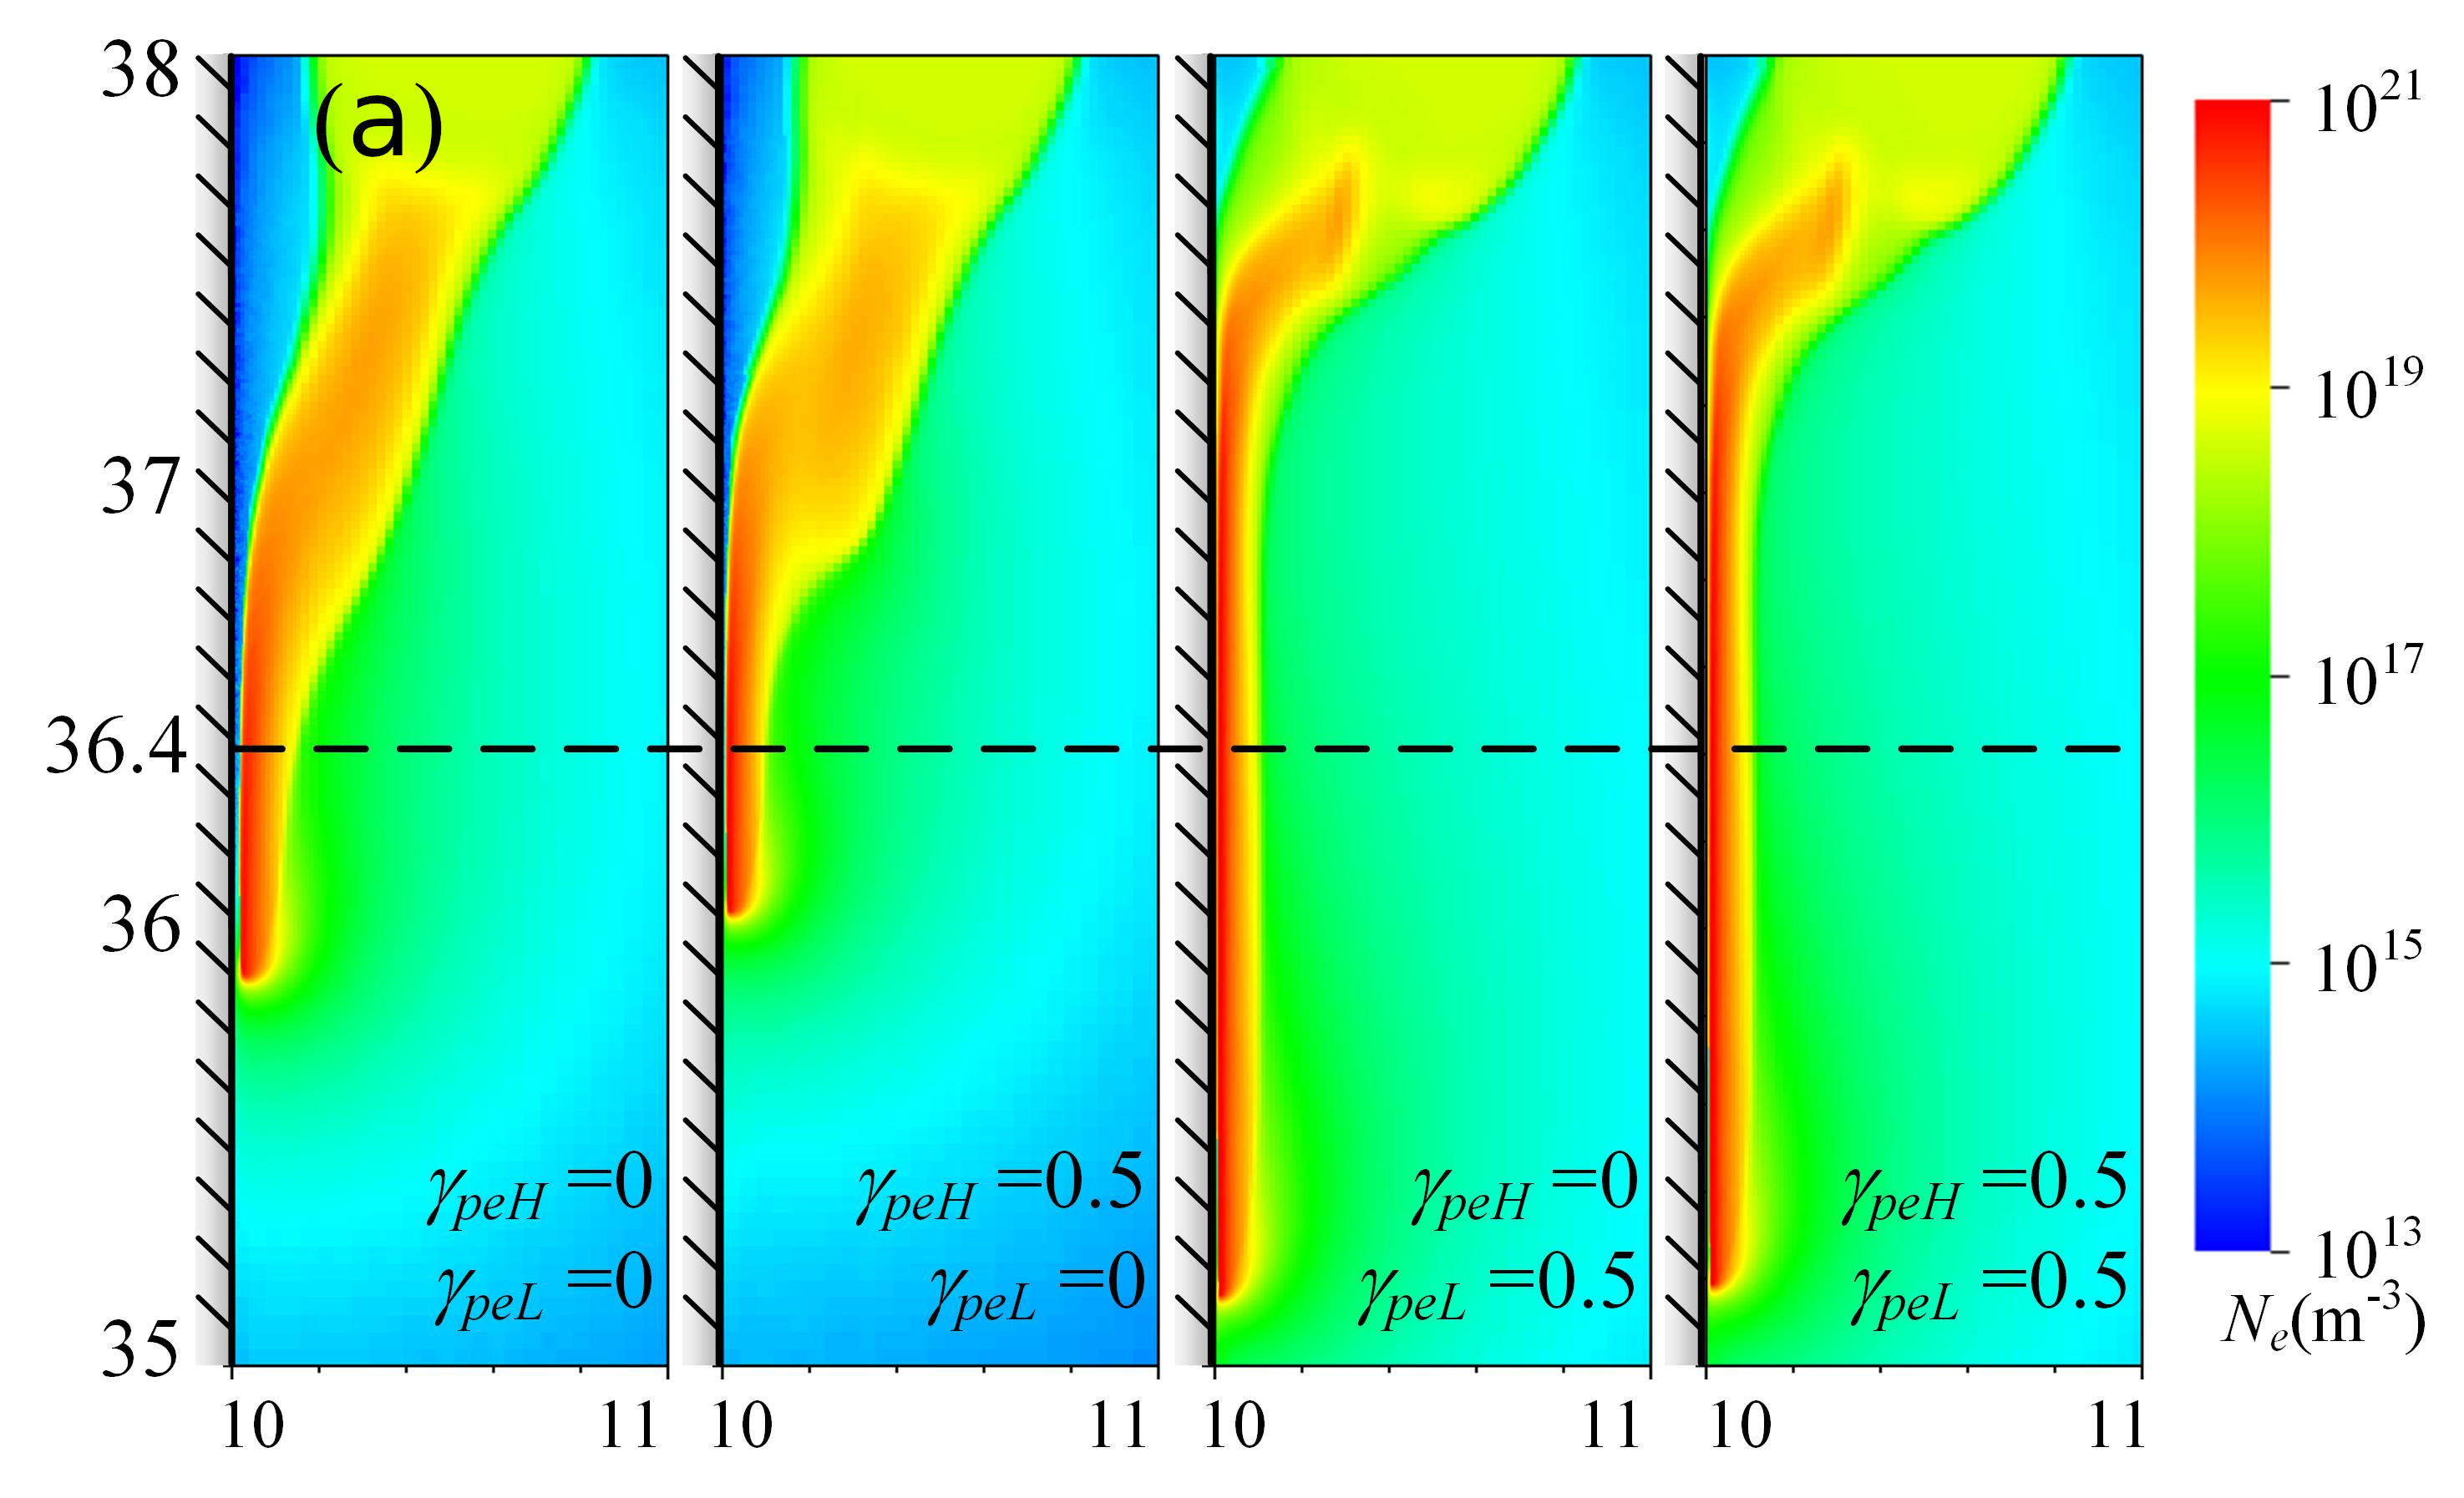
As discussed in section 2.3, we consider low-energy and high-energy photons, with the main distinction that high-energy photons can be absorbed in the gas. The following four cases are considered for the photoemission coefficients and for low-energy and high-energy photons:
-
1.
=0, =0
-
2.
=0.5, =0
-
3.
=0, =0.5
-
4.
=0.5, =0.5
In the simulations, streamers start near the dielectric, with the seed placed at either or from the dielectric.
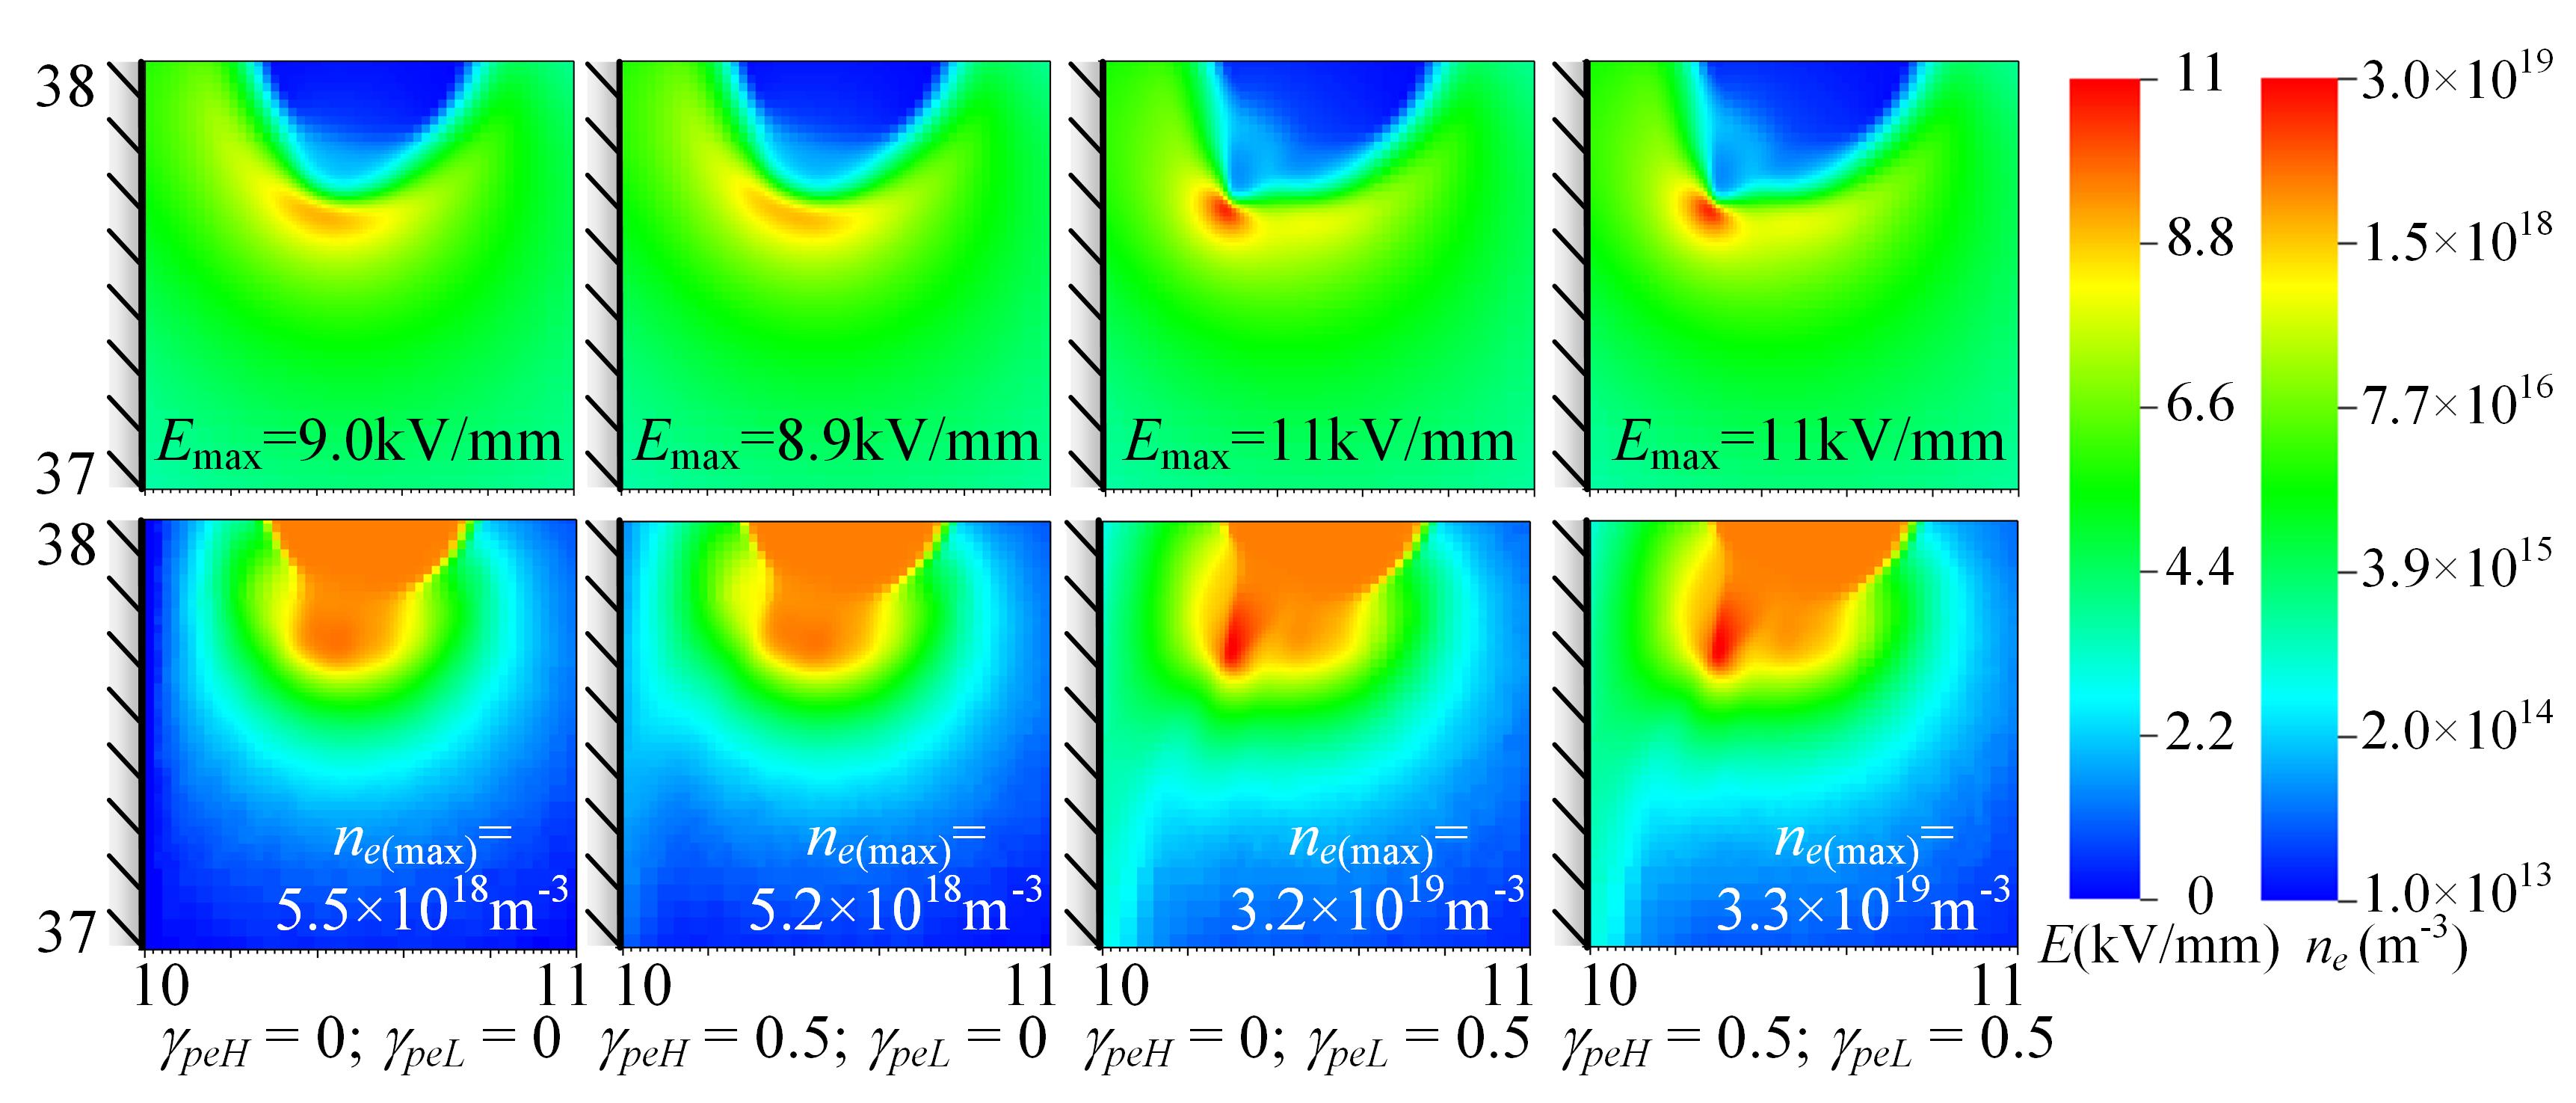
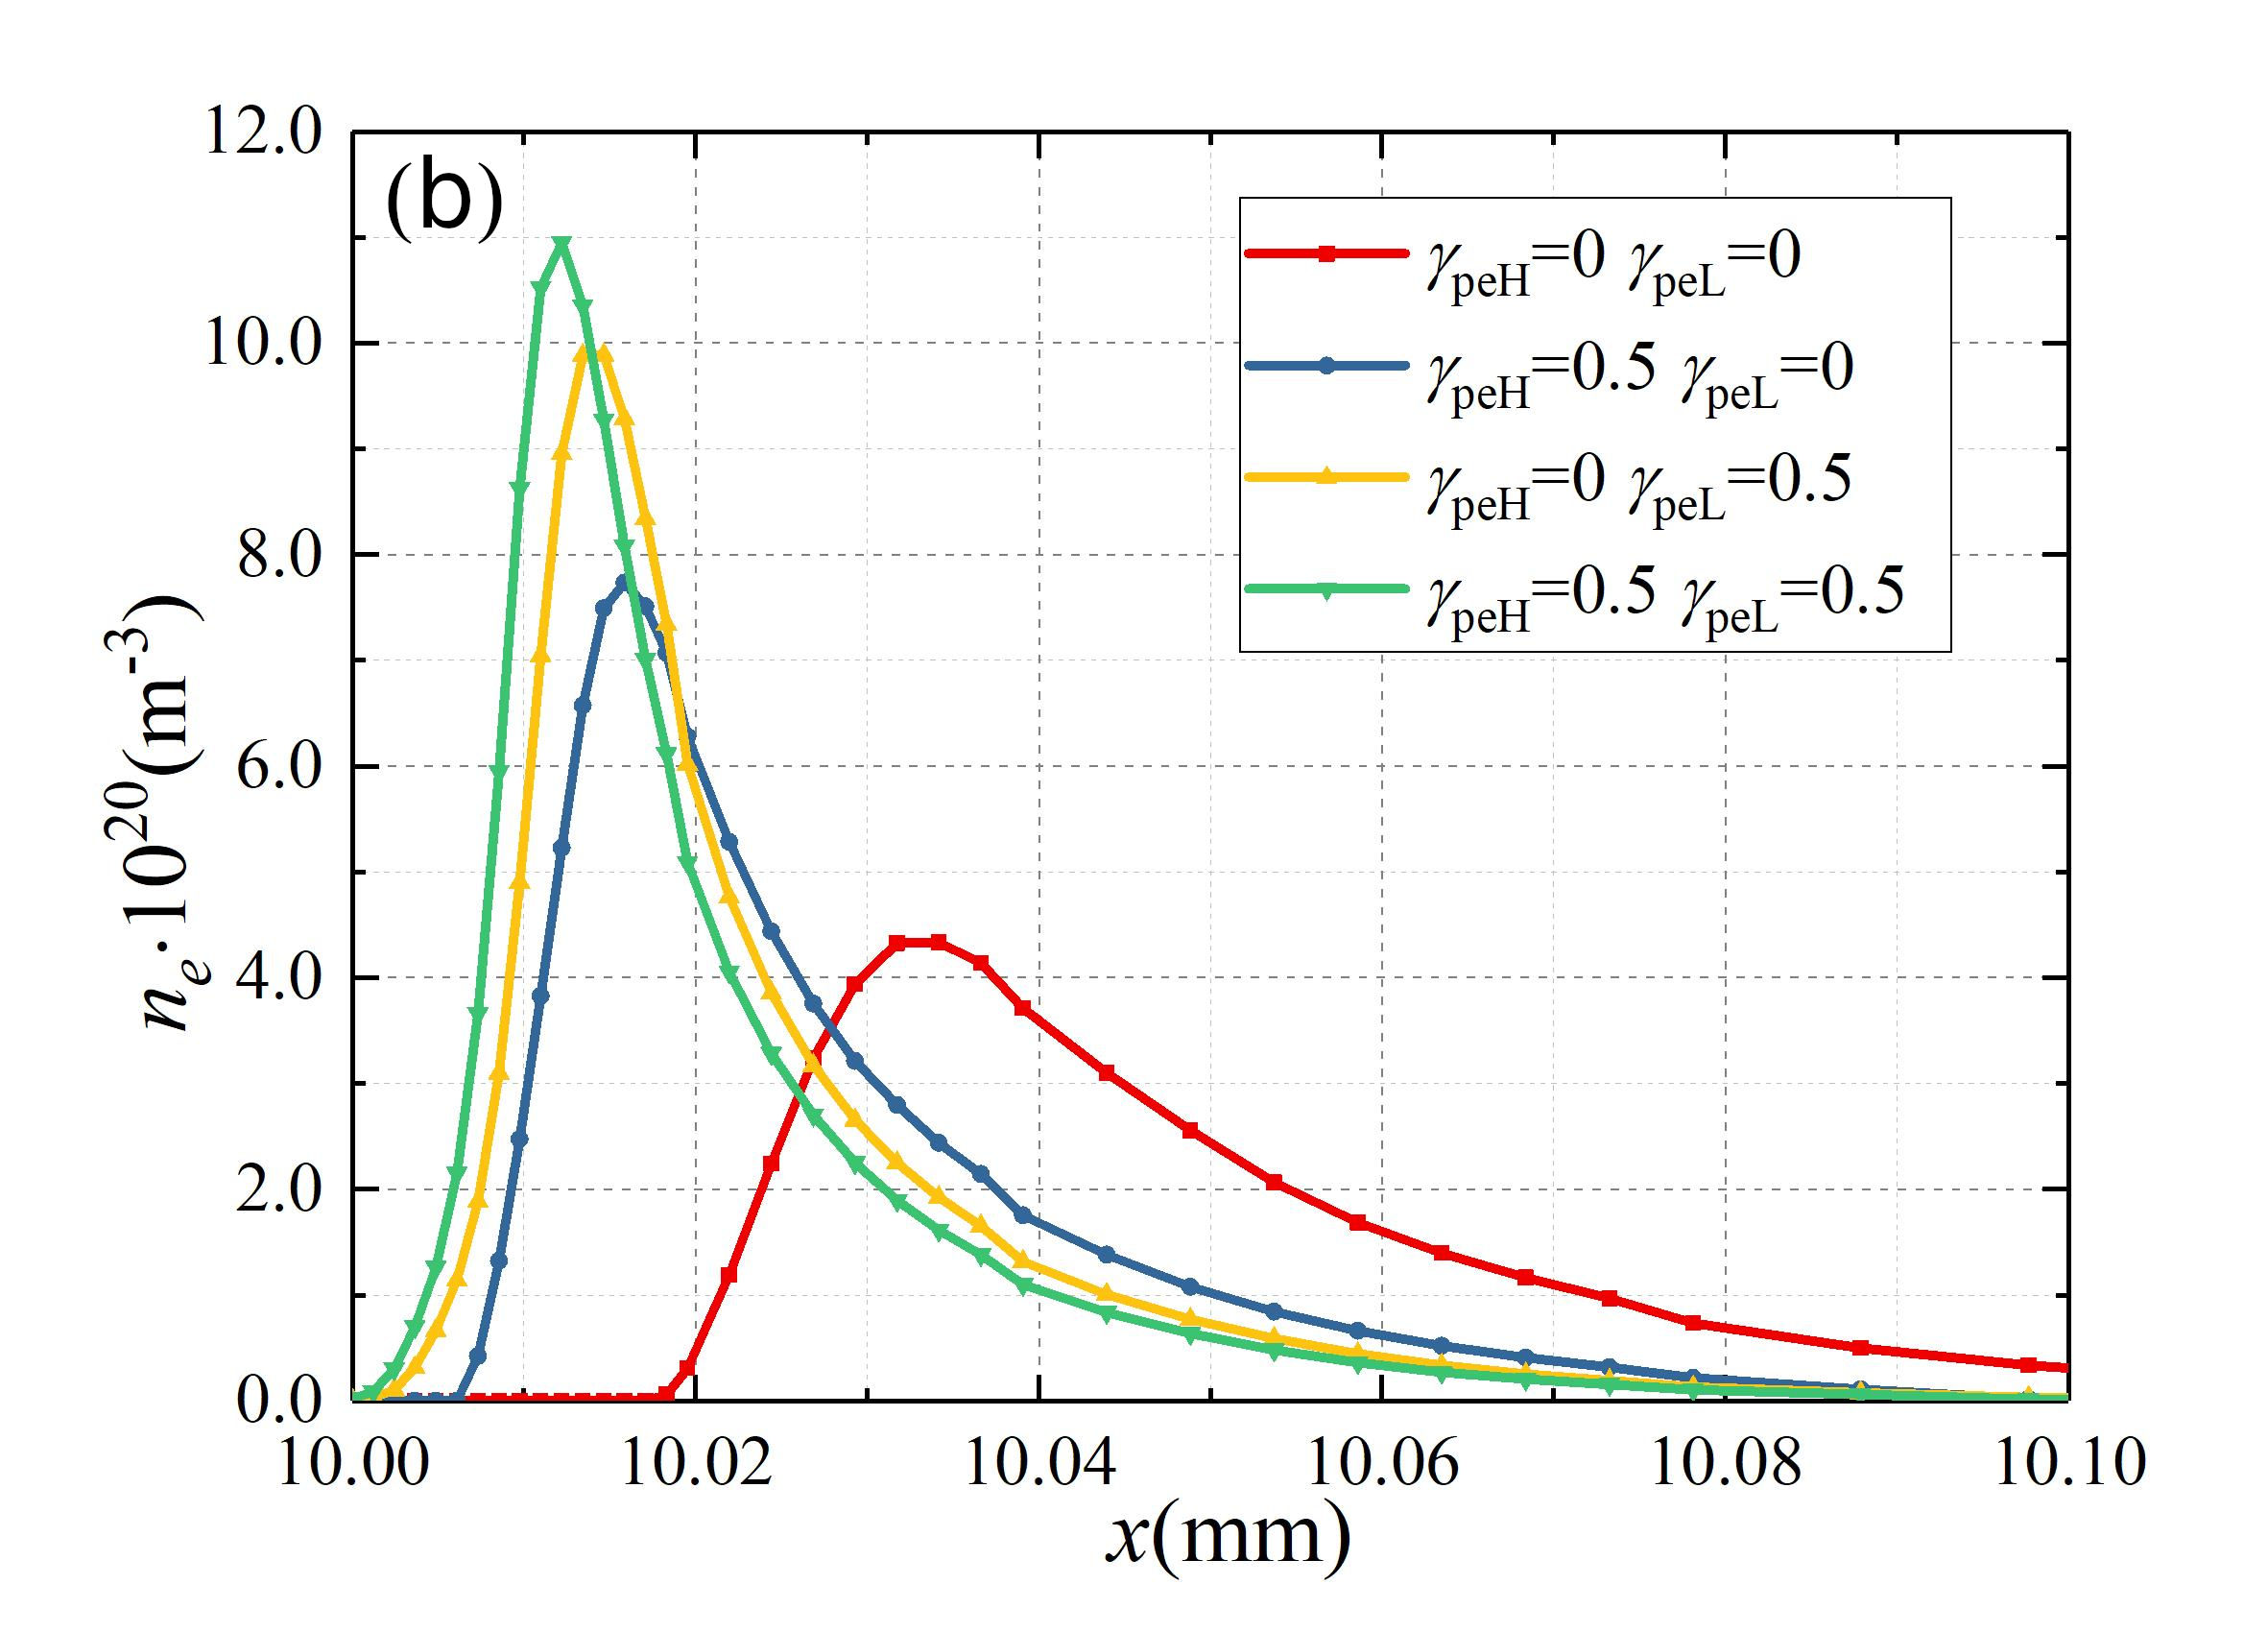
As shown in figure 15, photoemission by low-energy photons helps to start a discharge near a dielectric. At , the cases show the streamer already bending towards the dielectric with a sharp tip, due to photoemission. However, we remark that the inception time for these four cases is the same when the seeds are placed at away from the dielectric. The secondary electrons from the dielectric then need more time to reach the streamer, and the streamers have already started due to the photoionization they generate. We conclude that photoemission can be important for discharges close to dielectrics and for discharges in gases with less photoionization than air.
Figure 16a shows the electron density distribution for the above four cases at . The streamers with are longer than the other two, since they start earlier. Photoemission also causes them to attach to the dielectric more rapidly. Another difference is that the narrow gap between streamer and dielectric is smaller with more photoemission. This happens because photoemission provides seed electrons in the gap, which allows the streamer to get closer to the dielectric. To see this more clearly, the electron density distributions at (the dashed line in figure 16a) are shown for these four cases in figure 16b. Without photoemission, the electron density has a wider profile with a lower maximum, and it is located farther from the dielectric. When photoemission is included, the effect of the low-energy photons (i.e., ) is most important here.
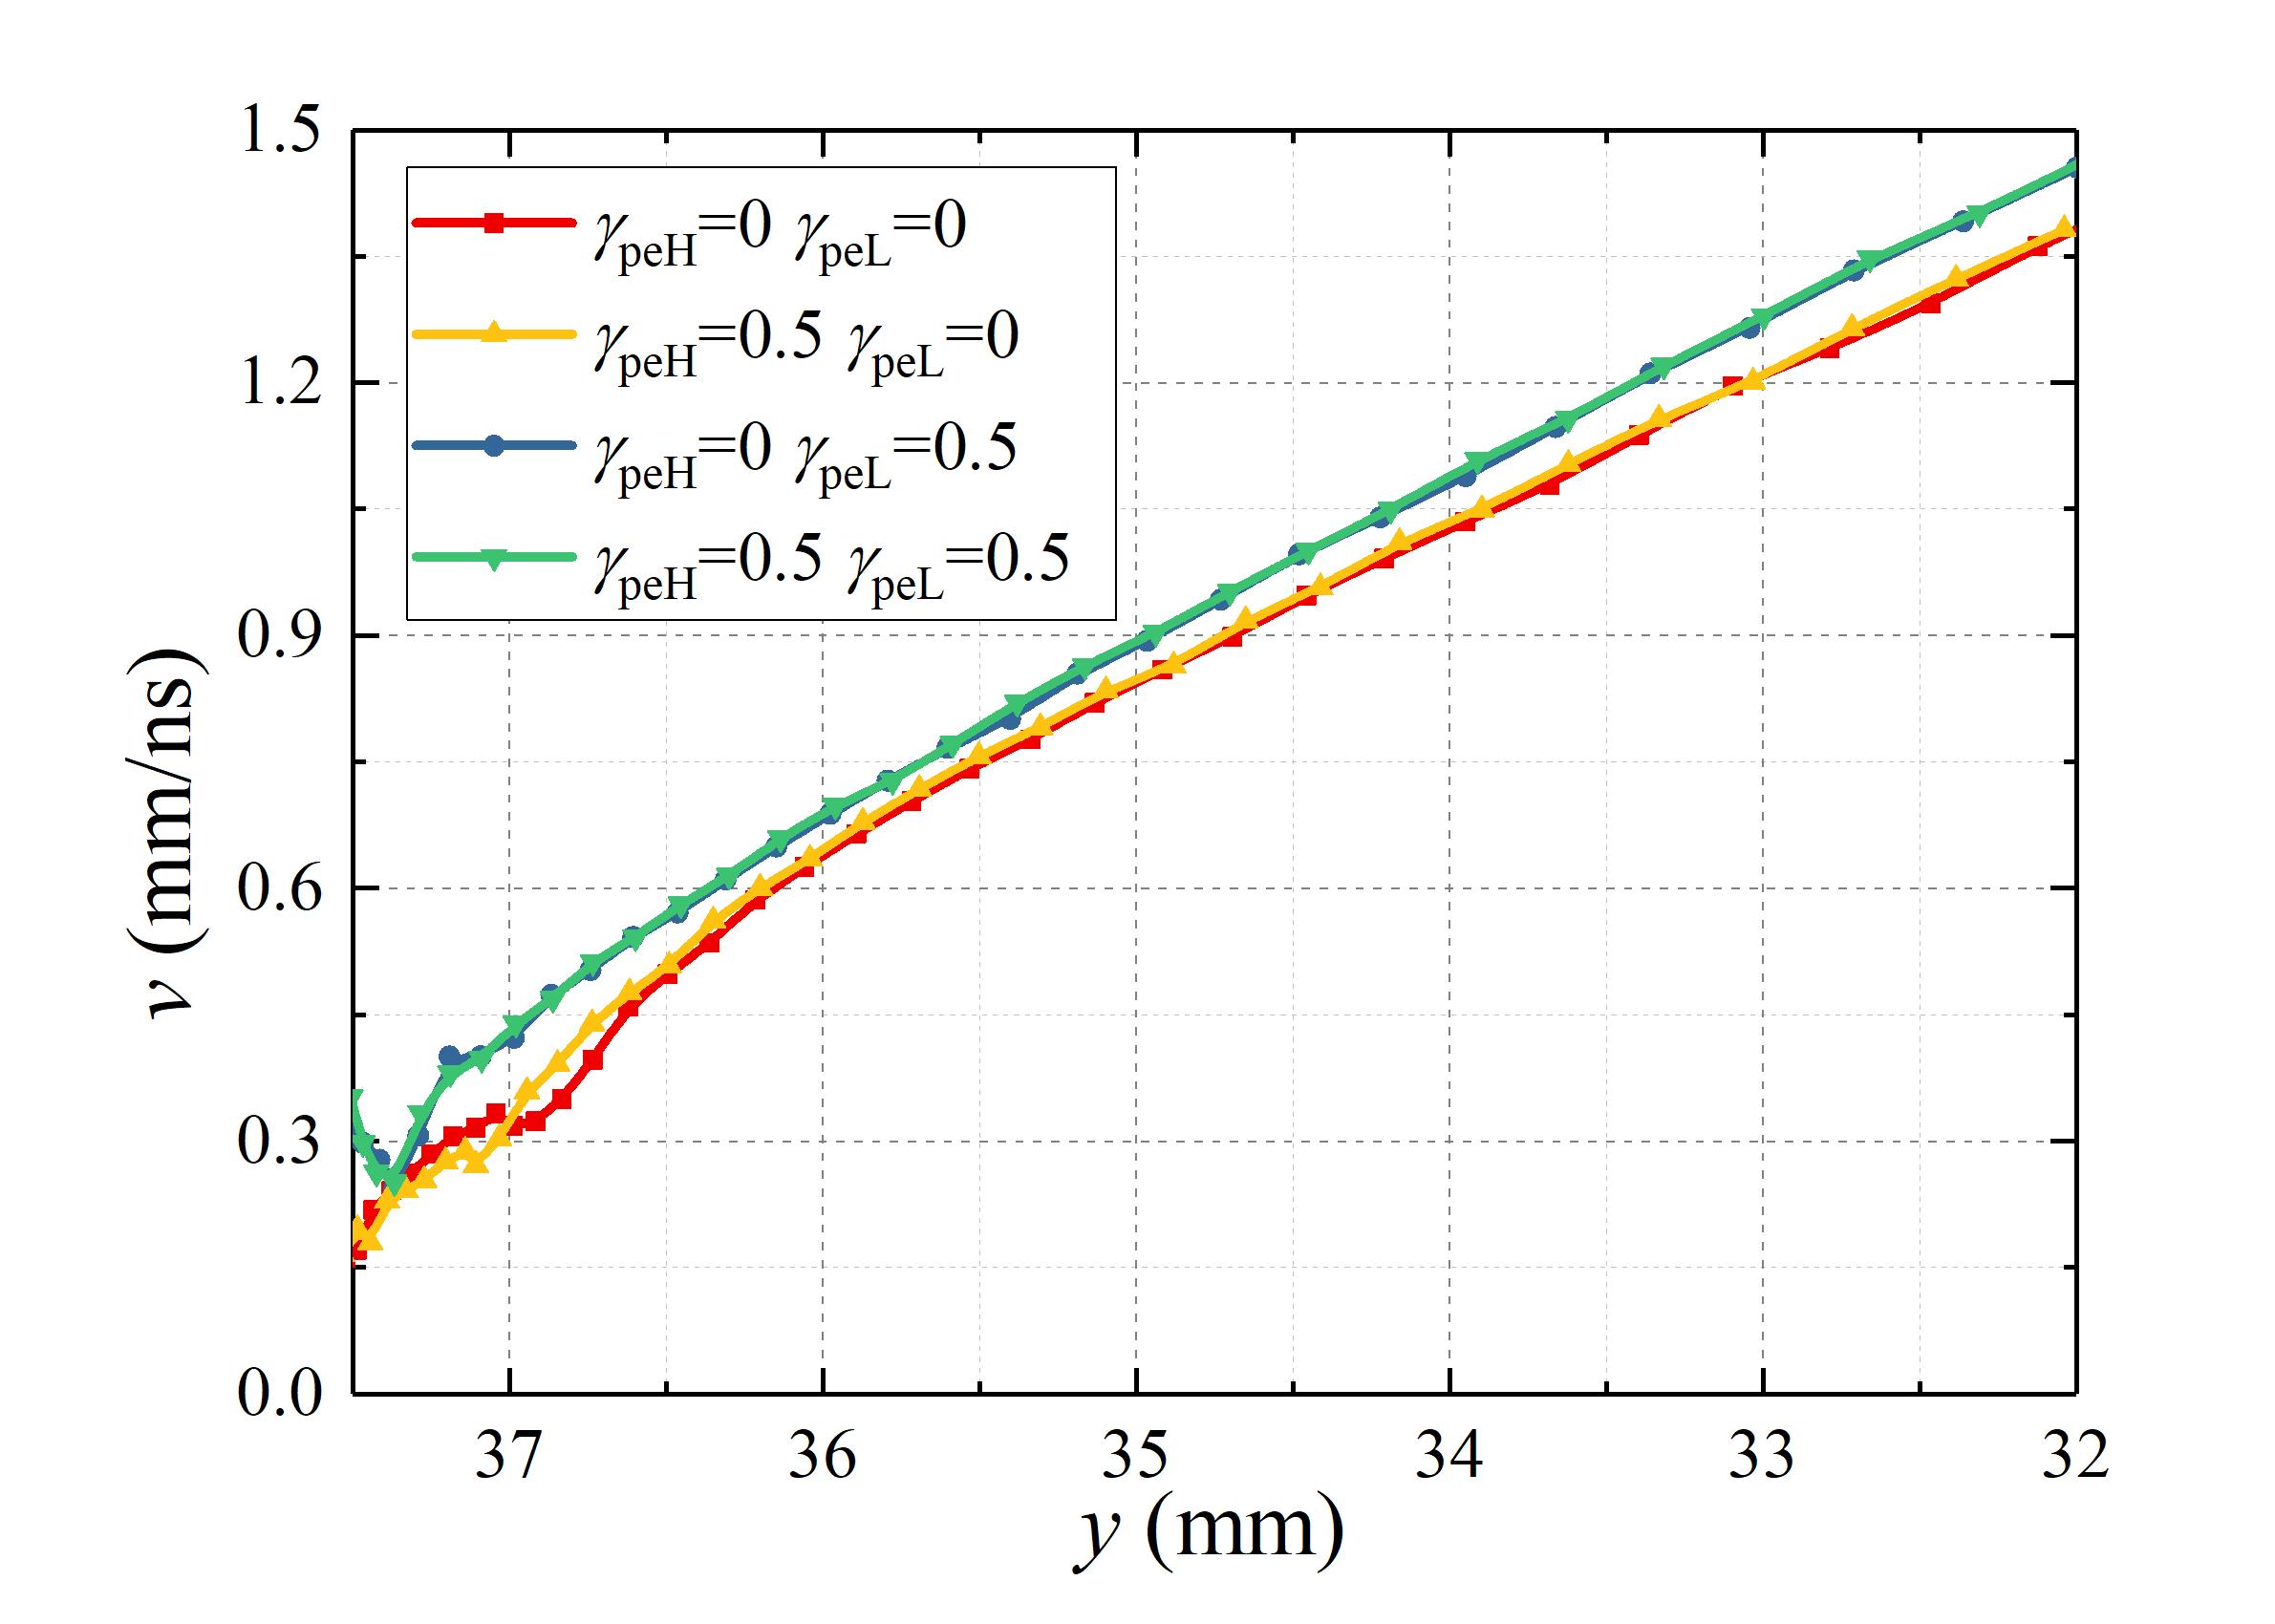
Figure 17 shows the streamer velocities versus their vertical position for all four cases. The photoemission coefficients have only a small effect on the velocity, which is a little higher with . We think this is somewhat surprising. A possible explanation is that photoemission mostly leads to growth towards the dielectric, whereas photoionization in the gas contributes most of the free electrons that cause growth parallel to the dielectric. Another effect in the simulations presented here is that high-energy photons contribute less to a streamer’s growth very close to a dielectric. There are two reasons for this. First, these photons are absorbed at shorter distances if they hit a dielectric. Second, their photoemission coefficient is here less than one (), whereas in the gas they always lead to photoionization.
3.5 Effect of positive ion mobility
The positive ion mobility can affect surface streamers in two ways. First, a higher ion mobility increases the amount of ion-induced secondary electron emission (ISEE). However, since ISEE was found to play a negligible role in section 3.4.1, its role is not further studied here, and we set the ISEE yield to zero (i.e., ).
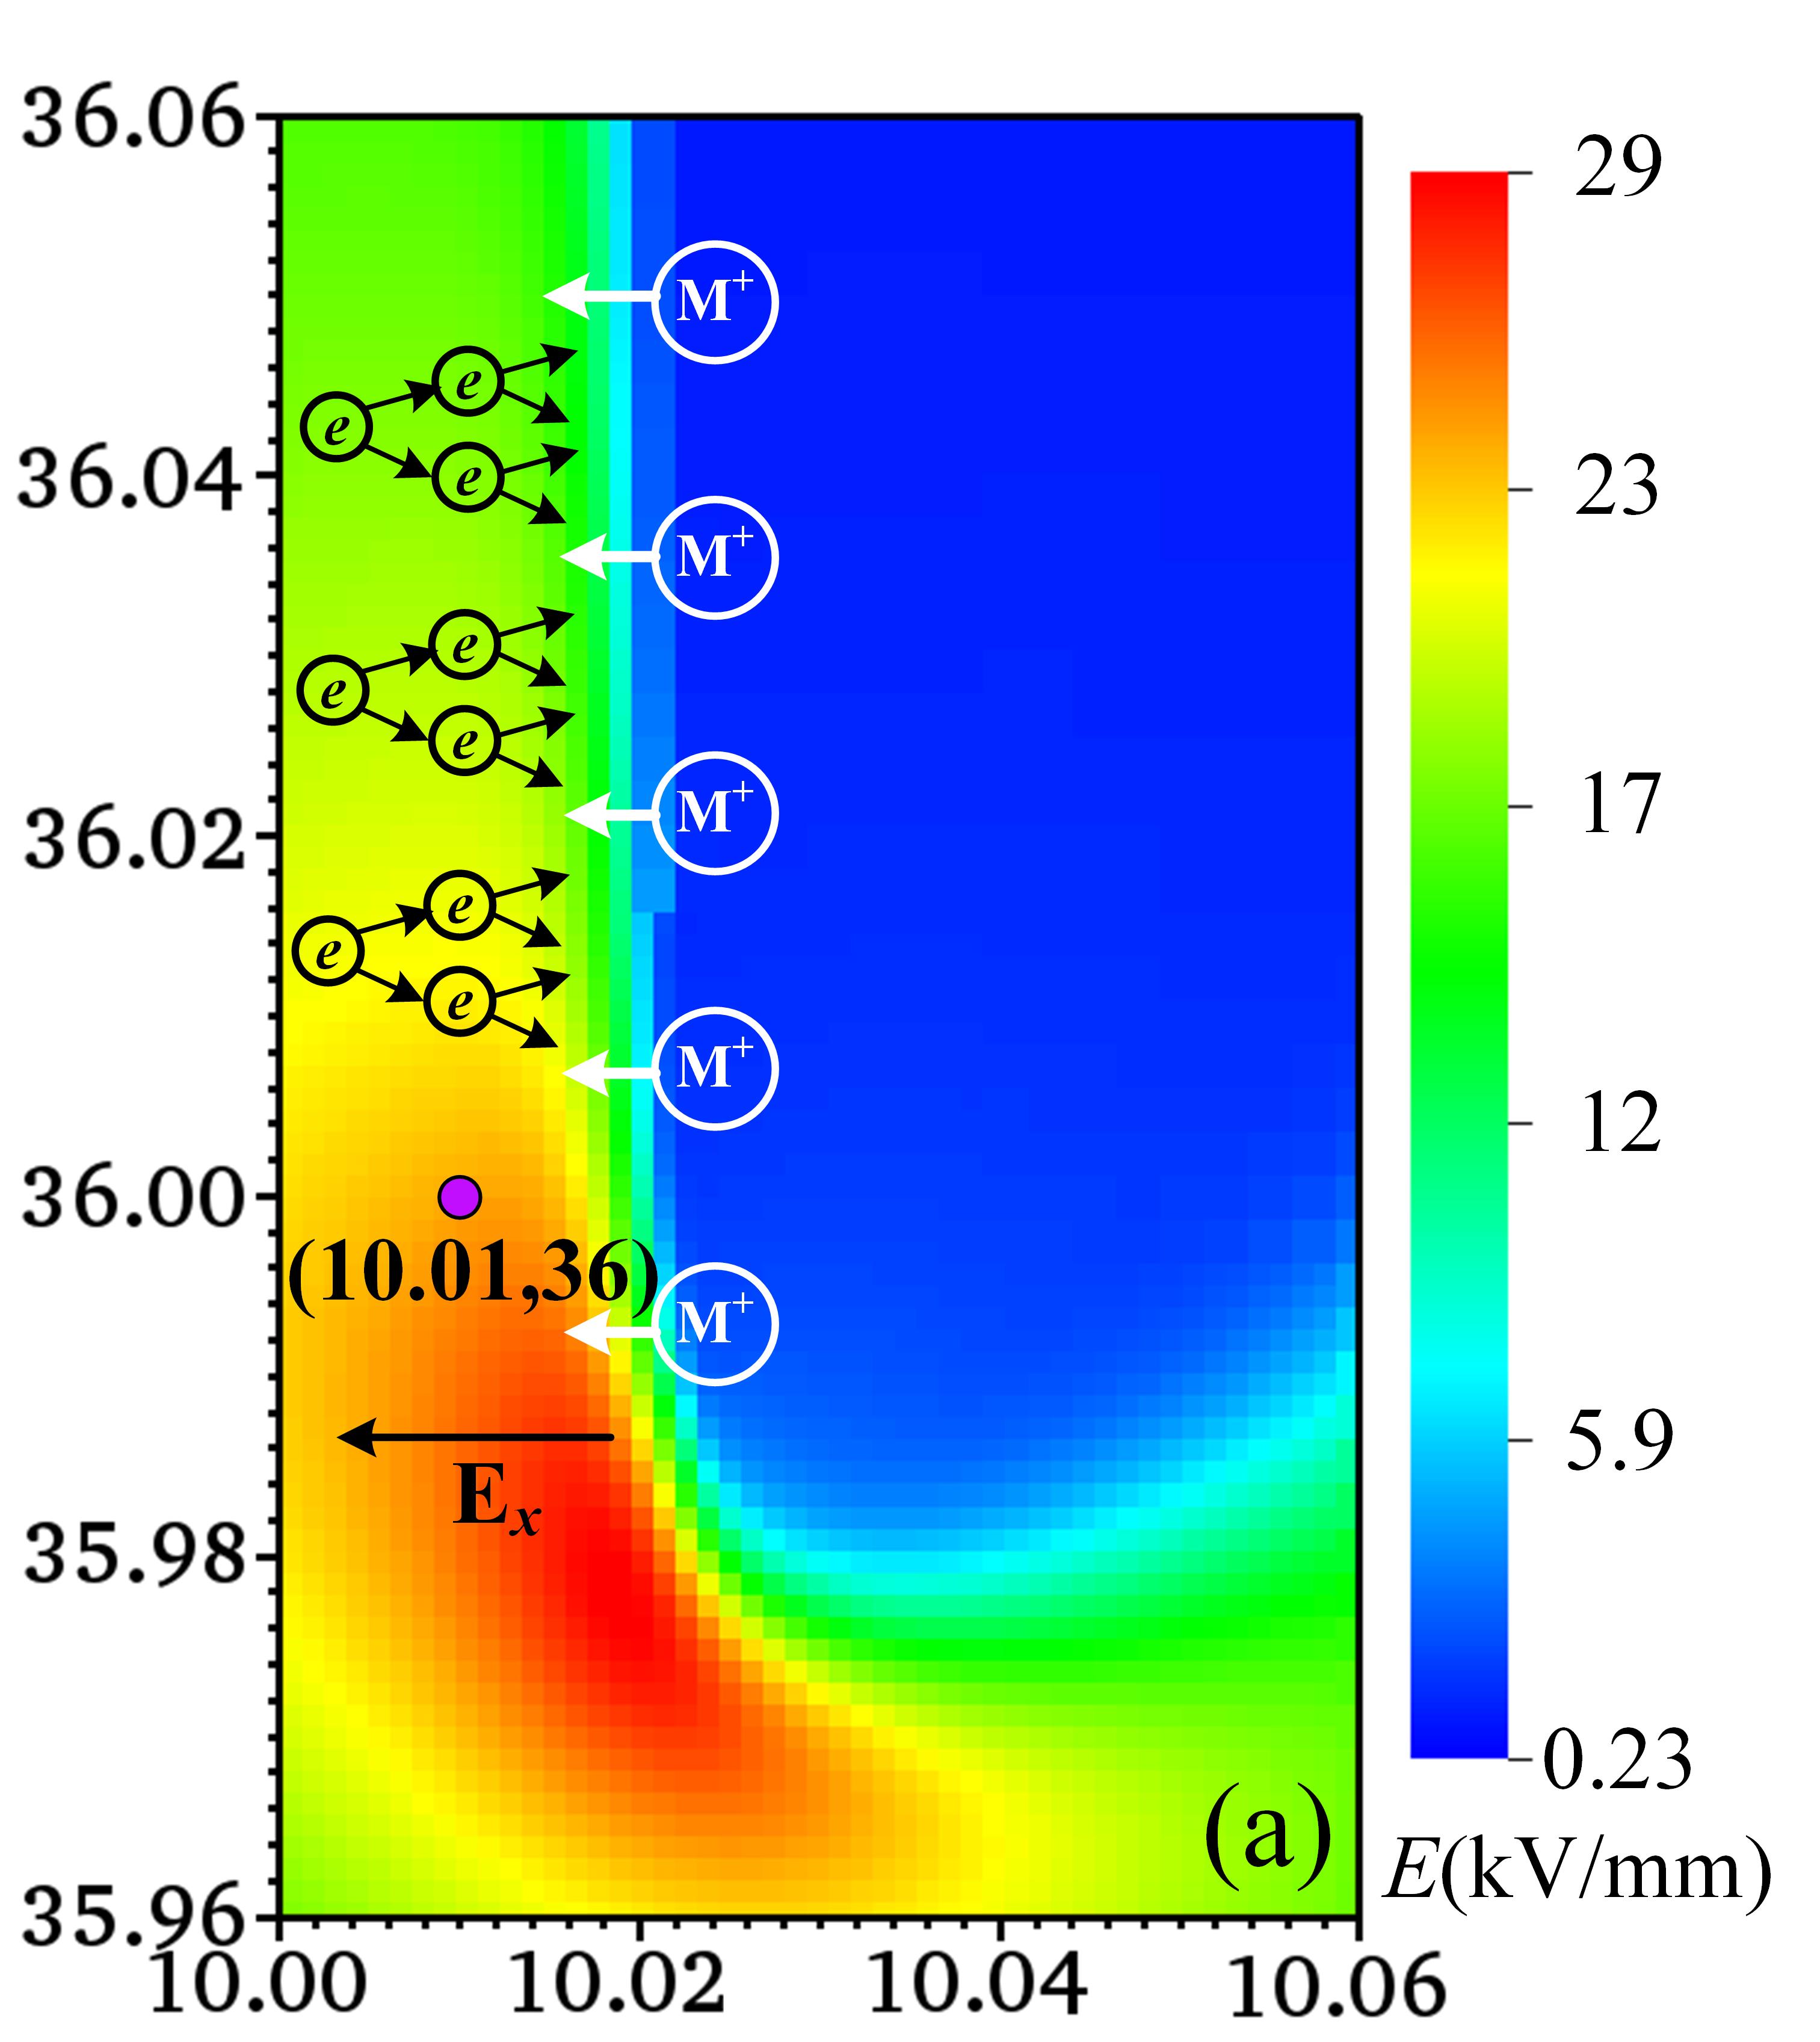
A second effect is that a higher ion mobility increases the conductivity of the discharge, in particular in regions where the ion density is high compared to the electron density. For positive surface streamer discharges, such a region is present in the streamer-dielectric gap. This gap typically contains a high electric field, especially close to the streamer head, see section 3.1.3. Electrons rapidly drift away from the surface, whereas positive ions move from the high-density discharge region towards the surface, as illustrated in figure 18a.
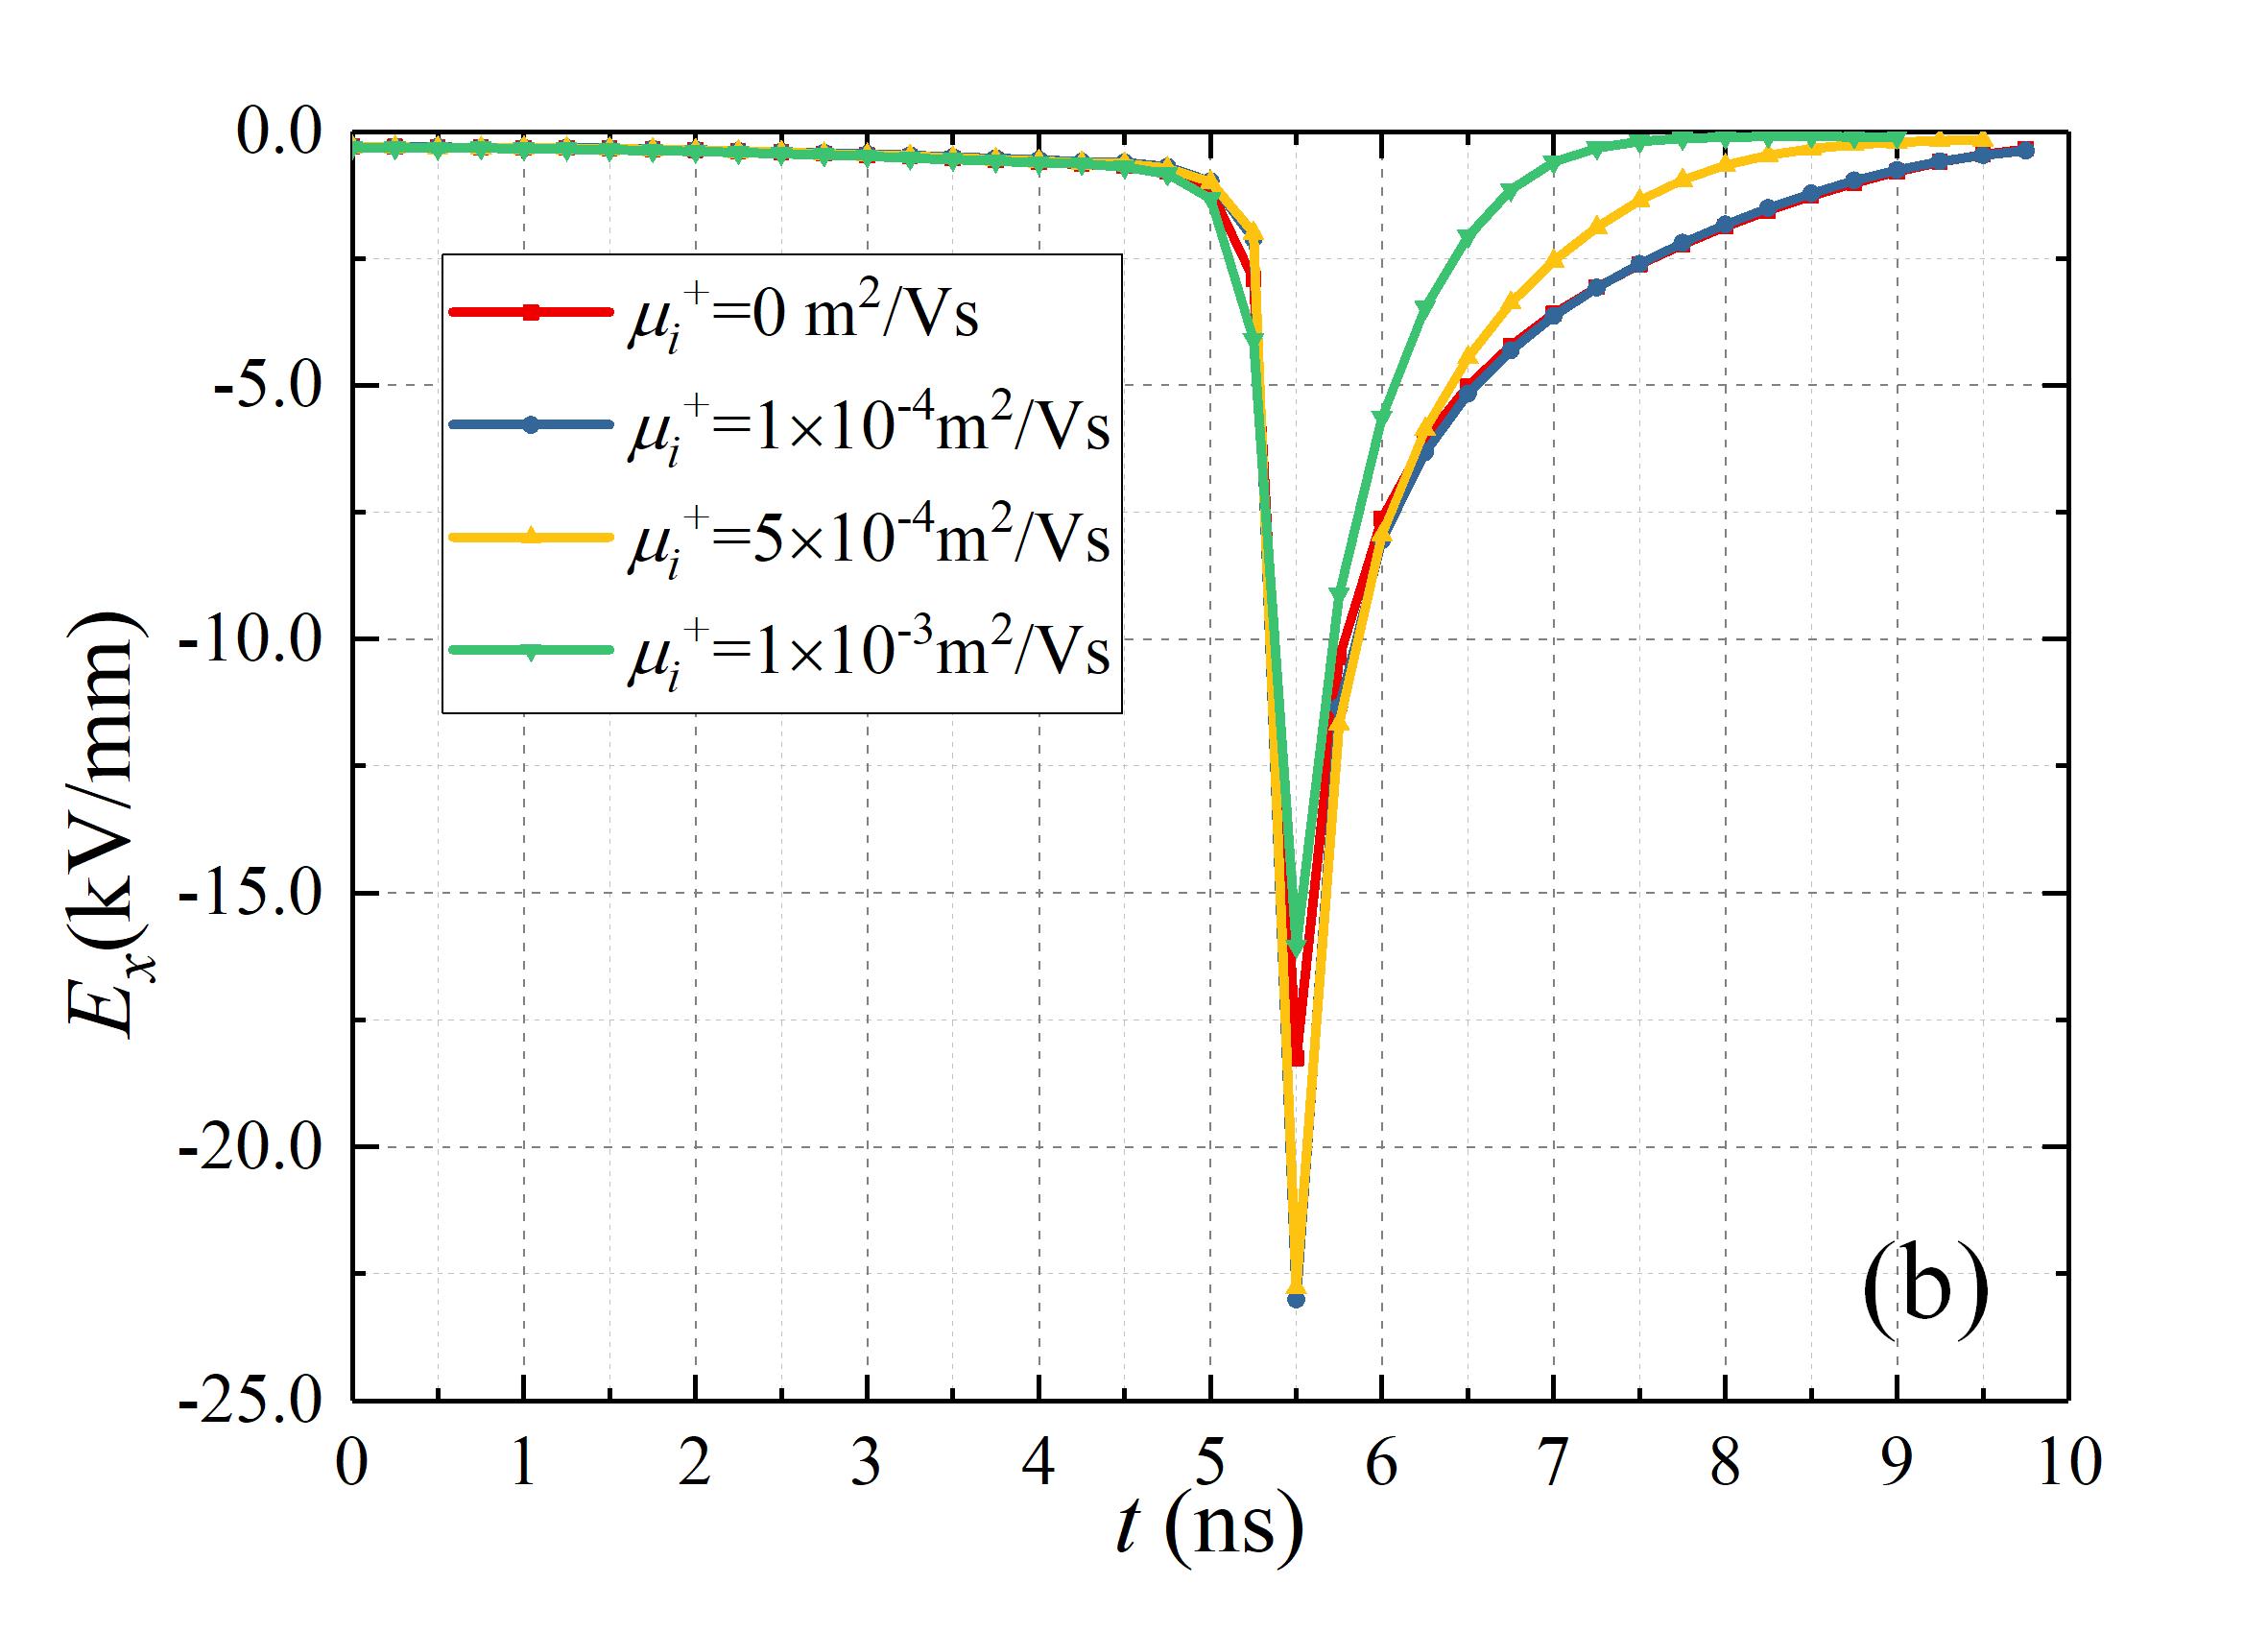
To investigate how the positive ion mobility () affects the decay of the high electric field in the streamer-dielectric gap, we have performed simulations with positive ion mobilities of 0, 110-4m2/Vs, 510-4m2/Vs and 110-3 m2/Vs, using a seed placed from the dielectric. For these simulations, we have recorded in the middle of the gap at the point indicated in figure 18a. The recorded fields are shown versus time in figure 18b. The maximum electric field occurs when the streamer heads pass by the observation point indicated in figure 18a. The decay of the peak in is faster for higher , which is most clearly visible for the and cases. Note that the field also decays when the ions are immobile. This mainly happens because the amount of net space charge is lower behind the streamer head, but electron avalanches in the gap (due to e.g. photoionization) also contribute.
4 Conclusions
In this paper, we have studied positive surface streamers with numerical simulations. A 2D fluid model for surface discharges based on the Afivo-streamer code [26] was developed. The model includes a Monte Carlo procedure for secondary electron emission (from both high and low energy photons) and support for dielectric surfaces. These new features are compatible with the adaptive mesh refinement and the parallel multigrid solver provided by the underlying Afivo framework [27].
We have used the new model to investigate the interaction of positive streamers and dielectrics. We considered a parallel-plate geometry, with a flat dielectric between the two electrodes. Positive streamer discharges started from an ionized seed that was placed near the dielectric and the positive electrode. The effect of several parameters was investigated: the applied voltage, the dielectric permittivity, secondary electron emission caused by ions and photons, and the mobility of positive ions. Our main findings are summarized below:
- 1.
-
2.
The attraction of positive streamers to the dielectric was found to be mostly electrostatic. In our geometry, this attraction was caused by the net charge in the streamer head, which polarized the dielectric, increasing the field between the streamer and the dielectric. A higher dielectric permittivity led to a more rapid attachment of the streamer to the dielectric.
-
3.
Compared to gas streamers, surface streamers had a smaller radius, a higher electric field, and a higher electron density. In our simulations, this gave surface streamers a higher propagation velocity than gas streamers.
-
4.
A higher applied voltage caused the positive surface discharges to start earlier, but they behaved qualitatively similar. A higher dielectric permittivity also accelerated the formation of surface streamers.
-
5.
Photoemission can accelerate streamer inception near dielectrics. However, photoemission hardly increases the velocity of surface streamers. A possible reasons is that photoemission mostly leads to growth towards the surface, whereas photoionization contributes more to the growth parallel to the surface.
-
6.
The positive ion mobility affects the decay of the high electric field in the streamer-dielectric gap.
Acknowledgment
This project was supported by the National Natural Science Foundation of China (51777164), the State Key Laboratory of Electrical Insulation and Power Equipment (EIPE18203) and the Fundamental Research Funds for the Central Universities of China (xtr042019009). JT was also supported by fellowship 12Q6117N from Research Foundation – Flanders (FWO).
Availability of model and data
The source code and input files for the model used in this paper are available at https://gitlab.com/MD-CWI-NL/afivo-streamer (git commit 08f1c828).
References
References
- [1] Cookson A H 1970 Proceedings of the Institution of Electrical Engineers-London 117 269–+
- [2] Cookson A H 1981 Iee Proceedings-a-Science Measurement and Technology 128 303–312 ISSN 0143-702X
- [3] Sudarshan T S and Dougal R A 1986 IEEE Transactions on Electrical Insulation EI-21 727–746 ISSN 0018-9367
- [4] Sobota A, van Veldhuizen E M and Stoffels W W 2008 IEEE Transactions on Plasma Science 36 912–913 ISSN 0093-3813
- [5] Trienekens D J M, Nijdam S and Ebert U 2014 IEEE Transactions on Plasma Science 42 2400–2401 ISSN 0093-3813
- [6] Sobota A, Lebouvier A, Kramer N J, van Veldhuizen E M, Stoffels W W, Manders F and Haverlag M 2009 Journal of Physics D: Applied Physics 42 015211 ISSN 0022-3727, 1361-6463
- [7] Dubinova A, Trienekens D, Ebert U, Nijdam S and Christen T 2016 Plasma Sources Science and Technology 25 055021 ISSN 1361-6595
- [8] Allen N L and Mikropoulos P N 1999 IEEE Transactions on Dielectrics and Electrical Insulation 6 357–362 ISSN 1070-9878
- [9] Meng X, Mei H, Chen C, Wang L, Guan Z and Zhou J 2015 IEEE Transactions on Dielectrics and Electrical Insulation 22 1193–1203 ISSN 1070-9878
- [10] Jorgenson R E, Warne L K, Neuber A A, Krile J, Dickens J and Krompholz H 2003 Effect of Dielectric Photoemission on Surface Breakdown: An LDRD Report Tech. Rep. SAND2003-1731, 811483
- [11] Jánský J, Tholin F, Bonaventura Z and Bourdon A 2010 Journal of Physics D: Applied Physics 43 395201 ISSN 0022-3727, 1361-6463
- [12] Babaeva N Y, Tereshonok D V and Naidis G V 2016 Plasma Sources Science and Technology 25 044008 ISSN 1361-6595
- [13] Georghiou G E, Papadakis A P, Morrow R and Metaxas A C 2005 Journal of Physics D: Applied Physics 38 R303–R328 ISSN 0022-3727, 1361-6463
- [14] Sun G Y, Guo B H, Song B P, Su G Q, Mu H B and Zhang G J 2018 Physics of Plasmas 25 063502 ISSN 1070-664X, 1089-7674
- [15] Sima W, Liu C, Yang M, Shao Q, Xu H and Liu S 2016 Physics of Plasmas 23 063508 ISSN 1070-664X, 1089-7674
- [16] Zhang G, Su G, Song B and Mu H 2018 IEEE Transactions on Dielectrics and Electrical Insulation 25 2321–2339 ISSN 1070-9878
- [17] Sun A, Becker M M and Loffhagen D 2018 Plasma Sources Science and Technology 27 054002 ISSN 1361-6595
- [18] Celestin S, Bonaventura Z, Guaitella O, Rousseau A and Bourdon A 2009 The European Physical Journal Applied Physics 47 22810 ISSN 1286-0042, 1286-0050
- [19] Meyer H K, Mauseth F, Marskar R, Pedersen A and Blaszczyk A 2019 IEEE Transactions on Dielectrics and Electrical Insulation 26 1163–1171 ISSN 1558-4135 URL http://dx.doi.org/10.1109/TDEI.2019.007929
- [20] Babaeva N Y 2015 Plasma Sources Science and Technology 24 034012 ISSN 1361-6595 URL http://dx.doi.org/10.1088/0963-0252/24/3/034012
- [21] Babaeva N Y and Kushner M J 2013 Journal of Physics D: Applied Physics 46 025401 ISSN 0022-3727, 1361-6463
- [22] Tian W and Kushner M J 2014 Journal of Physics D: Applied Physics 47 165201 ISSN 1361-6463 URL http://dx.doi.org/10.1088/0022-3727/47/16/165201
- [23] Hua W and Fukagata K 2019 Physics of Plasmas 26 013514 ISSN 1070-664X, 1089-7674
- [24] Brandenburg R 2017 Plasma Sources Science and Technology 26 053001 ISSN 0963-0252
- [25] Sima W, Liu C, Yang M, Xu H and Shao Q 2017 IEEE Trans. Plasma Sci. 45 906–912 ISSN 0093-3813 wOS:000403486500001
- [26] Teunissen J and Ebert U 2017 Journal of Physics D: Applied Physics 50 474001 ISSN 0022-3727, 1361-6463
- [27] Teunissen J and Ebert U 2018 Computer Physics Communications 233 156–166 ISSN 00104655
- [28] Bagheri B, Teunissen J, Ebert U, Becker M M, Chen S, Ducasse O, Eichwald O, Loffhagen D, Luque A, Mihailova D, Plewa J M, van Dijk J and Yousfi M 2018 Plasma Sources Science and Technology 27 095002 ISSN 1361-6595
- [29] Meng X, Mei H, Wang L, Guan Z and Zhou J 2017 IEEE Transactions on Dielectrics and Electrical Insulation 24 391–400 ISSN 1070-9878
- [30] Luque A and Ebert U 2012 Journal of Computational Physics 231 904–918 ISSN 00219991
- [31] Rabie M and Franck C 2016 Computer Physics Communications 203 268–277 ISSN 00104655
- [32] Phelps A V and Pitchford L C 1985 Phys. Rev. A 31 2932–2949
- [33] Hagelaar G J M, de Hoog F J and Kroesen G M W 2000 Physical Review E 62 1452–1454 ISSN 1095-3787 URL http://dx.doi.org/10.1103/PhysRevE.62.1452
- [34] Pancheshnyi S 2005 Plasma Sources Science and Technology 14 645–653 ISSN 0963-0252, 1361-6595
- [35] Pancheshnyi S 2014 Plasma Sources Science and Technology 24 015023 ISSN 0963-0252, 1361-6595
- [36] Bagheri B and Teunissen J 2019 Plasma Sources Science and Technology 28 045013 ISSN 1361-6595
- [37] Teunissen J 2015 3D Simulations and Analysis of Pulsed Discharges Ph.D. thesis Department of Applied Physics proefschrift URL https://research.tue.nl/en/publications/3d-simulations-and-analysis-of-pulsed-discharges
- [38] Zheleznyak M, Mnatsakanyan A and Sizykh S 1982 High Temp. 20 357–362 ISSN 0018-151X wOS:A1982PX89000004
- [39] Sun A, Teunissen J and Ebert U 2014 Journal of Physics D: Applied Physics 47 445205 ISSN 0022-3727, 1361-6463
- [40] Nijdam S, Takahashi E, Teunissen J and Ebert U 2014 New Journal of Physics 16 103038 ISSN 1367-2630 URL http://dx.doi.org/10.1088/1367-2630/16/10/103038
- [41] Akyuz M, Gao L, Cooray V, Gustavsson T G, Gubanski S M and Larsson A 2001 IEEE Transactions on Dielectrics and Electrical Insulation 8 902–910 ISSN 1070-9878
- [42] Briels T M P, Kos J, Winands G J J, van Veldhuizen E M and Ebert U 2008 J. Phys. D: Appl. Phys. 41 234004 ISSN 1361-6463
- [43] Babaeva N Y and Kushner M J 2011 Plasma Sources Science and Technology 20 035017 ISSN 0963-0252, 1361-6595
- [44] Stepanyan S A, Soloviev V R and Starikovskaia S M 2014 J. Phys. D: Appl. Phys. 47 485201 ISSN 0022-3727
- [45] Soloviev V and Krivtsov V 2017 Journal of Physics: Conference Series 927 012059 ISSN 1742-6588, 1742-6596
- [46] h Tan B, l Allen N and Rodrigo H 2007 IEEE Transactions on Dielectrics and Electrical Insulation 14 111–118 ISSN 1070-9878
- [47] Campanell M D and Umansky M V 2016 Physical Review Letters 116 ISSN 0031-9007, 1079-7114
- [48] Motoyama Y and Sato F 2006 IEEE Transactions on Plasma Science 34 336–342 ISSN 0093-3813
- [49] Motoyama Y, Hirano Y, Ishii K, Murakami Y and Sato F 2004 Journal of Applied Physics 95 8419–8424 ISSN 0021-8979, 1089-7550
- [50] Tschiersch R, Nemschokmichal S, Bogaczyk M and Meichsner J 2017 Journal of Physics D: Applied Physics 50 105207 ISSN 1361-6463 URL http://dx.doi.org/10.1088/1361-6463/aa5605
- [51] Fujihira M and Inokuchi H 1972 Chemical Physics Letters 17 554–556 ISSN 00092614
- [52] Buzulutskov A, Breskin A and Chechik R 1997 Journal of Applied Physics 81 466–479 ISSN 0021-8979, 1089-7550
- [53] Dubinova A A 2016 Modeling of streamer discharges near dielectrics. Ph.D. thesis TU Eindhoven Eindhoven oCLC: 956923350