Reply to “Absence of Evidence for the Ultimate Regime in Two-Dimensional Rayleigh-Bénard Convection”
In their Comment Doering et al. (2019) Doering et al. question our numerically found Zhu et al. (2018) onset of a transition to the ultimate regime of 2D Rayleigh-Bénard convection. We disagree with their reasoning.
To irrefutably settle the issue, we have extended our numerical simulations of ref. Zhu et al. (2018) to even larger , namely now up to , sticking to the same strict numerical resolution criteria of both boundary layer (BL) and bulk. The simulation at the highest was performed with a grid resolution of with 28 points in the boundary layer. The evidence for the transition to the ultimate regime remains overwhelming:
-
1.
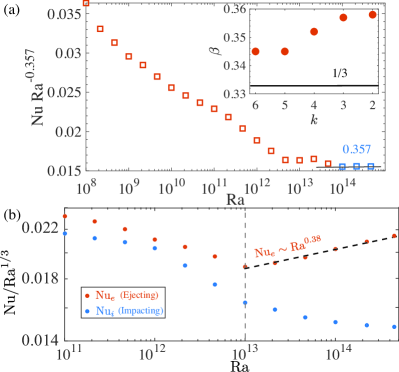
On the global heat transfer: , compensated with , is shown in figure 1a. An objective least squares fit of an effective power law to the last 6 data points gives a scaling exponent ; the last 5 data points give , last four data points give , last 3 data points give , and last 2 points give ; i.e. no matter how the data is interpreted, the scaling exponent is always larger than 1/3 and monotonously increasing with .
-
2.
The key part of Ref. Zhu et al. (2018) deals with local properties of the flow, see figures 2-4 of that paper. For the local heat flux in the plume ejecting regime, beyond the effective scaling exponents is close to , see figure 1. In contrast, it remains in the plume impacting regime, which therefore with increasing looses more and more relevance for the overall heat transfer.
-
3.
Beyond , the horizontal velocity profiles in the BLs become logarithmic (see figure 2 of the Ref. Zhu et al. (2018)), signaling a turbulent BL, which is characteristic for the ultimate regime (as a presumption to derive the ultimate regime scaling in refs. Kraichnan (1962); Grossmann and Lohse (2011)), rather than one of laminar type as in the classical regime.
-
4.
Finally, the transition to ultimate RB turbulence in the numerical data of Zhu et al. (2018) has also been confirmed through an extended self-similarity (ESS) analysis of the temperature structure functions, see ref. Krug et al. (2018): In that paper we find no ESS scaling before the transition. However, beyond the transition and for large enough wall distance , we find clear ESS behaviour, as expected for a scalar in a turbulent boundary layer. Therefore also that analysis provides strong evidence that the observed transition in the global Nusselt number around indeed is the transition from a laminar type BL to a turbulent type BL.
References
- Doering et al. (2019) C. R. Doering, S. Toppaladoddi, and J. S. Wettlaufer, Phys. Rev. Lett. 123, 259401 (2019).
- Zhu et al. (2018) X. Zhu, V. Mathai, R. J. A. M. Stevens, R. Verzicco, and D. Lohse, Phys. Rev. Lett. 120, 144503 (2018).
- Kraichnan (1962) R. H. Kraichnan, Phys. Fluids 5, 1374 (1962).
- Grossmann and Lohse (2011) S. Grossmann and D. Lohse, Phys. Fluids 23, 045108 (2011).
- Krug et al. (2018) D. Krug, X. Zhu, D. Chung, I. Marusic, R. Verzicco, and D. Lohse, J. Fluid Mech. 851, R3 (2018).