Three Jahn-Teller states of matter in the spin-crossover system Mn(taa)
Abstract
Three high-spin phases recently discovered in the spin-crossover system Mn(taa) are identified through analysis by a combination of first-principles calculations and Monte Carlo simulation as a low-temperature Jahn-Teller ordered (solid) phase, an intermediate-temperature dynamically correlated (liquid) phase, and an uncorrelated (gas) phase. In particular, the Jahn-Teller liquid phase arises from competition between mixing with low-spin impurities, which drive the disorder, and inter-molecular strain interactions. The latter are a key factor in both the spin-crossover phase transition and the magnetoelectric coupling. Jahn-Teller liquids may exist in other spin-crossover materials and materials that have multiple equivalent Jahn-Teller axes.
Jahn Teller (JT) distortions play important roles in many spin-crossovers (SCO) (also known as spin state transitions) in molecule-based magnets Decurtins et al. (1984); Sim and Sinn (1981); Halcrow (2011); Matsumoto et al. (2014); Fitzpatrick et al. (2015) In SCO, electrons in partially filled shells transition between orbitals to change the overall spin state. Long-range ordering of the JT distortions in the S = 2 HS state of crystalline (Mn(taa)) has been shown Chikara et al. (2019) to lead to magnetoelectric coupling, which is the interplay between magnetism and electric polarization or dielectric properties. Magnetoelectric coupling offers potential for applications in low-power magnetic sensors, frequency devices, data storage and other applications for moving beyond Moore’s law.Béa et al. (2008); Fusil et al. (2014); Fiebig et al. (2016) Molecule-based magnetic materials have recently stimulated much interest because of the global initiative in quantum information science and spintronics, Leuenberger and Loss (2001); Bogani and Wernsdorfer (2008) and their low Young’s modulus offers great potential for lattice-mediated magnetoelectric coupling.
In conventional solids such as inorganic perovskites, cooperative JT effects are linked to structural and metal-insulator phase transitions Gehring and Gehring (1975); Kaplan (1995), and are crucial in explaining many physical properties of materials such as colossal magnetoresistance Lee et al. (2013). In the molecular solid Mn(taa), JT distortions are also expected to show long-range correlation due to the inter-molecular strain field. In the high spin (HS) state, three nearly-degenerate JT distortions along axes apart reduce the Mn site symmetry from to , leading to electric dipoles not cancelled by symmetry. In Ref. Chikara et al. (2019), a modified four-state Ising-Potts modelNakano et al. (2003); Stratt and Adachi (1987) based on a mean-field approachBoukheddaden et al. (2000a, b) was used to explain the magnetoelectric behavior in terms of ordering of the three JT distortions and their associated electric dipoles. However, it did not offer a microscopic model for the inter-molecular interactions, nor an exact long-range ordering pattern of JT distortions. Rather, it described the emergence of three HS phases in terms of the statistical distributions of three degenerate JT distortion axes.
In this Letter, we use a theoretical approach that combines first-principles calculations and Monte-Carlo simulations to study the microscopic process underlying the phase transition and magnetoelectric coupling of Mn(taa), explicitly including the inter-molecular correlation of the JT distortion. Through analysis of the correlation function and polarization fluctuation, we show that the three HS phases discovered experimentally correspond to a solid-like phase, where the JT distortions are ordered and uniform, a liquid-like phase, where the JT distortions are disordered with long range correlation, and a gas-like phase, where the JT distortions are uncorrelated. In particular, the JT liquid phase is driven by a competition between disorder, which is caused in part by dynamic mixing with low spin (LS) impurities, and inter-molecular correlation, which is caused by elastic strain. Such a competition also leads to a nonzero macroscopic electric polarization, providing a mechanism for magnetoelectric coupling.
We study a microscopic model on a lattice in which each site represents one Mn(taa) molecule. The cation as the center atom has two possible spin-states: LS with and HS with . The state of each site is labeled by , where denotes the LS () and HS () state, and is the magnetic quantum number. for LS and for HS represent the elongation axis of the JT distortion, and is a set of vibration numbers of the on-site phonon mode of Mn(taa). The indices denote the spin-JT states, with a total of eighteen states: three LS and fifteen HS ( and three JT elongation axes), for each site. Therefore, the total Hamiltonian is written in three parts: the on-site term , the interaction term , and the electromagnetic term ,
| (1) |
The on-site term is,
| (2) |
where is defined as the on-site energy difference between the LS and HS states, or the LS-HS gap; is zero for and positive for . The next term is the on-site phonon energy.
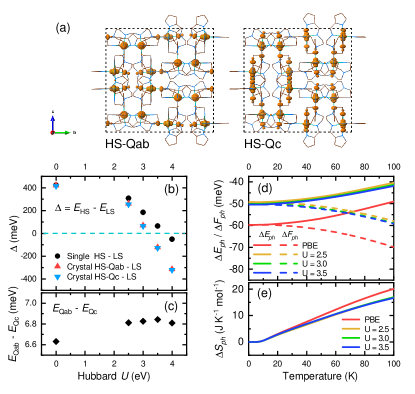
The LS-HS gap is derived directly from the total energy calculations for LS and HS from first principles. The total energies are obtained for both the isolated molecules and the bulk structures with LS and HS state using GGA-PBE and GGA+, varying from 2.5 eV to 4 eV. Two HS configurations in the bulk structure, one labeled by HS-Qab with -plane JT distortion and the other labeled by HS-Qc with JT distortion along the -axis, are calculated. Fig. 1(a) shows the distribution of centered molecular orbitals of Mn(3d), which are the highest occupied orbitals due to the JT distortion. The total energy difference between the LS and HS states per Mn atom as a function of Hubbard depends strongly on , as shown in Fig. 1(b), because the LS state, with an orbital occupied by two electrons, has an additional onsite energy . In addition, the DFT ground state energy is higher for the LS state Chen et al. (2015). For the purpose of this work, it is necessary to tune to a value that can reproduce a reasonable LS-HS gap, at about Cirera et al. (2018). We find that eV. As a reference, we obtain from a constrained Random Phase Approximation (cRPA)Aryasetiawan et al. (2004, 2006) calculation using the FP-LAPW methodKozhevnikov et al. (2010); Zhang et al. (2019) an estimated for Mn(3) electrons in Mn(taa) sup .
The frequencies of the 159 phonon modes, including three translation modes and three rotation modes with zero frequency, are calculated for the isolated Mn(taa) in both LS and HS states. Certain phonon modes are softened in the HS state because one of the Mn-N bonds is elongated due to JT distortion, and correspondingly their occupation numbers are increased. Fig. 1(d)(e) show the results of differences of energy, free energy and entropy of phonon as a function of temperature by GGA-PBE and GGA+. At zero temperature , with zero vibration number for all phonon modes, the zero-point energy difference is for PBE and varies between for GGA+ with , respectively. The phonon entropy is insensitive to and is larger for HS than LS, with the difference increasing with .
The total entropy difference including both spin and phonon contributions causes the SCO to become a first-order phase transition.Sim and Sinn (1981); Garcia et al. (2000) The transition temperature can be controlled by external strainGuionneau et al. (2005) and magnetic fieldGarcia et al. (2000); Kimura et al. (2005); Her et al. (2012). Although it was suggested that the phonon entropy does not dominate the phase transition on the basis of solid-state Raman spectra,Nakano et al. (2003) a previous DFT study Garcia et al. (2007) found that the phonon entropy difference in Mn(taa) is comparable to the spin-JT entropy difference, which is at . At , we calculate the phonon entropy difference to be .
Inter-molecular interactions arise from the elastic energy, which is treated classically because of the low vibration frequencies and high occupation numbers. Boukheddaden et al. Boukheddaden et al. (2007); Nishino et al. (2007); Slimani et al. (2015); Traiche et al. (2018) suggested an isotropic elastic energy, which works well for many 1D and 2D lattice SCO systems. In the case of Mn(taa), because of the JT-active HS state, the strain interaction is anisotropic and depends on the shape of the molecules. Therefore, we assume an elastic energy of the form,
| (3) |
where is a dimensionless vector along the JT elongation axis so that , , , and . Each Mn(taa) molecule has five nearest neighbors. is a unit vector between two neighbor sites and . is the force constant in the dimension of energy and is a function of the spin-state . We assume that in the LS state, two neighbor molecules are separated by the equilibrium distance with zero elastic energy, thus . is determined by the total energy difference between two HS bulk calculations with HS-Qab and HS-Qc as indicated in Fig. 1(a). The plot in Fig. 1(c) shows that HS-Qc is always lower in energy than HS-Qab so that the JT elongation axes of HS tend to align in parallel with each other. We find , and to be insensitive to . The negative sign indicates an effective anisotropic attraction caused by the JT distortion between two neighboring molecules.
The effects of magnetic field , magnetic anisotropy , and external electric field are given by ,
| (4) |
where is the local magnetic moment on each site, whose component is defined by the quantum number , and is the electric dipole. is a unit vector along the JT elongation axis determined by the JT state to account for the excess anisotropy contribution in the HS state over the LS state. The magnetic anisotropic energy per molecule is from first-principles, yielding . In the Monte Carlo simulation, we assume that the magnetic moments are always aligned with , which is in the direction. Thus the anisotropy energy only needs to be computed for sites with .
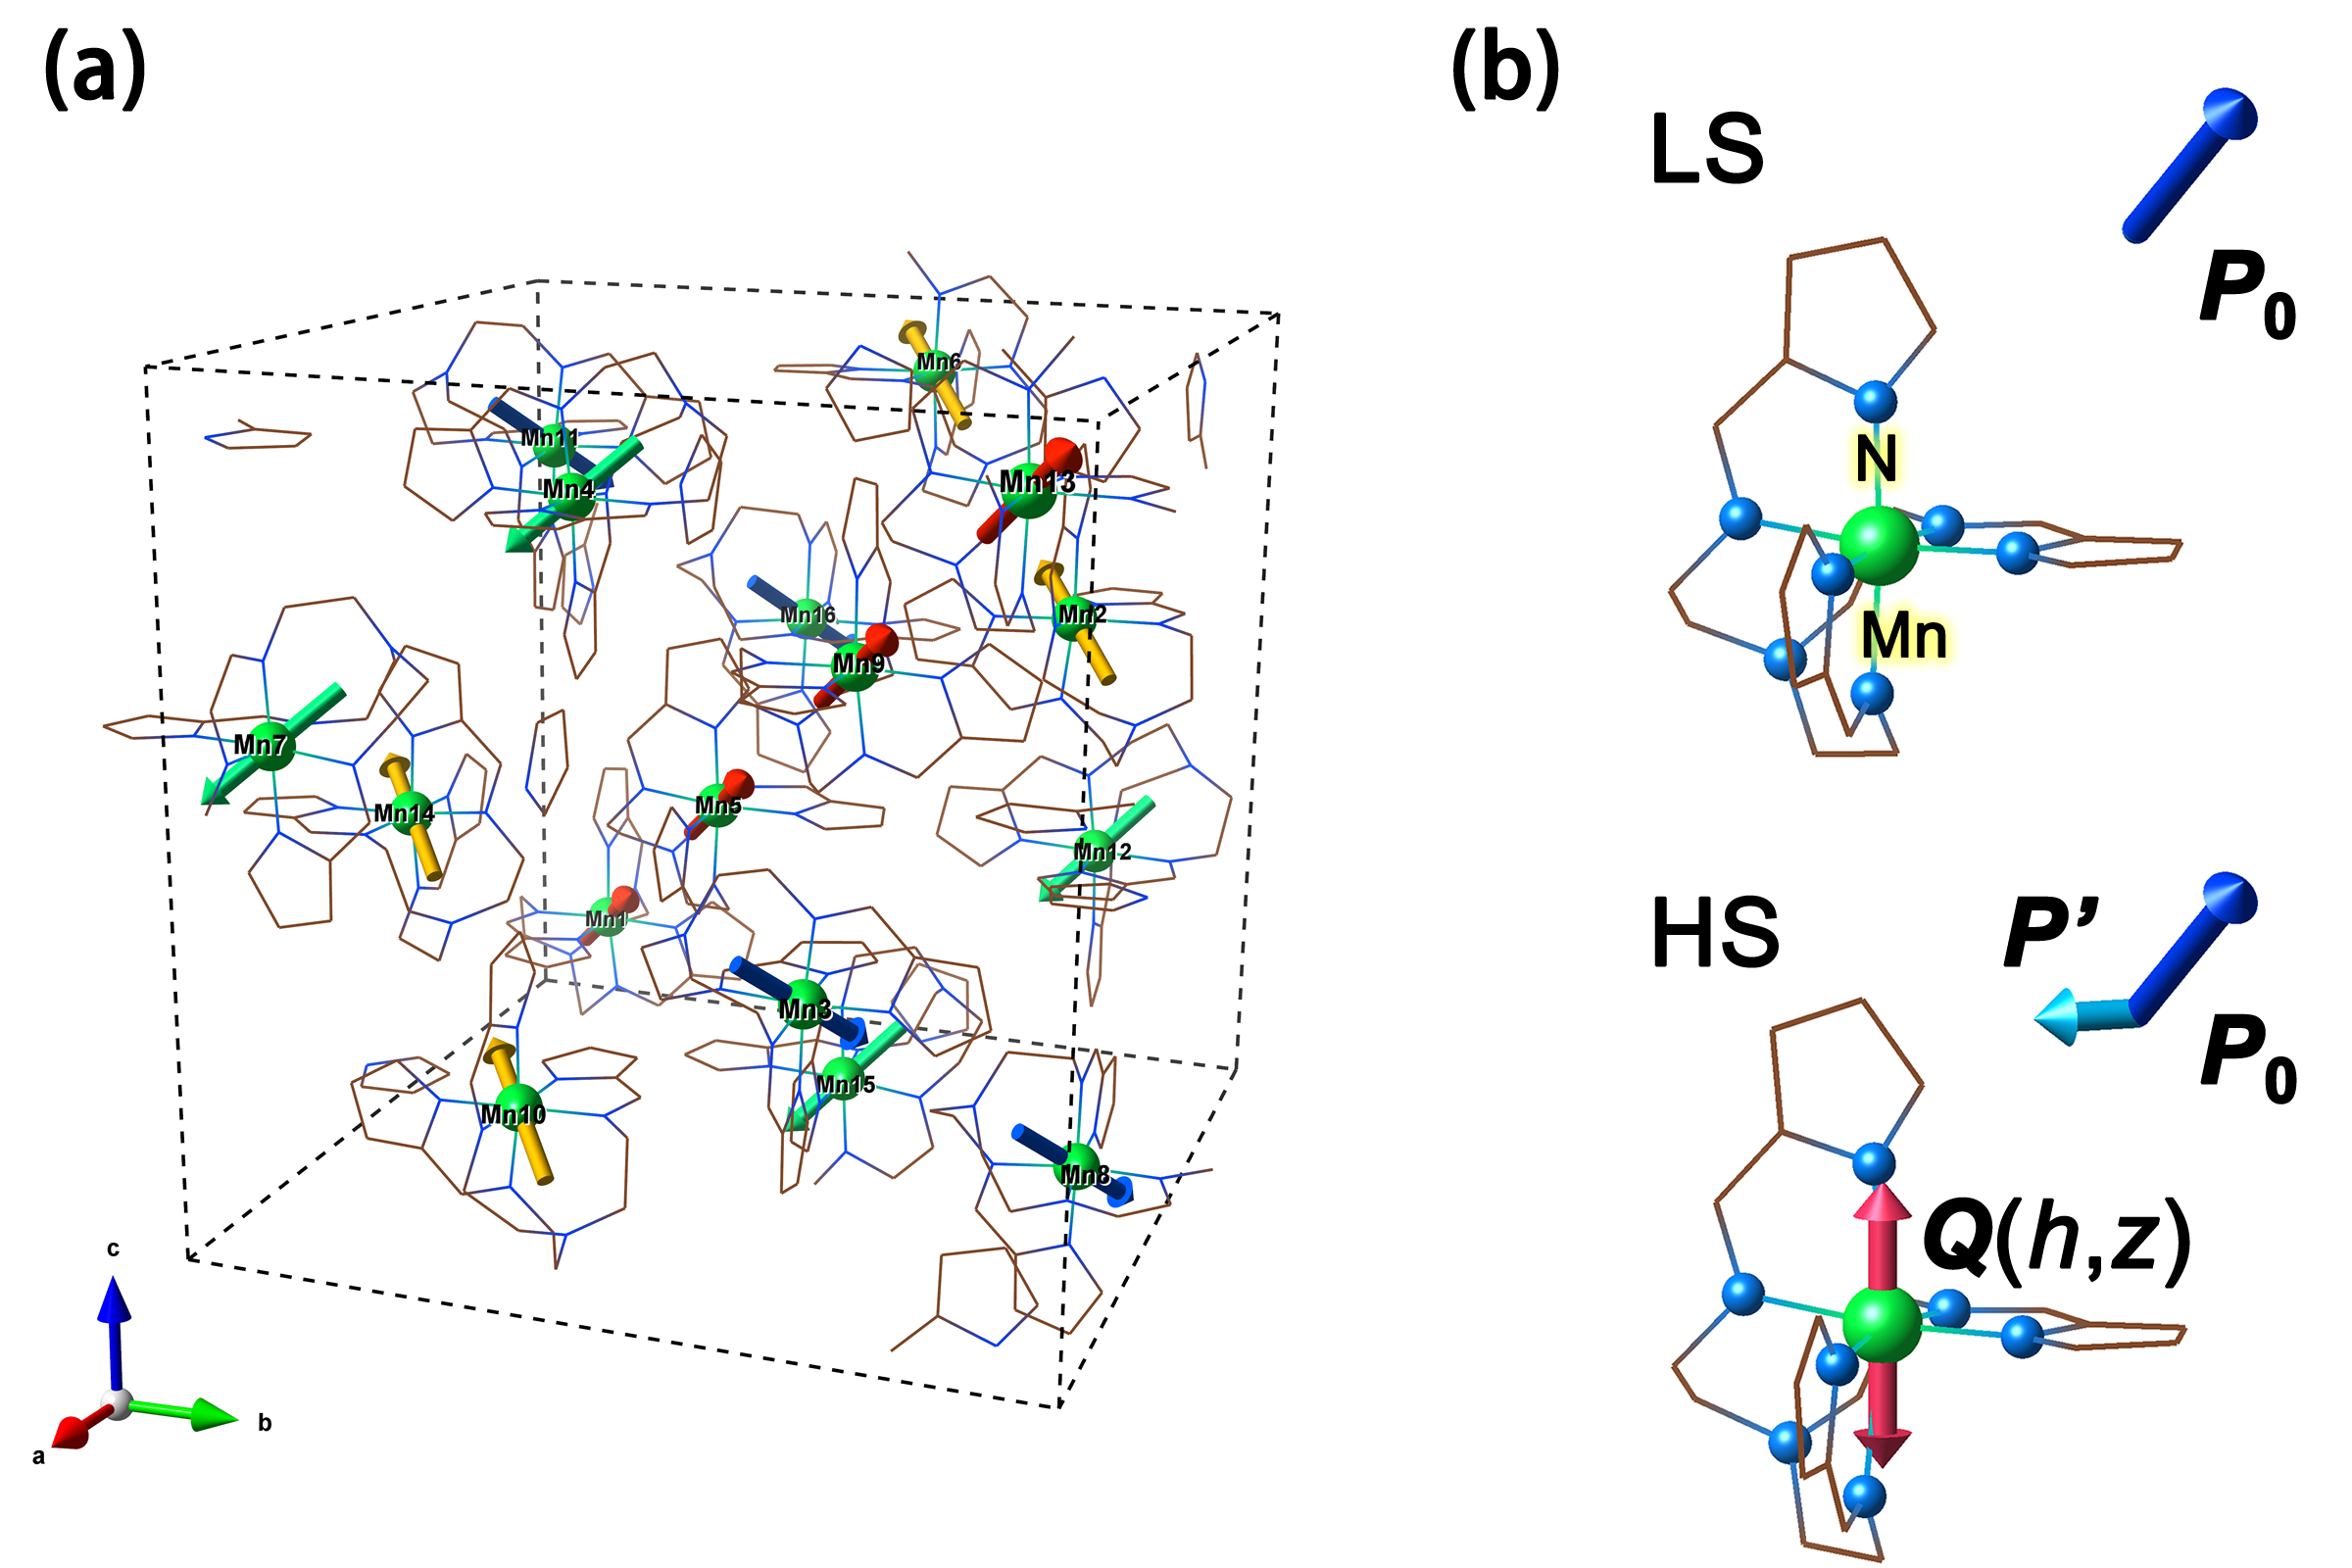
First principles calculations yield the magnitude of about 1.15 Å for both LS and HS states. In the LS state, the dipole moment directions of the molecules in the unit cell are shown in Fig. 2(a). Sixteen molecules belong to four groups, with the dipole directions in each group aligned along one of the four directions. There is no net polarization in the unit cell. Once one molecule transitions to the HS state, an additional transverse dipole of about 0.23 Å is created along the direction perpendicular to both its JT elongation axis and the original dipole direction, as shown in Fig. 2(b).
The first-order SCO phase transition as a function of in is reproduced by Monte Carlo simulation using the microscopic Hamiltonian with the parameters obtained from first-principles calculations. The parameters are , , , and . A small constant electric field of mV/Å is applied along the direction. In Fig. 3 we show specific heat (a), HS population and sub-population for , (b), and electric susceptibility (c) as a function of temperature. The first-order transition is clearly indicated by the singularity in the specific heat and the discontinuity in , , and at the same . averaged over cooling and heating is 44 K, matching experiments.Sim and Sinn (1981); Garcia et al. (2000) Without the elastic energy, the LS to HS transition occurs gradually with increasing temperature, and no phase boundary can be observed (gray dotted curves in Fig. 3(a)(b)). This confirms the key role of the inter-molecular strain interaction in the SCO phase transition. sup
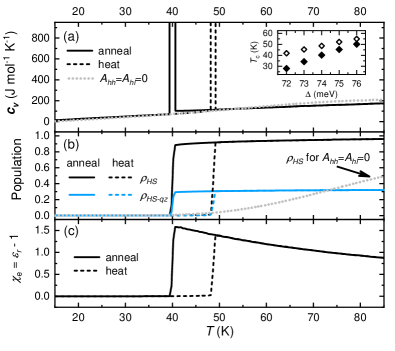
Inset in (a) gives the SCO transition temperature as a function of for cooling (solid) and heating (hollow).
Now we are ready to examine the three HS phases by performing the simulations under different magnetic fields. The results are shown in Fig. 4. All four phases, LS, NP (HS non-polarized), FE (HS ferroelectric), and PE (HS paraelectric), are identified with phase boundaries (a) defined by the peaks in , discontinuities in and the component of the electric polarization . The LS phase is located at the low magnetic field and low temperature part of the phase diagram. The boundary between the LS and HS phases is the first order SCO phase transition and the transition temperature approaches zero when the magnetic field reaches about 35 T. The PE phase is the high temperature HS phase with diminishing electric polarization. The NP and FE phases only exist under high magnetic fields.
The low-temperature HS phase is non-polarized when temperature is below about . The snapshot in Fig. 4(d) for this phase shows that all sites have the same JT-elongation axes so that the transverse dipoles are exactly cancelled, leaving zero net polarization. The electric susceptibility decays quickly with decreasing temperature, indicating that the JT degrees of freedom are being frozen out. This is analogous to the freezing of a material into a crystalline solid. Thus we identify this phase as the JT solid phase. The phase transition temperature of is determined by , the strength of the HS-HS strain interaction sup .
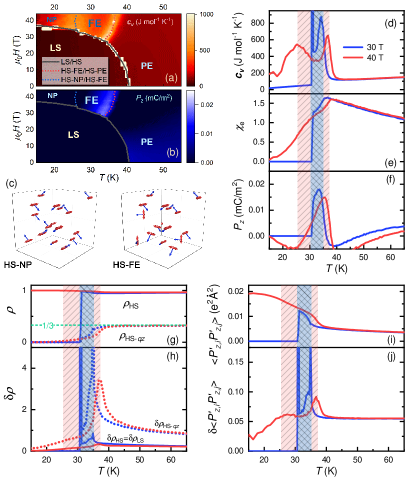
The high-temperature HS phase, labeled PE, shows an almost ideal sub-population of all three JT axes, each at close to . Because the three JT axes are chosen at random with almost no correlation, the electric dipole and susceptibility arise from thermal fluctuation. This leads to a paraelectric behavior. The nearly uncorrelated JT distortion is analogous to a gas. Thus we identify the PE phase as a JT gas phase.
The intermediate-temperature HS phase, labeled FE, has a non-zero net polarization. The snapshot of the FE phase unit cell in Fig. 4(d) shows one , three , nine and three molecules. Recall that is the LS state. This means that the FE phase contains a small number of LS molecules. The sub-population of each JT axis is below its nominal value , also plotted in Fig. 4(f). This mixing of a small number of LS molecules naturally introduces disorder in JT ordering. Consequently the dipoles are no longer compensated, The electric susceptibility increases with increasing temperature and has a maximum at the transition temperature. This is a typical feature of ferroelectrics below the Curie temperature Samara (1966). The thermal average polarization in this phase is about , smaller than that of one uncompensated dipole at a 10000 site. This strongly suggests that the nonzero polarization arises from dynamic fluctuation of the JT distortion, and that this intermediate phase is analogous to a liquid phase. Thus, we identify it as a JT liquid.
To understand the nature of the three JT phases, and to confirm that the intermediate phase indeed has liquid characteristics, we calculate the thermal average and the fluctuation of the nearest neighbor polarization correlation function , which are plotted in Figs. 4(i) and (j). The LS state without the JT degree of freedom has zero correlation and zero fluctuation in the low region in T. Among the three HS phases, the thermal average of the correlation for the NP and FE phases is much larger than for the PE phase, reflecting stronger correlation in the two lower temperature HS phases. On the other hand, fluctuation is higher for the two higher temperature HS phases, FE and PE, than the NP phase, besides the maximum at the phase transition boundary. The fluctuation in the FE phase is Å2 away from the phase boundary, much larger than the thermal average as Å2. In contrast, the fluctuation in the NP phase decays as decreases due to the frozen JT degree of freedom. The dynamic behaviors can also be confirmed by the fluctuation in population [Fig. 4(h)]; is equal to . The fluctuation in the FE phase is larger than that in both LS and NP phases, indicating importance of the dynamics of the LS in the FE phase. in the FE phase is also much larger than the corresponding thermal average. The above analysis reveals that the FE phase exhibits correlated and dynamic JT distortion. Correlation and dynamic fluctuation are properties generally identified with a liquid in condensed matter.
In summary, we introduced a molecular-scale Hamiltonian to describe the SCO system Mn(taa) with parameters obtained from first principles calculations. Monte Carlo simulations using this Hamiltonian qualitatively reproduce the experimental phase diagram and yield microscopic understanding of the observed phases. The strain interaction is the primary factor controlling the ordering and dynamics of JT distortions, producing three JT states of matter (JT solid, JT liquid, and JT gas) in different magnetic fields and temperatures. The JT liquid is particularly interesting because of the dynamic JT fluctuation in this phase and the uncompensated electric polarization. Disorder and dynamic JT fluctuation are quite common in spin-crossover materials. Thus one may expect JT liquid to be discovered in other systems.
This work was supported as part of the Center for Molecular Magnetic Quantum Materials, an Energy Frontier Research Center funded by the U.S. Department of Energy, Office of Science, Basic Energy Sciences under Award No. DE-SC0019330. Computations were done using the utilities of National Energy Research Scientific Computing Center, the Extreme Science and Engineering Discovery Environment under No. TG-PHY170023 and University of Florida Research Computing systems.
References
- Decurtins et al. (1984) S. Decurtins, P. Gütlich, C. Köhler, H. Spiering, and A. Hauser, Chem. Phys. Lett. 105, 1 (1984).
- Sim and Sinn (1981) P. G. Sim and E. Sinn, J. Am. Chem. Soc. 103, 241 (1981).
- Halcrow (2011) M. A. Halcrow, Chem. Soc. Rev. 40, 4119 (2011).
- Matsumoto et al. (2014) T. Matsumoto, G. N. Newton, T. Shiga, S. Hayami, Y. Matsui, H. Okamoto, R. Kumai, Y. Murakami, and H. Oshio, Nat. Commun. 5, 3865 (2014).
- Fitzpatrick et al. (2015) A. J. Fitzpatrick, E. Trzop, H. Müller-Bunz, M. M. Dîrtu, Y. Garcia, E. Collet, and G. G. Morgan, Chem. Commun. 51, 17540 (2015).
- Chikara et al. (2019) S. Chikara, J. Gu, X.-G. Zhang, H.-P. Cheng, N. Smythe, J. Singleton, B. Scott, E. Krenkel, J. Eckert, and V. S. Zapf, Nat. Commun. 10, 1 (2019).
- Béa et al. (2008) H. Béa, M. Gajek, M. Bibes, and A. Barthélémy, J. Phys.: Condens. Matter 20, 434221 (2008).
- Fusil et al. (2014) S. Fusil, V. Garcia, A. Barthélémy, and M. Bibes, Annu. Rev. Mater. Res. 44, 91 (2014).
- Fiebig et al. (2016) M. Fiebig, T. Lottermoser, D. Meier, and M. Trassin, Nature Reviews Materials 1, 16046 (2016).
- Leuenberger and Loss (2001) M. N. Leuenberger and D. Loss, Nature 410, 789 (2001).
- Bogani and Wernsdorfer (2008) L. Bogani and W. Wernsdorfer, Nat. Mater. 7, 179 (2008).
- Gehring and Gehring (1975) G. A. Gehring and K. A. Gehring, Reports on Progress in Physics 38, 1 (1975).
- Kaplan (1995) B. G. Kaplan, M. D.; Vekhter, Cooperative phenomena in Jahn-Teller crystals (Plenum Press, New York, 1995).
- Lee et al. (2013) J. H. Lee, K. T. Delaney, E. Bousquet, N. A. Spaldin, and K. M. Rabe, Phys. Rev. B 88, 174426 (2013), https://link.aps.org/doi/10.1103/PhysRevB.88.174426.
- Nakano et al. (2003) M. Nakano, G. etsu Matsubayashi, and T. Matsuo, in Advances in Quantum Chemistry (Elsevier, 2003), pp. 617–630.
- Stratt and Adachi (1987) R. M. Stratt and S. H. Adachi, J. Chem. Phys. 86, 7156 (1987).
- Boukheddaden et al. (2000a) K. Boukheddaden, I. Shteto, B. Ho, and F. Varret, Phys. Rev. B 62, 14796 (2000a).
- Boukheddaden et al. (2000b) K. Boukheddaden, I. Shteto, B. Hôo, and F. Varret, Phys. Rev. B 62, 14806 (2000b).
- Chen et al. (2015) J. Chen, A. J. Millis, and C. A. Marianetti, Phys. Rev. B 91, 241111(R) (2015).
- Cirera et al. (2018) J. Cirera, M. Via-Nadal, and E. Ruiz, Inorg. Chem. 57, 14097 (2018).
- Aryasetiawan et al. (2004) F. Aryasetiawan, M. Imada, A. Georges, G. Kotliar, S. Biermann, and A. I. Lichtenstein, Phys. Rev. B 70, 195104 (2004).
- Aryasetiawan et al. (2006) F. Aryasetiawan, K. Karlsson, O. Jepsen, and U. Schönberger, Phys. Rev. B 74, 125106 (2006).
- Kozhevnikov et al. (2010) A. Kozhevnikov, A. G. Eguiluz, and T. C. Schulthess, in 2010 ACM/IEEE International Conference for High Performance Computing, Networking, Storage and Analysis (IEEE, 2010).
- Zhang et al. (2019) L. Zhang, P. Staar, A. Kozhevnikov, Y.-P. Wang, J. Trinastic, T. Schulthess, and H.-P. Cheng, Phys. Rev. B 100 (2019).
- (25) See Supplemental material for the methodology of first principles calculations and Monte Carlo simulations, the detail of cPRA calculations and other related Monte Carlo results, which includes Ref. [26-34].
- Metropolis and Ulam (1949) N. Metropolis and S. Ulam, J. Am. Stat. Assoc. 44, 335 (1949).
- Blöchl (1994) P. E. Blöchl, Phys. Rev. B 50, 17953 (1994).
- Kresse and Joubert (1999) G. Kresse and D. Joubert, Phys. Rev. B 59, 1758 (1999).
- Kresse and Furthmüller (1996a) G. Kresse and J. Furthmüller, Comput. Mater. Sci. 6, 15 (1996a).
- Kresse and Furthmüller (1996b) G. Kresse and J. Furthmüller, Phys. Rev. B 54, 11169 (1996b).
- Perdew et al. (1996) J. P. Perdew, K. Burke, and M. Ernzerhof, Phys. Rev. Lett. 77, 3865 (1996), https://link.aps.org/doi/10.1103/PhysRevLett.77.3865.
- Liechtenstein et al. (1995) A. I. Liechtenstein, V. I. Anisimov, and J. Zaanen, Phys. Rev. B 52, R5467 (1995).
- Parlinski et al. (1997) K. Parlinski, Z. Q. Li, and Y. Kawazoe, Phys. Rev. Lett. 78, 4063 (1997).
- Togo and Tanaka (2015) A. Togo and I. Tanaka, Scr. Mater. 108, 1 (2015).
- Garcia et al. (2000) Y. Garcia, O. Kahn, J.-P. Ader, A. Buzdin, Y. Meurdesoif, and M. Guillot, Phys. Lett. A 271, 145 (2000).
- Guionneau et al. (2005) P. Guionneau, M. Marchivie, Y. Garcia, J. A. K. Howard, and D. Chasseau, Phys. Rev. B 72, 214408 (2005).
- Kimura et al. (2005) S. Kimura, Y. Narumi, K. Kindo, M. Nakano, and G. etsu Matsubayashi, Phys. Rev. B 72, 064448 (2005).
- Her et al. (2012) J. L. Her, Y. H. Matsuda, M. Nakano, Y. Niwa, and Y. Inada, J. Appl. Phys. 111, 053921 (2012).
- Garcia et al. (2007) Y. Garcia, H. Paulsen, V. Schünemann, A. X. Trautwein, and J. A. Wolny, Phys. Chem. Chem. Phys. 9, 1194 (2007).
- Boukheddaden et al. (2007) K. Boukheddaden, S. Miyashita, and M. Nishino, Phys. Rev. B 75, 094112 (2007).
- Nishino et al. (2007) M. Nishino, K. Boukheddaden, Y. Konishi, and S. Miyashita, Phys. Rev. Lett. 98, 247203 (2007).
- Slimani et al. (2015) A. Slimani, K. Boukheddaden, and K. Yamashita, Phys. Rev. B 92, 014111 (2015).
- Traiche et al. (2018) R. Traiche, M. Sy, and K. Boukheddaden, J. Phys. Chem. C 122, 4083 (2018).
- Samara (1966) G. A. Samara, Phys. Rev. 151, 378 (1966), https://link.aps.org/doi/10.1103/PhysRev.151.378.