Elliptical galaxies/stellar halos connection
Abstract
Cosmological simulations predict that early-type galaxies (ETGs) are the results of extended mass accretion histories. The latter are characterized by different numbers of mergers, mergers’ mass ratios and gas fractions, and timing. Depending on the sequence and nature of these mergers that follow the first phase of the in-situ star formation, these accretion histories may lead to ETGs that have low or high mass halos, and that rotate fast or slow. Since the stellar halos maintain the fossil records of the events that led to their formation, a discontinuity may be in place between the inner regions of ETGs and their outer halos, because the time required for the halos’ stars to exchange their energies and momenta is very long compared with the age of these systems. Exquisite deep photometry and extended spectroscopy for significant samples of ETGs are then used to quantify the occurrence and significance of such a transition in the galaxies’ structural and kinematical parameters. Once this transition radius is measured, its dependency with the effective radius of the galaxies’ light distribution and total stellar masses can be investigated. Such correlations can then be compared with the predictions of accreted, i.e. ex-situ vs. in-situ components from cosmological simulations to validate such models.
keywords:
ISM: planetary nebulae: general; galaxies: elliptical and lenticular, cD; evolution; halos; individual: NGC 5866; kinematics and dynamics1 Introduction
Our most recent understanding of the physics and structure of the brightest regions of elliptical galaxies, hereafter early-type galaxies or ETGs, comes from integral field spectroscopic data collected in magnitude limited surveys of galaxies, in the nearby universe. From the ATLAS3D survey ([Cappellari et al. 2011, Cappellari et al. 2011]) to the more recent results from the MANGA survey ([Graham et al. 2018, Graham et al. 2018]) a paradigm emerged that groups ETGs in either fast (FRs) and slow rotators (SRs), according to the central projected specific angular momentum within one effective radius ([Emsellem et al. 2007, Emsellem et al. 2007]). FRs do include S0 galaxies; the FR class encompasses the great majority of the ETGs (86%). Their brightest regions appear as oblate systems with regular disk-like kinematics along the photometric major axis. Furthermore their formation history is dominated by gas-rich processes. SRs, on the other hand, are of the ETGs, often display kinematic features such as counter-rotating cores or twists of the kinematic position angle. These objects are relatively rounder systems, mildly triaxial ([Foster et al. 2017, Foster et al. 2017]), tend to be massive ([Cappellari et al. 2013, Cappellari et al. 2013]), and their formation history is dominated by dry mergers.
Observations of ETG analogs at redshifts show significant structural difference though from their local counterparts. In this redshift range, massive systems are flatter, have effective radii less than kpc and their surface brightness profiles are modeled with a Sersic profile whose index values are lower than those of local ETGs ([Van Dokkum et al. 2010, Van Dokkum et al. 2010], [Toft et al. 2007, Toft et al. 2007]). In turn, local (z=0) massive galaxies have grown by a factor two in mass, four in size, with their effective radii . In addition they have surface brightness profiles whose Sersic index value is and with rounder isophotes ([Kormendy et al. 2009, Kormendy et al. 2009]).
Simulations explain such growth via dry (gas poor) minor mergers onto an existing earlier formed host within its dark halo ([Oser et al. 2010, Oser et al. 2010], [Hilz et al. 2013, Hilz et al. 2013]), also refereed to as “two-phase formation scenario”. Depending on the mass ratio/merging parameters, these mergers leave the inner host structure almost unchanged ([Amorisco 2017, Amorisco 2017]). In case of mini-mergers () the stars stay at large radii and never come near to the center of the potential ([Karademir et al. 2019, Karademir et al. 2019]). These events increase size growth and cause faster shape change compared to mergers with higher mass satellites.
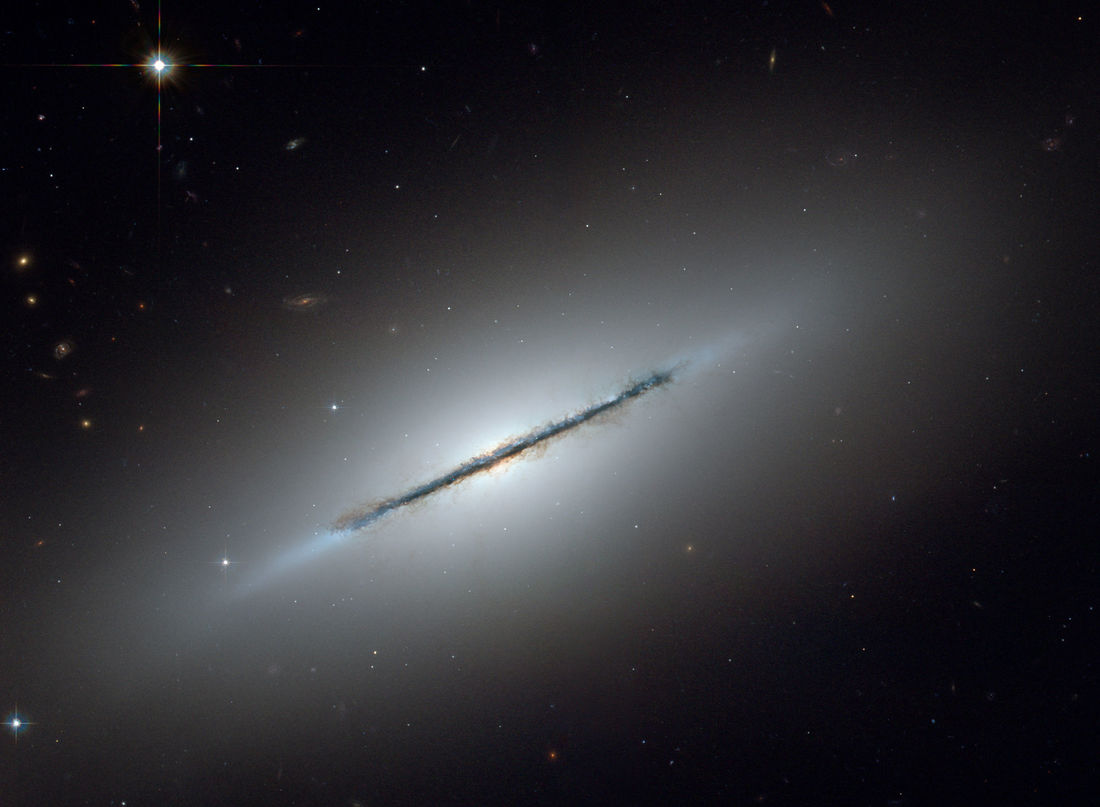
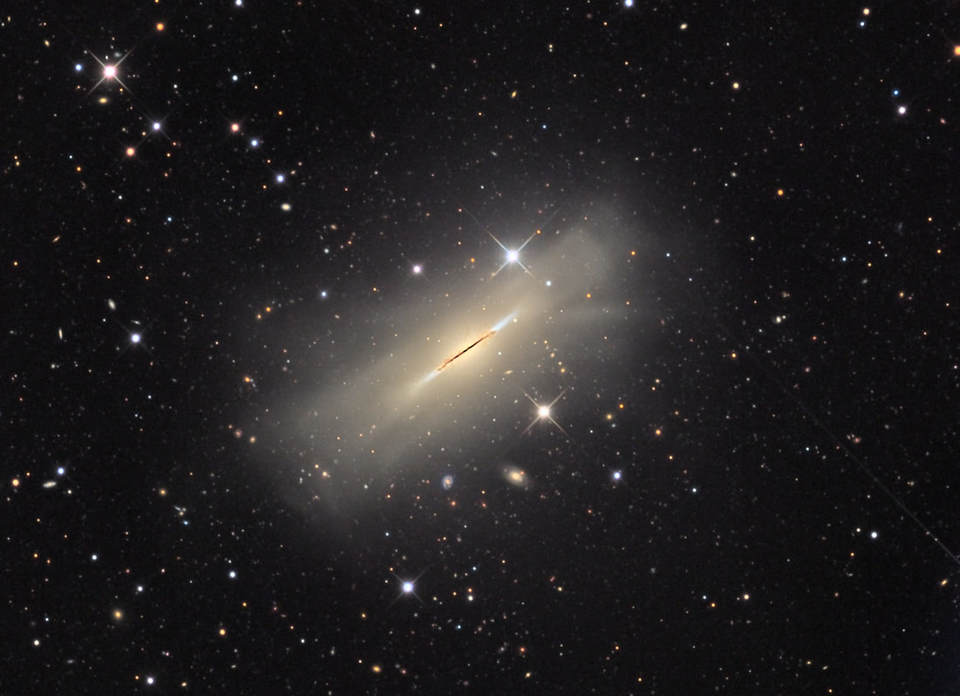
One can reach an intuitive understanding of these accretion processes by looking at the analogs of such dry merger events. A “poster child” is the spindle galaxy NGC 5866. This galaxy is at 13.4 Mpc distance and has a kpc. The morphology of the high surface brightness regions of this galaxy (see Fig. 1) is SA0 with a narrow dust lane seen edge-on and forming an angle with the photometric major axis. In the deep HST image, the dust filaments appear orthogonal to the disk. The kinematics of this galaxy is that of a regular disk rotator ([Krajnovi´c et al. 2011, Krajnovi´c et al. 2011]). The deep image of NGC 5866 shows that something different is happening in its outskirts. In Fig. 1 at low surface brightness the galaxy has extra light in the halo from a dissolving satellite on an extended nearly-radial orbit, with several pericenter passages. Clearly when such an accretion event is phase-mixed, it will add to this galaxy a different shape component from the central one with the FR kinematics.
ETGs like NGC 5866 are “cosmological” in the sense that they have accreted components that form their halos. Thus the variety and scatter in the physical properties of these accretion events and their final results, i.e. the halos in ETGs, are tied to their cosmological context. This is reflected in the halo kinematics which is the subject covered by this work.
2 Probing ETG halo kinematics with Planetary Nebulae
In the cosmological context of the formation of ETGs, it is important to measure the kinematics of their stellar halos because i) they contain of the stellar angular momentum, and ii) of their total mass, mostly dominated by dark matter. Since iii) the stellar content of the halos are mostly accreted ([Wu et al. 2014, Wu et al. 2014]) and iv) the settling time scale are long ( Gyr; [Bullock & Johnston, 2005, Bullock & Johnston, 2005]) their kinematics preserve the signatures of the formation processes. See for example the effects of the satellite accretion, i.e. the Magellanic Clouds, on the dark halo potential of the host, i.e. the MW (Contribution by G. Besla, this conference).
These goals are complementary to those of the completed (ATLAS3D) or on-going IFS surveys (MANGA, CALIFA, SAMI, MASSIVE) that are targeting the central . To measure the kinematics of the stellar halos at large distances we use Planetary Nebulae (PNe) in these halos. Planetary nebulae are relatively bright [OIII] 5007 Å emitters that become easily detectable in the dimmed low surface brightness halo regions. PNe are the late phases of intermediate to low mass stars and provide discrete sampling of the line-of-sight velocity distribution (LOSVD) in any region of a given nearby galaxy ([Arnaboldi et al. 2002, Arnaboldi et al. 2002]). In all galaxies studied so far, whenever PNe and stellar kinematics from absorption line spectroscopy are available, their agree. PNe are therefore good kinematic tracers.
2.1 The extended PN.S ETG survey
The extended Planetary Nebulae Spectrograph (PN.S) ETG survey ([Arnaboldi et al. 2017, Arnaboldi et al. 2017]) targeted 33 ETGs in a magnitude limited sample with a wide range of structural parameters (luminosity central velocity dispersion ellipticity surface brightness). Observations were carried out mostly with the PN.S mounted on WHT at the ING observatory on La Palma. The PN.S is a custom-built slitless spectrograph optimized for the detection of the monochromatic [OIII] emission from PNe at 5007 Å ([Douglas et al. 2007, Douglas et al. 2007]). With the PN.S, the detection of a PN [OIII] 5007 Å emission and its LOSV measurement can be achieved in a single observing run. In the ePN.S survey, LOSVs were measured for 8636 extragalactic PNe, the largest sample available so far, with samples of PN LOSVs per galaxy. The ETGs in the ePN.S sample are within 25 Mpc distance, with 24 FRs and 9 SRs. The kinematics mapped by PNe covers the radial range out to with as median value for the entire sample ([Coccato et al. 2009, Coccato et al 2009], [Cortesi et al. 2013, Cortesi et al. 2013]; [Pulsoni et al. 2018, Pulsoni et al. 2018]). For the complete description of the smoothing technique for the extraction of the kinematics maps from discrete PN LOSV we refer to [Pulsoni et al. 2018, Pulsoni et al. 2018].
3 Kinematical diversity of stellar halos
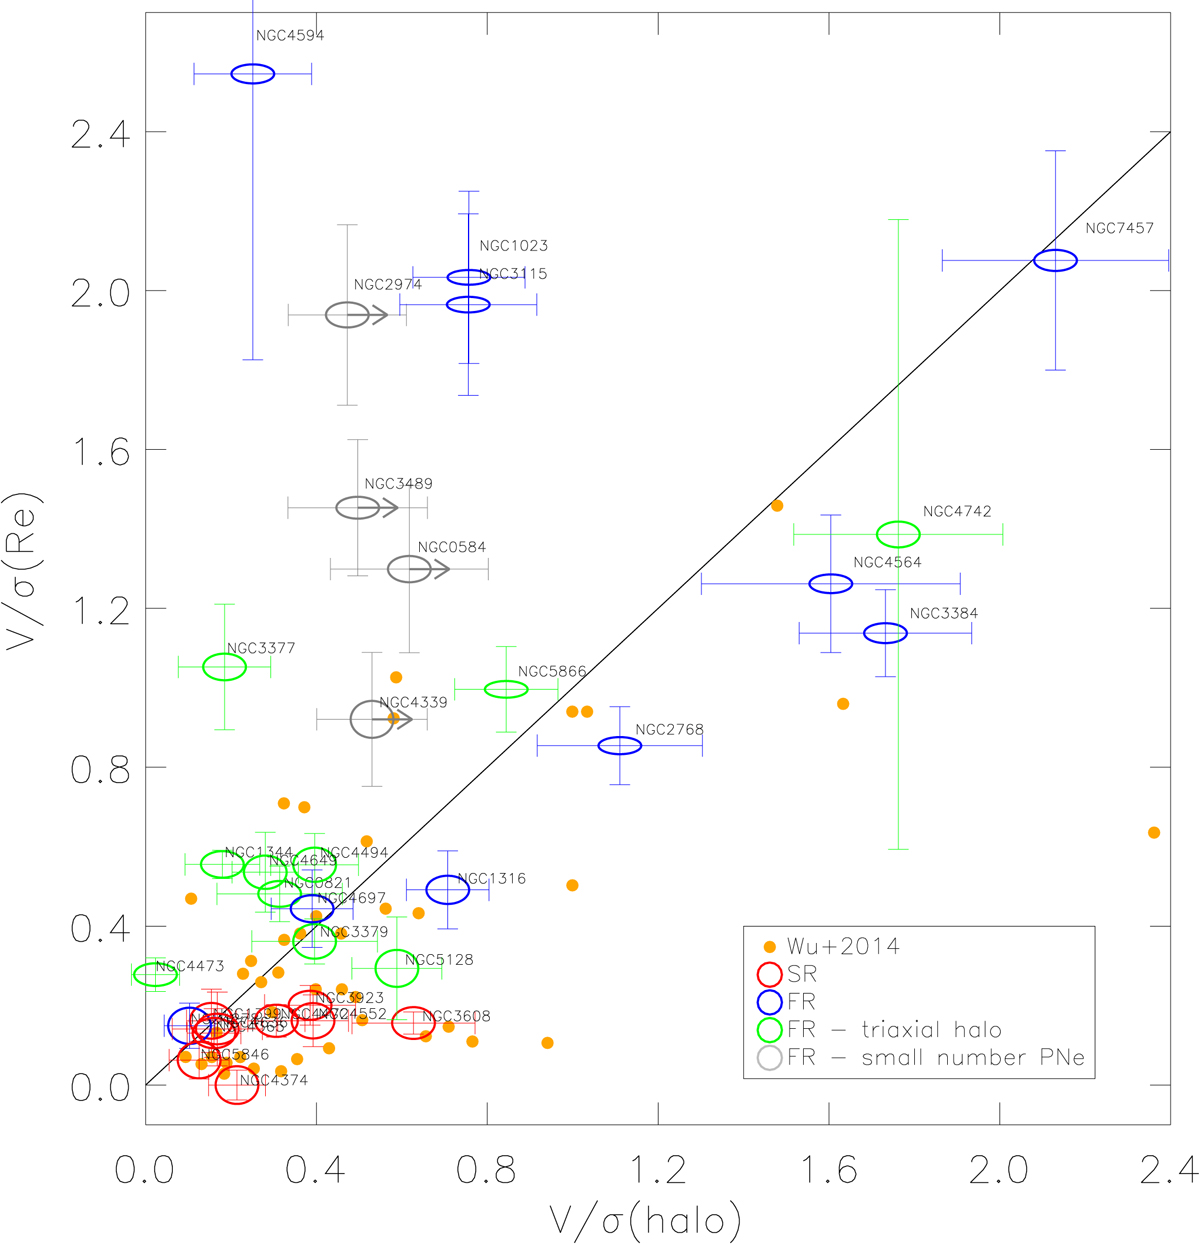
The results from the ePN.S survey show that the kinematics of ETGs at large radii can be substantially different from that of the inner regions. For the SRs, the rotation increases in the halos. For the FRs, this diversity is signaled by a decrease in rotation in 70% of the ePN.S FRs or by a significant twist of the kinematical position angle in 40% of the ePN.S FRs. 30% of the ePN.S FRs are rapidly rotating at large radii also. We interpreted the general behavior of the ePN.S FRs as the transition from the inner disk component to the spheroidal halo, which is dispersion dominated and might deviate from axisymmetry. Figure 2 illustrates this inference by comparing the of the halo with that of the inner regions at . The values are derived by interpolating the and profiles from integrated light at , while is the ratio of and estimated in the outermost radial bin of the PN velocity fields. All the SRs are located below the line, showing higher rotational support at large radii. The scatter of the FRs in this diagram reflects their different intrinsic structure and kinematics. The halos of most ePN.S FRs have ratio similar to that of SRs. Among these sub-sample of FRs the scatter in is probably driven by the presence of a more or less prominent disk component seen at different inclinations, and embedded into a dispersion dominated spheroid. The flattening of the ellipses in Fig. 2 indeed shows that galaxies with higher also display higher . A second group of FRs with high rotational support in the halo populate the diagram on the right of the line. These galaxies are either dominated by disk rotation at all radii (NGC 3384 and NGC 7457), or have a rapidly rotating spheroid (NGC 2768), or either of these (NGC 4564, NGC 4742). The FRs with triaxial halos typically show equal values of and , spanning all values in .
4 Kinematic Transition Radius
We found that most of the galaxies in the ePN.S sample show a kinematic transition signaled by a variation of the rotation velocity or in the kinematic position angle. In the framework of the two-phase formation scenario, this kinematic difference can be understood in association with stellar components of different origins, such as the in- and the ex-situ components. Predictions from simulations ([Rodriguez-Gomez et al. 2016, Rodriguez-Gomez et al 2016]) prescribe the in-situ stars to be concentrated in the central regions of galaxies, while the accreted stars dominate the halos, and with their relative contribution gauged by the the total mass. Within this framework we can define a transition radius as the distance where we measure a quantifiable variation of the stellar kinematics, and then compare it with the total stellar mass. The transition radius and its uncertainty are measured using (A) the interval between the radius at which is maximum and the radius at which it decreases by kms-1; (B) in case of an increasing profile, the radial range in which increases from to kms-1; (C) in case of a kinematic twist, the radial range in which the position angle changes significantly.
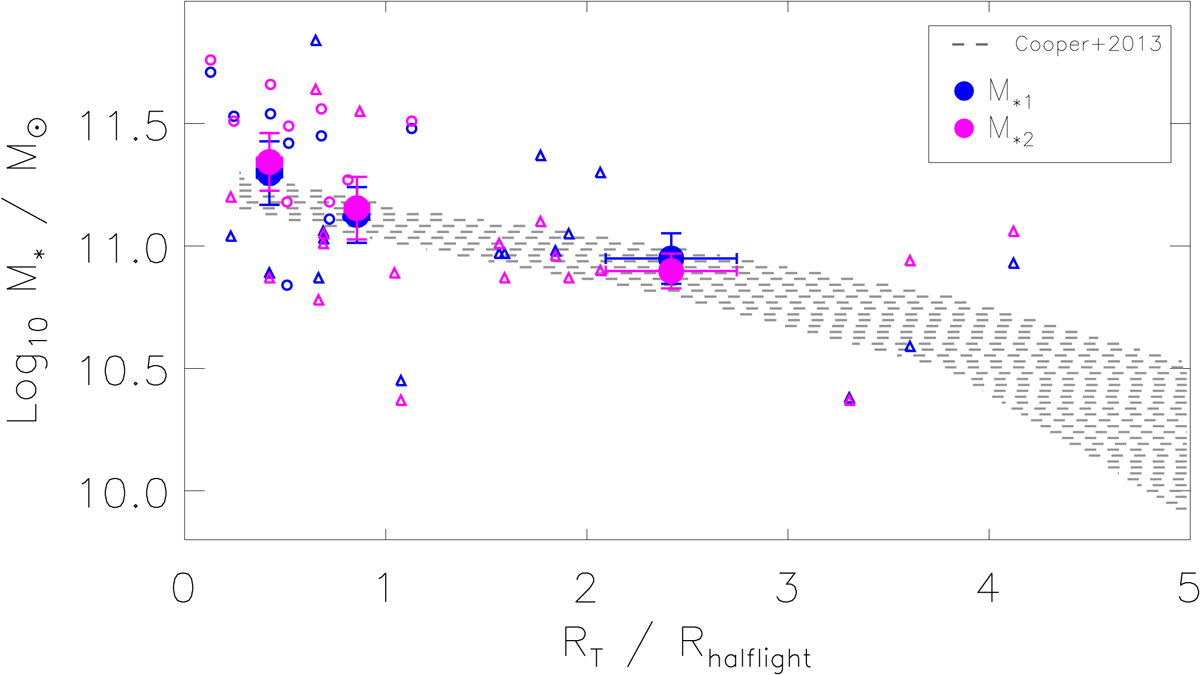
Figure 3 shows the stellar mass of the galaxies versus , where is the half-light radius measured from the light growth curves. The full circles show the same quantities in three bins of ; the error bars represent the standard deviation of the mass and of the ratio in the bin. For the tabulated values we refer to [Pulsoni et al. 2018, Pulsoni et al. 2018]. A clear correlation exists between total stellar mass and , in the sense that the more massive galaxies tend to have transition radii at smaller fractions of . The shaded region in Fig. 3 shows the corresponding quantities from the N-body simulations of [Cooper et al. (2013), Cooper et al. (2013)]. Fig. 3 illustrates an overall agreement of the predictions from cosmological simulations with the structures of the ETG halos as constrained by PN kinematics.
From cosmological simulations, we also learn that extended accretion of stars in massive ETGs occurs preferentially on radial orbits ([Röttgers et al. 2014, Röttgers et al. 2014] and reference therein) which may lead to a change of shape toward a more round-mildly triaxial shape at larger radii. The imprints of radial orbits on the higher order moments of the LOSVDs were modeled for M49 and M87 at kpc distance using PNe ([Longobardi et al. 2018, Longobardi et al. 2018], [Hartke et al. 2018, Hartke et al. 2018]).
5 Conclusions
The ePN.S is the largest survey of extragalactic PNe. PNe are evolved low mass stars and reliable tracers of the kinematic of their parent stellar populations, hence they can be used to probe the outer regions of the halos. We measured the kinematics in ETGs out to in 33 ETGs.
ETGs have more diverse kinematic properties than in the central regions. For the ePN.S sample we find 1) the onset of rotation in the halos for the SRs. 2) For the FR, 70% have slowly rotating halo, while in 30% of the sample the halo rotate as fast as the inner regions. 3) In 40% of the ePN.S ETGs the outer halo is triaxial (consistent with the photometric twist of the isophotes at large radii).
The kinematic transition radius anti-correlates with stellar mass, in agreement with predictions with cosmological particle tagging simulations.
The ePN.S FRs with triaxial halo are among the most massive galaxies for which the accreted component is expected to be more prominent.
Outer stellar halos are indeed linking galaxies with their cosmological environment.
6 Acknowledgments
MAR wished to thank the SOC of the IAU Symp. 353 for the invitation to give this talk. The authors are grateful to Nigel G. Douglas for his fundamental contribution to the foundation of the Planetary Nebula Spectrograph instrument and acknowledge the support and advice of the ING staff.
References
- [Amorisco 2017] Amorisco, N.C., 2017, MNRAS, 464, 2882
- [Arnaboldi et al. 2002] Arnaboldi, M., Aguerri, J. A. L., Napolitano, N. R., et al. 2002, AJ, 123, 760
- [Arnaboldi et al. 2017] Arnaboldi, M., Pulsoni, C., Gerhard, O., et al. 2017, IAUSymp. 323, 279
- [Bullock & Johnston, 2005] Bullock, J. S., & Johnston, K. V., 2005, ApJ, 635, 931
- [Cappellari et al. 2011] Cappellari, M., Emsellem, E., Krajnovi´c, D., et al. 2011, MNRAS, 413, 813
- [Cappellari et al. 2013] Cappellari, M., McDermid, R. M., Alatalo, K., et al. 2013, MNRAS, 432, 1862
- [Coccato et al. 2009] Coccato, L., Gerhard, O., Arnaboldi, M., et al. 2009, MNRAS, 394, 1249
- [Cooper et al. (2013)] Cooper, A. P., D’Souza, R., Kauffmann, G., et al. 2013, MNRAS, 434, 3348
- [Cortesi et al. 2013] Cortesi, A., Arnaboldi, M., Coccato, L., et al. 2013, A&A, 549, 115
- [Douglas et al. 2007] Douglas, N. G., Napolitano, N. R., Romanowsky, A. J., et al. 2007, ApJ, 664, 257
- [Emsellem et al. 2007] Emsellem, E., Cappellari, M., Krajnovi´c, D., et al. 2007, MNRAS, 379, 401
- [Foster et al. 2017] Foster, C., van de Sande, J., D’Eugenio, F., et al. 2017, MNRAS, 472, 966
- [Hartke et al. 2018] Hartke, J., Arnaboldi, M., Gerhard, O., et al. 2018, A&A, 616, 123
- [Hilz et al. 2013] Hilz, M., Naab, T., & Ostriker, J. P., 2013, MNRAS, 429, 2924
- [Graham et al. 2018] Graham, M., Cappellari, M., Li, H., et al. 2018, MNRAS, 477, 4711
- [Karademir et al. 2019] Karademir, G. S., Remus, R.-S., Burkert, A. et al. 2019, MNRAS, 487, 318
- [Kormendy et al. 2009] Kormendy, J., Fisher, D. B., Cornell, M. E., & Bender, R., 2009, ApJS, 182, 216
- [Krajnovi´c et al. 2011] Krajnovi´c, D., Emsellem, E., Cappellari, M., et al. 2011, MNRAS, 414, 2923
- [Longobardi et al. 2018] Longobardi, A., Arnaboldi, M. Gerhard, O., et al. 2018, A&A, 620, 111
- [Oser et al. 2010] Oser, L., Ostriker, J. P., Naab, T., Johansson, P. H., & Burkert, A., 2010, ApJ, 725, 2312
- [Pulsoni et al. 2018] Pulsoni, C., Gerhard, O., Arnaboldi, M., et al. 2018, A&A, 618, 94
- [Rodriguez-Gomez et al. 2016] Rodriguez-Gomez, V., Pillepich, A., Sales, L. V., et al. 2016, MNRAS, 458, 2371
- [Röttgers et al. 2014] Röttgers, B., Naab, T., Oser, L., 2014, MNRAS, 445, 1065
- [Van Dokkum et al. 2010] van Dokkum, P. G., Whitaker, K. E., Brammer, G., et al. 2010, ApJ, 709, 1018
- [Toft et al. 2007] Toft, S., van Dokkum, P., Franx, M., et al. 2007, ApJ, 671, 285
- [Wu et al. 2014] Wu, X., Gerhard, O., Naab, T., et al. 2014, MNRAS, 438, 2701