Interplay between competitive and cooperative interactions in a three-player pathogen system
Abstract
In ecological systems heterogeneous interactions between pathogens take place simultaneously. This occurs, for instance, when two pathogens cooperate, while at the same time multiple strains of these pathogens co-circulate and compete. Notable examples include the cooperation of HIV with antibiotic-resistant and susceptible strains of tuberculosis, or some respiratory infections with Streptococcus pneumoniae strains. Models focusing on competition or cooperation separately fail to describe how these concurrent interactions shape the epidemiology of such diseases. We studied this problem considering two cooperating pathogens, where one pathogen is further structured in two strains. The spreading follows a susceptible-infected-susceptible process and the strains differ in transmissibility and extent of cooperation with the other pathogen. We combined a mean-field stability analysis with stochastic simulations on networks considering both well-mixed and structured populations. We observed the emergence of a complex phase diagram, where the conditions for the less transmissible, but more cooperative strain to dominate are non-trivial, e.g. non-monotonic boundaries and bistability. Coupled with community structure, the presence of the cooperative pathogen enables the co-existence between strains by breaking the spatial symmetry and dynamically creating different ecological niches. These results shed light on ecological mechanisms that may impact the epidemiology of diseases of public health concern.
1 Introduction
Pathogens do not spread independently. Instead, they are embedded in a larger ecosystem that is characterised by a complex web of interactions among constituent elements. Among ecological forces shaping such ecosystems, pathogen-pathogen interactions have drawn increasing attention during recent years due to their population-level impact and public health consequences. Recent advances in serological tests and genotyping techniques have improved our reconstruction of pathogen populations where multiple strains co-circulate, often competing due to cross-protection or mutual exclusion. Examples include tuberculosis [1, 2], Plasmodium falciparum [3], Streptococcus pneumoniae [4, 5] and Staphylococcus aureus [6, 7]. Polymorphic strains can also interact in more complex ways, with both competition and cooperation acting simultaneously, as observed in co-circulating Dengue serotypes [8]. While interfering with each other, strains also interact with other pathogens co-circulating in the same population. Tuberculosis [1], HPV [9] and P. falciparum [10], for example, appear to be facilitated by HIV, whereas S. pneumoniae benefits from some bacterial infections, e.g. Moraxella catarrhalis, and is negatively associated to others such as S. aureus [11, 12]. Competition, cooperation and their co-occurrence may fundamentally alter pathogen persistence and diversity, thus calling for a deep understanding of these forces and their quantitative effects on spreading processes.
Mathematical models represent a powerful tool to assess the validity and impact of mechanistic hypotheses about interactions between pathogens or pathogenic strains [13, 14]. The literature on competitive interactions is centered on pathogen dominance and coexistence. Several factors were found to affect the ecological outcome of the competition, including co-infection mechanisms [15, 16, 17, 18], host age structure [19, 20], contact network [21, 22, 23, 24, 25, 26, 27, 28, 29, 30, 31, 32] and spatial organisation [33, 34, 35, 36, 37, 38]. At the same time, models investigating cooperative interactions have driven many research efforts during recent years [39, 40, 41, 42, 43, 44, 45]. Cooperation has been found to trigger abrupt transitions between disease extinction and large scale outbreaks along with hysteresis phenomena where the eradication threshold is lower than the epidemic threshold [39, 43, 40]. These findings were related to the high burden of synergistic infections, e.g. the HIV and tuberculosis co-circulation in many parts of the world. Despite considerable mathematical and computationally-heavy research on interacting pathogens, competition and cooperation have been studied mostly separately. Nevertheless, current understandings about these mechanisms taken in isolation may fail to describe the dynamics arising from their joint interplay, where heterogeneous interactions may shape the phase diagram of co-existence/dominance outcome, along with the epidemic prevalence.
Here we studied the simplest possible epidemic situation where these heterogeneous effects are at play. We introduced a three-player model where two pathogens cooperate, and one of the two is structured in two mutually exclusive strains. This mimics a common situation, where e.g. resistant and susceptible strains of S. pneumoniae cooperate with other respiratory infections [11], and allows us to address two important ecological questions:
-
•
How does the interplay between two distinct epidemiological traits, i.e. the transmissibility and the ability to exploit the synergistic pathogen, affect the spreading dynamics?
-
•
How does the presence of a synergistic infection alter the co-existence between competing strains?
We addressed these questions by providing a characterisation of the phase space of dynamical regimes. We tested different modelling frameworks (continuous and deterministic vs. discrete and stochastic), and compared two assumptions regarding population mixing, i.e. homogeneous vs. community structure.
The paper is structured as follows: Section 2 introduces the main aspects of the three-player model. We provide the results of the deterministic dynamical equations in Section 3.1, where we present the stability analysis, together with the numerical integration of the equations, to characterise the phase space of the dynamics. The structuring of the population in two communities is analysed in Section 3.2. In Section 3.3 we describe the results obtained within a network framework comparing stochastic simulations in an Erdős-Rényi and a random modular network. We discuss the implications of our results in Section 4.
2 The model
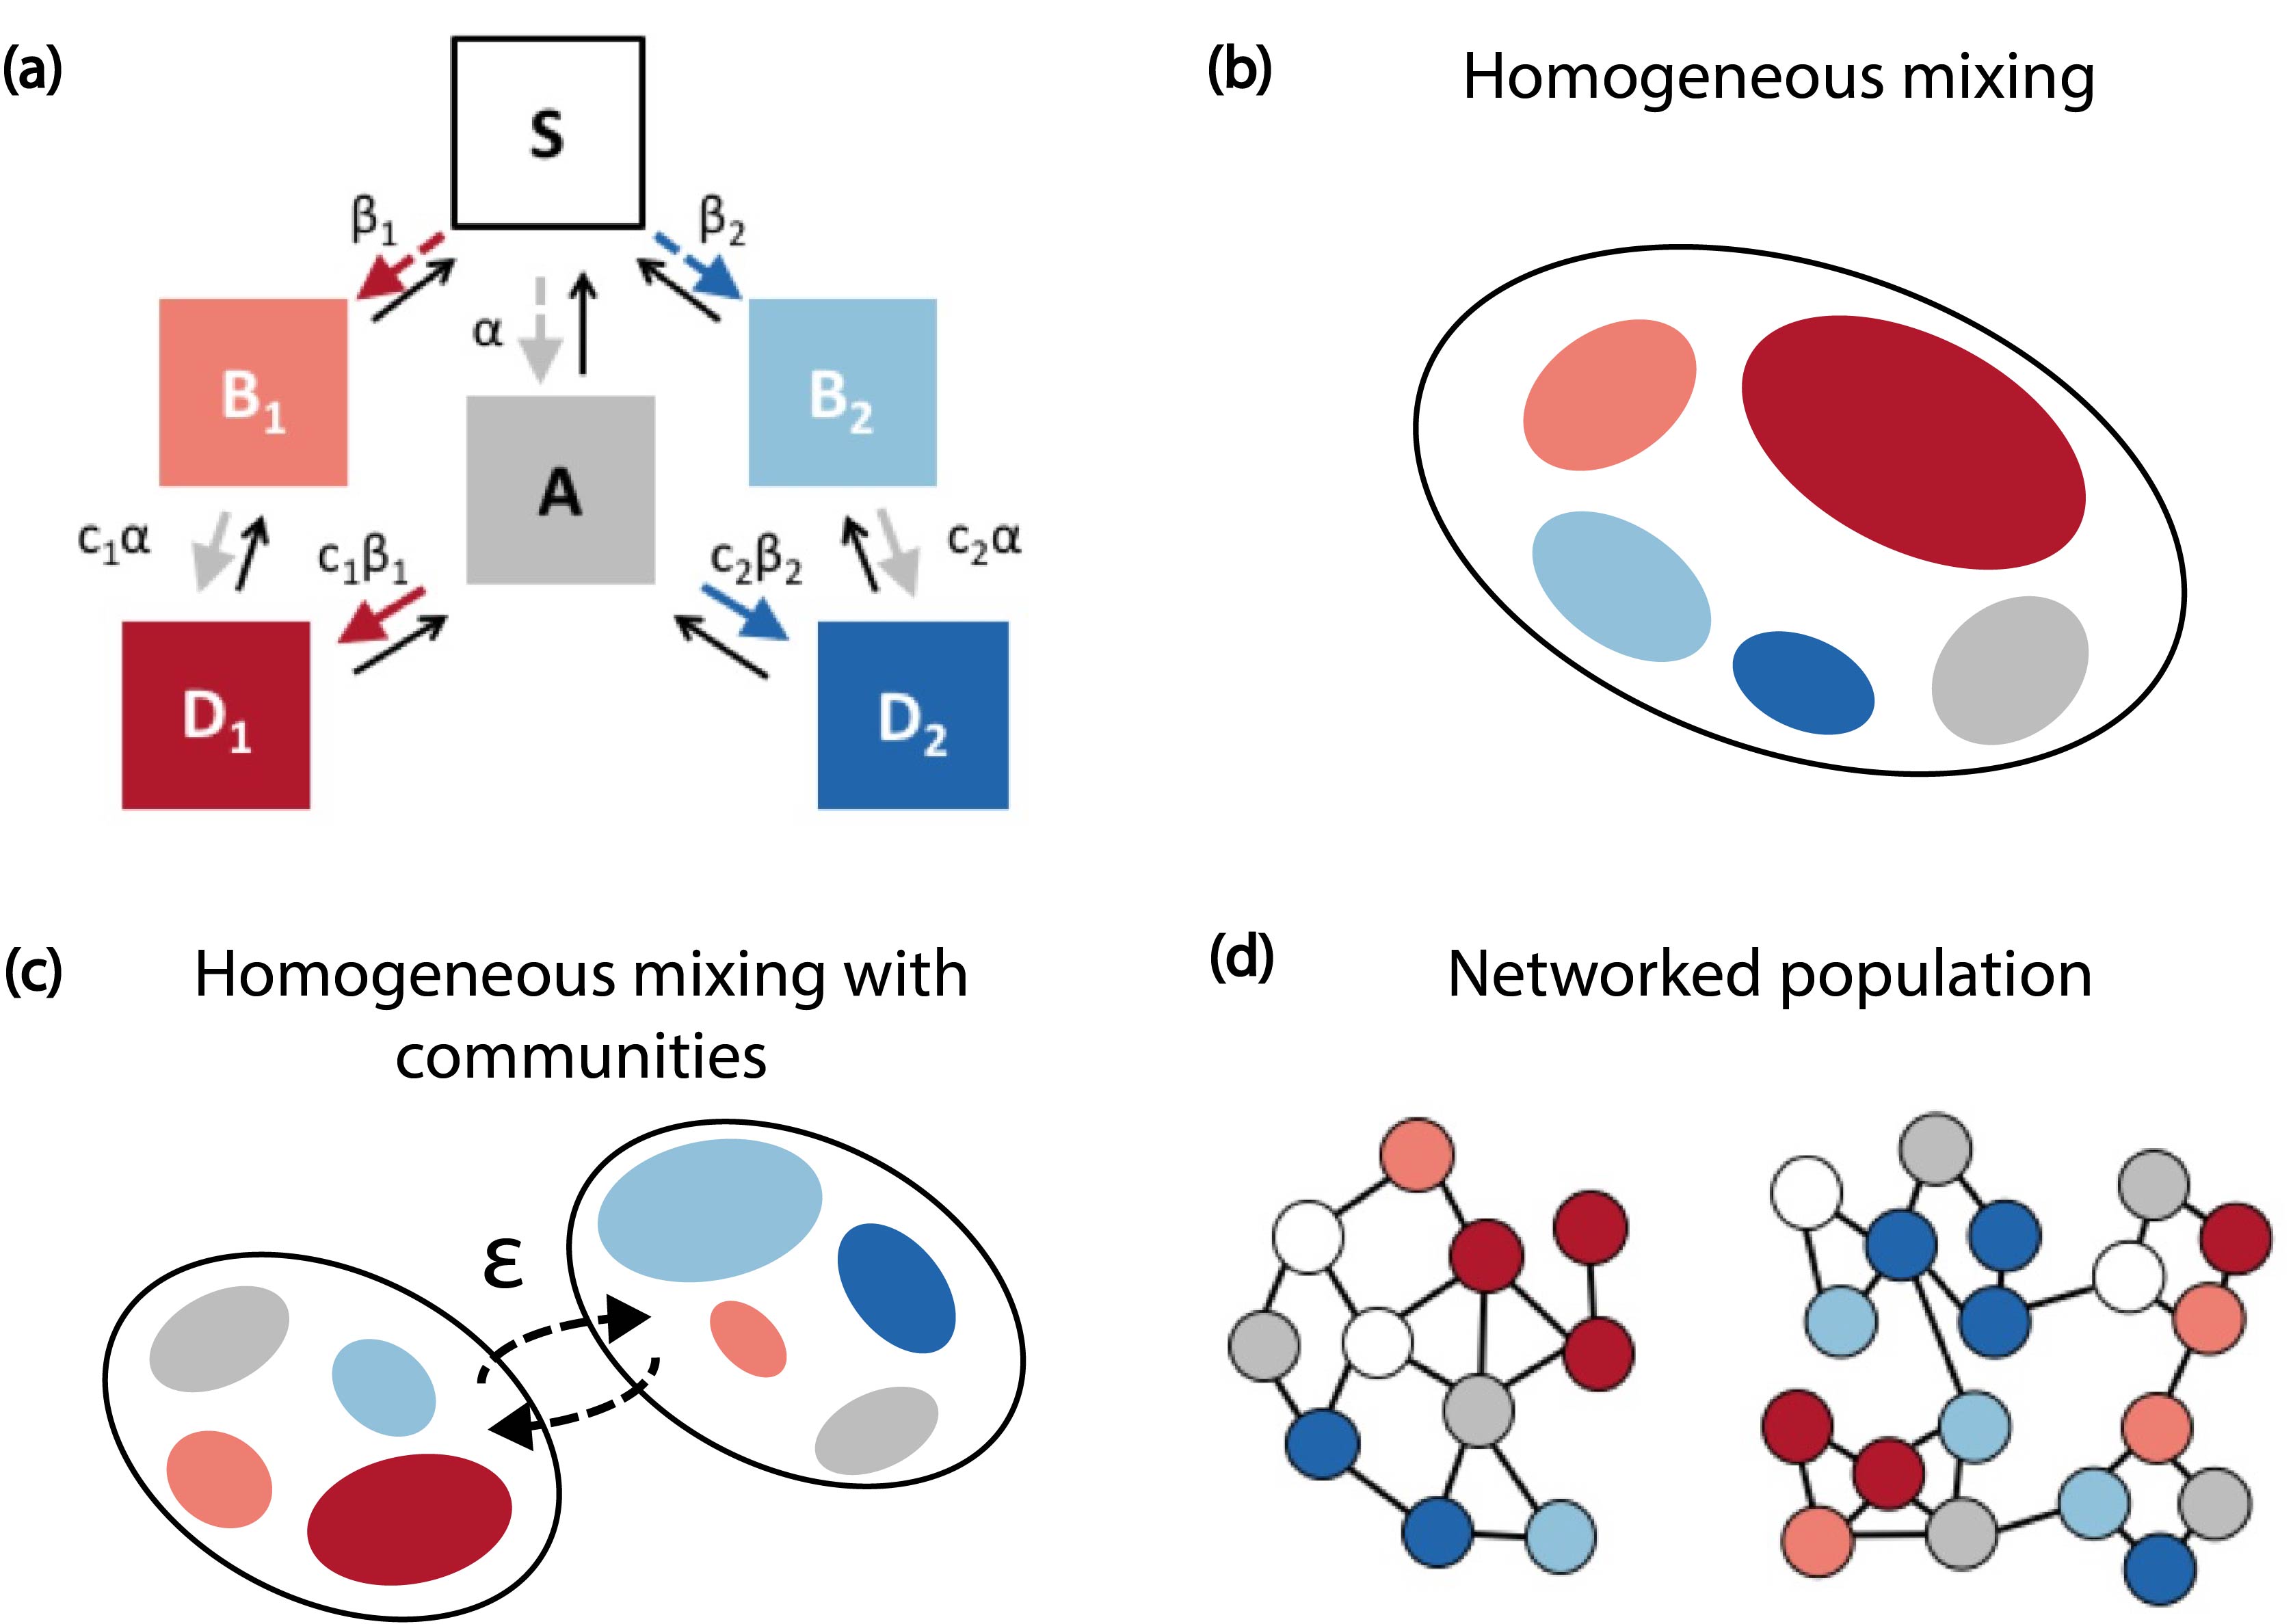
A scheme of the model is depicted in figure 1a. We considered the case in which two pathogens, and , follow susceptible-infected-susceptible dynamics, and we made the simplification that they both have the same recovery rate . and cooperate in a symmetric way through increased susceptibility, i.e. a primary infection by one of the two increases the susceptibility to a secondary infection by the other pathogen. We assumed that the cooperative interaction does not affect infectivity, thus doubly infected individuals, i.e. infected with both and , transmit both diseases at their respective infection rates. is structured in two strains, and , that compete through mutual exclusion (co-infection with and is impossible) and differ in epidemiological traits. Specifically, we denoted the infection rates for pathogens and with and (), respectively. We introduced the parameters to represent the increased susceptibility after a primary infection. In summary, individuals can be in either one of 6 states: susceptible (), singly infected (, ) and doubly infected with both and . The latter status is denoted by .
To simplify the analytical expressions we rescaled time by the average infectious period , which leads to non-dimensional equations. The basic reproductive ratios of the each player, and , become then equal to the transmission rates and , respectively. This implies that the threshold condition has to be satisfied in order for the respective player to be able to individually reach an endemic state. Assuming a homogeneously mixed population, the mean-field equations describing the spreading dynamics are:
| (1) |
where the dot indicates a differentiation with respect to time rescaled by , and quantities , , and represent occupation numbers of the compartments divided by the population. The variables , , indicate the total fractions of individuals carrying and , respectively, among the singly and doubly infected individuals. They satisfy the equations:
| (2a) | ||||
| (2b) | ||||
Without loss of generality, we considered the case in which the strain is more transmissible than , i.e. . Furthermore, we focused on the more interesting case of trade-off between transmissibility and cooperation to limit the parameter exploration: The less transmissible strain, , is more cooperative, . If is more cooperative, we expect it to win the competition. To summarize, our main assumptions are:
-
•
,
-
•
,
-
•
.
In the Results section we will first describe the dynamics arising from the deterministic equations (1). We will then consider the case in which the whole population is structured in two groups (see figure 1c). Finally, we will apply the proposed model to contact networks, where nodes represent individuals and transmission occurs through links, and consider transmission and recovery as stochastic processes. Two types of networks will be tested: Erdős-Rényi and random modular networks (see figure 1d).
3 Results
3.1 Continuous well-mixed system
We carried out a stability analysis to classify the outcome of the interaction as a function of the difference in strain epidemiological traits, and . Specifically we computed explicit analytical expressions for states’ feasibility and stability conditions in several cases. Furthermore, we performed extensive numerical simulations in cases where closed expressions were difficult to obtain. We present the overall behaviour and the main analytical results in this section and we refer to the Supplementary Material for the detailed calculations. In the following, we will use square brackets to indicate final state configurations in terms of persisting strains, thus indicates, for instance, the equilibrium configuration where both and persist, while becomes extinct.
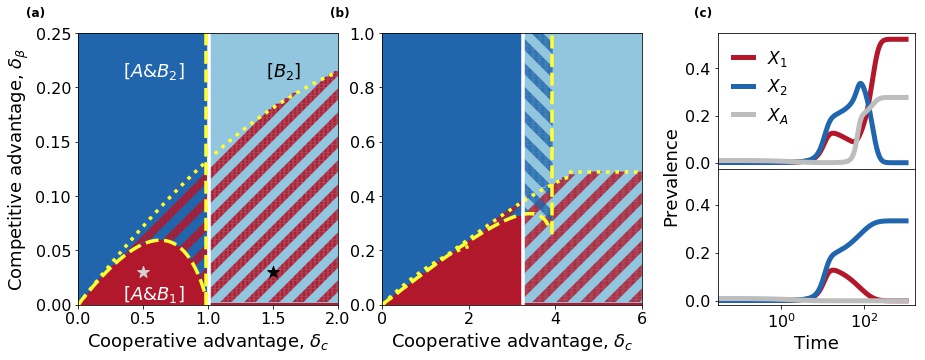
Figures 2a,b show the location of stable states with two combinations of , and . Results that are obtained for other parameter values are reported in figure S1. No co-existence was found between and . In principle, equations (1) admit a co-existence equilibrium . However, this co-existence was always found to be unstable in the numerical simulations. Persistence of is only possible together with one of the strains. The equilibrium solution is unfeasible for and unstable for , unless both reproductive ratios, , are below the epidemic threshold. Because of the assumption , outcompetes in absence of , in agreement with the principle of competitive exclusion. Therefore the final state is always unstable, and persistence of is possible only in co-circulation with . On the other hand, can spread either alone or together with . Specifically, the configuration is feasible for . It is stable if and only if , with
| (3) |
This provides a sufficient condition for the persistence of . Equation (3) can be expressed in terms of , namely , which is visualized as the white boundary in figure 2a,b.
The competition between and is governed by the trade-off between transmission and cooperative advantage. This is described by the boundaries of the regions that can be traced by combining the feasibility and stability conditions. These boundaries are plotted in figures 2a,b as dotted and dashed yellow curves for and , respectively. For a solution to be feasible the densities of all states must be non-negative. For absolute parameter values as in figure 2a,b we found that this yields the necessary condition , corresponding to the vertical and horizontal segments. On the other hand, the stability boundary separating from any state containing () is given by
| (4) |
where and are the equilibrium densities of and , respectively, evaluated in the configuration . The left-hand side of the equation represents the growth rate of the competitor , appearing in equation (2a), and evaluated in the state. Thus, the relation (4) expresses the condition for extinction. Expressed in terms of and , the conditions becomes:
| (5) | |||||
The intersection among the stability boundaries described above produces a rich state space. For all tested values of , and , we found a wide region of the space (red-hatched in figures 2a,b) displaying bistability between the state and a -dominant state with either or . In certain cases, bistability can also occur between the and states (blue-hatched region in figure 2b). This has been studied in the past for two cooperating pathogens [43]. We found that the intersection between the latter region and the red-hatched region gives rise to a multistable state.
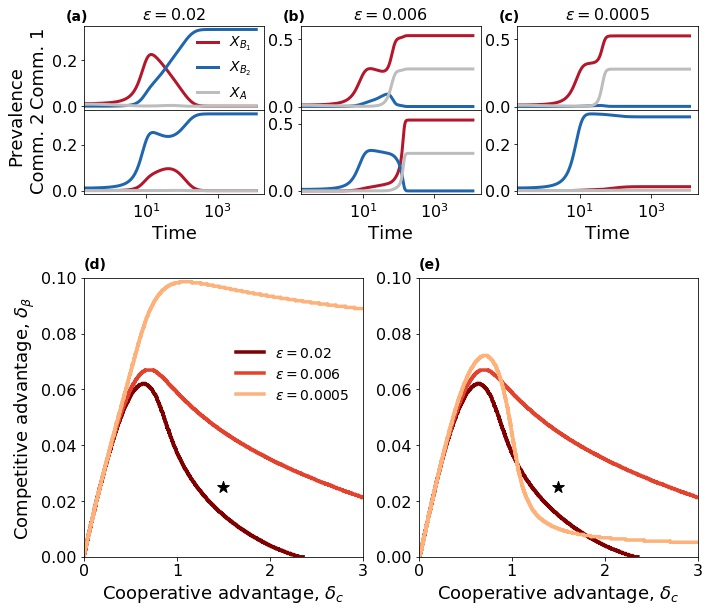
Interestingly, for all tested parameters we found that the boundary of the stability region is not monotonic. As a consequence, for a fixed a first transition from the state to is found for small values. An increase of leads to a second boundary with a bistable region, where the dominance of over depends on initial conditions. The transition for small is expected: By increasing ’s advantage in cooperation, a point is reached beyond which ’s disadvantage in transmissibility is overcome. On the other hand, the second threshold appears to be counter-intuitive. We investigated it more in depth for the case depicted in figure 2a. We plotted the infectious population curves as a function of time for each infectious compartment. We compared , which corresponds to the stable state (figure 2c top), and , which leads to a bistable region (figure 2c bottom), where all other parameters are as in figure 2a. Figure 2c shows that loses the competition at the beginning. However, when is sufficiently cooperative with (top), the rise of leads to a rise in that ultimately drives to dominate. For higher the strength of cooperation between and is not sufficient. The indirect beneficial effect of over is not present (bottom), and can dominate only if initial conditions are favourable.
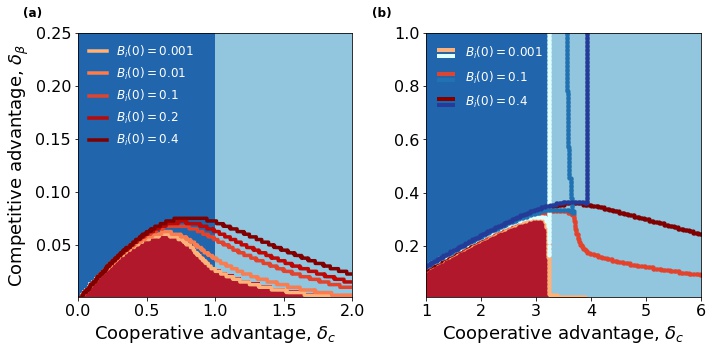
In the bistable and multi-stable regions, the outcome of the competition is determined by initial conditions. While a mathematical analysis is complicated due to the multi-dimensionality of the problem, we gained insights into the basins of attraction by numerically integrating equations (1) while exploring different combinations of and . For the bistability between the regions of and dominance, we considered the parameter combination of figure 2a and show in figure 3a the states that are reached starting from and . The bundle of curves with different shades of red (from light to dark) indicates the boundary of the equilibrium when and are equally increased. We found that an increase in ’s initial infected densities favours the state, as expected. Interestingly, however, an increase in results in the region to expand even when ’s density increases at the same level. Figure 3b shows that a similar behaviour is found when parameters are as in figure 2b. In this case, the region expands together with the one. Thus, increased initial frequencies promote co-circulation between and . In figure S2 we present a deeper exploration of initial conditions, considering the parameter combination of figure 2a as an example. We found that an increase in the initial level of also favours . However, the initial advantage (either in or ) that is necessary for to win against increases as increases.
The stability diagrams obtained with several parameter sets, explored in a latin-square fashion, is reported in figure S1. This shows that increased transmissibility and cooperativity levels enhance the cooperative interaction of strains with . This results in an increase in the parameter region for which together with dominates over . For instance, the comparison between panels (d) and (f) in the figure shows that, by increasing from 1.1 to 1.5, the same difference in strain epidemiological traits, and , may lead to a switch in dominance from to .
3.2 Continuous system with communities
We now consider a population that is divided into two communities (cf. figure 1c). For simplicity, we assumed that they are of the same size. To differentiate transmission within and across communities, we rescaled the force of infection produced by individuals of a different community by a factor , and the force of infection of individuals of the same community by . We assumed in order to consider the case in which individuals mix more within their community than outside - the limit corresponds to homogeneous mixing.
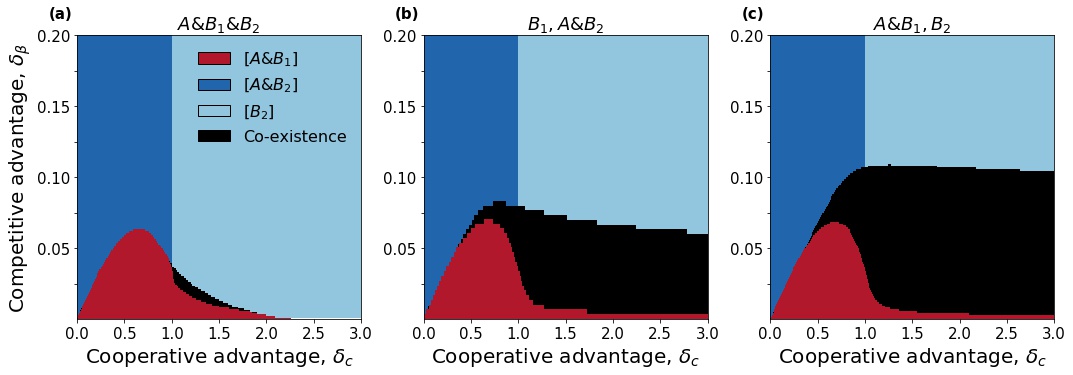
Given the high number of variables, a stability analysis is difficult in this case. Still, the dynamics can be reconstructed through numerical integration of the equations. Figure 4 shows the final states with fixed , , and . Other parameter values are analysed in figure S3. Figures 4a-c compare different seeding configurations, while keeping the initial density of each pathogen/strain to 0.01: (a) all strains are seeded in community 1 and community 2 is completely susceptible; (b) is seeded in community 1 while and are initially present in community 2 only; (c) and are seeded together in community 1, while is seeded in community 2. In all cases we found a diagram with shape similar to figure 3a. However, a new region is now present (indicated in black) where all players co-exist. This occurs when strains are separated since the beginning – see figure S4 for additional seeding configurations. Interestingly, however, this happens also for a tiny region of the parameter space, when all strains are seeded together (panel a), provided that the other community is initially disease-free.
Figure 5 sheds light on the dynamics leading to the outcomes of figure 4. In order to benefit from the cooperative advantage, the incidence must be above a certain threshold. Figures 5b,c show that incidence of remains close to zero, until incidence of is sufficiently high. With seeded on a different community (community 2), the direct interaction between the two strains is delayed by the time necessary for to reach the community of . For high the delay is short and reaches community 1 before incidence starts to raise (figure 5a). On the other hand, for lower , has enough time to build up a cooperative protection before the arrival of . This makes it resistant to the invader. At intermediate , becomes able to overcome in community 2. For small , strains spread in their origin community independently from one another.
In summary, a decrease in increases the region of persistence (figure 5d). However, this may be associated to either dominance or co-existence. Reducing the values of , the region corresponding to the state expands first and shrinks later, leaving the place to the co-existence region. This is shown by the non-monotonous change of the region in figure 5e.
When all strains start in the same community, co-existence is enabled by a segregation mechanism similar to the one described above. In this case, separation occurs during the early stage: rapidly spreads in the other community due to its advantage in transmissibility, and becomes dominant there (cf. figure S5). This enables co-existence in a parameter region where would otherwise dominate.
Results described so far were obtained with fixed values of , and . Additional parameter choices are shown in figure S3. Increasing in was found to enlarge the dominance region, as in the well-mixed case. In addition, co-existence becomes possible for in a very small region of the parameter space.
3.3 Spreading on networks
The continuous deterministic framework analysed so far does not account for stochasticity and for the discrete nature of individuals and their interactions. These aspects may alter the phase diagram and shape the transitions across various regions. We casted our model on a discrete framework in which individuals are represented by nodes in a static network. Possible individual states are still the same as in the mean-field formulation, and infection can spread only between neighbouring nodes. We first considered an Erdős-Rényi graph, where the mixing is homogeneous across nodes. Denoting the number of nodes and the average degree, the network was built by connecting any two nodes with probability . We run stochastic simulations of the dynamics. In order to see the effect of multi-pathogen interactions, we minimised the chance of initial stochastic extinction by infecting a relatively high number of nodes at the beginning: 100 infected for each infectious agent. We then computed the fraction of stochastic simulations ending up in any final state, the average prevalence for each strain (, ) in the final state and the average coexistence time. Additional details on the network model and the simulations are reported in the Supplementary Material.
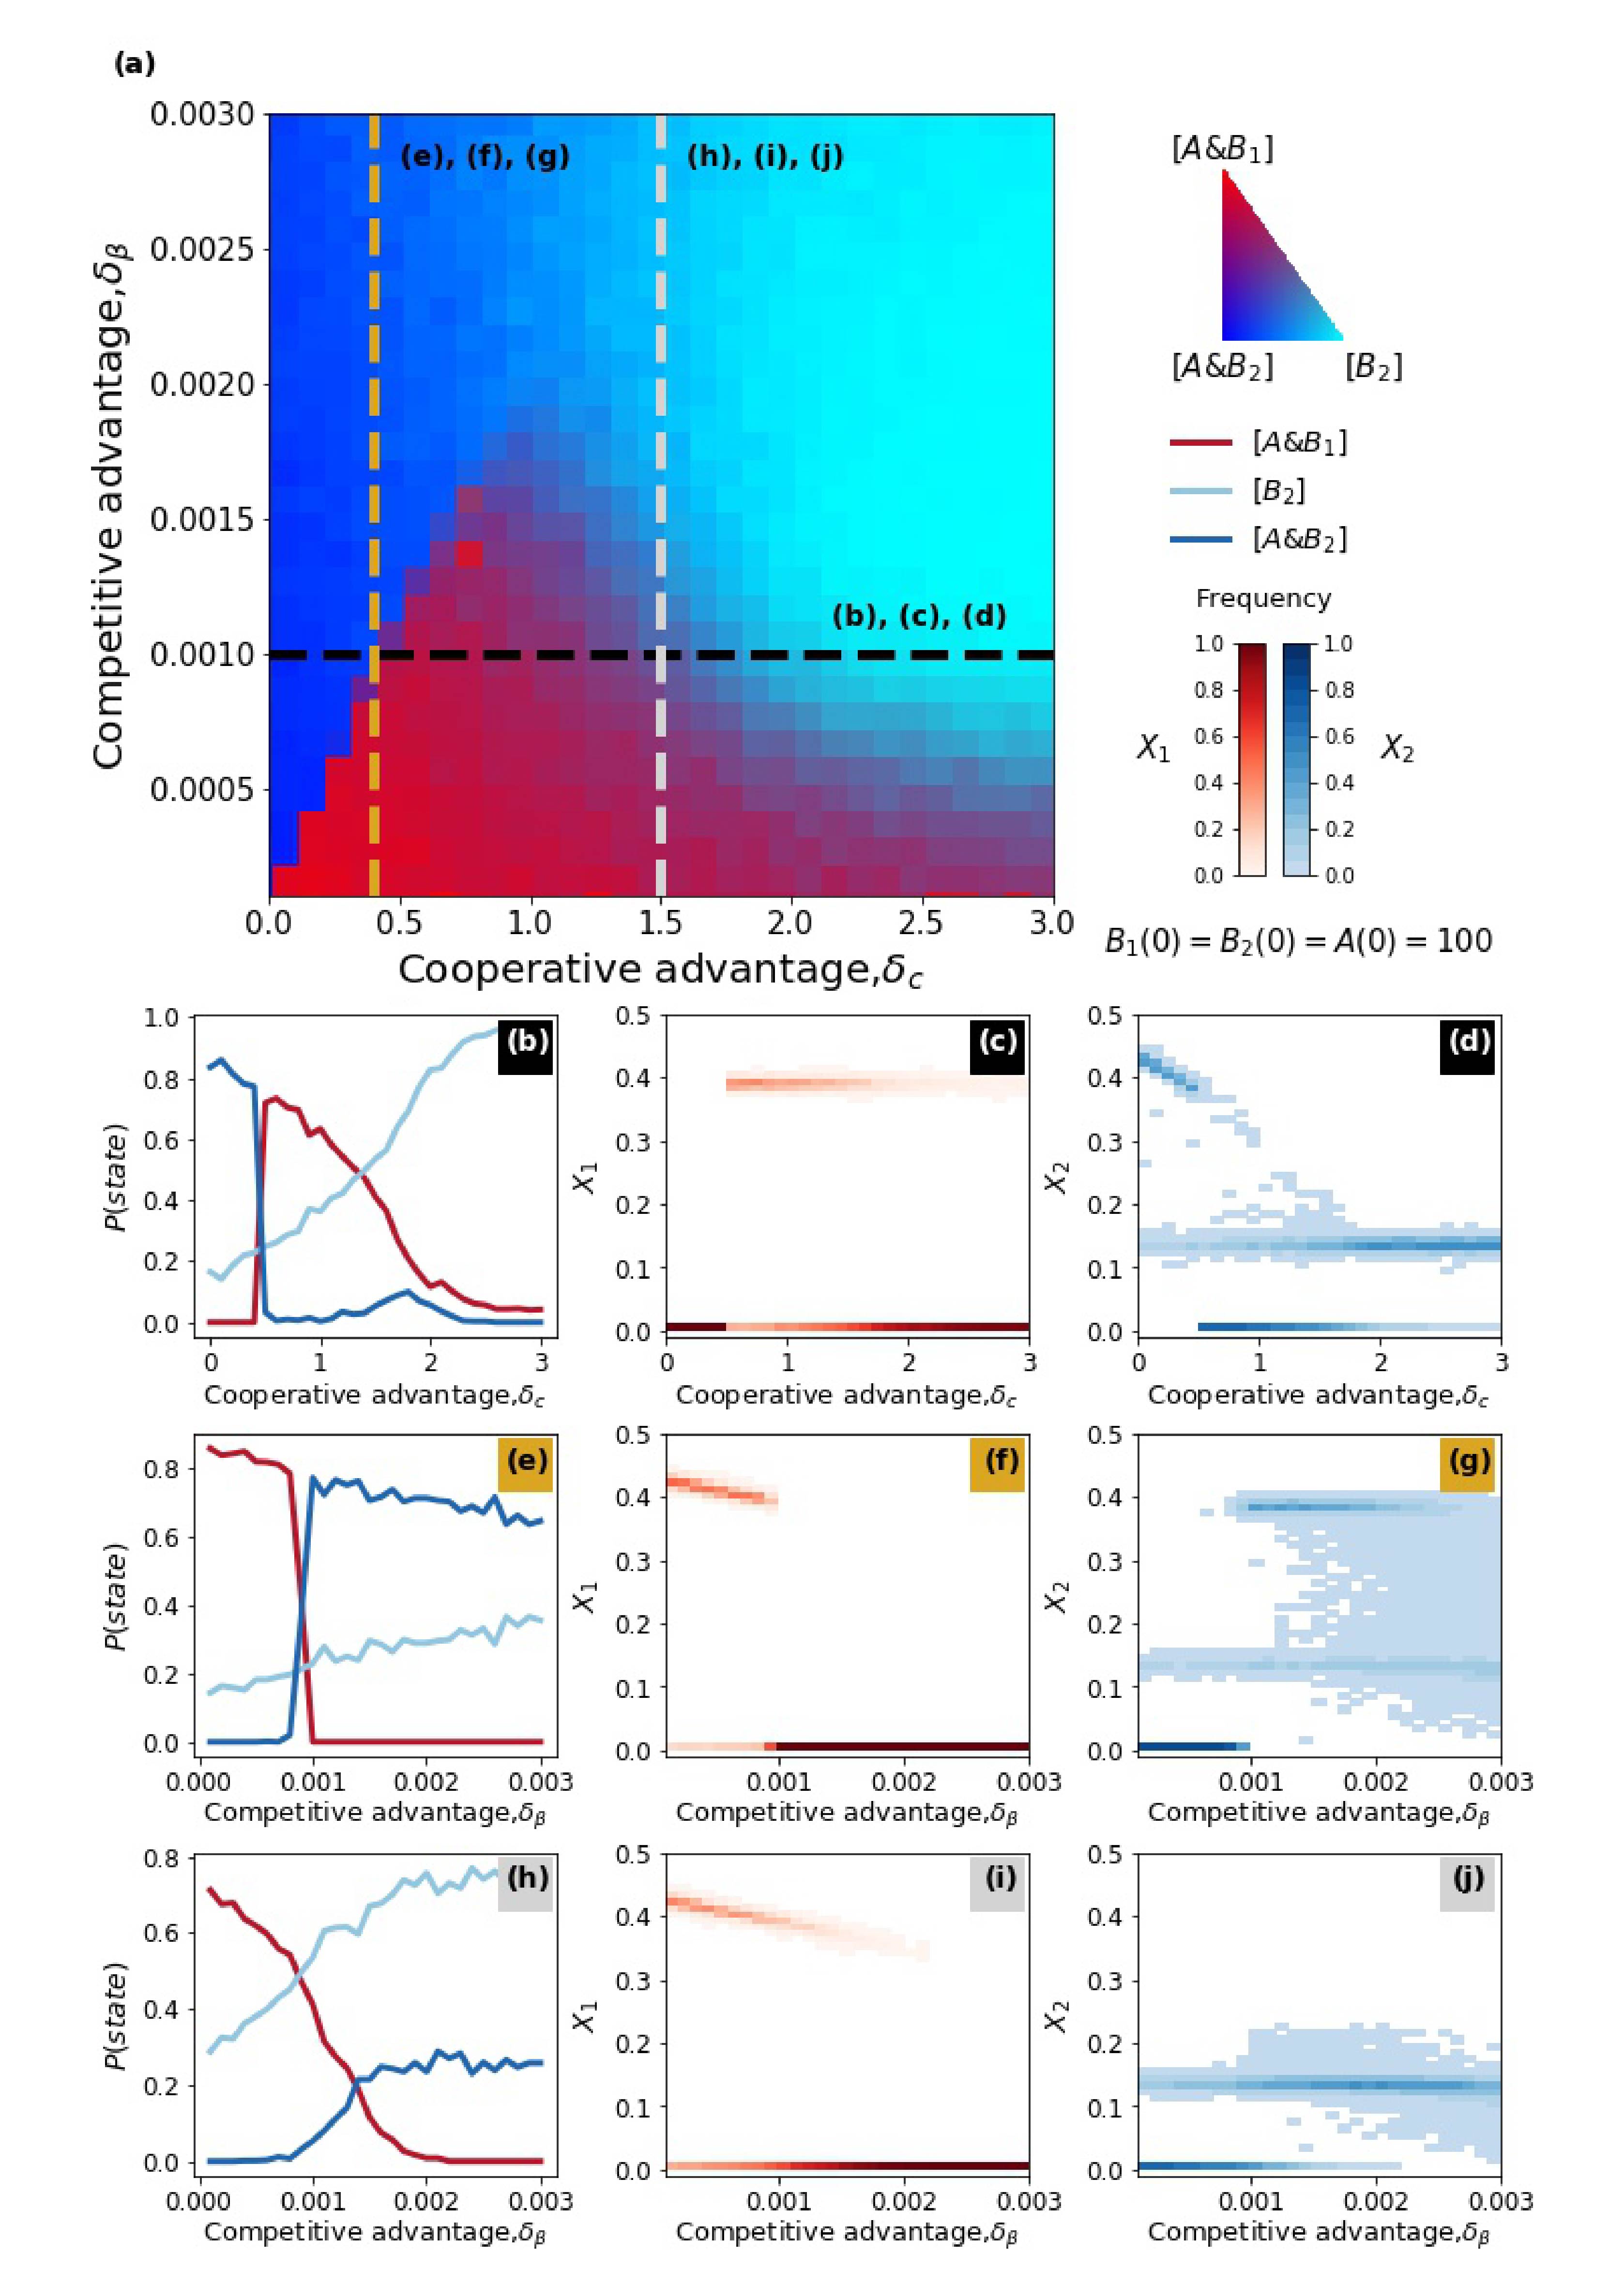
The phase diagram of figure 6a is similar in many aspects to its continuous deterministic version (figure 3a). Three final states are possible, i.e. , and (figure 6a). Here, however, the same initial conditions and parameter values can lead to different stochastic trajectories and stationary states. For instance, the red region in the figure corresponds to the case in which the final state is reached very frequently; however, the dynamic trajectories can end up also in the or in the states. The transitions across the different regions of the diagrams can be very different, as demonstrated by figures 6b-j. Panels b,c,d show the effect of varying at a fixed . The transition between and on the left is sharp. Both the probability of one strain winning over the other and the equilibrium prevalence change abruptly for a critical value of . Here, the spreading is super-critical for all pathogens: and , are sufficiently high to sustain the spread of . The transition is due to the trade-off between and growth rates. Conversely, the probability of ending up in the state rises slowly, driving the gradual transition from the red to the light blue region on the right. This region appears in correspondence of the bistable region of the continuous/deterministic diagram – figure 2. Here, undergoes a transition from persistence to extinction, driven by the drop in (figure S6). This critical regime is characterised by enhanced stochastic fluctuations. When is fixed and varies, we found a sharp transition (panels e,f,g) and a hybrid transition, where the final state probability varies gradually and the equilibrium prevalence () varies abruptly (panels h,i,j).
We concluded by analysing the effect of community structure. Each node was assigned to one among communities, which we assumed for simplicity to have equal size , and has a number of open connections drawn from a Poisson distribution with average . Links were formed by matching these connections according to an extended configuration model, where a fraction of stubs connects nodes of different communities. In this way the model is the discrete version of the one in Section 3.2.
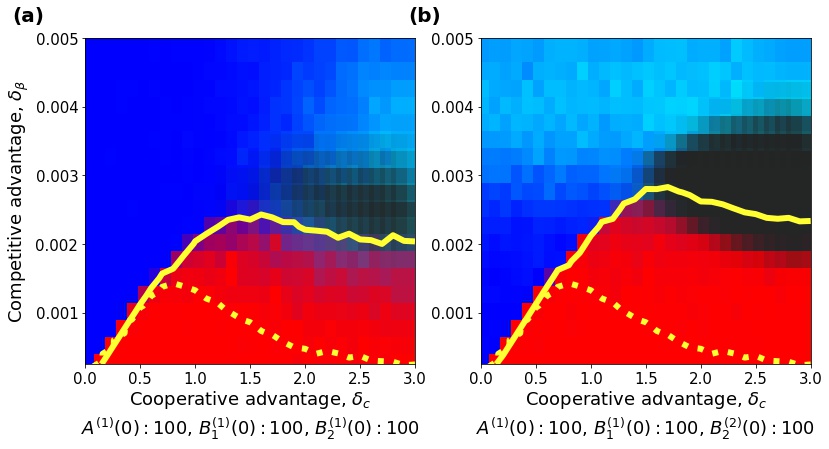
Mean-field results remain overall valid. The two plots in figure 7 mirror panels a,c of figure 4 and show a similar behaviour. We find evidence of a co-existence region (in black in the figure), where no extinction is observed during the simulation time frame - here set to time steps, around two orders of magnitude longer than the time needed to observe strain extinction in the Erdős-Rényi case. Such region is larger when the two strains are seeded in separated communities (figure 7b), but it is still visible when strains start altogether (figure 7a). Co-existence occurs less frequently in the latter case, since it requires strains to reach the separation during the spreading dynamics.
Analogously to the continuous deterministic model we found that the separation in communities favours the more cooperative strain. The region where wins is larger compared to the Erdős-Rényi case (as highlighted by the comparison between the dashed and the continuous curves). In addition, the probability of winning is close to one for a large portion of the dominance region.
4 Discussion and conclusion
We presented here a theoretical analysis of a three-player system where both competition and cooperation act simultaneously. We have considered two competing strains co-circulating in the presence of another pathogen cooperating with both of them. Strains differ in epidemiological traits, with one strain being more transmissible but less cooperative than its competitor. Through mathematical analyses and computer simulations we have reconstructed the possible dynamical regimes, quantifying the conditions for dominance of one strain or co-existence. We found that the interplay between competition and cooperation leads to a complex phase diagram whose properties cannot be easily anticipated from previous works that considered competition and cooperation separately.
We showed that it is possible for a more cooperative strain to dominate over a more transmissible one, provided that the difference in transmissibility is not too high. This suggests that the presence of another pathogen () might alter the spreading conditions, creating a favourable environment for a strain that would be otherwise less fit. While dominance depends on the difference in epidemiological traits, we found that variations in the absolute cooperation and transmissibility levels may change the hierarchy between strain – analogously to [15] – with a higher spreading potential of either or favouring the more cooperative strain.
Interestingly, the cooperative strain can dominate also when has a sub-critical reproductive ratio () – when spreading alone – and relies on the synergistic interaction with strains to persist. The dynamical mechanisms underlying this outcome are complex. We analysed a case with a small difference in cooperativity, and we found that the more transmissible strain, by spreading initially faster, creates the bulk of infections that in turn favour its competitor. In other words, direct competition for susceptible hosts is not the only force acting between strains: an indirect, beneficial interaction is also at play, mediated by the other pathogen. The dominance outcome is thus the result of the trade-off between these two forces. When the difference in cooperation is higher, two or more stationary configurations are possible. In this scenario, the final outcome is determined also by the initial frequency of each pathogen/strain. We found that, in certain situations, an initial advantage of one strain is able to drive it to dominance. This is in contrast with simpler models of competition, where the final outcome is determined solely by the epidemiological traits. The outcome, however, is also governed by pathogen that favours the more cooperative strain. Previous works have analysed multistability in two-pathogen models with cooperation in relation to the hysteresis phenomenon, where the eradication threshold is lower than the epidemic one [43, 39, 42]. A similar mechanism could be at play here. However, the identification of hysteresis loops requires a better reconstruction of the attraction basins. While the numerical work presented here provided some preliminary understanding, a deeper mathematical analysis would be needed in this direction. Multistability is, instead, not present in two-pathogen models with complete mutual exclusion. This dynamical feature emerges, however, in the more general case where strains are allowed to interact upon co-infection [15].
While we did not find stable co-existence among strains in the well-mixed system, co-existence was possible in presence of community structure. In this case, strains can minimise competition for hosts through segregation. Importantly, spatial separation alone is not sufficient to enable co-existence between two strains, when complete mutual exclusion is assumed. This was already known from previous works that showed that community structure must be combined with some level of heterogeneity across communities to enable co-existence, e.g. a strain-specific adaptation to a population or environment to create an ecological niche [37, 35, 46, 47, 48]. Here, communities are homogeneous and co-existence is the result of the interplay between community structure and presence of the cooperative pathogen. When the two strains are seeded in different communities, their interaction occurs after the time lag necessary for one strain to invade the other community. We found that this interval may allow the resident strain to reach the bulk of infections necessary to fend off the invasion. This mechanism is rooted again in the effect of pathogens’ frequencies on strain selective advantage. The drivers of strains’ co-existence remain an important problem in disease ecology with applications to both vaccination and emergence of anti-microbial resistance. Within-host and population factors have been studied in the past by several modelling investigations. Notably, while co-existence is not possible in models with complete mutual exclusion, this may be enabled in co-infection models [15, 49, 16, 17, 18]. Other models have addressed environmental and host population features, such as age-structure, contacts dynamics and spatial organisation [19, 20, 21, 36]. However, little attention has been dedicated to the effect of an additional co-circulating pathogen. Cobey et al. studied the interaction between Haemophilus influenzae and S. pneumoniae co-circulating strains [50]. Despite the numerous differences between our model and theirs, their work provides results consistent with ours. Namely, the multi-strain dynamics can be affected by another pathogen.
We simulated the three-player dynamics on networks and we obtained phase diagrams that are similar to the continuous-deterministic counterparts. The discrete/stochastic framework, however, allows for observing the nature of the phase transitions. Several works recently studied the nature of the epidemic transition for two cooperating pathogens, highlighting differences with the single-pathogen case. Cooperation was found to cause discontinuous transitions where the probability of an outbreak and prevalence change abruptly around a critical value of the transmission rate [40, 43], akin to other complex contagion mechanisms such as the ones found in social contagion [51, 52]. This phenomenon, however, is sensitive to the network topology, with continuous, discontinuous and hybrid, i.e. continuous in the outbreak probability and discontinuous in the prevalence, transitions observed according to the topology of the network [40, 43, 39, 42, 53, 54, 55]. Here we found rich dynamics as the impact of stochastic effects. These effects were less important when the difference between strains’ epidemiological traits was small. Conversely, for a higher difference in cooperative factor different outcomes are equally probable. Results presented here are preliminary and limited to two network configurations. Future work should investigate additional network topologies, e.g. a power-law degree distribution, and further values of the network parameters. In addition, more sophisticated numerical analysis (e.g. scaling analysis) would be needed to better classify the nature of the phase transitions.
Concurrence of inter-species cooperation and intra-specie competition is present in many epidemiological situations. Currently, around 90 distinct S. pneumoniae serotypes are known to co-circulate worldwide, despite indirect competition mediated by host immune response [4]. The emergence of antibiotic-resistant strains and the development of vaccines able to target only a subset of strains has motivated extensive research on the drivers of S. pneumoniae ecology [4, 20, 5]. Strain circulation is facilitated by respiratory infections, e.g. influenza [56, 57] and some bacterial infections [11, 12]. Cooperative behaviour has been observed also between HIV and infections such as HPV, tuberculosis and malaria [9, 10, 58, 1, 59]. This increases the burden of these pathogens and causes public health concern. At the same time, there is evidence that different strains of tuberculosis [2, 60], malaria [3], and HPV [61, 62, 63] may compete. In particular, multidrug-resistant strains of tuberculosis (MDR-TB) are widely spread, although the acquisition of resistance seems to be associated to a fitness cost [59, 64]. The synergistic interaction with HIV could play a role in this emergence and surveillance data suggest a possible convergence between HIV and MDR-TB epidemics in several countries [59]. Our theoretical work highlights ecological mechanisms potentially relevant to these examples. In this regard, an essential aspect of our model is the trade-off between transmissibility and cooperativity in determining strain advantage. Although differences in transmissibility across strains have been documented, e.g. fitness cost of resistance [65], gathering information on strain-specific cooperative advantage remains difficult. The theoretical results illustrated here show the importance of quantifying this component for better describing pathogen ecosystems.
This study also represents the starting point of more complex models where multiple strains are involved and competition and cooperation are acting simultaneously. Patterns of competitive and cooperative interactions could be at play for instance among recently emerged pathogens such as Zika virus [66]. Zika virus has emerged in regions where Dengue and Chikungunya viruses are endemic. Observed patterns of sequential monodominance by one arbovirus at a time at a given location suggest competition between these pathogens [67]. Also, considerable effort is currently devoted to characterising possible positive interactions between Zika virus and HIV [66]. In some cases, different strains of the same pathogen can interact both competitively and cooperatively, as in the case of Dengue [8, 14]. Primary Dengue infections are characterised by mild symptoms and grant short-term cross-protection against other serotypes. As cross-immunity wanes over time, however, secondary Dengue infections not only become possible but are also associated with severe illness and with increased virulence.
The examples above involve diseases with varying natural history and time scales and should be modelled with different compartmental models – SIR, SI, SIS, SIRS. We decided here to consider two SIS pathogens and the results cannot be readily extended to other models, since the dynamics of disease unfolding alters the outcome of strain interactions. It is important to notice, however, that several dynamical properties of competitive and cooperative interactions, such as dominance vs. co-existence [27] and abrupt transitions [68, 69, 70], hold for both SIS and SIR.
The model studied here is based on certain simplifications. All pathogens are assumed to have the same recovery rate; moreover, cooperation acts in both directions and the same factors quantify the enhancement in susceptibility when infection occurs before infection and vice versa. These assumptions may not hold for many synergistic pathogens, especially when cooperative benefits are based on different biological mechanisms. For instance, while HIV increases susceptibility against P. falciparum, the latter increases HIV’s viral load, thus increasing HIV’s virulence rather than host susceptibility to HIV [10, 58]. It is likely that, by relaxing these assumptions, our model could exhibit even more complex phase diagrams. Eventually, other aspects of the disease-specific mechanisms and multi-pathogen interactions could affect the results presented here and should be addressed in future works. These include latent infections, which are characteristic, for instance, of tuberculosis [2], partial mutual exclusion among strains [2, 6, 15, 16], or interaction mechanisms other than the ones introduced here (e.g. affecting the infectious period [24]).
In conclusion, we have provided a theoretical study of a dynamical system where both competition and cooperation are at play. We found that a less transmissible and more cooperative strain may dominate; however, the conditions on the parameters for this to happen are non-trivial (non-monotonic) and the outcome critically depends on initial conditions and stochastic effects. When coupled with population structure, the presence of a cooperative pathogen may create the conditions for multi-strain co-existence by dynamically breaking the spatial symmetry and creating ecological niches. These results provide novel ecological insights and suggest mechanisms that may potentially affect the dynamics of interacting epidemics that are of public health concern.
Data availability
The python code used for the mean-field analyses and the C++ code for the stochastic simulations on networks are publicly available at the following link:
https://github.com/francescopinotti92/Competition-Cooperation.
Authors’ contributions
FP, FGh, PH, CP conceived and designed the study. FP carried out the analyses. FP, FGh, PH, CP analysed the results. FP, FGh, PH, CP contributed to the writing of the manuscript and approved the final version.
Competing interests
The authors declare no competing interests.
Funding
FP acknowledges support by Pierre Louis Doctoral School of Public Health. FGh and PH acknowledge support by German Academic Exchange Service (DAAD) within the PPP-PROCOPE framework (grand no. 57389088). CP and FP acknowledge support by the Partenariats Hubert Curien within the PPP-PROCOPE (grand no. 35473TK). FGh acknowledges partial support by Deutsche Forschungsgemeinschaft (DFG) under the grant GH 176/1-1 (idonate project: 345463468). PH acknowledges further support by DFG in the framework of Collaborative Research Center 910 (grand no. SFB910). CP acknowledges support from the municipality of Paris through the program Emergence(s).
Research ethics
This section does not apply to this study.
Animal ethics
This section does not apply to this study.
Permission to carry out fieldwork
This section does not apply to this study.
Acknowledgements
We thank Andrew Keane for helpful discussions that made the manuscript more accessible.
References
- [1] Jeffrey A. Tornheim and Kelly E. Dooley. Tuberculosis Associated with HIV Infection. Microbiol. Spectr., 5(1):UNSP TNMI7–0028–2016, February 2017. WOS:000397274600026.
- [2] Ted Cohen, Caroline Colijn, and Megan Murray. Modeling the effects of strain diversity and mechanisms of strain competition on the potential performance of new tuberculosis vaccines. Proceedings of the National Academy of Sciences of the United States of America, 105(42):16302–16307, October 2008.
- [3] Kexuan Chen, Ling Sun, Yingxue Lin, Qi Fan, Zhenjun Zhao, Mingming Hao, Guohua Feng, Yanrui Wu, Liwang Cui, and Zhaoqing Yang. Competition between Plasmodium falciparum strains in clinical infections during in vitro culture adaptation. Infect Genet Evol, 24:105–110, June 2014.
- [4] Sarah Cobey and Marc Lipsitch. Niche and Neutral Effects of Acquired Immunity Permit Coexistence of Pneumococcal Serotypes. Science, 335(6074):1376–1380, March 2012.
- [5] Lulla Opatowski, Emmanuelle Varon, Claire Dupont, Laura Temime, Sylvie van der Werf, Laurent Gutmann, Pierre-Yves Boëlle, Laurence Watier, and Didier Guillemot. Assessing pneumococcal meningitis association with viral respiratory infections and antibiotics: insights from statistical and mathematical models. Proceedings. Biological Sciences, 280(1764):20130519, August 2013.
- [6] Thomas Obadia, Romain Silhol, Lulla Opatowski, Laura Temime, Judith Legrand, Anne C. M. Thiébaut, Jean-Louis Herrmann, Éric Fleury, Didier Guillemot, Pierre-Yves Boëlle, and on behalf of the I.-Bird Study Group. Detailed Contact Data and the Dissemination of Staphylococcus aureus in Hospitals. PLOS Computational Biology, 11(3):e1004170, March 2015.
- [7] Tjibbe Donker, Sandra Reuter, James Scriberras, Rosy Reynolds, Nicholas M. Brown, M. Estée Török, Richard James, East of England Microbiology Research Network, David M. Aanensen, Stephen D. Bentley, Matthew T. G. Holden, Julian Parkhill, Brian G. Spratt, Sharon J. Peacock, Edward J. Feil, and Hajo Grundmann. Population genetic structuring of methicillin-resistant Staphylococcus aureus clone EMRSA-15 within UK reflects patient referral patterns. Microbial Genomics, 3(7), 2017.
- [8] Nicholas G. Reich, Sourya Shrestha, Aaron A. King, Pejman Rohani, Justin Lessler, Siripen Kalayanarooj, In-Kyu Yoon, Robert V. Gibbons, Donald S. Burke, and Derek A. T. Cummings. Interactions between serotypes of dengue highlight epidemiological impact of cross-immunity. Journal of The Royal Society Interface, 10(86):20130414, September 2013.
- [9] Katharine J. Looker, Minttu M. Rönn, Patrick M. Brock, Marc Brisson, Melanie Drolet, Philippe Mayaud, and Marie-Claude Boily. Evidence of synergistic relationships between HIV and Human Papillomavirus (HPV): systematic reviews and meta-analyses of longitudinal studies of HPV acquisition and clearance by HIV status, and of HIV acquisition by HPV status. Journal of the International AIDS Society, 21(6):e25110, 2018.
- [10] Cheryl Cohen, Alan Karstaedt, John Frean, Juno Thomas, Nelesh Govender, Elizabeth Prentice, Leigh Dini, Jacky Galpin, and Heather Crewe-Brown. Increased Prevalence of Severe Malaria in HIV-Infected Adults in South Africa. Clin Infect Dis, 41(11):1631–1637, December 2005.
- [11] Astrid A. T. M. Bosch, Giske Biesbroek, Krzysztof Trzcinski, Elisabeth A. M. Sanders, and Debby Bogaert. Viral and Bacterial Interactions in the Upper Respiratory Tract. PLOS Pathogens, 9(1):e1003057, January 2013.
- [12] Eileen M. Dunne, Heidi C. Smith-Vaughan, Roy M. Robins-Browne, E. Kim Mulholland, and Catherine Satzke. Nasopharyngeal microbial interactions in the era of pneumococcal conjugate vaccination. Vaccine, 31(19):2333–2342, May 2013.
- [13] Pejman Rohani Matt J. Keeling. Modeling Infectious Diseases in Humans and Animals. Princeton University Press, 2008.
- [14] Sourya Shrestha, Aaron A. King, and Pejman Rohani. Statistical Inference for Multi-Pathogen Systems. PLOS Computational Biology, 7(8):e1002135, 2011.
- [15] Erida Gjini and Sten Madec. A slow-fast dynamic decomposition links neutral and non-neutral coexistence in interacting multi-strain pathogens. Theoretical Ecology, 10(1):129–141, March 2017.
- [16] Mircea T. Sofonea, Samuel Alizon, and Yannis Michalakis. From within-host interactions to epidemiological competition: a general model for multiple infections. Philosophical Transactions of the Royal Society B: Biological Sciences, 370(1675):20140303, August 2015.
- [17] Samuel Alizon. Co-infection and super-infection models in evolutionary epidemiology. Interface Focus, 3(6), December 2013.
- [18] Samuel Alizon, Jacobus C. de Roode, and Yannis Michalakis. Multiple infections and the evolution of virulence. Ecology Letters, 16(4):556–567, April 2013.
- [19] Maia Martcheva, Sergei S. Pilyugin, and Robert D. Holt. Subthreshold and superthreshold coexistence of pathogen variants: the impact of host age-structure. Math Biosci, 207(1):58–77, May 2007.
- [20] Sarah Cobey, Edward B. Baskerville, Caroline Colijn, William Hanage, Christophe Fraser, and Marc Lipsitch. Host population structure and treatment frequency maintain balancing selection on drug resistance. Journal of The Royal Society Interface, 14(133):20170295, August 2017.
- [21] Ken T. D. Eames and Matt J. Keeling. Coexistence and specialization of pathogen strains on contact networks. Am. Nat., 168(2):230–241, August 2006.
- [22] Joel C. Miller. Co-circulation of infectious diseases on networks. Phys Rev E Stat Nonlin Soft Matter Phys, 87(6):060801, June 2013.
- [23] Faryad Darabi Sahneh and Caterina Scoglio. Competitive epidemic spreading over arbitrary multilayer networks. Phys. Rev. E, 89(6):062817, June 2014.
- [24] Joaquín Sanz, Cheng-Yi Xia, Sandro Meloni, and Yamir Moreno. Dynamics of Interacting Diseases. Phys. Rev. X, 4(4):041005, October 2014.
- [25] Jia Li, Zhien Ma, Steve P. Blythe, and Carlos Castillo-Chavez. Coexistence of pathogens in sexually-transmitted disease models. J. Math. Biol., 47(6):547–568, December 2003.
- [26] Caichun Chai and Jifa Jiang. Competitive Exclusion and Coexistence of Pathogens in a Homosexually-Transmitted Disease Model. PLOS ONE, 6(2):e16467, February 2011.
- [27] Brian Karrer and M. E. J. Newman. Competing epidemics on complex networks. Phys. Rev. E, 84(3):036106, September 2011.
- [28] Naoki Masuda and Norio Konno. Multi-state epidemic processes on complex networks. Journal of Theoretical Biology, 243(1):64–75, November 2006.
- [29] Gabriel E. Leventhal, Alison L. Hill, Martin A. Nowak, and Sebastian Bonhoeffer. Evolution and emergence of infectious diseases in theoretical and real-world networks. Nature Communications, 6:6101, January 2015.
- [30] Caroline O’F Buckee, Katia Koelle, Matthew J. Mustard, and Sunetra Gupta. The effects of host contact network structure on pathogen diversity and strain structure. PNAS, 101(29):10839–10844, July 2004.
- [31] Francesco Pinotti, Éric Fleury, Didier Guillemot, Pierre-Yves Böelle, and Chiara Poletto. Host contact dynamics shapes richness and dominance of pathogen strains. PLOS Computational Biology, 15(5):e1006530, May 2019.
- [32] David Soriano-Paños, Fakhteh Ghanbarnejad, Sandro Meloni, and Jesús Gómez-Gardeñes. Markovian approach to tackle the interaction of simultaneous diseases. arXiv:1907.06389 [physics, q-bio], July 2019. arXiv: 1907.06389.
- [33] Chiara Poletto, Sandro Meloni, Vittoria Colizza, Yamir Moreno, and Alessandro Vespignani. Host Mobility Drives Pathogen Competition in Spatially Structured Populations. PLOS Computational Biology, 9(8):e1003169, 2013.
- [34] Chiara Poletto, Sandro Meloni, Ashleigh Van Metre, Vittoria Colizza, Yamir Moreno, and Alessandro Vespignani. Characterising two-pathogen competition in spatially structured environments. Scientific Reports, 5:7895, January 2015.
- [35] Linda J. S. Allen, Nadarajah Kirupaharan, and Sherri M. Wilson. SIS Epidemic Models with Multiple Pathogen Strains. Journal of Difference Equations and Applications, 10(1):53–75, January 2004.
- [36] Caroline Buckee, Leon Danon, and Sunetra Gupta. Host community structure and the maintenance of pathogen diversity. Proceedings of the Royal Society of London B: Biological Sciences, 274(1619):1715–1721, July 2007.
- [37] Yixiang Wu, Necibe Tuncer, and Maia Martcheva. Coexistence and competitive exclusion in an SIS model with standard incidence and diffusion, December 2016.
- [38] S. Lion and S. Gandon. Spatial evolutionary epidemiology of spreading epidemics. Proceedings. Biological Sciences, 283(1841), 2016.
- [39] Weiran Cai, Li Chen, Fakhteh Ghanbarnejad, and Peter Grassberger. Avalanche outbreaks emerging in cooperative contagions. Nature Physics, 11(11):936–940, November 2015.
- [40] Laurent Hébert-Dufresne and Benjamin M. Althouse. Complex dynamics of synergistic coinfections on realistically clustered networks. PNAS, 112(33):10551–10556, August 2015.
- [41] Deokjae Lee, Wonjun Choi, J. Kertész, and B. Kahng. Universal mechanism for hybrid percolation transitions. Scientific Reports, 7(1):5723, July 2017.
- [42] Peng-Bi Cui, Francesca Colaiori, and Claudio Castellano. Mutually cooperative epidemics on power-law networks. Phys. Rev. E, 96(2):022301, August 2017.
- [43] Li Chen, Fakhteh Ghanbarnejad, and Dirk Brockmann. Fundamental properties of cooperative contagion processes. New J. Phys., 19(10):103041, 2017.
- [44] Jorge P. Rodríguez, Yu-Hao Liang, Yu-Jhe Huang, and Jonq Juang. Diversity of hysteresis in a fully cooperative coinfection model. Chaos, 28(2):023107, February 2018.
- [45] Jorge P. Rodríguez, Fakhteh Ghanbarnejad, and Víctor M. Eguíluz. Risk of Coinfection Outbreaks in Temporal Networks: A Case Study of a Hospital Contact Network. Frontiers in Physics, 5, 2017.
- [46] Zhilan Feng, Ronsong Liu, Zhipeng Qiu, Joaquin Rivera, and Abdul-Aziz Yakubu. Coexistence of competitors in deterministic and stochastic patchy environments. Journal of Biological Dynamics, 5(5):454–473, September 2011.
- [47] Zhipeng Qiu, Qingkai Kong, Xuezhi Li, and Maia Martcheva. The vector–host epidemic model with multiple strains in a patchy environment. Journal of Mathematical Analysis and Applications, 405(1):12–36, September 2013.
- [48] Kuang-Hui Lin, Yuan Lou, Chih-Wen Shih, and Tze-Hung Tsai. Global dynamics for two-species competition in patchy environment, March 2014.
- [49] Erida Gjini, Carina Valente, Raquel Sá-Leão, and M. Gabriela M. Gomes. How direct competition shapes coexistence and vaccine effects in multi-strain pathogen systems. Journal of Theoretical Biology, 388:50–60, January 2016.
- [50] Sarah Cobey and Marc Lipsitch. Pathogen diversity and hidden regimes of apparent competition. Am Nat, 181(1):12–24, January 2013.
- [51] J. Gómez-Gardeñes, L. Lotero, S. N. Taraskin, and F. J. Pérez-Reche. Explosive Contagion in Networks. Scientific Reports, 6:19767, January 2016.
- [52] Peter Sheridan Dodds and Duncan J. Watts. Universal Behavior in a Generalized Model of Contagion. Physical Review Letters, 92(21):218701, May 2004.
- [53] Wei Wang, Quan-Hui Liu, Junhao Liang, Yanqing Hu, and Tao Zhou. Coevolution spreading in complex networks. arXiv:1901.02125 [physics], January 2019. arXiv: 1901.02125.
- [54] Jorge P. Rodríguez, Fakhteh Ghanbarnejad, and Víctor M. Eguíluz. Particle velocity controls phase transitions in contagion dynamics. Scientific Reports, 9(1):1–9, April 2019.
- [55] Wonjun Choi, Deokjae Lee, J. Kertész, and B. Kahng. Two golden times in two-step contagion models: A nonlinear map approach. Phys. Rev. E, 98(1):012311, July 2018.
- [56] Sourya Shrestha, Betsy Foxman, Daniel M. Weinberger, Claudia Steiner, Cécile Viboud, and Pejman Rohani. Identifying the interaction between influenza and pneumococcal pneumonia using incidence data. Sci Transl Med, 5(191):191ra84, June 2013.
- [57] Lulla Opatowski, Marc Baguelin, and Rosalind M. Eggo. Influenza interaction with cocirculating pathogens and its impact on surveillance, pathogenesis, and epidemic profile: A key role for mathematical modelling. PLOS Pathogens, 14(2):e1006770, February 2018.
- [58] Laith J. Abu-Raddad, Padmaja Patnaik, and James G. Kublin. Dual infection with HIV and malaria fuels the spread of both diseases in sub-Saharan Africa. Science, 314(5805):1603–1606, December 2006.
- [59] Charles D. Wells, J. Peter Cegielski, Lisa J. Nelson, Kayla F. Laserson, Timothy H. Holtz, Alyssa Finlay, Kenneth G. Castro, and Karin Weyer. HIV infection and multidrug-resistant tuberculosis: the perfect storm. The Journal of Infectious Diseases, 196 Suppl 1:S86–107, August 2007.
- [60] D. W. Dowdy, C. Dye, and T. Cohen. Data needs for evidence-based decisions: a tuberculosis modeler’s ’wish list’. Int. J. Tuberc. Lung Dis., 17(7):866–877, July 2013.
- [61] Margarita Pons-Salort, Véronique Letort, Michel Favre, Isabelle Heard, Benoit Dervaux, Lulla Opatowski, and Didier Guillemot. Exploring individual HPV coinfections is essential to predict HPV-vaccination impact on genotype distribution: a model-based approach. Vaccine, 31(8):1238–1245, February 2013.
- [62] Penelope Gray, Tapio Luostarinen, Simopekka Vänskä, Tiina Eriksson, Camilla Lagheden, Irene Man, Johanna Palmroth, Ville N. Pimenoff, Anna Söderlund-Strand, Joakim Dillner, and Matti Lehtinen. Occurrence of human papillomavirus (HPV) type replacement by sexual risk-taking behaviour group: Post-hoc analysis of a community randomized clinical trial up to 9 years after vaccination (IV). International Journal of Cancer, 145(3):785–796, August 2019.
- [63] Carmen Lía Murall, Kevin S. McCann, and Chris T. Bauch. Revising ecological assumptions about Human papillomavirus interactions and type replacement. Journal of Theoretical Biology, 350:98–109, June 2014.
- [64] S. Gagneux. Fitness cost of drug resistance in Mycobacterium tuberculosis. Clinical Microbiology and Infection, 15:66–68, January 2009.
- [65] Anita H Melnyk, Alex Wong, and Rees Kassen. The fitness costs of antibiotic resistance mutations. Evol Appl, 8(3):273–283, March 2015.
- [66] Hussin A. Rothan, Mehdi R. M. Bidokhti, and Siddappa N. Byrareddy. Current concerns and perspectives on Zika virus co-infection with arboviruses and HIV. Journal of Autoimmunity, 89:11–20, May 2018.
- [67] Tereza Magalhaes, Cynthia Braga, Marli T. Cordeiro, Andre L. S. Oliveira, Priscila M. S. Castanha, Ana Paula R. Maciel, Nathalia M. L. Amancio, Pollyanne N. Gouveia, Valter J. Peixoto-da-Silva Jr, Thaciana F. L. Peixoto, Helena Britto, Priscilla V. Lima, Andreza R. S. Lima, Kerstin D. Rosenberger, Thomas Jaenisch, and Ernesto T. A. Marques. Zika virus displacement by a chikungunya outbreak in Recife, Brazil. PLOS Neglected Tropical Diseases, 11(11):e0006055, November 2017.
- [68] Peter Grassberger, Li Chen, Fakhteh Ghanbarnejad, and Weiran Cai. Phase transitions in cooperative coinfections: Simulation results for networks and lattices. Phys. Rev. E, 93(4):042316, April 2016.
- [69] Li Chen, Fakhteh Ghanbarnejad, Weiran Cai, and Peter Grassberger. Outbreaks of coinfections: The critical role of cooperativity. EPL (Europhysics Letters), 104(5):50001, December 2013.
- [70] Fatemeh Zarei, Saman Moghimi-Araghi, and Fakhteh Ghanbarnejad. Exact solution of generalized cooperative susceptible-infected-removed (SIR) dynamics. Physical Review E, 100(1):012307, July 2019.
See pages - of SM.pdf