Search for Gamma-ray Spectral Lines from Dark Matter Annihilation in Dwarf Galaxies with the High-Altitude Water Cherenkov Observatory
Abstract
Local dwarf spheroidal galaxies (dSphs) are nearby dark-matter dominated systems, making them excellent targets for searching for gamma rays from particle dark matter interactions. If dark matter annihilates or decays directly into two gamma rays (or a gamma ray and a neutral particle), a monochromatic spectral line is created. At TeV energies, no other processes are expected to produce spectral lines, making this a very clean indirect dark matter search channel. With the development of event-by-event energy reconstruction, we can now search for spectral lines with the High Altitude Water Cherenkov (HAWC) Observatory. HAWC is a wide field of view survey instrument located in central Mexico that observes gamma rays from 1 TeV to 100 TeV. In this work we present results from a recent search for spectral lines from local, dark matter dominated dwarf galaxies using 1038 days of HAWC data. We also present updated limits on several continuum channels that were reported in a previous publication. Our gamma-ray spectral line limits are the most constraining obtained so far from 20 TeV to 100 TeV.
pacs:
95.35.+d,95.30.Cq,98.35.GiI INTRODUCTION
Several pieces of observational evidence suggest the majority of the matter in the Universe is composed of dark matter (DM) Ade et al. (2014); Clowe et al. (2006); Sofue and Rubin (2001). Many theories predict DM is composed of fundamental particles of which Weakly Interacting Massive Particles (WIMPs) Feng (2010) are the most promising. These particles typically annihilate or decay to Standard Model particles that cascade and produce stable secondary particles like gamma rays. While most annihilation or decay channels (e.g.) produce a continuum of gamma rays, if the DM annihilated directly into a gamma ray and a second neutral particle (X) it would produce gamma rays with a specific energy depending on the mass of the DM particle () and the second particle ():
| (1) |
This is derived using energy conservation and assuming that the DM is cold (non-relativistic). Also we used the standard particle physics convention of .
These DM annihilations produce a monochromatic spectral emission line in the gamma-ray energy spectrum. This is a sharp spectral feature as opposed to the continuum emission expected from most other annihilations, for example annihilations to a pair of b quarks. For annihilation, if the second particle is another gamma ray, then the spectral line energy would be the mass of the DM particle, giving us both evidence of DM interactions and information about the particle nature of DM. For TeV gamma rays, no other process is predicted to produce a spectral line making this a clean DM search channel. However, the process is predicted to be heavily loop suppressed, with a branching fraction Bergstrom and Ullio (1997); Ferrer et al. (2006); Gustafsson et al. (2007); Profumo (2008).
Indirect DM searches like the one presented here are aimed to detect gamma rays from DM interactions in cosmic sources. Therefore dwarf spheroidal galaxies (dSphs) in the Milky Way dark matter halo are one of the most promising targets for indirect DM searches given their proximity and high DM content Strigari (2018). Previous searches for TeV gamma rays from dSphs by the High Energy Stereoscopic System (H.E.S.S.), the Very Energetic Radiation Imaging Telescope Array system (VERITAS), the Major Atmospheric Gamma-ray Imaging Cherenkov Observatory (MAGIC), and HAWC have resulted in null detections. There were both searches for continuum emission Ahnen et al. (2016); Aleksić et al. (2014); Archambault et al. (2017); Abramowski et al. (2014); Ahnen et al. (2018); Albert et al. (2018) and spectral lines Archambault et al. (2017); Abdalla et al. (2018). H.E.S.S. has also looked for spectral lines in the inner Galactic Halo Abdallah et al. (2018).
II DATA AND ANALYSIS
Here we search for spectral lines from 1 to 100 TeV from 11 dSphs using 1038 days of data from HAWC. We also present a search for continuum emission from dSphs in App. A that is an update from the limits presented in Ref Albert et al. (2018). With its wide field of view, HAWC observes 2/3 of the gamma-ray sky each day. It detects gamma rays with energies from 1 TeV to 100 TeV. HAWC consists of 300 light-tight water Cherenkov detectors equipped with 4 photomultiplier tubes (PMTs). HAWC has a 90% up time, allowing it to observe both day and night. It is located in Sierra Negra, Mexico at an altitude of 4100 m at latitude 18N and longitude 97W. More information about HAWC can be found in Ref. Abeysekara et al. (2017).
We describe the expected flux () from a specific dark matter annihilation model with the following equation:
| (2) |
The first set of parentheses in Eq. 2 combines the DM particle properties. Specifically, is the channel-specific annihilation cross section and is the energy distribution of gamma rays from each annihilation for that channel. For DM annihilation to 2 gamma rays, .
The second set of parentheses in Eq. 2, called the “J-factor”, is derived from the integral of the DM density () for a given region of interest along the line of sight. The J-factor is directly proportional to the expected gamma-ray flux from DM annihilations. The size of the J-factor depends both on the DM density distribution in the object as well as its distance. Nearby DM dominated systems have the largest J-factors, and are therefore the best targets. Here we assume each dSph as a point source.
We search for spectral lines from 10 dSphs: Bootes I, Canes Venatici I, Canes Venatici II, Coma Berenices, Hercules, Leo I, Leo II, Leo IV, Segue I and Sextans. These were all included in the previous HAWC dSph analysis Albert et al. (2018). We use the J-factors calculated in Ref. Albert et al. (2018). Four dSphs used in that analysis (Ursa Major I, Ursa Major II, Ursa Minor, and Draco) were not included since they are located at unfavorable declinations resulting in zenith angles higher than relative to HAWC. This is because the high declination of these sources prevents the fits from converging. We note that given their high declinations where HAWC is not as sensitive, similar to the previous dSphs analysis, these dSphs would not significantly contribute to the combined limits Albert et al. (2018). We also exclude Triangulum II in our DM analysis due to its uncertain J-factor and the possibility of being tidally disrupted Kirby et al. (2017); Pace and Strigari (2019). We do present spectral line flux limits from Triangulum II, which do not assume a specific J-factor.
To search for gamma-ray lines we perform a binned maximum likelihood analysis, with the same analysis bins described in Ref. Abeysekara and others (HAWC Collaboration). We use a 2D binning of the data. The first dimension is 9 “fhit” bins similar to the previous HAWC analysis. The variable “fhit” is the fraction of available PMTs hit by the airshower. The second dimension is 12 quarter decade log bins, resulting in 108 bins. See Tab. 1 of Ref Abeysekara and others (HAWC Collaboration) for bin details. Similar to that analysis of the Crab Nebula Abeysekara and others (HAWC Collaboration), we only select events whose core is located on the main array. This means that not all analysis bins are used since several are sparsely populated. For example, the highest energy events (E100 TeV) whose core lands on the main array overwhelmingly hit all the photomultiplier tubes (PMTs) (fhit=1), not just a small fraction like fhit = 0.1. We use the same 37 bins chosen for the Crab Nebula spectral analysis Abeysekara and others (HAWC Collaboration).
In previous HAWC analyses we binned our data in fhit bins only. The energy dispersion in each bin was very poor Abeysekara et al. (2017) and there was no event-by-event energy reconstruction. The current HAWC analysis has 2 energy estimators for each event. One is based on a neural network () that uses air shower variables like core position and shower angle. The other so-called ‘ground parameter’ is determined from the charge profile across the PMTs from the air shower ( ). For more information on the HAWC energy estimators see Ref. Abeysekara and others (HAWC Collaboration).
With the new algorithms, the HAWC energy resolution is greatly improved. We show results using since that estimator has a better energy resolution Abeysekara and others (HAWC Collaboration). The energy resolution is 44% at 1 TeV and 23% at 100 TeV. Similar results were also attained using . To approximate the delta function in Eq. 2, we use a gaussian with a width of 0.1 TeV.
We fit for spectral lines from 1 – 100 TeV, which corresponds to DM annihilations directly to two gamma rays for DM masses from 1 – 100 TeV. We chose the fit energies to be in steps of half the energy resolution. This is because this spacing results in missing % of the signal if the true signal were in between two fit energies Ackermann et al. (2013). We use the energy resolution derived in Ref. Abeysekara and others (HAWC Collaboration) (see Figure 6 in that reference). This results in 25 fit energies. Specifically we fit for a spectral line at the following energies in TeV: 1, 1.43, 1.96, 2.62, 3.44, 4.45, 5.68, 7.13, 8.83, 10.80, 13.07, 15.69, 18.66, 22.02, 25.80, 30.02, 34.72, 40.01, 45.90, 52.54, 60.12, 78.20, 89.14, 101.45 TeV.
Following Ref Albert et al. (2018), we calculate the likelihood for a specific DM model using
| (3) |
where is the number of background counts, is the number of signal counts, and and run over the 2D analysis bins.
We define the best fit DM annihilation cross section as the value that maximizes . We then quantify the preference of the signal model to the background model by calculating a test statistic (TS)
| (4) |
where is the likelihood from the background-only fit and is the likelihood from the best fit with the signal model. We perform the likelihood analysis using the Multi-Mission Maximum Likelihood framework (3ML) Vianello et al. (2015).
III RESULTS
The largest in our line search was , which occurred in Segue I at TeV. When we account for the fact that we fit for lines at several different energies, the global significance post-trials is . See Section 5B of Ref. Ackermann et al. (2013) for more on calculating the global significance.
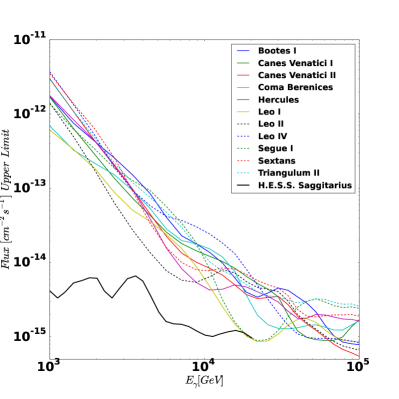
Since we did not see any statistically significant spectral lines we will proceed to calculate 95% confidence level (CL) upper limits Wilks (1938). Specifically, we find the energy for which the log likelihood changes by 2.71/2 pdg relative to the best fit. First we looked in general for spectral lines from 1 – 100 TeV, not necessarily produced from DM interactions. The resulting limits for each dSph compared to the H.E.S.S. results from the Sagittarius dSph Abdalla et al. (2018) are shown in Fig. 1.
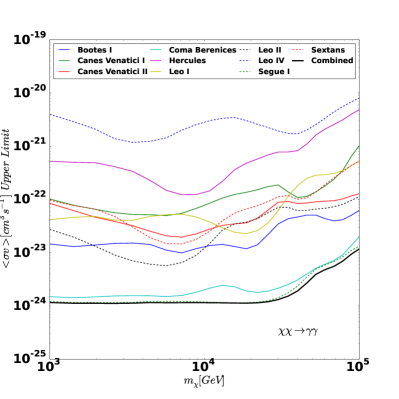
For the DM model specific limits, we assumed DM annihilation directly to two gamma rays (). In this case, . To calculate the expected gamma-ray flux from this channel we used Eq. 2. We fit at the 25 energy (mass) points listed in Sec. II. Figure 2 shows the 95% CL upper limits on for all the dSphs in this analysis.
Since we expect the same DM with the same properties in each dSph, we calculate a joint limit by combining the likelihoods of each individual dSph. Figure 3 shows the observed 95% CL upper limits on along with the expectation from 1000 background only simulations. The dashed line is the median limit from those simulations and the green (yellow) band shows the 68%(95%) containment of the background-only limits.
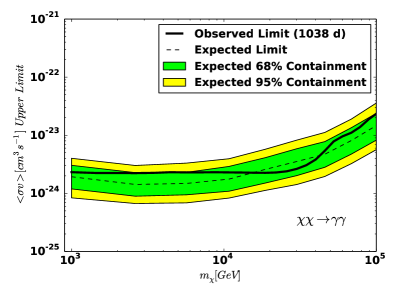
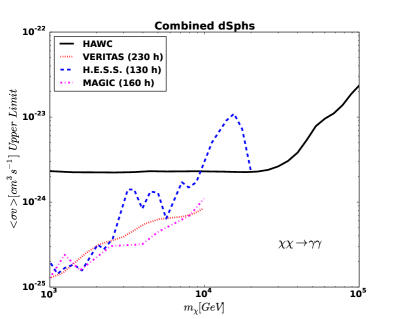
Figure 4 compares our joint limits to those obtained by other spectral line searches in dSphs. Specifically the VERITAS result combined results from 5 dSphs (Segue I, Draco, Ursa Minor, Bootes I, and William I) Archambault et al. (2017), H.E.S.S. combines 5 dSphs (Fornax, Coma Berenices, Sculptor, Carina, and Sagittarius) Abdalla et al. (2018), and MAGIC Aleksić et al. (2014), that uses data from Segue I. Each observatory used over 100 hours of total observation time; specifically VERITAS used 230 hours, H.E.S.S. used 130 hours, and MAGIC used 160 hours.
IV Discussion and Conclusions
We present a search for spectral lines from 11 dSphs from 1 to 100 TeV using 1038 days of HAWC data. The largest TS occurred at 5.7 TeV in Segue I; the TS was 4.47, corresponding to a global significance of 0.45.
Since no significant spectral lines were found, we calculated 95% confidence level upper limits to the DM annihilation cross section for the channel . Figure 2 shows the DM annihilation cross section upper limits for each dSph we considered. Figure 3 shows the combined limits from a joint likelihood analysis where each dSph was weighted by its J-factor. Note the combined limits are dominated by Seg I and Coma Berencies, which have the largest J-factors. We also calculated the general spectral line 95% flux limits.
Figure 4 compares our combined limits with those from other searches for spectral lines from dSphs. Our limits extend the search for gamma-ray spectral lines up to 100 TeV for the first time. Specifically we provide the strongest spectral line flux limits above 20 TeV. We also have the most constraining DM spectral line annihilation cross section limits about 10 TeV from dSphs analyses.
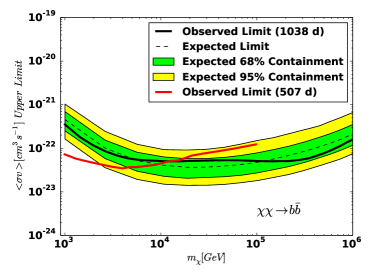
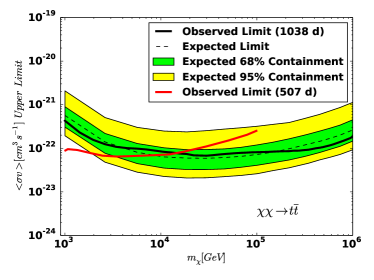
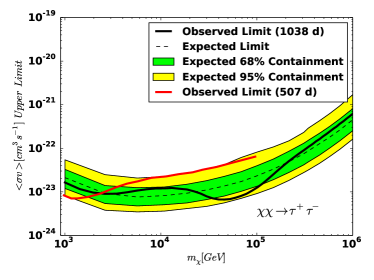
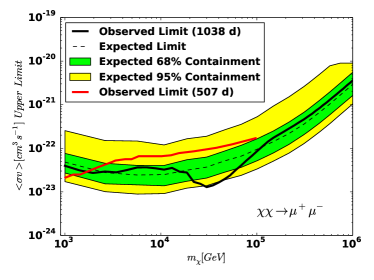
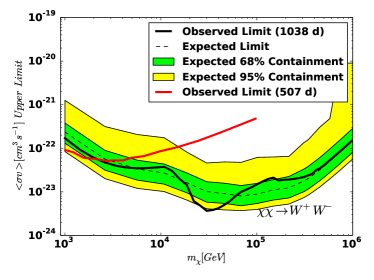
We also show updated limits using the 1038d dataset relative to the previous 507d HAWC analysis Albert et al. (2018) from the , , , , and continuum channels in App. A.
HAWC recently expanded its array by surrounding the main array by a large array of smaller water Cherenkov tanks called “outriggers”. These outriggers are expected to increase the HAWC effective area above 50 TeV by a factor of 3. It will allow HAWC to more accurately reconstruct the energy of high-energy showers. With the additional data from the outriggers and continued operations of HAWC, we expect to be able to extend our spectral line search up to 1 PeV in the future.
Acknowledgements.
We acknowledge the support from: the US National Science Foundation (NSF); the US Department of Energy Office of High-Energy Physics; the Laboratory Directed Research and Development (LDRD) program of Los Alamos National Laboratory; Consejo Nacional de Ciencia y Tecnología (CONACyT), México, grants 271051, 232656, 260378, 179588, 254964, 258865, 243290, 132197, A1-S-46288, cátedras 873, 1563, 341, 323, Red HAWC, México; DGAPA-UNAM grants IG100317, IN111315, IN111716-3, IA102715, IN109916, IA102917, IN112218; VIEP-BUAP; PIFI 2012, 2013, PROFOCIE 2014, 2015; the University of Wisconsin Alumni Research Foundation; the Institute of Geophysics, Planetary Physics, and Signatures at Los Alamos National Laboratory; Polish Science Centre, grants DEC-2018/31/B/ST9/01069, DEC-2017/27/B/ST9/02272; Coordinación de la Investigación Científica de la Universidad Michoacana; Royal Society - Newton Advanced Fellowship 180385; Thanks to Scott Delay, Luciano Díaz and Eduardo Murrieta for technical support.Appendix A Continuum Limits
In addition to a search for spectral lines from DM annihilation, we also fit for several DM annihilation channels that create a broader continuum of gamma-rays. We show the 95% confidence level upper limits for DM annihilation for the , , , , and channels in Fig 5. Note the sensitivity at lower masses for this work is less than the previous 507d analysis Albert et al. (2018) since in this analysis we make a cut that requires the air shower core center to be in the main array to better estimate the energy. The dips around TeV in the , , and are from a underfluctuation in Segue I that can also be seen in Figure 1.
References
- Ade et al. (2014) P. A. R. Ade et al. (Planck), Astron. Astrophys. 571, A16 (2014), arXiv:1303.5076 [astro-ph.CO] .
- Clowe et al. (2006) D. Clowe, M. Bradac, A. H. Gonzalez, M. Markevitch, S. W. Randall, C. Jones, and D. Zaritsky, Astrophys. J. 648, L109 (2006), arXiv:astro-ph/0608407 [astro-ph] .
- Sofue and Rubin (2001) Y. Sofue and V. Rubin, Ann. Rev. Astron. Astrophys. 39, 137 (2001), arXiv:astro-ph/0010594 [astro-ph] .
- Feng (2010) J. L. Feng, Ann. Rev. Astron. Astrophys. 48, 495 (2010), arXiv:1003.0904 [astro-ph.CO] .
- Bergstrom and Ullio (1997) L. Bergstrom and P. Ullio, Nucl. Phys. B504, 27 (1997), arXiv:hep-ph/9706232 [hep-ph] .
- Ferrer et al. (2006) F. Ferrer, L. M. Krauss, and S. Profumo, Phys. Rev. D74, 115007 (2006), arXiv:hep-ph/0609257 [hep-ph] .
- Gustafsson et al. (2007) M. Gustafsson, E. Lundstrom, L. Bergstrom, and J. Edsjo, Phys. Rev. Lett. 99, 041301 (2007), arXiv:astro-ph/0703512 [astro-ph] .
- Profumo (2008) S. Profumo, Phys. Rev. D78, 023507 (2008), arXiv:0806.2150 [hep-ph] .
- Strigari (2018) L. E. Strigari, Rept. Prog. Phys. 81, 056901 (2018), arXiv:1805.05883 [astro-ph.CO] .
- Ahnen et al. (2016) M. L. Ahnen et al. (MAGIC, Fermi-LAT), JCAP 1602, 039 (2016), arXiv:1601.06590 [astro-ph.HE] .
- Aleksić et al. (2014) J. Aleksić et al., JCAP 1402, 008 (2014), arXiv:1312.1535 [hep-ph] .
- Archambault et al. (2017) S. Archambault et al. (VERITAS), Phys. Rev. D95, 082001 (2017), arXiv:1703.04937 [astro-ph.HE] .
- Abramowski et al. (2014) A. Abramowski et al. (H.E.S.S.), Phys. Rev. D90, 112012 (2014), arXiv:1410.2589 [astro-ph.HE] .
- Ahnen et al. (2018) M. L. Ahnen et al. (MAGIC), JCAP 1803, 009 (2018), arXiv:1712.03095 [astro-ph.HE] .
- Albert et al. (2018) A. Albert et al. (HAWC), Astrophys. J. 853, 154 (2018), arXiv:1706.01277 [astro-ph.HE] .
- Abdalla et al. (2018) H. Abdalla et al. (HESS), JCAP 1811, 037 (2018), arXiv:1810.00995 [astro-ph.HE] .
- Abdallah et al. (2018) H. Abdallah et al. (HESS), Phys. Rev. Lett. 120, 201101 (2018), arXiv:1805.05741 [astro-ph.HE] .
- Abeysekara et al. (2017) A. U. Abeysekara et al., Astrophys. J. 843, 39 (2017), arXiv:1701.01778 [astro-ph.HE] .
- Kirby et al. (2017) E. N. Kirby, J. G. Cohen, J. D. Simon, P. Guhathakurta, A. O. Thygesen, and G. E. Duggan, ApJ 838, 83 (2017), arXiv:1703.02978 [astro-ph.GA] .
- Pace and Strigari (2019) A. B. Pace and L. E. Strigari, MNRAS 482, 3480 (2019), arXiv:1802.06811 [astro-ph.GA] .
- Abeysekara and others (HAWC Collaboration) A. U. Abeysekara and others (HAWC Collaboration), ApJ 881, 134 (2019), arXiv:1905.12518 [astro-ph.HE] .
- Ackermann et al. (2013) M. Ackermann et al. (Fermi-LAT), Phys. Rev. D88, 082002 (2013), arXiv:1305.5597 [astro-ph.HE] .
- Vianello et al. (2015) G. Vianello, R. J. Lauer, P. Younk, L. Tibaldo, J. M. Burgess, H. Ayala, P. Harding, M. Hui, N. Omodei, and H. Zhou (2015) arXiv:1507.08343 [astro-ph.HE] .
- Wilks (1938) S. S. Wilks, Annals Math. Statist. 9, 60 (1938).
- (25) “Particle Data Group statistics,” http://pdg.lbl.gov/2019/reviews/rpp2018-rev-statistics.pdf, accessed: 2019-10-02.