Sign-tunable anomalous Hall effect induced by two-dimensional symmetry-protected nodal structures in ferromagnetic perovskite oxide thin films
Abstract
Magnetism and spin-orbit coupling (SOC) are two quintessential ingredients underlying novel topological transport phenomena in itinerant ferromagnets. When spin-polarized bands support nodal points/lines with band degeneracy that can be lifted by SOC, the nodal structures become a source of Berry curvature; this leads to a large anomalous Hall effect (AHE). Contrary to three-dimensional systems that naturally host nodal points/lines, two-dimensional (2D) systems can possess stable nodal structures only when proper crystalline symmetry exists. Here we show that 2D spin-polarized band structures of perovskite oxides generally support symmetry-protected nodal lines and points that govern both the sign and the magnitude of the AHE. To demonstrate this, we performed angle-resolved photoemission studies of ultrathin films of SrRuO3, a representative metallic ferromagnet with SOC. We show that the sign-changing AHE upon variation in the film thickness, magnetization, and chemical potential can be well explained by theoretical models. Our study is the first to directly characterize the topological band structure of 2D spin-polarized bands and the corresponding AHE, which could facilitate new switchable devices based on ferromagnetic ultrathin films.
1. Introduction
The interplay between magnetism and spin-orbit coupling (SOC) underlies the various novel topological transport phenomena seen in metallic ferromagnets [1, 2, 3]. In three-dimensional (3D) ferromagnets, spin-polarized bands often accompany nodal points or nodal lines (NLs) [4, 5, 6]. The lifting of the band degeneracy at a nodal structure due to SOC induces enhanced Berry curvature around it, which leads to various topological transport phenomena such as the anomalous Hall effect (AHE) [7, 8, 9]. For instance, in the SrRuO3 (SRO) bulk, theoretical predictions have indicated that nodal structures with an SOC-induced gap play a role as magnetic monopoles in momentum space, which leads to a non-monotonous change in the AHE [10].
The 3D SRO bulk has been considered as a canonical system, in which the topological band structure induces a large AHE [10, 11]. However, the existence of magnetic monopoles in SRO has not yet been verified experimentally. Part of the reason for this is the lack of a suitable single crystal, as well as the difficulty in preparing clean, cleaved surfaces for angle-resolved photoemission spectroscopy (ARPES) study due to its 3D structure. Meanwhile, it has recently been shown that the NLs of 3D spin-polarized bands can also induce a large AHE, as seen in a layered Fe3GeTe2 ferromagnet [6]. The AHE driven by nodal points (so-called Weyl points) has also been reported in various 3D magnetic metals [12, 13].
The relationship between the topological band structure and corresponding transport phenomena remains largely unexplored in two-dimensional (2D) metallic ferromagnets [3]. The nodal structures in 2D ferromagnets are more fragile and unstable compared with 3D structures. Only when proper symmetry conditions are satisfied, can nodal points or NLs manifest as symmetry-protected band degeneracy in 2D bands [14, 15]. Moreover, the increased correlations expected in the reduced dimensionality could alter both the quasi-particle energy spectrum and intrinsic AHE such that careful comparison between theoretical and experimental results is indispensable to verify the topological band structure in 2D magnets [16, 17].
In this work, we demonstrate the relation between the symmetry-protected nodal structures of 2D spin-polarized bands and the AHE. For this purpose, we performed ARPES measurements on SRO ultrathin films, revealing their band structures for the first time. Based on tight-binding models, first-principles calculations, and symmetry analysis, we propose that the spin-polarized bands derived from orbitals in layered perovskite oxides generally support i) nodal points with quadratic band crossing (QBC) protected by four-fold rotation symmetry and ii) NLs arising from the crossing between majority and minority spin bands. When SOC is included, these nodal points and lines are gapped and generate large Berry curvature in the surrounding area. Because the energies of nodal points and lines are different, when the Berry curvatures that arise from them have the opposite signs, the magnitude and sign of the AHE can generally be varied by changing the Fermi level. We demonstrate that the AHE of SRO thin films exhibits sign reversal, depending on the film thickness, temperature, magnetization, and chemical potential, due to the symmetry-protected nodal structures of the 2D spin-polarized bands.
2. Results
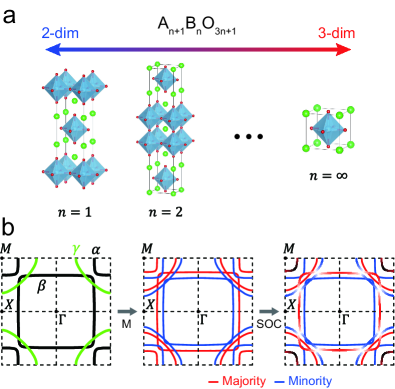
Figure 1(a) shows the general lattice structures of layered Ruddlesden-Popper perovskite oxides, with the chemical formula An+1BnO3n+1, where denotes a natural number. As increases, the material takes on a more 3D character, interpolating between the 2D limit with (A2BO4) and the 3D limit with (ABO3). Among the perovskite materials, SRO is a representative example of 3D ferromagnetic metals, with an AHE that has been attributed to the magnetic monopoles in momentum space of the topological band structure [10].
As the 2D Sr2RuO4 is non-magnetic [18], it is not an appropriate system for our study. Therefore, as an alternative, we studied the quasi-2D limit of SRO by growing ultrathin films of SRO with a thickness of 4 unit cells (u.c.). Due to its quasi-2D nature, the Fermi surfaces (FSs) of SRO ultrathin films are expected to be somewhat similar to those of Sr2RuO4 [19]. We confirm this through our ARPES measurements as will be shown later. For Sr2RuO4, it is well known that FSs consist of three bands, and , where and FSs are composed of orbitals while FS arises from the orbital as schematically shown in Fig. 1(b) [19, 20, 21]. When ferromagnetism develops, spin-degenerate bands split into majority and minority bands, which results in six bands derived from orbitals appearing at the Fermi level. With SOC, the majority and minority bands are hybridized at the points where they are crossed. This provides the general idea on how Berry curvature is generated in ferromagnetic 2D perovskites.
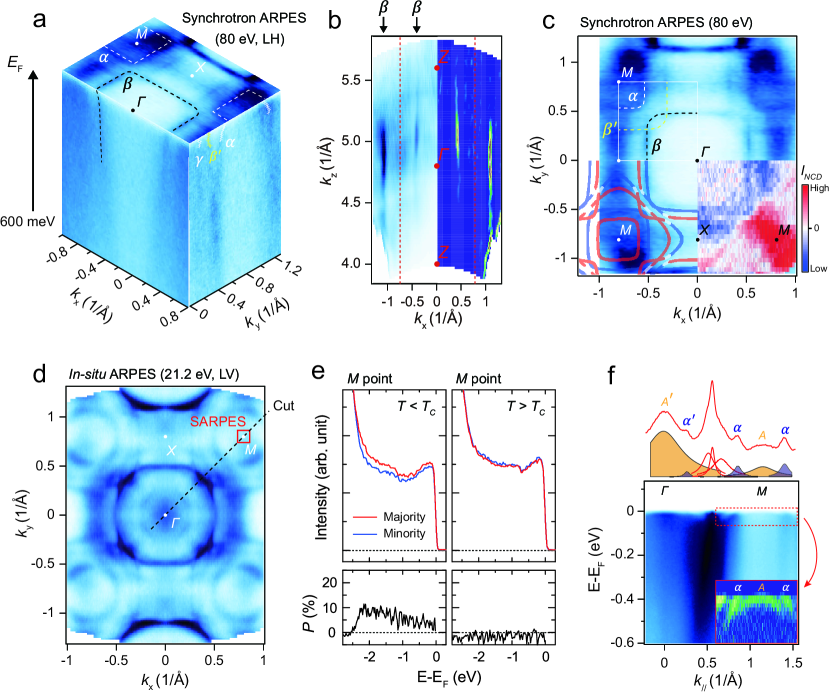
To experimentally verify the band structure of a 2D ferromagnetic perovskite, we performed ARPES measurements on SRO ultrathin films. Figure 2(a) shows a FS map as well as the energy-momentum (-) spectra of a 4 u.c. SRO thin film measured with 80 eV light with linear horizontal (LH) polarization. and FSs are clearly visible and are similar to the corresponding FSs reported for Sr2RuO4 [19, 20, 21, 22, 23]. Due to the rotational distortion of RuO6 octahedra in SRO ultrathin films grown on SrTiO3 (001) substrates [24, 25], the FS from the folded- band () is also observed.
Whether ultrathin films indeed possess 2D electronic structures requires an examination of the (i.e., photon energy) dependence. The measured dispersion is shown in Fig. 2(b). Here is calculated based on an inner potential of 14 eV obtained from experiments on SRO single crystals [26]. Unlike 3D materials exhibiting dispersion, the band does not show any dispersion as expected. This clearly illustrates that SRO ultrathin films have quasi-2D band structures, similar to Sr2RuO4 [21, 23] and Sr3Ru2O7 [27, 28].
In Fig. 2(c), we reproduce the measured FSs. In addition to the and pockets shown by the dotted lines, there are more detailed structures. Superimposed on the map as thick lines are results obtained from an effective 2D tight-binding model fit (see Methods for details). It is seen that the effective 2D model can explain the major features of the experimental dispersions. We also performed circular dichroism (CD) ARPES to examine the Berry curvature and the result is shown in the bottom-right corner of the figure (See SM for analysis of the CD-ARPES data). Moving from to , the intensity of CD data varies from zero to negative, and then to positive. A clear sign-changing behavior is observed as a function of the electron momentum. Detailed discussions on the tight-binding fit and CD-ARPES results will be discussed later with Fig. 5.
Since ARPES measurement is sensitive to the surface condition, clearer band features can be resolved via in-situ measurements. Figure 2(d) shows an FS map of the 4 u.c. SRO thin film in-situ measured with linear vertical (LV) polarized He- light (21.2 eV). Spin polarization of the bands was also obtained by performing spin-resolved ARPES (SARPES) measurements below and above the Curie temperature, . Figure 2(e) shows the spin-resolved energy distribution curves (EDCs) and spin polarizations at the point at 10 K (below ) and 125 K (above ). The EDCs below show a considerable difference between the majority and minority spins, whereas no difference was observed above . The difference is also presented in the form of spin polarization, , in the lower panels. Spin-resolved EDCs along the high-symmetry lines (- and -) can be found in Supplementary Materials (SM). These observations are consistent with itinerant ferromagnetism [29, 30].
The high resolution FS map in Fig. 2(d) shows more detailed features in comparison to the result from ex-situ films in Fig. 2(a). An important feature visible in the high resolution data is heavy bands observed at the and points. To investigate those heavy bands, - cut of the data in Fig. 2(d) and its momentum distribution curve (MDC) at the Fermi level are shown in Fig. 2(f). To see the dispersion more clearly, we plot 2D curvature [31] of the data near the point in the inset. Two hole-like bands are observed at the M point; one from the band and the other, unknown and labeled as , located within the pocket. The latter does not exist in the case of Sr2RuO4. We fitted the MDC with Lorentziaion peaks as shown in the upper panel of Fig. 2(f). Near the point, three peaks are observed: two from the band and one from the band. We also find that the heavy bands near the point are and replica bands due to the rotational distortion of RuO6 octahedra [24, 25] (See SM for low-energy electron diffraction (LEED) patterns).
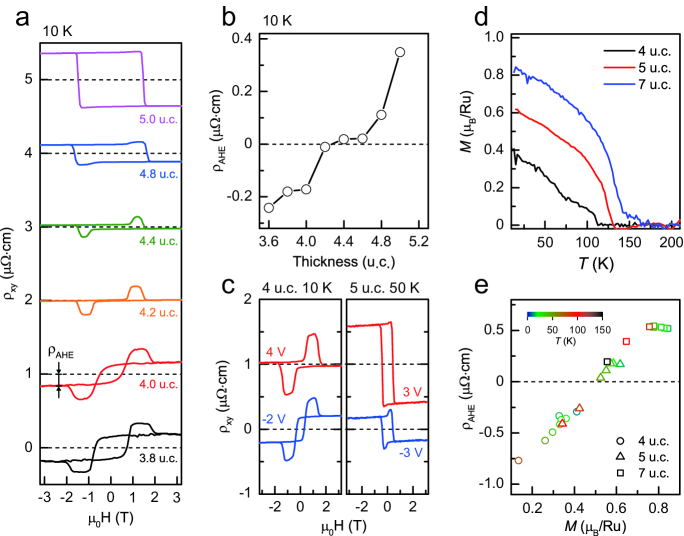
With the full experimental electronic structure identified, we turn our attention to the transport and magnetic properties of SRO ultrathin films presented in Fig. 3. Figure 3(a) shows the thickness-dependent Hall resistivity measured at 10 K for - u.c. SRO ultrathin films under an out-of-plane magnetic field. Here, the thickness of the thin film was estimated from the corresponding in-situ reflection high-energy electron diffraction (RHEED) intensity plot (see SM for details). In general, the ordinary Hall effect (OHE), AHE, and the hump-like features which are observed near the coercive field can contribute to the Hall resistivity , which is thus given by [32, 25, 33]. The OHE term, which is proportional to an applied magnetic field, was subtracted from all Hall resistivity data presented in this paper. As is non-zero only near the coercive field, can be determined from the saturated in the high field limit.
The thickness dependence of is shown in Fig. 3(b). Here, decreased as the thickness became thinner and eventually took on a negative value with a sign change in between. We also performed ionic liquid gating of SRO ultrathin films to investigate how the change in the chemical potential affects . Figure 3(c) shows the results of ionic gating experiments for 4 and 5 u.c. SRO thin films measured at 10 and 50 K, respectively. In both cases, the magnitude of changed significantly with the gate voltage. Figure 3(d) shows the out-of-plane magnetization of 4, 5, and 7 u.c. SRO thin films. Combining the thickness and temperature-dependent Hall effect results with the magnetization data, we can derive data, as plotted in Fig. 3(e) (see SM for details). It should be noted that the data points fall on a single line, implying that may be the key parameter for . The sign reversal of can also be clearly observed as the magnetization approaches /Ru.
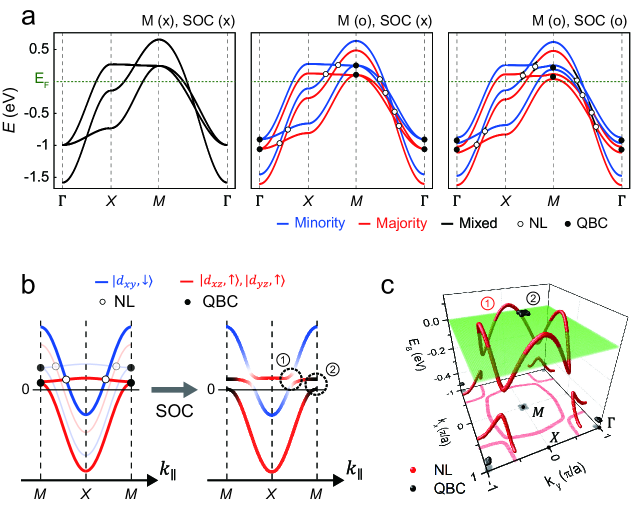
It is worth noting that the sign-switching behavior of is highly unusual [10]. To understand the origin of the unusual AHE, we conducted a tight-binding model analysis combined with first-principles calculations. Figure 4(a) shows the band structure in the effective six-band tight-binding model (relevant to 1 u.c. SRO), the parameters of which were adjusted to describe the FS in Fig. 2(c) with a magnetization = /Ru. With magnetization and SOC, several bands are hybridized near the points at which they are crossed. We find that two different origins of symmetry-protected nodal structures, which we call as NL (white circle) and QBC (black circle), are formed at the crossing points. The NLs and QBCs of spin-polarized bands, respectively, become the sources of the large Berry curvature when they are gapped due to SOC. We note that the lowest lying QBC band at the M point is the band that we observed in Fig. 2(f).
To explain the characteristics of NL and QBC in details, a band structure along the -- line is presented in Fig. 4(b). For simplicity, we focus on three out of the six bands, in which two majority bands are derived from orbitals (red) and one minority band originates from the orbital (blue). The properties of the system as a whole can be understood simply by doubling the number of bands.
When the crossing between bands with opposite spin-polarization exists, it generally leads to 2D NLs in spin-polarized systems [34, 35, 36]. In the absence of SOC, the majority and minority bands are not hybridized, so that NLs form when they intersect [36]. Meanwhile, due to the tetragonal crystalline symmetry of thin films, QBCs can appear at the and points with point group symmetry made up of bands with the same spin characte [37, 38]. These NLs and QBCs are generic nodal structures that exist in the spin-polarized bands of layered 2D perovskite structures (See Methods for details). Figure 4(c) shows the configuration of NLs and QBCs in the momentum space formed by three out of the six bands in Fig. 4(b). When SOC is turned on, these nodal structures are gapped and Berry curvature is thus generated, which leads to the AHE (see Methods for details).
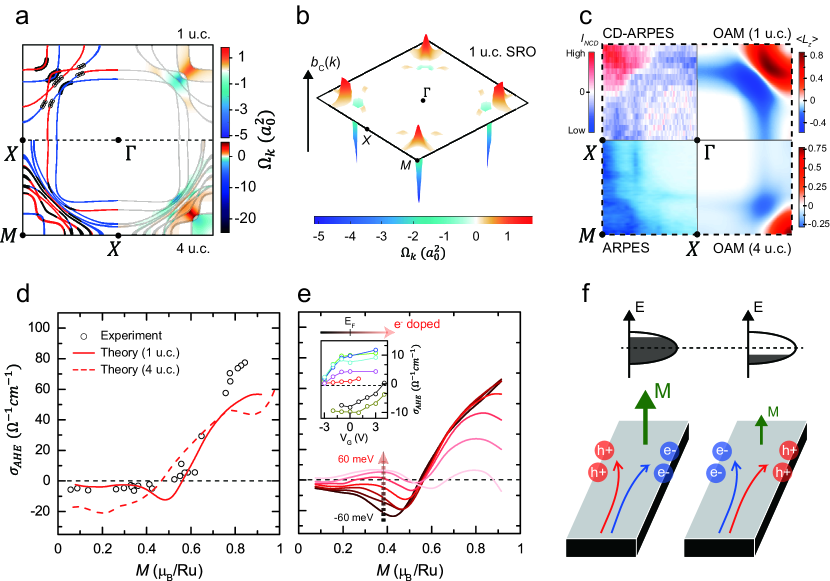
Multiple Berry curvature sources appearing near the Fermi level can induce fluctuating Berry curvature distribution with alternating signs. The upper half of Fig. 5(a) shows that QBCs formed by minority bands induce negative Berry curvature while the others generate positive Berry curvature. For better visualization, we plot the Berry curvature distribution of 1 u.c. SRO. in Fig. 5(b). The resulting Berry curvature distribution is similar to a previously reported one [3].
Since the sign-alternating Berry curvature distribution is generated by the topological band crossings, it would be desirable to experimentally show the Berry curvature behavior in the momentum space. During the past decade, the connection between Berry curvature and orbital angular momentum (OAM) has been firmly established [39, 40]. In addition, measurement of OAM (thus Berry curvature) with CD ARPES has been well studied [41, 42, 43, 44, 45, 46]. In fact, CD-ARPES has been used to study chiral structures of pseudo-spins of topological bands [45, 46, 11, 47, 48]. Therefore, the CD-ARPES in Fig. 2(c) may be compared with calculated OAM of our 1 u.c. tight-binding model. The upper half of Fig. 5(c) shows a clear match between the CD-ARPES data and OAM distribution. Positive CD intensity and OAM are observed near the point but they turn negative away from the point. Eventually, both experimental and theoretical results turn to zero close to the point. Interestingly, we found that both of the calculated OAM and Berry curvature flip their signs along the - high-symmetry line due to the intrinsic nature of QBC (See Methods for the relationship between OAM and Berry curvature).
To demonstrate that the QBCs and NLs are present, and also the associated sign-switching of the AHE signal is a generic property of SRO ultrathin films independent of film thickness, we also constructed a tight-binding model for 4 u.c. SRO and compared it with the effective six-band model. The hopping parameters for the 4 u.c. tight-binding Hamiltonian were extracted from first-principles calculations and adjusted further by fitting the experimentally observed FSs. For realistic calculations, the atomic positions of 4 u.c. SRO were obtained from the experiment using coherent Bragg rod analysis (COBRA) [25] (See Methods for the detailed description of the model). The lower half of Fig. 5(a) shows the FS and Berry curvature derived from the 4 u.c. model, where large Berry curvatures are generated by gapped QBCs and NLs. It is interesting to note that the 1 u.c. and 4 u.c. models predict similar FS and Berry curvature distributions. Both models also show consistent OAM distributions as shown in the right half in Fig. 5(c).
Due to multiple sources of enhanced Berry curvature generated by QBCs and NLs as shown in Figs. 5(a) and (b), the sign and magnitude of the AHE can vary depending on the energies of the nodal structures relative to the Fermi level (see Methods for details). We show that the sign and magnitude of the AHE can be controlled by different parameters, such as the magnetization and chemical potential. The calculated anomalous Hall conductivity (AHC), using two tight-binding models for 1 u.c. and 4 u.c. SRO as a function of magnetization, well matches the experimental results (Fig. 5(d)). It is noteworthy that the sign of the AHC reverses when the amplitude of the magnetization varies. Note that the sign-switching AHC appears in both 1 u.c. and 4 u.c. models.
The chemical potential dependence of AHC was also computed using the tight-binding model (Fig. 5(e)). According to the calculation with /Ru, AHC increases with the chemical potential. This tendency is in accordance with the ionic liquid gating measurements on 4 and 5 u.c. SRO ultrathin films (Fig. 5(e), inset). Given that both films have a magnetization of /Ru, AHC tends to increase as the gate voltage increases. We belive that these results can support that the sign changing AHE comes from competition between Berry curvature sources from multiple topological features as magnetization and chemical potential change. Especially, we found that as the chemical potential increases, the positive Berry curvatures from NL and majority band QBC dominate the negative Berry curvature from minority band QBC, which eventually leads to the sign-reversal of AHC. Interestingly, AHC is not proportional to the net magnetization and the sign of AHC can change with a small variation of magnetization and chemical potential as schematically shown in Fig. 5(f).
For last decades, nonmonotonous AHE of SRO has been studied not only in the ultrathin limit (i.e. 2D limit) [3, 32, 25, 49] but also in the 3D limit like single crystals and thick films [10, 50]. Interestingly, the sign-changing AHE v.s. magnetization in the 2D SRO shows a similar tendency to that of 3D SROs. Such a similarity of AHE between 2D and 3D SROs is quite surprising because 3D topological band structure is generally not adiabatically connected to the band structure of 2D layers. As the interlayer coupling generates several band inversion processes, which strongly modify the nodal structures, the topological nodal structures and related Berry curvature distribution of 2D and 3D are not smoothly connected in general. Especially, QBCs and NLs of 2D SRO cannot be understood from a simple 2D confinement of magnetic monopoles in 3D SRO. Generic evolution pattern of the band structure between 2D and 3D limits is further examined using tight-binding model shown in SM.
Because the topological nodal structures (QBCs and NLs) are protected only by symmetries, similar nodal structures can appear in any 2D systems sharing the same space group symmetry as SRO. To confirm this idea, we also performed first-principles calculations on monolayer SrCoO3, another ferromagnetic perovskite oxide, in which the sign-switching AHE was recently observed in thin films [51]. Interestingly, the NLs and QBCs were also located close to the Fermi energy and generated Berry curvature with opposite signs, as in SRO (see SM for details).
Let us briefly mention the stability of NLs and QBCs under rotation or tilting of oxygen octahedra. NLs are stable against rotation or tiling as they do not affect spins when SOC is absent. QBCs are stable against rotation distortion that preserves rotation. Although the tilting breaks symmetry, the topological properties of QBCs should still remain intact as long as the SOC-induced gap is larger than the gap caused by tiling. We believe that a similar mechanism may be applicable to understanding mysterious AHE in other ferromagnetic perovskite oxides and emergent interfacial ferromagnetism.
3. Conclusion
In conclusion, by combining ARPES, transport measurements, and theoretical analysis, we demonstrated the topological band structure of ferromagnetic SRO thin films. In particular, the band structures of SRO film in the ultrathin 2D limit were observed and defined for the first time. Through theoretical analysis, we also showed that the spin-polarized bands of 2D ferromagnets generally possess nodal points and lines that become the source of enhanced Berry curvature. Comparing the measured band structure with the tight-binding model, we identified the Berry curvature hot spots originating from multi-nodal structures, which led to the unconventional AHE. Competing contributions from different Berry curvature hot spots induce a sign-changing AHE, which can be controlled by varying the film thickness, temperature, magnetization, and chemical potential. We believe that our findings will open up new avenues for investigating novel transport phenomena driven by symmetry-protected nodal structures of 2D magnetic systems, and facilitate the development of magnetic devices based on the engineering of magnetic topological band structures.
4. Methods
.1 SrRuO3 thin film fabrication
SRO ultrathin films were grown on TiO2-terminated SrTiO3 (STO) single crystal substrates using pulsed laser deposition (PLD). TiO2-terminated STO substrates from Shinkosha were used for SRO thin film growth. To dissolve the Sr compounds that can form on the surface of STO substrates, the STO substrates were prepared by deionized (DI) water etching [52]. The DI water-treated STO substrates were pre-annealed - at for 30 min with an oxygen partial pressure (PO2) of 10-6 Torr. We deposited epitaxial SRO thin film in an oxygen partial pressure of PO2=100 mTorr; the growth temperature of the STO substrate was . A KrF excimer laser (wavelength: 248 nm) irradiated a stoichiometric SRO target with a fluence of 1-2 J/cm2 and repetition rate of 2 Hz. RHEED was used to monitor the growth dynamics. To clean the surface of SRO thin films, we post-annealed them at for 10 min.
.2 Transport and magnetic measurements
For the Hall effect measurement of SRO thin films, we prepared a -nm-thick Au electrode on top of the SRO thin films with a Hall bar geometry using an electron beam evaporator. Electric transport measurement was carried out using a physical property measurement system (Quantum Design Inc.). The magnetic characterization was performed using superconducting quantum interface device (SQUID) magnetometry with out-of-plane geometry. Given that the easy axis of the SRO ultrathin film is perpendicular to the thin film on STO (001) substrate, we measured the out-of-plane magnetization via SQUID magnetometry [53, 49]. For ionic liquid gating, we used diethylmethyl(2-methoxyethyl)ammonium bis(trifluoromethylsulfonyl)imide (DEME-TFSI) as an electrolyte. We applied a gate voltage at 260 K for 30 min to form an electric double layer.
.3 Angle-resolved photoemission spectroscopy
In-situ ARPES measurements were performed at 10 K using the home lab system equipped with a Scienta DA30 analyzer and a discharge lamp from Fermi instrument. He I ( eV) light was mostly used. For the photon energy-dependent and CD studies, ARPES measurements were performed at the beam line 4.0.3 end station of the Advanced Light Source equipped with a Scienta R8000. Photon energy dependent ARPES measurements were performed at 10 K with photon energies ranging from 50 to 120 eV. CD-ARPES measurements were performed at 20 K with left- and right-circularly polarized (LCP and RCP, respectively) 80 eV light. The light incident angle was .
Spin polarization was measured with a spin-resolved ARPES system in our laboratory. The system was equipped with a SPECS PHOIBOS 225 analyzer and a very low energy electron diffraction (VLEED) spin detector. For the spin detector, an oxidized iron film deposited on W(100) was used as the scattering target. He I ( eV) light was used as the light source. The energy resolution was set to 60 meV with a pass energy of 10 eV. We used a Sherman function value of 0.29 0.01 to obtain the spin polarization.
.4 First-principles calculations
We performed first-principles density functional theory (DFT) calculations with the generalized gradient approximation using the Vienna ab-initio simulation package (VASP) [54, 55]. Perdew-Becke-Erzenhof parametrization [56] for the exchange-correlation functional and the projector augmented wave method [57] were used, with an energy cutoff of 500 eV and a -point sampling on a grid. The electronic structures of 4 u.c. SRO film were obtained by analyzing a slab of the SRO/STO heterostructure consisting of 4 layer of SRO and 4.5 layers of STO (including an additional SrO at the surface), and a vacuum of 19 Å. We used the atomic positions obtained from the experimental using COBRA [25], having a in-plane u.c. to include octahedral rotation. The ferromagnetic ground state was obtained with an average Ru magnetic moment of 1.2 . The tight-binding parameters for Ru--derived bands of the SRO/STO heterostructure were obtained using the Wannier90 package [58]. For the GGA+ calculations presented in the supplementary materials, we used the rotationally invariant form of the on-site Coulomb interaction [59] with = 3.23 eV and = 0.74 eV from constrained random-phase approximation calculation [60].
The electronic structure of 2D SrCoO3 was calculated using a slab geometry of 1.5 layers of SrCoO3 (including an additional SrO layer at the surface) with a vacuum of 10 Å in which the experimental atomic positions of bulk SrCoO3 were used [61]. The space group of the atomic structure including the vacuum was (124). The energy cutoff of 600 eV and -point sampling on a grid were used. SOC was included. The ferromagnetic ground state was obtained with the Co magnetic moment of 1.6 , in which the out-of-plane magnetization direction was preferred with magnetic anisotropy energy of 1 meV. The Berry curvature was calculated using Wannier90 package [58] based on the tight-binding Hamiltonian constructed from the Wannier functions of Co- and O- derived bands.
.5 Effective tight-binding model for monolayer SRO
In the main text, we assumed that electronic structure of 4 u.c. SRO can be well described by effective two-dimensional models, which are supported by -dependent ARPES measurement. Following the Slater-Koster method, tight-binding Hamiltonian of ferromagnetic monolayer SrRuO3 is constructed as follows.
| (1) |
where
| (2) |
where and are the amplitudes for nearest neighbor interactions, and , , and are the amplitudes of next nearest neighbor interactions. denotes the amplitude of SOC and is the amplitude of Zeeman interaction. We fit tight-binding parameters with ARPES data to describe the anomalous Hall conductivity quantitatively (see Table I).
| 0.3 | 0.28 | 0.03 | 0.018 | 0.04 | 0.08 | 0.015 |
With the Hamiltonian, we can directly calculate Berry curvature of each energy band by applying the following formula:
| (3) |
where is the energy of the -th band represented by . The anomalous Hall conductivity is given by integrating the Berry curvature over the Brillouin zone below the Fermi energy:
| (4) |
where is step function that is when Also, , where is Hall resistance and is the thickness of SRO thin film.
.6 Tight-binding model for 4 u.c. SRO
We construct 4 u.c. SRO tight-binding model where the parameters are extracted from the DFT calculation and adjusted further by fitting the experimentally observed FSs. The DFT calculation is performed based on the structure of 4 u.c. SRO ultrathin films, where the atomic structure information is obtained by COBRA that determines the layer-by-layer atomic positions of SRO ultrathin films. In the tight-binding Hamiltonian, only orbitals are considered since they accounts for the most of the density of states near the Fermi level. Also, the tiny lattice rotation is neglected and the tetragonal structure is assumed. The Hamiltonian is described by the matrix and the basis , where
| (5) | ||||
| (6) |
Here describes the intralayer part of the Hamiltonian where denotes the index for the SRO layer. and describe the hopping interaction between -th layer and -th layer. Let us note that , due to the Hermiticity of the Hamiltonian.
The intralayer Hamiltonian is written as
| (7) |
where
| (8) |
where and are the amplitudes of the nearest neighbor interactions, and and are the amplitudes of the next nearest neighbor interactions. is the on-site energy difference between and orbitals, denotes the amplitude of SOC, and is the magnitude of Zeeman interaction.
On the other hand, the interlayer hopping interaction is written as
| (9) |
where
| (10) |
Here we assume without losing generality. is the amplitude of the nearest neighbor interaction and is the amplitude of the next nearest neighbor interaction. The parameters of the effective tight-binding Hamiltonian are summarized in Table II.
| 0.2 | ||||||||||
.7 Quadratic Band Crossing (QBC)
Negative AHC under small magnetization in SRO can be explained by the Hamiltonian expanded near QBCs. Neglecting rotation and tilting, a perovskite thin film has a square lattice structure. Without SOC, space group generators are four-fold rotation about the z-axis (), and three mirrors , , and , where changes the sign of the coordinate. The Hamiltonian valid near or points is written as
| (11) |
where and are the basis near the QBC. We now discuss the influence of SOC. The on-site spin orbit coupling term is expressed as . Since , the effective Hamiltonian with SOC is written as follows
| (12) |
where is for majority (minority) bands. Thus the gap is opened and the relevant Berry curvature is given by , where the total Berry curvature is quantized to . Unlike Berry curvature induced by linear band crossing which is maximum at , Berry curvature induced by QBC is zero at and maximum at .
In SRO, although QBC formed by majority bands is closer to the Fermi level than that of minority bands, the former induces smaller Berry curvature. Since the bands at M point are all hole-like, Fermi level is between the majority bands for and minority bands for . Then Berry curvature that contributes to anomalous Hall effect is . For small magnetization, Hall conductance can be negative, whereas for large magnetization, Berry curvature induced by minority bands becomes negligible and Hall conductance becomes positive.
.8 Nodal line (NL)
Without SOC, the crossing between spin up and spin down bands form a nodal line. The corresponding Hamiltonian is written as
| (13) |
where Due to the SOC, spin U(1) symmetry is broken and the gap is opened. SOC term is expressed as ,
| (14) | |||
| (15) |
Thus, the total Hamiltonian . If Fermi energy lies between two energy bands, the Berry curvature is given by
| (16) |
where is higher (lower) energy state. Similar to the calculation for QBC, the total Berry curvature is quantized to .
Let us note, however, that some nodal lines are intact under SOC. This is due to symmetry, which is local in both real and momentum space in two dimensions: , represented as . Two bands with different mirror eigenvalue do not hybridize.
.9 Relationship between OAM and BC
Here, we explain that orbital angular momentum (OAM) and Berry curvature show similar distributions. For simplicity, let us consider a two-band Hamiltonian where the gap is opened by the spin orbit coupling.
The Hamiltonian is written as
| (17) |
where , which represents the direction of spin polarization. The energy spectrum is given as where the gap due to the spin orbit coupling is proportional to .
The Berry curvature of the occupied band is
| (18) |
On the other hand, the -component of the OAM of the occupied band is
| (19) |
The Berry curvature and OAM show the similar tendency since both of them are induced by the spin-orbit coupling that opens the gap at QBC. In particular, we note that the Berry curvature and OAM have the same sign determined by .
Acknowledgements.
We gratefully acknowledge discussions with J .R. Kim. This work is supported by IBS-R009-D1 and IBS-R009-G2 through the IBS Center for Correlated Electron Systems.B.-J.Y. was supported by the Institute for Basic Science in Korea (Grant No. IBS-R009-D1), the National Research Foundation of Korea (NRF) grant funded by the Korea government (MSIT) (No.2021R1A2C4002773), and the U.S. Army Research Office and Asian Office of Aerospace Research & Development (AOARD) under Grant number W911NF-18-1-0137.The Advanced Light Source is supported by the Office of Basic Energy Sciences of the U.S. DOE under Contract No. DE-AC02-05CH11231. S.Y.P was supported by the National Research Foundation of Korea (NRF) grant funded by the Korea government (MSIT) (No. 2020R1F1A1076742).References
- Burkov [2014] A. Burkov, Phys. Rev. Lett. 113, 187202 (2014).
- Ye et al. [2018] L. Ye, M. Kang, J. Liu, F. Von Cube, C. R. Wicker, T. Suzuki, C. Jozwiak, A. Bostwick, E. Rotenberg, D. C. Bell, et al., Nature 555, 638 (2018).
- Groenendijk et al. [2020] D. J. Groenendijk, C. Autieri, T. C. van Thiel, W. Brzezicki, J. R. Hortensius, D. Afanasiev, N. Gauquelin, P. Barone, K. H. W. van den Bos, S. van Aert, J. Verbeeck, A. Filippetti, S. Picozzi, M. Cuoco, and A. D. Caviglia, Phys. Rev. Res. 2, 023404 (2020).
- Chang et al. [2016] G. Chang, S.-Y. Xu, H. Zheng, B. Singh, C.-H. Hsu, G. Bian, N. Alidoust, I. Belopolski, D. S. Sanchez, S. Zhang, et al., Sci. Rep. 6, 38839 (2016).
- Chang et al. [2018] G. Chang, B. Singh, S.-Y. Xu, G. Bian, S.-M. Huang, C.-H. Hsu, I. Belopolski, N. Alidoust, D. S. Sanchez, H. Zheng, et al., Phys. Rev. B 97, 041104 (2018).
- Kim et al. [2018] K. Kim, J. Seo, E. Lee, K.-T. Ko, B. Kim, B. G. Jang, J. M. Ok, J. Lee, Y. J. Jo, W. Kang, et al., Nat. Mater. 17, 794 (2018).
- Nagaosa et al. [2010] N. Nagaosa, J. Sinova, S. Onoda, A. H. MacDonald, and N. P. Ong, Rev. Mod. Phys. 82, 1539 (2010).
- Zeng et al. [2006] C. Zeng, Y. Yao, Q. Niu, and H. H. Weitering, Phys. Rev. Lett. 96, 037204 (2006).
- Wang et al. [2018] Q. Wang, Y. Xu, R. Lou, Z. Liu, M. Li, Y. Huang, D. Shen, H. Weng, S. Wang, and H. Lei, Nat. commun. 9, 3681 (2018).
- Fang et al. [2003] Z. Fang, N. Nagaosa, K. S. Takahashi, A. Asamitsu, R. Mathieu, T. Ogasawara, H. Yamada, M. Kawasaki, Y. Tokura, and K. Terakura, Science 302, 92 (2003).
- Chen et al. [2013] Y. Chen, D. Bergman, and A. Burkov, Phys. Rev. B 88, 125110 (2013).
- Vazifeh and Franz [2013] M. M. Vazifeh and M. Franz, Phys. Rev. Lett. 111, 027201 (2013).
- Zyuzin and Tiwari [2016] A. A. Zyuzin and R. P. Tiwari, JETP letters 103, 717 (2016).
- Young and Kane [2015] S. M. Young and C. L. Kane, Phys. Rev. Lett. 115, 126803 (2015).
- Niu et al. [2017] C. Niu, P. M. Buhl, G. Bihlmayer, D. Wortmann, Y. Dai, S. Blügel, and Y. Mokrousov, Phys. Rev. B 95, 235138 (2017).
- Zhang et al. [2014] H. Zhang, H. Huang, K. Haule, and D. Vanderbilt, Phys. Rev. B 90, 165143 (2014).
- Wan et al. [2011] X. Wan, A. M. Turner, A. Vishwanath, and S. Y. Savrasov, Phys. Rev. B 83, 205101 (2011).
- Neumeier et al. [1994] J. Neumeier, M. Hundley, M. Smith, J. Thompson, C. Allgeier, H. Xie, W. Yelon, and J. Kim, Phys. Rev. B 50, 17910 (1994).
- Puchkov et al. [1998] A. Puchkov, Z.-X. Shen, T. Kimura, and Y. Tokura, Phys. Rev. B 58, R13322 (1998).
- Lu et al. [1996] D. H. Lu, M. Schmidt, T. R. Cummins, S. Schuppler, F. Lichtenberg, and J. G. Bednorz, Phys. Rev. Lett. 76, 4845 (1996).
- Damascelli et al. [2000] A. Damascelli, D. H. Lu, K. M. Shen, N. P. Armitage, F. Ronning, D. L. Feng, C. Kim, Z.-X. Shen, T. Kimura, Y. Tokura, Z. Q. Mao, and Y. Maeno, Phys. Rev. Lett. 85, 5194 (2000).
- Mackenzie et al. [1996] A. P. Mackenzie, S. R. Julian, A. J. Diver, G. J. McMullan, M. P. Ray, G. G. Lonzarich, Y. Maeno, S. Nishizaki, and T. Fujita, Phys. Rev. Lett. 76, 3786 (1996).
- Mackenzie et al. [1998] A. P. Mackenzie, S.-i. Ikeda, Y. Maeno, T. Fujita, S. R. Julian, and G. G. Lonzarich, J. Phys. Soc. Jpn. 67, 385 (1998).
- Chang et al. [2011] S. H. Chang, Y. J. Chang, S. Y. Jang, D. W. Jeong, C. U. Jung, Y.-J. Kim, J.-S. Chung, and T. W. Noh, Phys. Rev. B 84, 104101 (2011).
- Sohn et al. [2018] B. Sohn, B. Kim, S. Y. Park, H. Y. Choi, J. Y. Moon, T. Choi, Y. J. Choi, T. W. Noh, H. Zhou, S. H. Chang, et al., arXiv preprint arXiv:1810.01615 (2018).
- [26] J. S. Oh et al., unpublished .
- Hase and Nishihara [1997] I. Hase and Y. Nishihara, J. Phys. Soc. Jpn. 66, 3517 (1997).
- Singh and Mazin [2001] D. Singh and I. Mazin, Phys. Rev. B 63, 165101 (2001).
- Chang et al. [2009] Y. J. Chang, C. H. Kim, S.-H. Phark, Y. S. Kim, J. Yu, and T. W. Noh, Phys. Rev. Lett. 103, 057201 (2009).
- Jeong et al. [2013] D. W. Jeong, H. C. Choi, C. H. Kim, S. H. Chang, C. H. Sohn, H. J. Park, T. D. Kang, D.-Y. Cho, S. H. Baek, C. B. Eom, J. H. Shim, J. Yu, K. W. Kim, S. J. Moon, and T. W. Noh, Phys. Rev. Lett. 110, 247202 (2013).
- Zhang et al. [2011] P. Zhang, P. Richard, T. Qian, Y.-M. Xu, X. Dai, and H. Ding, Rev. Sci. Instrum. 82, 043712 (2011).
- Matsuno et al. [2016] J. Matsuno, N. Ogawa, K. Yasuda, F. Kagawa, W. Koshibae, N. Nagaosa, Y. Tokura, and M. Kawasaki, Sci. Adv. 2, e1600304 (2016).
- Sohn et al. [2020] B. Sohn, B. Kim, J. W. Choi, S. H. Chang, J. H. Han, and C. Kim, Curr. Appl. Phys. 20, 186 (2020).
- Jin et al. [2020a] L. Jin, X. Zhang, Y. Liu, X. Dai, X. Shen, L. Wang, and G. Liu, Phys. Rev. B 102, 125118 (2020a).
- Zhou et al. [2021] F. Zhou, Y. Liu, M. Kuang, P. Wang, J. Wang, T. Yang, X. Wang, Z. Cheng, and G. Zhang, Nanoscale 13, 8235 (2021).
- Jin et al. [2020b] L. Jin, X. Zhang, T. He, W. Meng, X. Dai, and G. Liu, Appl. Surf. Sci. 520, 146376 (2020b).
- Sun et al. [2009] K. Sun, H. Yao, E. Fradkin, and S. A. Kivelson, Phys. Rev. Lett. 103, 046811 (2009).
- Chong et al. [2008] Y. D. Chong, X.-G. Wen, and M. Soljacić, Phys. Rev. B 77, 235125 (2008).
- Xiao et al. [2007] D. Xiao, W. Yao, and Q. Niu, Phys. Rev. Lett. 99, 236809 (2007).
- Go et al. [2018] D. Go, D. Jo, C. Kim, and H.-W. Lee, Phys. Rev. Lett. 121, 086602 (2018).
- Liu et al. [2011] Y. Liu, G. Bian, T. Miller, and T.-C. Chiang, Phys. Rev. Lett. 107, 166803 (2011).
- Park et al. [2012a] J.-H. Park, C. H. Kim, J.-W. Rhim, and J. H. Han, Phys. Rev. B 85, 195401 (2012a).
- Cho et al. [2018] S. Cho, J.-H. Park, J. Hong, J. Jung, B. S. Kim, G. Han, W. Kyung, Y. Kim, S.-K. Mo, J. Denlinger, et al., Phys. Rev. Lett. 121, 186401 (2018).
- Ünzelmann et al. [2020] M. Ünzelmann, H. Bentmann, T. Figgemeier, P. Eck, J. N. Neu, B. Geldiyev, F. Diekmann, S. Rohlf, J. Buck, M. Hoesch, M. Kalläne, K. Rossnagel, R. Thomale, T. Siegrist, G. Sangiovanni, D. D. Sante, and F. Reinert, arXiv preprint arXiv:2012.06996 (2020).
- Park et al. [2012b] S. R. Park, J. Han, C. Kim, Y. Y. Koh, C. Kim, H. Lee, H. J. Choi, J. H. Han, K. D. Lee, N. J. Hur, et al., Phys. Rev. Lett. 108, 046805 (2012b).
- Schüler et al. [2020] M. Schüler, U. De Giovannini, H. Hübener, A. Rubio, M. A. Sentef, and P. Werner, Sci. Adv. 6, eaay2730 (2020).
- Wang and Gedik [2013] Y. Wang and N. Gedik, Phys. Status Solidi RRL 7, 64 (2013).
- Wang et al. [2011] Y. Wang, D. Hsieh, D. Pilon, L. Fu, D. Gardner, Y. Lee, and N. Gedik, Phys. Rev. Lett. 107, 207602 (2011).
- Schultz et al. [2009] M. Schultz, S. Levy, J. W. Reiner, and L. Klein, Phys. Rev. B 79, 125444 (2009).
- Mathieu et al. [2004] R. Mathieu, A. Asamitsu, H. Yamada, K. Takahashi, M. Kawasaki, Z. Fang, N. Nagaosa, and Y. Tokura, Phys. Rev. Lett. 93, 016602 (2004).
- Zhang et al. [2019] D. Zhang, Y. Wang, N. Lu, X. Sui, Y. Xu, P. Yu, and Q.-K. Xue, Phys. Rev. B 100, 060403 (2019).
- Koster et al. [1998] G. Koster, B. L. Kropman, G. J. Rijnders, D. H. Blank, and H. Rogalla, Appl. Phys. Lett. 73, 2920 (1998).
- Klein et al. [1996] L. Klein, J. Dodge, C. Ahn, J. Reiner, L. Mieville, T. Geballe, M. Beasley, and A. Kapitulnik, J. Phys. Condens. Matter 8, 10111 (1996).
- Kresse and Furthmüller [1996] G. Kresse and J. Furthmüller, Phys. Rev. B 54, 11169 (1996).
- Kresse and Joubert [1999] G. Kresse and D. Joubert, Phys. Rev. B 59, 1758 (1999).
- Perdew et al. [1996] J. P. Perdew, K. Burke, and M. Ernzerhof, Phys. Rev. Lett. 77, 3865 (1996).
- Blöchl [1994] P. E. Blöchl, Phys. Rev. B 50, 17953 (1994).
- Pizzi et al. [2020] G. Pizzi, V. Vitale, R. Arita, S. Blügel, F. Freimuth, G. Géranton, M. Gibertini, D. Gresch, C. Johnson, T. Koretsune, et al., J. Phys. Condens. Matter. 32, 165902 (2020).
- Liechtenstein et al. [1995] A. I. Liechtenstein, V. I. Anisimov, and J. Zaanen, Phys. Rev. B 52, R5467 (1995).
- Vaugier et al. [2012] L. Vaugier, H. Jiang, and S. Biermann, Phys. Rev. B 86, 165105 (2012).
- Bezdicka et al. [1993] P. Bezdicka, A. Wattiaux, J. Grenier, M. Pouchard, and P. Hagenmuller, Z. Anorg. Allg. Chem. 619, 7 (1993).