Variations in the slope of the resolved star-forming main sequence: a tool for constraining the mass of star-forming regions
Abstract
The correlation between galaxies’ integrated stellar masses and star formation rates (the ‘star formation main sequence’; SFMS) is a well-established scaling relation. Recently, surveys have found a relationship between the star formation rate and stellar mass surface densities on kpc and sub-kpc scales (the ‘resolved SFMS’; rSFMS). In this work, we demonstrate that the rSFMS emerges naturally in FIRE-2 zoom-in simulations of Milky Way-mass galaxies. We make SFR and stellar mass maps of the simulated galaxies at a variety of spatial resolutions and star formation averaging time-scales and fit the rSFMS using multiple methods from the literature. While the absolute value of the SFMS slope () depends on the fitting method, the slope is steeper for longer star formation time-scales and lower spatial resolutions regardless of the fitting method employed. We present a toy model that quantitatively captures the dependence of the simulated galaxies’ on spatial resolution and use it to illustrate how this dependence can be used to constrain the characteristic mass of star-forming clumps.
keywords:
galaxies: star formation – galaxies: fundamental parameters – galaxies: evolution1 Introduction
Over the past decade, the ‘star formation main sequence’ (SFMS; Brinchmann et al., 2004; Daddi et al., 2007; Noeske et al., 2007; Salim et al., 2007), the roughly linear correlation between actively star-forming galaxies’ total star formation rates (SFRs) and stellar masses, has become a key scaling relation in observational galaxy formation. A wealth of observations show that this relatively tight correlation (with an intrinsic scatter of dex; Speagle et al., 2014; Whitaker et al., 2015) holds across many orders of magnitude in stellar mass and at all redshifts probed (; e.g. Brinchmann et al., 2004; Daddi et al., 2007; Elbaz et al., 2007; Noeske et al., 2007; Pannella et al., 2009; Schreiber et al., 2015), although quantitative details such as the precise values and redshift evolution of the normalization, power-law index, and scatter are still debated (e.g. Speagle et al., 2014; Whitaker et al., 2015; Schreiber et al., 2015). This correlation holds in effectively all modern galaxy formation simulations (e.g. Torrey et al., 2014; Furlong et al., 2015; Sparre et al., 2015, 2017) and semi-analytic models (e.g. Dutton et al., 2010; Hirschmann et al., 2016; Brennan et al., 2017).
In recent years, various authors have studied the spatially resolved SFR–stellar mass relation (rSFMS) using photometric or integral field unit (IFU) observations of individual galaxies (e.g. Cano-Díaz et al., 2016; González Delgado et al., 2016; Abdurro’uf & Akiyama, 2017; Hsieh et al., 2017; Maragkoudakis et al., 2017; Ellison et al., 2018; Liu et al., 2018; Erroz-Ferrer et al., 2019). While the observed rSFMS on kpc and pc scales has been documented by recent observational surveys, the correlation between the resolved stellar mass surface density () and SFR surface density () has not been explored in depth in numerical simulations. To date, Trayford & Schaye (2019) remains the only study to investigate the existence and redshift evolution of the rSFMS in numerical simulations, particularly the EAGLE cosmological simulation (Crain et al., 2015; Schaye et al., 2015).
We present a study of the rSFMS in cosmological zoom-in simulations that resolve the dense ISM and include explicit stellar feedback. Specifically, we analyse a set of Milky Way-mass ( at ) simulated galaxies from the Feedback in Realistic Environments (FIRE) Project111http://www.fire.northwestern.edu run using the FIRE-2 physics modules (Hopkins et al., 2018). For each galaxy, we generate SFR and stellar maps at different spatial resolutions using multiple commonly used SFR averaging time-scales (10 Myr and 100 Myr) to crudely investigate the sensitivity of our results to the SFR tracer. We find that the slope of the rSFMS depends on both the spatial resolution of the maps and the time-scale of the SFR tracer. We then present a toy model to interpret the simulations and to demonstrate how the dependence of the slope of the rSFMS on spatial resolution and SFR tracer can be used to constrain the characteristic mass (or, equivalently, area filling factor) of star-forming clumps when individual clumps are not resolved.
2 Simulations and Analysis Methods
In this Letter, we examine the existence and robustness (to observational resolution, SFR tracer time-scale, and fitting method) of the resolved correlation using simulations of Milky Way-mass galaxies from the FIRE project; all details of the methods are described in Section 2 of Hopkins et al. (2018). The simulations were run using gizmo222http://www.tapir.caltech.edu/~phopkins/Site/GIZMO.html (Hopkins, 2015) in its meshless finite-mass (MFM) configuration. Both hydrodynamic and gravitational (force-softening) spatial resolution are set in a fully adaptive Lagrangian manner; mass resolution is fixed. The simulations include cooling and heating from a meta-galactic background and local stellar sources from K; star formation in locally self-gravitating, dense, self-shielding molecular, Jeans-unstable gas, assuming an instantaneous efficiency of 100 per cent per local free-fall time (); and stellar feedback from OB & AGB mass loss, SNe Ia & II, and multi-wavelength photo-heating and radiation pressure, with inputs taken directly from stellar evolution models. The FIRE physics, source code, and all numerical parameters are exactly identical to those in Hopkins et al. (2018).
The work presented here uses isolated Milky Way-mass FIRE-2 galaxies with halo masses ranging between and M⊙. In particular, we use the following FIRE-2 galaxies: m12b, m12c, m12f, m12i, m12m, m12r, and m12w. The halos were simulated with a baryon mass resolution M⊙. We include all snapshots with in our analysis (70 snapshots). For more details about the galaxies used, we refer the reader to Wetzel et al. (2016), Hopkins et al. (2018), and Samuel et al. (2019).
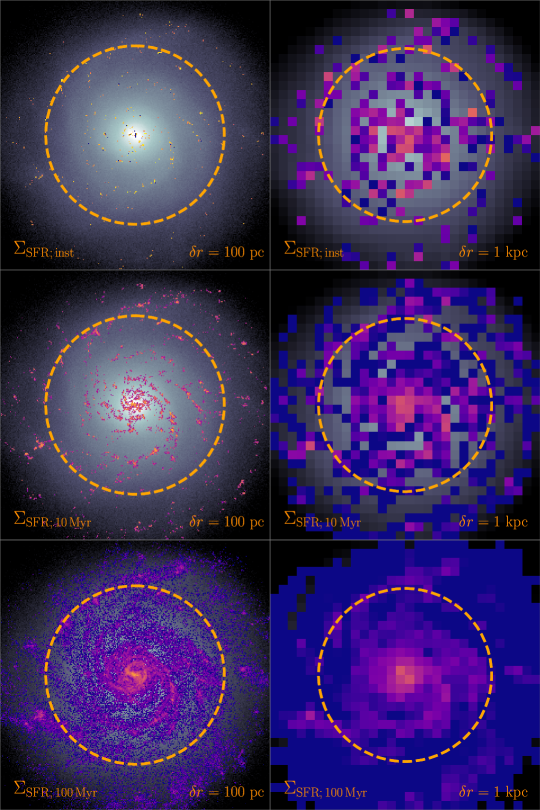
Star formation rate surface density, and stellar mass surface density maps were generated for the FIRE-2 galaxies with 333The results presented in this work remain unchanged when using independent snapshots (every Myr ¿ ). following Orr et al. (2018). Only particles within 15 kpc above/below the galactic disc contribute to the surface density maps444The particle selection is chosen to be consistent with Orr et al. (2018) who studies the Kennicutt-Schmidt relation in the same galaxy sample.. The galaxies are deposited, face-on (along the stellar angular momentum axis), onto kpc2 grids with resolutions ranging from pc to kpc. Note that we do not explore resolutions higher than pc, where we expect our star formation rate tracers to be affected by Poisson statistics (i.e. only a few young star particles contributing to a pixel). The SFR is measured using three SFR tracers: (1) ‘instantaneous’ SFR, (2) Myr-averaged SFR, and (3) Myr-averaged SFR. 555Averaging time-scales of 10 and 100 Myr are often used to crudely proxy observational SFR tracers such as recombination lines and FIR emission (e.g. Sparre et al., 2017), but the time-scale probed by a specific tracer is sensitive to e.g. the detailed recent star formation history and how dust attenuation varies with age (see table 1 of Kennicutt & Evans, 2012, and the associated discussion). We adopt these specific time-scales because they are commonly used in the literature, but our conclusions are insensitive to these choices. The time-averaged SFRs were calculated using the stellar particles’ ages and correcting for mass-loss from stellar winds and stellar evolution. The instantaneous SFR refers to the SFR computed from the gas particles’ densities and local free-fall timescales via the prescription stated above. Figure 1 shows a sample of the maps generate over a range of spatial resolutions and using different SFR time-scales.
Pixels within twice the stellar half-mass radius () with non-zero are extracted from the maps, and the distribution is fit to investigate the effect of resolution and SFR tracer on the slope of the rSFMS (). We implement two fitting methods that are commonly used to fit the SFMS: ordinary least squares (OLS; e.g. Liu et al., 2018), and orthogonal distance regression (ODR; e.g. Hsieh et al., 2017). While the absolute slope depends on the choice of fitting method (OLS, ODR, fitting medians, fitting modes), the qualitative trends shown in this work are robust to changes in the fitting method. Therefore, we adopt OLS to illustrate our results because it is more commonly used in the literature.
3 Results
3.1 The rSFMS in the FIRE-2 simulations
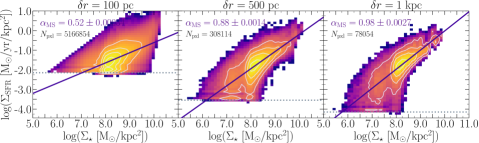
We first investigate the existence of the rSFMS in the simulations. Figure 2 shows the distribution of pixels from the simulated galaxies in space at three example resolutions: pc, pc, and kpc.
The rSFMS emerges in the simulations even though it is not explicitly prescribed in the sub-grid physics model. A similar rSFMS is also seen in individual galaxies. At resolutions of kpc the slope of the rSFMS of the simulated galaxies is broadly consistent with observations ( at kpc; Cano-Díaz et al., 2016; González Delgado et al., 2016; Abdurro’uf & Akiyama, 2017; Hsieh et al., 2017; Maragkoudakis et al., 2017; Liu et al., 2018).
Figure 3 shows the effect of pixel resolution on the measured rSFMS slope for our three SFR tracers (instantaneous, Myr–average, Myr–average). For reference, the open symbols show the measured values from observational studies at low redshift (Cano-Díaz et al., 2016; González Delgado et al., 2016; Abdurro’uf & Akiyama, 2017; Hsieh et al., 2017; Maragkoudakis et al., 2017; Liu et al., 2018; Erroz-Ferrer et al., 2019). The different fitting methods and sample selections contribute to the scatter in the observed (e.g. Hsieh et al., 2017; Lin et al., 2019; Vulcani et al., 2019; Ellison et al., 2020). In the simulations, we find that as the spatial resolution increases, the rSFMS becomes shallower for all SFR tracers. The effect is more pronounced for the shorter-time-scale tracers. Additionally, at a given pixel scale, the slope depends on the SFR tracer. The shorter-time-scale tracers yield a shallower slope. We note that whilst the absolute value of the slope of the rSFMS and its dependence on resolution are sensitive to the details of the fitting method (such as choices of binning, weighting, SFR tracers, and threshold cuts), the generic steepening of with lower resolution (or longer timescale SFR tracers) is robust to such choices. The dependence of on spatial resolution and the time-scale of the SFR tracer represents an important caveat for comparisons between observational studies.
3.2 The effect of clumpy star formation
We propose that the reason for the dependence of on spatial resolution and SFR tracer time-scale is the contrast between the clumpy distribution of star-forming regions and the relatively smooth underlying stellar mass distribution. As the spatial resolution decreases, a pixel’s remains roughly unchanged, while the effective contribution of an isolated star-forming region decreases, thus causing a significant decrease in . This effect is less severe if there are more star-forming regions in a given pixel, since the higher filling factor mitigates the dilution effect of moving to lower resolution. The time-scale of the SFR tracer has a similar effect – as can be seen from Figure 1, if SFRs are averaged over a longer time, they have a larger filling factor. Since the gas profile decreases radially, star-forming regions are sparsely separated in the outer regions of a given galaxy (cf. Figure 1). Hence, the aforementioned effect of resolution and time-scales is more pronounced at lower (which corresponds to larger radii, on average) thus causing a steeper correlation as the resolution decreases. The effect of resolution on the rSFMS slope is even more prominent for the shorter-time-scale SFR tracers, which trace smaller and ‘patchier’ regions (see Figure 1) and therefore are more severely affected by the change in pixel resolution.
In the scenario proposed above, the severity of the effect of pixel resolution (and SFR tracer time-scale) depends on the filling factor (and thus the total number, or equivalently the characteristic mass) of star-forming regions. The inset of Figure 3 shows the dependence of the rSFMS slope on the fraction of pixels (within ) that host at least one star-forming region. The star formation filling factor correlates tightly with the rSFMS slope. As the star formation filling factor increases, the measured SFMS slope increases, thus supporting our hypothesis. Note that the SFMS slope exhibits a small dependence on the star formation time-scale at a given filling-factor, whereas strongly depends on the filling factor.
We further investigate the dependence of on spatial resolution (and filling factor) with a toy model of galactic star formation. The toy model includes two components: (1) smooth synthetic stellar profiles and (2) clumpy star formation. We generate synthetic galaxies with a global Myr–averaged SFR of M⊙/yr, appropriate for a Milky Way-mass galaxy, and spawn them with star-forming regions as described below:
-
Stellar profile: The surface density profiles are described by an azimuthally symmetric exponential disc profile:
where Mkpc2 is the stellar surface density at kpc, and the disc scale length is given by kpc (McGaugh, 2016).
-
Star-forming regions: We assume an exponential gas profile parameterized by a scale of kpc (Kalberla & Dedes, 2008). We randomly spawn star-forming regions by sampling from a probability distribution following the gas surface density profile assuming a Kennicutt-Schmidt-like scaling (i.e. ; Kennicutt 1998) and deposit them onto a grid with a pixel scale of pc. The masses of star-forming regions are drawn probabilistically from a Schechter distribution (e.g., Adamo et al., 2015): where and is allowed to vary. Therefore, the number of star-forming regions is dictated by the choice of and the total SFR. Each distribution is characterised by an average clump mass: .
Note that the toy model is not intended to be a fit to the FIRE galaxies presented in Section 3.1. Instead, the parametric stellar profile and star-forming region distribution are chosen to broadly represent a synthetic Milky-Way profile. We emphasise that the results of the toy model do not depend on the scaling parameters, the total SFR, , or .
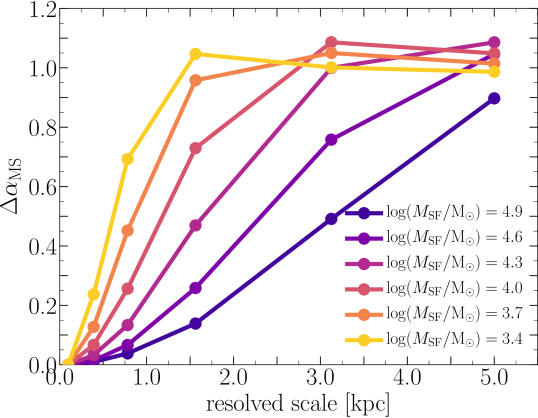
The synthetic galaxies are then degraded to lower resolutions, and the rSFMS is fitted following the method outlined above. Figure 4 demonstrates the effect of pixel resolution on the measured rSFMS slope for different . As the resolution decreases, the change in the rSFMS slope () is more drastic. Different choices of exhibit a distinct behaviour with varying resolution. The galaxies with a small (large star formation filling factor since a high number of regions is required to accumulate the fixed total SFR) show a less severe dependence on resolution beyond a critical resolved scale due to the decreased sensitivity to dilution effects when the pixel filling factor is high. For a large enough pixel size, the underlying SFR field becomes statistically uniform, thus causing the rSFMS slope to exhibit a shallower dependence on resolution. The dependence of on resolution remains unchanged if the clump mass was fixed to .
4 Summary & Discussion
In this Letter, we present the first analysis of the rSFMS of Milky Way-mass galaxies in the FIRE-2 simulations. We have demonstrated that the SFR tracer time-scales and pixel resolution can both have a significant impact on the derived slope of the rSFMS. We have shown that this effect is due to the clumpy nature of star formation; hence the measured slope of the rSFMS depends directly on the filling factor of star-forming regions, and the physical properties (i.e. mass) of star-forming clumps.
The dependence of the rSFMS slope on resolution and SFR tracer can be used to constrain properties (e.g. mass) of star-forming clumps (see Figure 4). Using a more realistic distribution of star-forming clump masses (e.g. a radially dependent Schechter function or power-law), the toy model presented in this work (3.2) could potentially be used to infer observed average star-forming clump masses from the dependence of on resolution. Additionally, the variation in the rSFMS slope may hint that the rSFMS may not be a fundamental diagnostic of star formation. Instead, understanding the scales at which the rSFMS deviates from the global and kpc-scale relations may shed more light on star formation on galactic scales.
Although the work presented here focuses on the rSFMS, the same slope dependence on resolution will be seen for other relationships that combine clumpy properties (here, ) with more smoothly varying ones (here, ). Conversely, relationships that use quantities that probe similar scales (such as the Kennucutt-Schmidt law) should not be strongly affected by resolution. Indeed, Orr et al. (2018) report that the Kennicutt-Schmidt law does not depend on resolution over a similar resolution range as studied in this work.
The work presented in this Letter has notable implications for IFU surveys. Particularly, comparisons between surveys can be undermined by several effects, including (1) different pixel resolutions and (2) different SFR tracers, which are sensitive to different time-scales (and thus physical scales). Moreover, by progressively degrading high-resolution IFU data to coarser resolutions and analyzing the dependence of the rSFMS slope on spatial resolution, the characteristic mass of star-forming regions can be inferred using toy models similar to the one presented here.
Acknowledgements
The authors thank the anonymous referee for their helpful comments which improved the presentation of this work. The authors thank Connor Bottrell, Greg Bryan, John Forbes, Shy Genel, Li-Hwai Lin, Nic Loewen, Ari Maller, Hsi-An Pan, David Patton, Rachel Somerville, Mallory Thorp, and Joanna Woo for their insightful comments and helpful discussions. MHH acknowledges the receipt of a Vanier Canada Graduate Scholarship. SLE acknowledges the receipt of an NSERC Discovery Grant. The data used in this work were, in part, hosted on facilities supported by the Scientific Computing Core at the Flatiron Institute, a division of the Simons Foundation.
References
- Abdurro’uf & Akiyama (2017) Abdurro’uf Akiyama M., 2017, MNRAS, 469, 2806
- Adamo et al. (2015) Adamo A., Kruijssen J. M. D., Bastian N., Silva-Villa E., Ryon J., 2015, Monthly Notices of the Royal Astronomical Society, 452, 246
- Brennan et al. (2017) Brennan R., et al., 2017, MNRAS, 465, 619
- Brinchmann et al. (2004) Brinchmann J., Charlot S., White S. D. M., Tremonti C., Kauffmann G., Heckman T., Brinkmann J., 2004, MNRAS, 351, 1151
- Cano-Díaz et al. (2016) Cano-Díaz M., et al., 2016, ApJ, 821, L26
- Crain et al. (2015) Crain R. A., et al., 2015, MNRAS, 450, 1937
- Daddi et al. (2007) Daddi E., et al., 2007, ApJ, 670, 156
- Dutton et al. (2010) Dutton A. A., van den Bosch F. C., Dekel A., 2010, MNRAS, 405, 1690
- Elbaz et al. (2007) Elbaz D., et al., 2007, A&A, 468, 33
- Ellison et al. (2018) Ellison S. L., Sánchez S. F., Ibarra-Medel H., Antonio B., Mendel J. T., Barrera-Ballesteros J., 2018, MNRAS, 474, 2039
- Ellison et al. (2020) Ellison S. L., et al., 2020, MNRAS, 493, L39
- Erroz-Ferrer et al. (2019) Erroz-Ferrer S., et al., 2019, MNRAS, 484, 5009
- Furlong et al. (2015) Furlong M., et al., 2015, MNRAS, 450, 4486
- González Delgado et al. (2016) González Delgado R. M., et al., 2016, A&A, 590, A44
- Hirschmann et al. (2016) Hirschmann M., De Lucia G., Fontanot F., 2016, MNRAS, 461, 1760
- Hopkins (2015) Hopkins P. F., 2015, MNRAS, 450, 53
- Hopkins et al. (2018) Hopkins P. F., et al., 2018, MNRAS, 480, 800
- Hsieh et al. (2017) Hsieh B. C., et al., 2017, ApJ, 851, L24
- Kalberla & Dedes (2008) Kalberla P. M. W., Dedes L., 2008, A&A, 487, 951
- Kennicutt (1998) Kennicutt Robert C. J., 1998, ApJ, 498, 541
- Kennicutt & Evans (2012) Kennicutt R. C., Evans N. J., 2012, ARA&A, 50, 531
- Lin et al. (2019) Lin L., et al., 2019, ApJ, 884, L33
- Liu et al. (2018) Liu Q., Wang E., Lin Z., Gao Y., Liu H., Berhane Teklu B., Kong X., 2018, ApJ, 857, 17
- Maragkoudakis et al. (2017) Maragkoudakis A., Zezas A., Ashby M. L. N., Willner S. P., 2017, MNRAS, 466, 1192
- McGaugh (2016) McGaugh S. S., 2016, ApJ, 816, 42
- Noeske et al. (2007) Noeske K. G., et al., 2007, ApJ, 660, L43
- Orr et al. (2018) Orr M. E., et al., 2018, MNRAS, 478, 3653
- Pannella et al. (2009) Pannella M., et al., 2009, ApJ, 698, L116
- Salim et al. (2007) Salim S., et al., 2007, ApJS, 173, 267
- Samuel et al. (2019) Samuel J., et al., 2019, arXiv e-prints, p. arXiv:1904.11508
- Schaye et al. (2015) Schaye J., et al., 2015, MNRAS, 446, 521
- Schreiber et al. (2015) Schreiber C., et al., 2015, A&A, 575, A74
- Sparre et al. (2015) Sparre M., et al., 2015, MNRAS, 447, 3548
- Sparre et al. (2017) Sparre M., Hayward C. C., Feldmann R., Faucher-Giguère C.-A., Muratov A. L., Kereš D., Hopkins P. F., 2017, MNRAS, 466, 88
- Speagle et al. (2014) Speagle J. S., Steinhardt C. L., Capak P. L., Silverman J. D., 2014, ApJS, 214, 15
- Torrey et al. (2014) Torrey P., Vogelsberger M., Genel S., Sijacki D., Springel V., Hernquist L., 2014, MNRAS, 438, 1985
- Trayford & Schaye (2019) Trayford J. W., Schaye J., 2019, MNRAS, 485, 5715
- Vulcani et al. (2019) Vulcani B., et al., 2019, Monthly Notices of the Royal Astronomical Society, 488, 1597
- Wetzel et al. (2016) Wetzel A. R., Hopkins P. F., Kim J.-h., Faucher-Giguère C.-A., Kereš D., Quataert E., 2016, ApJ, 827, L23
- Whitaker et al. (2015) Whitaker K. E., et al., 2015, ApJ, 811, L12