Electromagnetic signals from the decay of free neutrons in the first hours of neutron star mergers
Abstract
The first hours following a neutron star merger are considered to provide several UV/optical/NIR signals: -decay emission from free neutrons, radioactive decay of shocked heavy elements in the cocoon and cocoon’s cooling emission. Here we consider two additional emission sources: -decay of free neutrons in the cocoon and synchrotron by the -decay electrons. We present 3D RHD simulations of jets that propagate in a multi-layer ejecta from the merger and calculate semi-analytically the resulting light curves. We find that the free neutrons emission at high latitudes is enhanced by the cocoon by a factor of a few to power a wide () and brief ( hour) UV signal that can reach an absolute magnitude of -15, comparable with the cooling emission. If the ejected neutron matter mass is , the synchrotron emission may yield a long ( hours) quasi-isotropic UV/optical signal with an absolute magnitude between -12 and -15, depending on the magnetic field. Such a high mass of a mildly-relativistic component may partly obscure the cocoon’s shocked r-process elements, thereby attenuating its radioactive decay emission. Future observations on these timescales, including null detections, may place constraints on the ejected neutron matter mass and shed light on the ejecta and jet-cocoon characteristics.
keywords:
transients: neutron star mergers | transients: gamma-ray bursts | radiation mechanisms:general | methods: numerical1 Introduction
The first gravitational wave event from a binary neutron star merger (NSM), GW170817, produced detectable signals throughout the entire electromagnetic spectrum, ranging from the very first seconds to years later.
Following the detections of gravitational waves (Abbott
et al., 2017) and -rays 1.7s later (Goldstein
et al., 2017; Savchenko
et al., 2017), a search for the host galaxy was initiated. But it was only 10.9 hours after the merger that the first optical counterpart was detected and the host galaxy was found (Coulter
et al., 2017). Over the course of ten days, additional optical and IR signals were detected and allowed a detailed examination of Kilonova models (Li &
Paczyński, 1998; Kulkarni, 2005; Metzger
et al., 2010; Barnes &
Kasen, 2013; Kasen
et al., 2013; Tanaka &
Hotokezaka, 2013). The observations were found to be in a good agreement with theoretical predictions (see e.g. Kasen et al. 2017), suggesting that a significant amount of mass of heavy r-process elements was ejected.
While optical and IR observations of GW170817 shed light on the post-merger evolution on day timescales, the lack of observations in the first 10.9 hours keeps the early evolution of the system in the dark. During this early period, several potential emission sources may yield a detectable signal:
(i) -decay of free neutrons (Kulkarni, 2005; Metzger
et al., 2015):
As a shock crosses the outer crust of the NS during the coalescence, it may disintegrate heavy nuclei to free neutrons (e.g. Ishii
et al. 2018). The neutrons may avoid being captured into nuclei if they reach mildly-relativistic velocities so that their interaction with the slower ejected mass of heavy nuclei is minimal (Bauswein
et al., 2013; Just et al., 2015; Goriely et al., 2015; Ishii
et al., 2018). Free neutrons can also form in the disc surrounding the newly formed compact object, if the electron fraction is low (Perego
et al., 2014). Simulations of NSMs (Bauswein
et al., 2013; Just et al., 2015) have found that a relatively large amount of free neutrons is ejected (), and may power an early bright UV/optical signal (Metzger
et al., 2015), which is possibly polarized (Matsumoto, 2018).
(ii) Cocoon’s cooling emission and heavy r-process -decay (“cocoon’s Kilonova") (Nakar &
Piran, 2017; Gottlieb
et al., 2018a; Kasliwal
et al., 2017; Piro &
Kollmeier, 2018):
VLBI radio images of GW170817 revealed a superluminal motion of the emitting source between 75 and 230 days after the merger (Mooley
et al., 2018). This observation confirmed that NSMs are associated with relativistic jets. The jet, launched a short time after the merger, has to propagate through the expanding ejecta. The jet-ejecta interaction shocks jet and ejecta material to form a hot cocoon around the jet. The cocoon powers a /X-ray signal on timescales of seconds to minutes when breaking out from the expanding ejecta (Gottlieb et al., 2018b). As the cocoon cools down, it can give rise to a bright UV/optical cooling emission over the course of minutes to hours. After a couple of hours, the mildly-relativistic shocked heavy elements in the cocoon undergo radioactive decay to power the cocoon’s Kilonova in the optical/NIR bands (Nakar &
Piran, 2017; Gottlieb
et al., 2018a).
(iii) -decay of free neutrons in the cocoon:
While the origin of the -ray signal in GW170817 is still under debate, the most likely explanation is a cocoon shock breakout from a mildly-relativistic tail of the ejecta (Gottlieb et al., 2018b). The existence of the tail ejecta has been suggested by several theoretical arguments (Hotokezaka et al., 2012, 2018; Kyutoku
et al., 2012; Bauswein
et al., 2013; Beloborodov
et al., 2018; Radice et al., 2018), and is most likely linked to the ejection of free neutrons.
If this component is quasi-isotropic, its interaction with the cocoon is inevitable. Such interaction accelerates free neutrons further and alters their spatial distribution to affect their early emission.
(iv) Synchrotron emission from the -decay electrons:
During the decay of the free neutrons, mildly-relativistic electrons are emitted with an energy of MeV. If the medium into which the electrons are emitted has some degree of magnetization, the electrons emit synchrotron radiation. The large number of electrons () emitted during the first hours may power a detectable signal.
A detection of an electromagnetic probe during the first hours after the merger is of a great importance as such a signal may help constraining the composition and the distribution of the ejecta and the cocoon. Furthermore, it may even hint whether the jet successfully broke out from the ejecta or was choked inside (see e.g. Kasliwal et al. 2017; Gottlieb et al. 2018b). However, the multiple predictions in the UV/optical/NIR bands rises difficulties in discriminating the potential signals (see also Arcavi 2018).
Here we carry out 3D relativistic hydrodynamic (RHD) simulations of a jet propagation in expanding multi-layer ejecta, which we post-process semi-analytically to derive the emissions from sources (iii) and (iv) which have not been examined to date. We also study the effect of the tail ejecta on source (ii) and derive the full light curves for a comparison of all signals. Such an analysis may be of use to infer the origin of a future detected signal.
2 Numerical Simulations
2.1 Numerical setup
We perform two 3D RHD simulations of a jet propagation in expanding ejecta with the code PLUTO v4.0 (Mignone et al., 2007). The initial setup of the simulations contains a homologous expansion of a two-component ejecta, including a massive () non-relativistic () component with a radial density profile . The massive part is embedded in a faster tail of the ejecta () which maintains a steeper radial profile (Gottlieb et al., 2018b). The mass of the latter, , is set by the continuity of the density profile between the two components. Our choice of the massive ejecta parameters is based on those inferred from GW170817 (see e.g. Kasen et al., 2017). We assume the free neutrons to reside in the fast tail ejecta and the heavy r-process elements to compose the massive ejecta. To trace each component after it is shocked and mixed with the jet and the cocoon, we employ tracers for the massive and tail ejecta, respectively.
We let the ejecta expand for after the merger, after which we inject a relativistic () hot () top-hat jet at , with an opening angle and initial radius . The jet operates for during which it maintains a constant two-sided luminosity . We let the simulation run for a fine period , after which most of the mildly-relativistic and relativistic elements reach the homologous expansion phase. For simulation I we consider typical jet parameters, similar to the ones inferred in GW170817 (Mooley et al., 2018), and adopt favorable tail ejecta properties for the emission. In simulation II we use a wider jet, so that our choice of parameters is slightly more optimal for the jet to break out. The parameters of the simulations are listed in Table 1.
| Simulation | I | II |
|---|---|---|
| 0.2 | 0.35 | |
| 2 | 3.5 | |
| 0.7 | ||
| 111Simulations of NSMs (e.g. Bauswein et al. 2013; Hotokezaka et al. 2018) underestimate compared with the one inferred in GW170817. Normalizing their numerical results to the in GW170817 produces higher correspondingly. | ||
| 5 | 3 | |
| [s] | 0.8 | 0.4 |
| [s] | 1 | 2 |
| 1 | 2 | |
| [s] | 7.6 | 6.8 |
The simulations’ grid is Cartesian and a relativistic ideal equation of state with an adiabatic index of 4/3 is applied. We use three patches along the and axes, and two patches on the -axis along which the jet propagates. The inner and axes are set inside cm with 240 uniform cells. The outer patches are stretched logarithmically to cm with 280 cells on each side. The -axis has one uniform patch inside the star from to with 400 cells, and anothers logarithmic patch with 1200 cells up to cm. The total number of cells is thus . This grid resolution is comparable to the one used in Gottlieb et al. (2018a) and was found to converge.
2.2 Hydrodynamic evolution
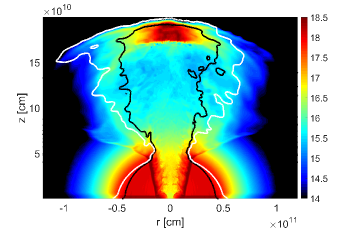
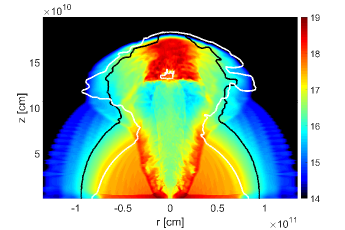
Figure 1 depicts the logarithmic energy density maps at the end of the simulations. In both simulations the jet spends 1s inside the dense massive ejecta, during which it undergoes intense mixing and forms a hot energetic cocoon (). The interaction between the jet and the massive ejecta along the jet-cocoon interface loads the jet with baryons (Gottlieb et al., 2019) so that both the jet and the cocoon contain a large fraction of heavy r-process elements. This is shown in Figure 1 as the region inside the white contours has at least 10% of massive ejecta concentration.
As the jet-cocoon structure breaks out from the massive ejecta, it expands freely into the fast tail component. The tail ejecta is lighter than the massive component and thus its interaction with the jet and the cocoon is weaker. That implies that the jet remains uncontaminated by free neutrons, while the neutrons concentration in the cocoon depends on the specific parameters of the system. In simulation I, the cocoon is less energetic and the tail ejecta is more massive such that the interaction is stronger (Gottlieb et al., 2019), resulting in a high fraction of free neutrons in the cocoon ( outside the black contours in Figure 1). Since in simulation II the cocoon is more energetic and the tail ejecta is less massive, the interaction is weaker. As a result, only the less energetic outskirts of the cocoon contain a substantial fraction of free neutrons.
3 Post-process calculation
At the end of the simulations most of the outflow expands homologously and we can apply adiabatic relations to infer the hydrodynamics of the system at late times. The extrapolated evolution of the outflow at all times allows us to calculate the UV/optical/NIR light curve during the first day. We study the contribution of four emission mechanisms: cocoon’s cooling, -decay of heavy elements, -decay of free neutrons and synchrotron emission from the -decay electrons. We consider only emission that originates in the cocoon and the fast tail ejecta, and disregard any emission from the jet or the unshocked massive ejecta component.
For each simulation we consider four models in which we vary the opacity, assumed to be grey opacity , and the fraction of free neutrons in the tail ejecta, (Table 2). Note that the fraction of the remaining free neutrons in the tail, , can differ from the initial free neutron fraction, , where is the electron fraction . For example, it is possible that free neutrons are captured by heavy nuclei during the tail interaction with the cocoon. However, we note that shocks at high temperature (K) alter the fraction of free neutrons by disintegration of heavy elements nuclei to free neutrons and capture of free positrons (Ishii et al., 2018). However, in our simulations the shock driven by the jet maintains K so that disintegration does not take place and the capture timescale is much longer than the dynamical time (Metzger et al., 2015). Therefore, the fraction of free neutrons in the cocoon’s shocked material is not expected to change following the shock.
| Model | /g] | |
|---|---|---|
| (Canonical) | ||
For the calculation of the cocoon’s Kilonova and cooling emission we follow Gottlieb et al. (2018a), where the net radioactive heating rate due to r-process decay is (Metzger et al., 2010). For the free neutrons emission which has not been considered in their paper, we apply a similar method. We first calculate the radial optical depth, , along a given solid angle and at each time . Then, at each angle and time we find the trapping radius where and the photosphere where . The free neutrons heating rate at each time and solid angle is (Kulkarni, 2005; Metzger et al., 2015):
| (1) |
where is the free neutrons rest-frame mean lifetime, is the comoving time and is the mass of free neutrons in a given element, being the total mass of the element. We assume that the remaining in the tail ejecta is not composed of heavy r-process elements (instead, it can either be free protons, alpha particles or other elements which are not radioactively unstable), so that the cocoon’s Kilonova is calculated only for . At each angle and time the local rest-frame temperature is set at the photosphere and the radiation field is assumed to be a blackbody. Finally, we boost the local emission at all angles and times to the observer frame, where we integrate the total emission.
The free neutrons decay into , and . The decay electrons may power a synchrotron emission if a magnetic field is present. We approximate the energy of the decay electron to be constant by weight-averaging the narrow emitted electron’s energy spectrum (Cooper et al., 2010). We find keV, which corresponds to an electron Lorentz factor of . While the strength of the magnetic field in the medium is unknown, it is assumed to reflect some fraction of equipartition with the thermal energy density. First, the ejecta from the NSM is expected to have some initial magnetization (e.g. Christie et al. 2019; Fernández et al. 2019). Additionally, the field may also be amplified by different physical processes such as a shock breakout (Waxman & Loeb, 2001) of the cocoon from the tail ejecta or the turbulent nature of the hydrodynamic shock (e.g. Giacalone et al. 2007). Another possibility for a magnetic field amplification arises if the jet-cocoon structure is magnetized (Medvedev & Loeb, 1999). While our jet-cocoon is unmagnetized, simulations (Gottlieb et al., 2020) show that weakly magnetized jets (, is the maximal magnetic field of the jet) feature a rather similar cocoon structure with the one obtained in pure hydrodynamic jets. That implies that our analysis is also applicable for such systems, which can naturally induce a magnetic field.
For the synchrotron calculation we calculate in each cell the magnetic field , neutrons energy , characteristic synchrotron frequency , and number of emitted electrons . Due to the large uncertainty in the value of the magnetic equipartition parameter , we set as our conservative canonical value. For the electron equipartition parameter we use , where and are the electron and proton masses, respectively, and is the Lorentz factor of the neutrons. Then, for each element we calculate the maximal spectral luminosity, , where and are the Thomson cross section and electron charge, respectively. At the relevant timescales self-absorption is expected to take place as , where the self-absorption frequency at time and solid angle is (Waxman, 1997):
| (2) |
where is the medium number density at , denotes the value of the quantity in units of times its c.g.s. units. We find the spectral regime of each element with respect to and the cooling frequency to calculate the local spectral luminosity in the comoving frame which is then boosted and integrated in the observer frame.
4 Light curves
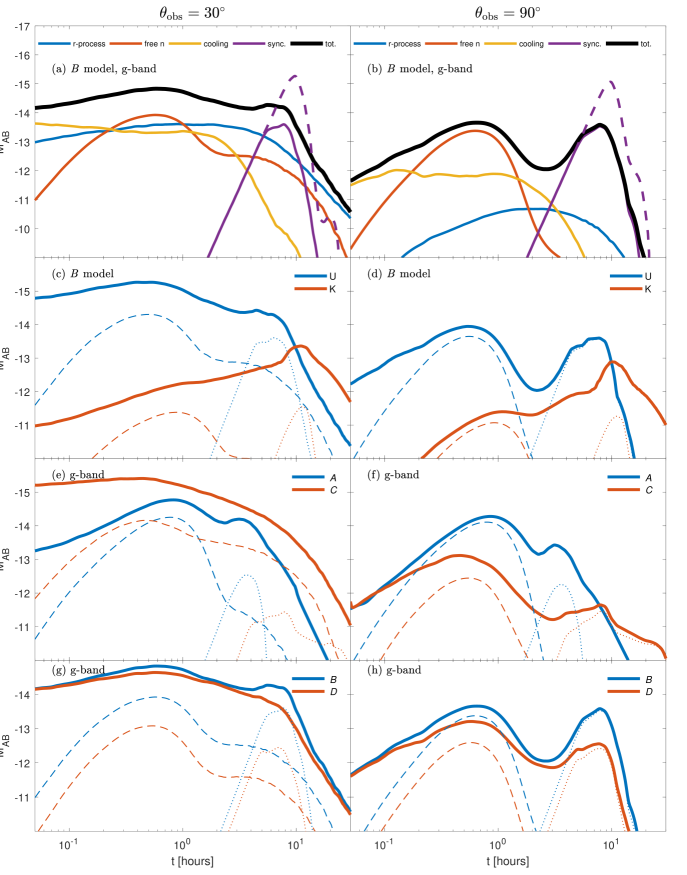
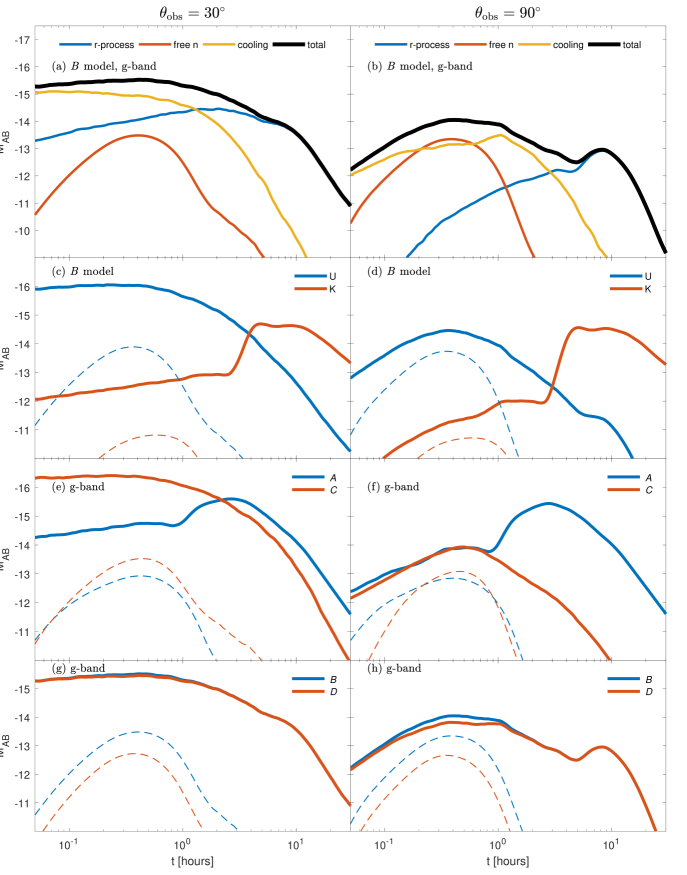
Figures 2 and 3 depict the numerical UV/optical/NIR light curves for simulations I and II, respectively. These are shown by emission mechanism contribution (panels a,b), at a variety of bands (c,d), and for different opacities (e,f) and free neutrons fractions (g,h). The presence of the cocoon at high latitudes alters the spatial distribution of the ejecta and introduces relativistic effects, thereby leading to differences between small and large viewing angles. We find that the light curves can be roughly divided into two regions: for observers who are within from the cocoon’s opening angle and outside of it. At small viewing angles the signal is similarly enhanced due to the cocoon’s mildly-relativistic motion (left panels). For all the cocoon’s contribution is secondary (right panels).
4.1 First hour emission
At early times ( hour) the temperature is high (K after twenty minutes) and the emission lies in the Rayleigh-Jeans tail such that the UV signal is the brightest. The relevant emission sources at these times are free neutrons decay and cocoon’s cooling emission. We find that without relativistic effects, simulation I, in which the tail ejecta is more massive by a factor of 200, would have featured a stronger free neutrons emission (the difference is however small, by a mere one absolute magnitude, see Nakar 2019). In simulation II the tail ejecta is faster so that its boost places the free neutrons emission to be similar in both simulations with a UV peak at (also similar to the peak obtained by Metzger et al. 2015). That implies that for the neutrons mass in simulation I and their velocity in simulation II, the UV signal will peak at an absolute magnitude . At small viewing angles the free neutrons emission is boosted by the cocoon and magnified by up to one absolute magnitude in simulation I. In simulation II the fast tail is moving faster and thus the boost by the cocoon is less significant.
The main difference in the cooling emission between the simulations lies in the cocoon’s energy. As , the cooling emission in simulation II is magnitude brighter. In both simulations we find that a large part of the cocoon is beamed away from observers at large , resulting in magnitudes fainter signal compared to small . The shape of the cooling emission is dictated by the luminosity and temperature power-laws. We find that the temperature drops as , and the cooling luminosity drops fast as at and at . From the Rayleigh-Jeans regime, , it follows that the cooling spectral luminosity is roughly constant as long as the emission is in this regime.
Panels (e,f) show that the opacity of the matter also affects both the absolute and the relative contribution of each emission mechanism. Low opacity leads to an early rise of cooling emission when the temperature is still high and thus the UV/optical luminosity is low, whereas high opacity of /g yields the strongest cooling emission, up to a UV peak at . The sensitivity of the free neutrons to the opacity depends on the mass and the viewing angle. In simulation I the fast tail is sufficiently massive such that it may be optically thick at low latitudes. Consequently, lower opacities for which there are less adiabatic loses, produce the strongest signals. At small viewing angles and light tail ejecta (simulation II) the free neutrons component becomes optically thin early on so that the opacity does not affect the light curves. We conclude that both the boost and the opacity play a more important role for the cocoon’s cooling than the free neutrons emission. As simulations I and II show, the dominating emission mechanism during the first hour depends on the fast tail characteristics, cocoon’s energy, opacity and viewing angle.
4.2 Few hours emission
The shocked ejecta in the cocoon generates a cocoon’s Kilonova signal that peaks in the NIR a few hours after the merger. This emission may be attenuated if the fast tail component contains a negligible fraction of r-process elements and is sufficiently massive to obscure the slower parts of the heavy shocked ejecta. In simulation II the cocoon’s Kilonova is bright () and quasi-isotropic owing to the optically thinness of the fast component, similar to what Gottlieb et al. (2018a) found. In simulation I however the fast tail component becomes optically thin only at
| (3) |
where . Therefore only the mildly-relativistic component at high latitudes contributes to the cocoon’s Kilonova. It then follows that in simulation I the emission is fainter and non-isotropic where at large the emission is fainter by 3 magnitudes compared to low . The shape of the emission is dictated by the luminosity and temperature dependencies. We find that at all relevant times and for most observers and models, the total bolometric luminosity drops fast as , leading to a quasi-flat spectral luminosity at early times, similar to the cooling emission. As expected, the difference between models and points at the importance of the opacity for the cocoon’s Kilonova brightness. Equation (3) shows that outflows with a lower opacity reach their photosphere earlier and suffer from less adiabatic loses, thereby yielding a peak emission that is absolute magnitudes brighter than ones with high (see also Gottlieb et al. 2018a).
If the free neutrons mass is high enough, a synchrotron emission on hours timescale emerges, owing to self-absorption processes as . The peak of the signal is obtained when either drops below or all free neutrons reach their photosphere, whichever comes first. Equation (3) dictates that for the canonical model in simulations I and II all the free neutrons reach the photosphere after 30 hours and hours, respectively. During the adiabatic expansion and before all the free neutrons reach the photosphere, the total mass of the revealed neutrons increases somewhat slower than (Piran et al., 2013). It then follows from Equation (2) that the self-absorption frequency evolves as
| (4) |
where from Equation (2) Hz is the self-absorption frequency 1s after the merger. We therefore get that at,
| (5) |
assuming the parameters of our canonical model and U band frequency. Finally, it follows from Equation (4) that the spectral luminosity at rises as,
| (6) |
The fast rise of , as seen in Equation (6) and the light curves of simulation I, implies that the peak emission strongly depends on the time of the peak. Equation (5) shows that the UV/optical peak is obtained about 10 hours after the merger, as seen in the light curves of simulation I. This signal is quasi-isotropic and thus the synchrotron emission is more prominent at large viewing angles where the cocoon’s Kilonova is fainter. Equation (6) also shows that higher values of (panels a,b), (c,d; up to ), (e,f) or (g,h) yield a brighter synchrotron emission. Note however that Equation (3) indicates that higher opacities result in late exposure of all free neutrons, so that is lower. For example, in simulation I, /g produces the brightest emission as for higher opacities a smaller fraction of neutrons reaches the photosphere before . For simulation II all neutrons reach their photosphere after hour, much before . At this time the emission is too faint to be detected. Table 3 summarizes the dependencies of the synchrotron timescales in Equations (3) and (5) and peak magnitudes (Eq. (6)) on the free neutrons fraction, tail mass and opacity used in our different models.
Generalizing the synchrotron emission, we find that for typical values of and , the condition for a detectable signal is set by Equation (3). It then follows that a UV/optical signal emerges at if the free neutrons mass is , assuming all decay electrons have been revealed by the time of the peak. Differentiating between the late signals of the cocoon’s Kilonova and the synchrotron emission can be achieved by multi-wavelength observations as the latter rises in higher and vice versa.
| Sim./Model | Eq. 3 [hours] | Eq. 5 [hours] | Eq. 6 [] |
|---|---|---|---|
| I/a | 4 | 14 | -12 |
| I/b | 8 | 10 | -14 |
| I/c | 27 | 6 | -11 |
| I/d | 8 | 10 | -12 |
| II/a | 0.3 | 14 | -1 |
| II/b | 1 | 10 | -3 |
| II/c | 3 | 7 | -5 |
| II/d | 1 | 10 | -1 |
5 Conclusions
Simulations of a double NSM have shown that a significant amount of free neutrons is ejected following the merger (Bauswein et al., 2013). The -decay of the free neutrons after minutes may power an early bright UV/optical signal (Kulkarni, 2005; Metzger et al., 2015). In this paper, we studied the effect of the cocoon on the free neutrons emission and the synchrotron emission from the -decay electrons. We performed 3D RHD simulations of a jet-cocoon propagation in a multi-layer expanding ejecta from the merger. We post-processed the numerical results to calculate these signals and compare them with the expected cocoon’s Kilonova and cooling emission (Gottlieb et al. 2018a). Inferring the signatures of these signals in future observations can be used to constrain the physical characteristics of the ejecta and the cocoon.
During the first hour the dominating sources of emission are cocoon’s cooling and free neutrons decay. Our calculations show that the cocoon can boost the free neutrons emission by up to absolute magnitude to power a bright UV peak at -15 to -16 at small viewing angles. Two main differences are found between the two emission sources: (i) While for a quasi-isotropic ejecta of free neutrons a prominent UV signal ( -14) rises even at large viewing angles, the cooling emission strongly depends on the viewing angle; and (ii) The cooling emission is also greatly affected by the opacity, growing brighter for higher opacities. The free neutrons emission is sensitive to the opacity only at low latitudes, where there is enough neutrons mass to be optically thick in the relevant timescales. In such cases the emission is brighter at lower opacities, owing to the lower adiabatic loses. As both signals can share comparable peak times and fluxes, the dominant emission source depends on the specific parameters of the system.
A few hours after the merger the cocoon’s Kilonova and synchrotron emission dominate the light curves. We find that for high, but not unreasonable mass of free neutrons, , a quasi-isotropic synchrotron UV/optical signal emerges hours after the merger at -12, owing to synchrotron self-absorption. The peak emission depends on the highly uncertain value of the magnetic equipartition parameter . For a reasonable , the peak emission of our canonical model in simulation I is obtained at -15. The cocoon’s Kilonova emerges in the NIR bands if the opacity is not too high, /g. However, if the tail ejecta is massive, the optical thickness of the unshocked tail ejecta at low latitudes will partly obscure the cocoon’s Kilonova. If the fast tail is optically thin at these times, the cocoon’s Kilonova signal is also quasi-isotropic. A multi-wavelength observations on a few hours timescale will enable to separate the synchrotron emission from the cocoon’s Kilonova signal. Considering the bright synchrotron emission, even for small , a null detection of a UV signal on hours timescale may place constraints on the total ejected mass in free neutrons.
Our results show that not only that the free neutrons properties alter the free neutrons and synchrotron signals, but affect all emission sources. Unfortunately, the mass and velocity of the free neutrons are highly uncertain. Recently, Ishii et al. (2018) found that the mass of shock-heated free neutrons released from the outer crust of the NS is substantially lower, , than what has been found in previous simulations. Ishii et al. (2018) suggested that the discrepancy can be resolved if the rest of the free neutrons originate from tidal debris or -driven wind. For the former it implies that most of the free neutrons lie at low latitudes and have a minimal interaction with the cocoon. As mentioned above, a lighter mass of free neutrons will naturally reduce the emission from free neutrons but also allows a bright cocoon’s Kilonova emission by virtue of it being optically thin. The velocity of the mildly-relativistic component also plays a crucial role as the Doppler factor grows larger and relativistic effects can substantially enhance the emission.
Finally, while our simulations contain jets that successfully break out from the expanding ejecta, some jets may never break out, leaving the cocoon as the only relativistic component. In such scenarios the cocoon opens up to wider opening angles, thereby becoming more massive and slower. Related calculations of the cocoon’s cooling emission and Kilonova (Kasliwal et al., 2017; Nakar et al., 2018) have shown that such systems yield a longer and brighter signals, owing to the cocoon’s characteristics. Since a choked jet’s cocoon typically moves at a velocity that is comparable to the tail ejecta, we expect that unlike other sources of signals, the effect of such a cocoon on the free neutrons emission will be only mild.
Acknowledgements
We thank Ehud Nakar and the anonymous referee for helpful comments. This work was supported in part by Harvard’s Black Hole Initiative which is funded by grants from JTF and GBMF.
References
- Abbott et al. (2017) Abbott B., et al., 2017, Physical Review Letters, 119, 161101
- Arcavi (2018) Arcavi I., 2018, The Astrophysical Journal, 855, L23
- Barnes & Kasen (2013) Barnes J., Kasen D., 2013, The Astrophysical Journal, 775, 18
- Bauswein et al. (2013) Bauswein A., Goriely S., Janka H. T., 2013, Astrophysical Journal, 773
- Beloborodov et al. (2018) Beloborodov A. M., Lundman C., Levin Y., 2018, eprint arXiv:1812.11247
- Christie et al. (2019) Christie I. M., Lalakos A., Tchekhovskoy A., Fernández R., Foucart F., Quataert E., Kasen D., 2019, Monthly Notices of the Royal Astronomical Society, 490, 4811
- Cooper et al. (2010) Cooper R. L., et al., 2010, Physical Review C, 81, 035503
- Coulter et al. (2017) Coulter D. A., et al., 2017, Science, Volume 358, Issue 6370, pp. 1556-1558 (2017)., 358, 1556
- Fernández et al. (2019) Fernández R., Tchekhovskoy A., Quataert E., Foucart F., Kasen D., 2019, Monthly Notices of the Royal Astronomical Society, 482, 3373
- Giacalone et al. (2007) Giacalone J., Jokipii J. R., Giacalone J., Jokipii J. R., 2007, The Astrophysical Journal, 663, L41
- Goldstein et al. (2017) Goldstein A., et al., 2017, The Astrophysical Journal Letters, Volume 848, Issue 2, article id. L14, 14 pp. (2017)., 848
- Goriely et al. (2015) Goriely S., Bauswein A., Just O., Pllumbi E., Janka H.-T., 2015, Monthly Notices of the Royal Astronomical Society, 452, 3894
- Gottlieb et al. (2018a) Gottlieb O., Nakar E., Piran T., 2018a, Monthly Notices of the Royal Astronomical Society, 473, 576
- Gottlieb et al. (2018b) Gottlieb O., Nakar E., Piran T., Hotokezaka K., 2018b, Monthly Notices of the Royal Astronomical Society, 479, 588
- Gottlieb et al. (2019) Gottlieb O., Levinson A., Nakar E., 2019, Monthly Notices of the Royal Astronomical Society, Volume 488, Issue 1, p.1416-1426, 488, 1416
- Gottlieb et al. (2020) Gottlieb O., Bromberg O., Singh C. B., Nakar E., 2020, in prep.
- Hotokezaka et al. (2012) Hotokezaka K., Kiuchi K., Kyutoku K., Okawa H., Sekiguchi Y.-i., Shibata M., Taniguchi K., 2012, Physical Review D, vol. 87, Issue 2, id. 024001, 87
- Hotokezaka et al. (2018) Hotokezaka K., Kiuchi K., Shibata M., Nakar E., Piran T., 2018, The Astrophysical Journal, Volume 867, Issue 2, article id. 95, 8 pp. (2018)., 867
- Ishii et al. (2018) Ishii A., Shigeyama T., Tanaka M., 2018, The Astrophysical Journal, 861, 25
- Just et al. (2015) Just O., Bauswein A., Pulpillo R. A., Goriely S., Janka H. T., 2015, Monthly Notices of the Royal Astronomical Society, 448, 541
- Kasen et al. (2013) Kasen D., Badnell N. R., Barnes J., 2013, The Astrophysical Journal, 774, 25
- Kasen et al. (2017) Kasen D., Metzger B., Barnes J., Quataert E., Ramirez-Ruiz E., 2017, Nature, 551, 80
- Kasliwal et al. (2017) Kasliwal M. M., et al., 2017, Science, 358, 1559
- Kulkarni (2005) Kulkarni S. R., 2005, arXiv Astrophysics e-prints, astro-ph/0510256
- Kyutoku et al. (2012) Kyutoku K., Ioka K., Shibata M., 2012, Monthly Notices of the Royal Astronomical Society: Letters, Volume 437, Issue 1, p.L6-L10, 437, L6
- Li & Paczyński (1998) Li L.-X., Paczyński B., 1998, The Astrophysical Journal, 507, L59
- Matsumoto (2018) Matsumoto T., 2018, Monthly Notices of the Royal Astronomical Society, 481, 1008
- Medvedev & Loeb (1999) Medvedev M. V., Loeb A., 1999, The Astrophysical Journal, Volume 526, Issue 2, pp. 697-706., 526, 697
- Metzger et al. (2010) Metzger B. D., et al., 2010, Monthly Notices of the Royal Astronomical Society, 406, 2650
- Metzger et al. (2015) Metzger B. D., Bauswein A., Goriely S., Kasen D., 2015, Monthly Notices of the Royal Astronomical Society, 446, 1115
- Mignone et al. (2007) Mignone A., Bodo G., Massaglia S., Matsakos T., Tesileanu O., Zanni C., Ferrari A., 2007, The Astrophysical Journal Supplement Series, 170, 228
- Mooley et al. (2018) Mooley K. P., et al., 2018, Nature, 561, 355
- Nakar (2019) Nakar E., 2019, eprint arXiv:1912.05659
- Nakar & Piran (2017) Nakar E., Piran T., 2017, The Astrophysical Journal, Volume 834, Issue 1, article id. 28, 14 pp. (2017)., 834
- Nakar et al. (2018) Nakar E., Gottlieb O., Piran T., Kasliwal M. M., Hallinan G., 2018, The Astrophysical Journal, Volume 867, Issue 1, article id. 18, 9 pp. (2018)., 867
- Perego et al. (2014) Perego A., et al., 2014, Monthly Notices of the Royal Astronomical Society, 443, 3134
- Piran et al. (2013) Piran T., Nakar E., Rosswog S., 2013, MNRAS, 430, 2121
- Piro & Kollmeier (2018) Piro A. L., Kollmeier J. A., 2018, The Astrophysical Journal, 855, 103
- Radice et al. (2018) Radice D., Perego A., Hotokezaka K., Fromm S. A., Bernuzzi S., Roberts L. F., 2018, The Astrophysical Journal, Volume 869, Issue 2, article id. 130, 31 pp. (2018)., 869
- Savchenko et al. (2017) Savchenko V., et al., 2017, The Astrophysical Journal Letters, Volume 848, Issue 2, article id. L15, 8 pp. (2017)., 848
- Tanaka & Hotokezaka (2013) Tanaka M., Hotokezaka K., 2013, The Astrophysical Journal, 775, 113
- Waxman (1997) Waxman E., 1997, The Astrophysical Journal, 489, L33
- Waxman & Loeb (2001) Waxman E., Loeb A., 2001, Physical Review Letters, 87, 071101