∎
Centrum Wiskunde & Informatica, Amsterdam, Netherlands
22email: karen.kokabisaghi@cwi.nl, ORCID: 0000-0002-4589-7638 33institutetext: 2. Mohammadesmaeil Ezazi 44institutetext: Faculty of management and economics, University of Sistan and Baluchestan, Zahedan, Iran
44email: mohammad.e.ezazi@gmail.com 55institutetext: 3. Reza Tehrani 66institutetext: Faculty of Management, University of Tehran, Tehran, Iran
66email: rtehrani@ut.ac.ir 77institutetext: 4. Nourmohammad Yaghoubi 88institutetext: Faculty of management and economics, University of Sistan and Baluchestan, Zahedan, Iran
88email: nm.yaghoubi@gmail.com
Sanction or Financial Crisis?
Abstract
In this paper, we model the impact of oil price volatility on Tehran stock and industry indices in two periods of international sanctions and post-sanction. To analyse the purpose of study, we use Feed-forward neural networks. The period of study is from 2008 to 2018 that is split in two periods during international energy sanction and post-sanction. The results show that Feed-forward neural networks perform well in predicting stock market and industry, which means oil price volatility has a significant impact on stock and industry market indices. During post-sanction and global financial crisis, the model performs better in predicting industry index. Additionally, oil price-stock market index prediction performs better in the period of international sanctions. Herein, these results are, up to some extent, important for financial market analysts and policy makers to understand which factors and when influence the financial market, especially in an oil-dependent country such as Iran with uncertainty in the international politics.
Keywords:
Feed-forward neural networks Industry index International energy sanction Oil price volatility Tehran stock index1 Introduction
Crude oil price fluctuations have been a concern for the world macroeconomy since oil crises in 1970, 2008 and 2014. According to Organization of Petroleum Exporting Countries (OPEC), the oil price dropped from $145 to $30 in mid 2008 and reached to the low price of $27 in 2014. These sharp downward trends (shocks) influence the economy by disturbing aggregate economic activities and spread to stock market and energy indices Guntner2014 and Nusair2016 and Zhang2016 and Bastianin2016 and Wen2012 and and Angelidis2015 and Niknam2016 and MoyaMartinez2014 . Some studies reported that oil price shocks have different effect in different economies. For example, oil price shocks have different effect on the U.S. economy and oil-exporting countries Kilian2009 and Wang2013 . Although it is expected that higher oil price leads to higher revenue, cash flow and therefore growth in the economy and financial markets in oil-exporting countries Arouri2010 the exact impact of the oil price changes on the financial markets is still unclear. Furthermore, different factors such as the source of oil price shocks Kilian2009 , political issues, developed or emerging stock markets and whether the country is oil-exporter or oil-importer Wei2017 have made it more difficult to draw a clear conclusion on the effect of oil price shocks on financial markets Basher2006 and Wang2013 . Hence, understanding the underlying behaviour of oil price is important to keep track of changes in the target economy.
On the other hand, Oil price shocks and its contagion on other economic indices and prices have made modelling and prediction complicated Kokabisaghi2018 . Earlier studies used econometric models such as vector autoregressive (VAR), generalized autoregressive conditional heteroskedasticity (GARCH) Park2008 and wei2010 . But the complexity and nonlinear behaviour of oil price and financial and economic variables have convinced researchers to use artificial intelligence methodologies to deal with unpredictable changes in oil price and other economic variables mingming2012 and Gurusen2011 and Bissoondeeal2011 . Overall, several researches have been devoted to analyze the oil price shocks, its origins and impacts on economic factors and financial markets. However, there is surprisingly a lack of focus on oil-dependent economies such as Iran.
Since Iran is one of the largest oil exporting countries, both oil crises and political tensions can impact its economy. During global financial crisis in 2008, Iran economic growth decreased to the lowest rate 1.8 percent WorldBank2018 . Despite the fact that high oil price is beneficial for oil-exporting countries Korhonen2010 and lower oil price creates instability in oil dependent countries Kitous2016 , it was expected that Iran economic growth increases after the global financial crisis and rising oil price; but Iran economic growth had a downward rate of -0.2 percent in 2013. One possible reason is international sanctions imposed on Iran’s industries and banking system. Sanctions which targeted oil created many restrictions in exporting oil and foreign investments in energy industry. Being largely oil dependent, Iran oil exports dropped from 2231.980 barrel/day to 1081.145 barrel/day during 2009 to 2015. Alongside that, foreign investment was decreased from $ 3773.8 million to $ 945 million. Generally speaking, it is expected that Iran stock market is affected by uncertainty in international oil market and political tensions. While oskooe2012 reports that there is no evidence on the impact of oil price volatility and Iran stock market. Differently, Salehi2015 finds that there is strong causality between oil price volatility and stock price in Iran. Besides, changes in macroeconomic variables affect stock market.
An overview of Tehran stock exchange shows that Tehran Stock Exchange Price Index was increased from 25035.2 million to 78849.3 million Unit during heavy sanctions (from 2012 to 2014) and declined to 61426.1 million unit in global financial crisis to 2015 and increased to 99414.5 in 2018 tes2019 . The growth in Tehran stock exchange during sever sanctions maybe explained by Biglaiser2020 that finds that sanctions impact stock market in the targeted country negatively and significantly only if targeted country were not already subject to multiple sanctions. So far, no studies have compared the effect of financial crisis and comprehensive sanctions together on Iran stock and industry indices.
In this paper we aim to model the impact of oil price volatility on stock market and industry indices in Iran. In particular, we investigate how potential uncertainty in oil price and Iran energy industry caused by political tensions and economic crises influence financial and industry indices.
The reason why Iran is an ideal case for the purpose of this study is because Iran is a member of OPEC and one of the largest oil- exporting countries that can influence the supply side of the international oil market. Iran economy has been under severe international sanctions and witnessed several oil crises while more than 60 percent of Iran revenue is within the oil market Farzanegan2009 .
Therefore, knowing the impact of international sanctions and/or financial crises on Iran economy and whether international sanctions have been successful to meet their target, is a game changer for Iran policy makers and international politics. Moreover, the source of volatility in the stock market and industry is useful from trading and practical perspective.
To shed light onto the aim of the paper, we take an inspiration of several studies that proved the accuracy of the artificial intelligence as a methodology to model the effect of unusual behaviours in oil price on stock and industry indices Ince2019 Atsalakis2009 and Onder2013 and Svitlana2016 . Additionally, we compare oil-stock nexus in two periods of international sanctions and post sanctions.
The reminder of the paper is organized as follow. Section 2 is an overview of financial crisis, international sanctions and methodology, section 3 presents data and architecture of the model, section 4 is the empirical results and section 5 is the conclusion.
2 Literature Review
2.1 Overview of Oil price shocks and International Energy Sanction
Sanction as a pressure tool has been used by policy makers to make changes in nation’s policies or achieve certain objectives. Generally speaking, sanctions have a direct impact on the Achilles heel of the target.
In 2007, United Nation Security Council imposed sanctions on Iran to enforce this country to suspend nuclear activities and also meet the requirements of IAEA (United Nations Security Council. Sanction Resolution no. 1747: UN; 2007. Security Council of United Nations. Resolution no 1929; 2010) It continued till 2010 and banned Iran from any activities related to ballistic missiles and blacklisted all entities and individuals involved with this program such as travelling and financial services.
In the case of Iran, international sanctions have been imposed on the energy sector and banking system. Both economic and energy sanctions have put a sever strain on oil exports and developments that the offshore supergiant South Pars natural gas fields needed Sabatini2010 . In November 2011, The US, UK and Canada imposed bilateral restrictions on Iran’s oil and petrochemical industries; UK enforced all British financial institutions to stop doing business with Iranian counterparts. Furthermore, US threatened all countries for having any deal with Iran. Although investment on Iran energy industry was beneficial for European countries, but they kept their strategies against Iran. Otherwise, EU had to deal with the risk of losing international trades with US. In 2012, the European Union banned importing crude oil and petroleum products from Iran. Before European Union sanctions (EU), Iran oil export was around 2.2 million barrel/day. But in 2012 when EU sanctions came into effect, Iran oil export dropped to 1 million barrel/day. In addition to that, Iran lost non-EU buyers (China, India, Japan, South Korea and Turkey) and oil exports declined to more than 50 percent compared to the past years. Sanctions and poor economic health led to high inflation, unemployment rate and devaluation of the national currency yong2013 .
When US tightened sanctions on Iran central bank, Iran was disconnected from the SWIFT (electronic financial transactions). Sanctions on oil trades not only disposed Iran of foreign investment flow, it also impressed Iran’s share in gas sector by disposing access to energy technologies such as LNG technology, which is important for competitiveness in the gas market. As a result, Iran was not able to exploit gas. Furthermore, the national currency, Rial, fell to its lowest value against the US dollar more than 80 percent since 2011. Thus, the government had no choice but to borrow from its Central Bank, which resulted in an increase in the money supply and inflation Ghorbani2018 . Iran gross domestic product (GDP) growth was deprecated 8.156 % and -7.445 % from 2009 to 2012 respectively WorldBank2018 . Although the sanctions influenced Iran economy by heavy restrictions on oil production and export, but this impact was temporary. Iran changed oil contracts and found new export markets by price concessions. The main Iran oil buyers were China (22 percent), India (13 percent) and Japan (14 percent). In addition, Iran gas export increased from 5.670 billion cubic meters to 9.307 billion cubic meters IMF2018 .
In 2014, Iran GDP growth increased to 4.603 % by Optimism in nuclear deal between Iran and the world powers and easing part of sanctions on Iran oil export WorldBank2018 . Simultaneously, oil price dropped from $109.62 to $41.5 in 2014 to 2015. Being largely oil dependent, Iran economic growth declined to - 1.321 % ultimately WorldBank2018 . Although after global financial crisis and post sanction, Iran export recovered in 2018 to the earlier level before the sanctions 2125.000 b/d but Iran economy suffers from instability, high inflation, drastic devaluation of national currency and stock market inefficiency.
2.2 Overview of methodology
As we previously mentioned, the unpredictable behaviour of financial time series such as crude oil price and stock market index make the analysis difficult. Some studies used econometric models to show the correlation between oil price volatility and stock market; for example, Wei and Guo (2017) applied VAR (vector auto regressive) to show the effect of oil price on stock market in China; (see also, Kang2015 and Pandey2018 and Huang2016 ). Some other researchers reported that the real world systems are often nonlinear, thus, it is unreasonable to use linear statistical methods that are built on linear assumptions. To overcome the linear limitations, researchers have proposed several classes of nonlinear models such as autoregressive conditional heteroscedastic (ARCH) model Engle1982 , general autoregressive conditional heteroscedastic (GARCH) Bollerslev1986 among others. However, these models perform well for specific nonlinear patterns and they are not able to analyse other types of nonlinearity in time series.
To explain the non-linearity of various financial time series, studies used artificial intelligence methodologies (Lu2011 and Ticknor2013 and Kristjanpoller2015 and Gurusen2011 and Bissoondeeal2011 ). The results of researches show that artificial neural networks (ANN) is a better method for simulating unanticipated features of financial time series. On reason is because ANN is data- driven and non-parametric. In addition, no prior assumptions of the model form is required and ANN learns from examples to capture the relationships among the data even if the underlying linkage is unknown Ince2019 . In addition, ANN with simple architecture can be applied to different situations in finance and economics Galeshchuk2016 and Fahima2018 . Furthermore, ANN has ability to capture subtle fractional relationship between variables even in time series with different features such as shocks Atsalakis2009 and Onder2013 and Svitlana2016 . The universal approximation theory also suggests that a single hidden layer neural network can interpret any input-output structure sufficiently Ince2019 .
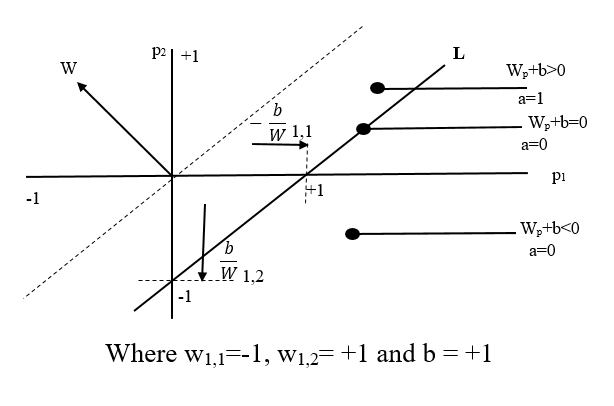
2.2.1 The feed-forward architecture
The feed-forward neural network in this study is a layered network with fully connected hidden layers and outputs. In particular, Feed-forward network can arbitrarily and precisely approximate functions with many finite discontinuities as well as their derivatives. Learning the neural networks is important to optimize the architecture of the network by modifying the weights. If learning is done properly the neural network can update connections of neurons and modify weighted function data. The main steps for learning networks are first initializing the network weights and comparing the error values between calculated and observed outputs to find the correction vector. Then, the weights for connections between errors are recalculated by determining the correction vector. figure 1 and 2 represent a feed-forward neural network and the activation function.
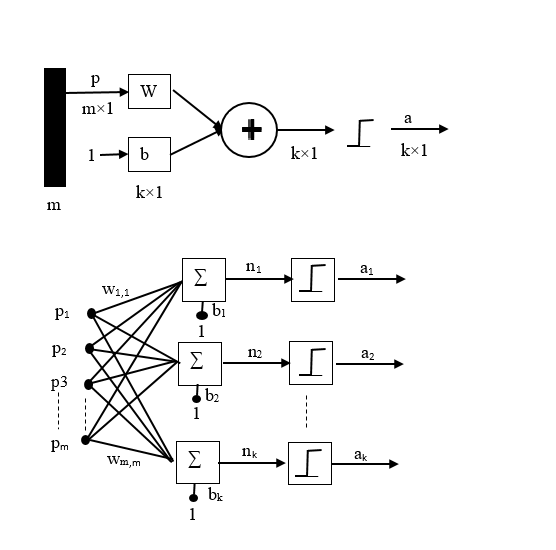
The mathematical structure of the network is shown as follow:
| (1) |
where is the output of the adder (sum of the weighed input signals)
| (2) |
| (3) |
where is the output signals of the neurons
3 Data and Methodology
3.1 Data
To analyze the aim of study, we used information from Iranian Central bank, Tehran Stock Exchange and Organization of the Petroleum Exporting Countries (OPEC). The data comprises daily prices and values for oil, gas and gold price, exchange rate 111The rate of Rial to 1 Dollar, stock market index (TEPIX) 222Tehran Price Index, industry index and turn. The empirical study covers 10-year of daily datasets from December 2008 to December 2018 (international energy sanctions from December 2008 to 2014) and (global financial crises and post sanction from 2014 to 2018).
The reason for choosing OPEC oil price is because Iran is a member of OPEC and international crude oil prices follow the same trends more or less. Table no. 1 summarizes the descriptive statistics associated to the research variables. In descriptive information in Table 1 shows a heavy tailed distribution for most of time series, which can be explained by the fact that these financial and economic variables witnessed global financial crisis in 2014 and international energy sanctions.
| Mean | Median | SD | Skewness | Kurtosis | |
|---|---|---|---|---|---|
| Oil price (USD) | 77.2 | 75.06 | 27.29 | - 0.03 | - 1.4 |
| Gas price (USD) | 3.48 | 3.42 | 0.91 | 0.56 | 0.7 |
| Gold price (USD) | 13.7 | 1,275 | 219.6 | 0.4 | - 0.2 |
| Exchange rate (Rial) | 25,573 | 31,345 | 11,657 | - 0.2 | - 1.57 |
| Stock Index (Unit) | 48.779 | 56,784 | 28,487 | - 0.02 | - 1.5 |
| Industry Index (Unit) | 40854.5 | 48,468 | 24,791 | 0.01 | - 1.6 |
| Trading volume (Million) | 626.672193 | 424.083128 | 893.369438 | 10.19 | 183.3 |
3.2 Model specification, Feed forwards neural network
In this paper, we use Feed-forward neural network (FFNN) to analyse the purpose of our study in two periods of International energy sanction and post-sanction. The architecture of our model is the following:
FFNN is developed with an input layer consisting of five neurons that is five inputs including oil price, gas and gold price, exchange rate, trading volume and the output layer has two neurons that represents dependent variables, stock market and industry indices. In every period of the study, the neurons of the hidden layer are computed as follow:
| (4) |
In order to improve the performance of FFNN, we scale the data between 0,1 as follow:
| (5) |
Finally, For FFNN estimation, We split the datasets into two period of sanction (from 2009 to 2014) and post-sanction (2014 to 2018). For each period of study, we use 75 % of the dataset for training, 20 % for test and 5% for validation purpose. The activation (transfer) function in FFNN is hardlimit to find the relationships between input and output nodes in the network. R1.1 At the end, we check the estimated RMSE and MAPE to assess the accuracy of networks as follow:
| (6) |
| (7) |
Where and are actual and predicted values at time t respectively, and N is the number of observed data.
4 Empirical results
4.1 Learning Feed-forward neural
4.1.1 The period of International energy sanction:
The first dataset includes 1845 data from December 2008 to 2014 when severe international energy sanction was tightening on Iran. There are five inputs including oil, gas and gold price, exchange rate, trading volume as independent variables, and stock market and industry indices as outputs. As we mentioned in section 3.2, the datasets are normalised and split into 75 %training, 20 % test and 5 % validation set and 40 nodes in hidden layers are computed.
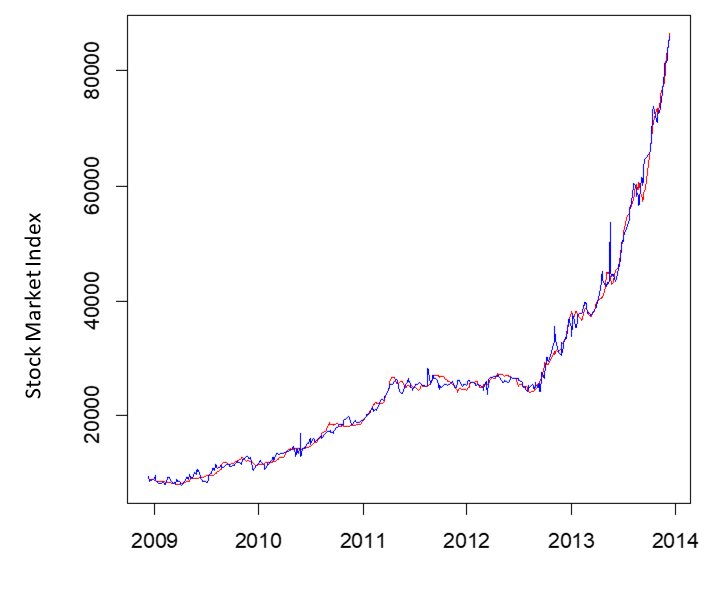
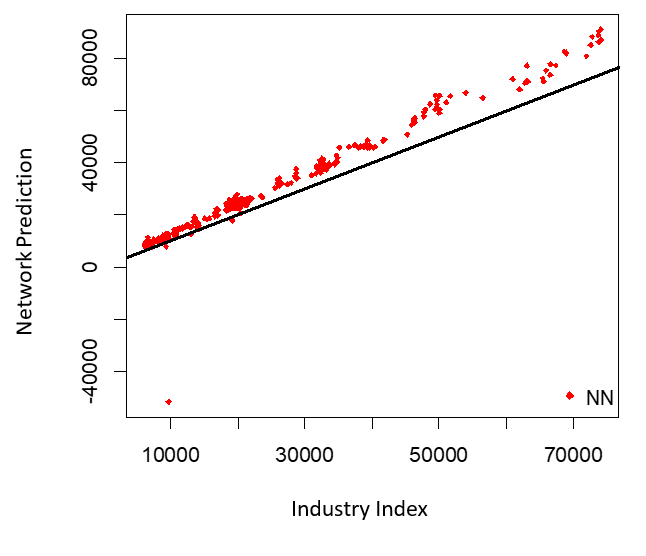
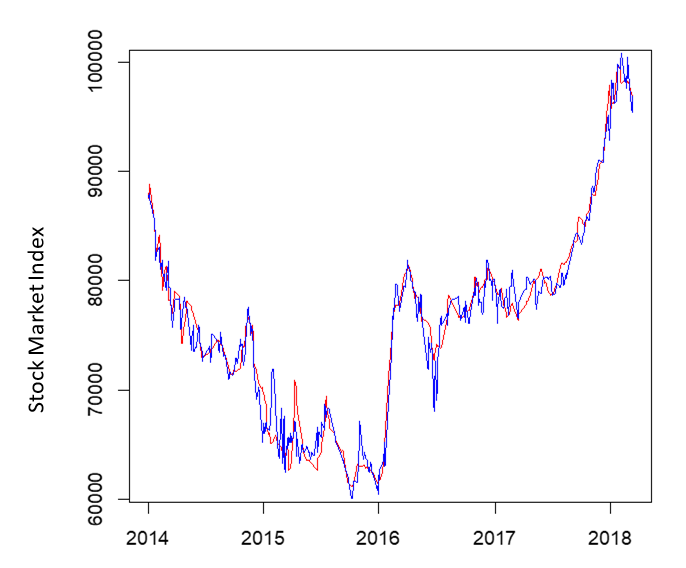
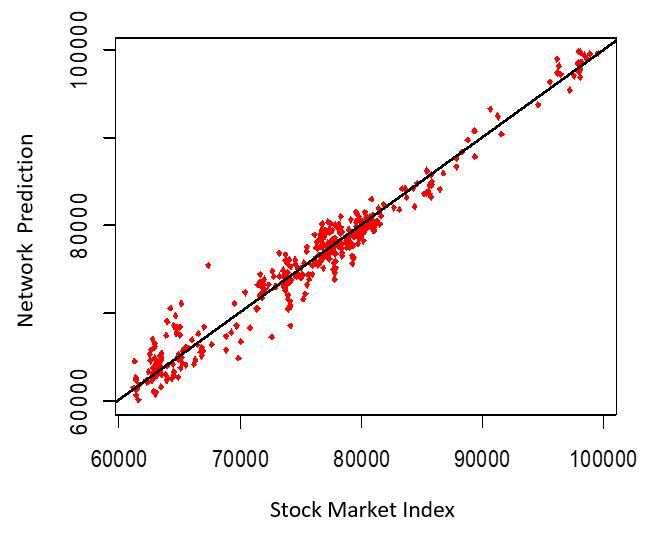
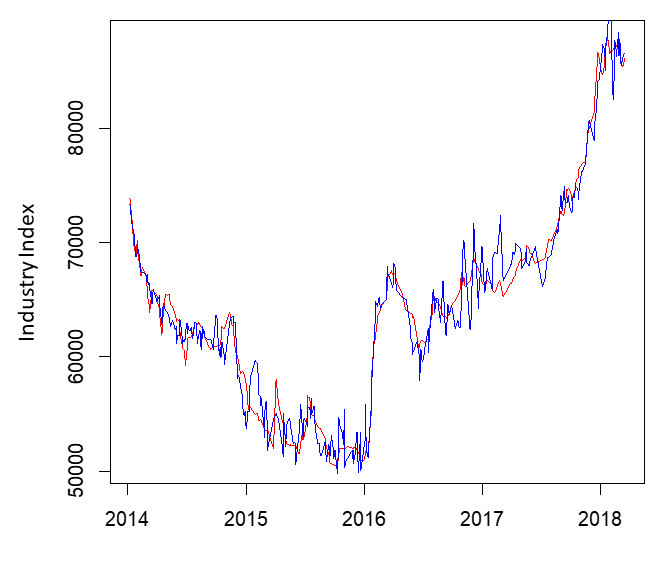
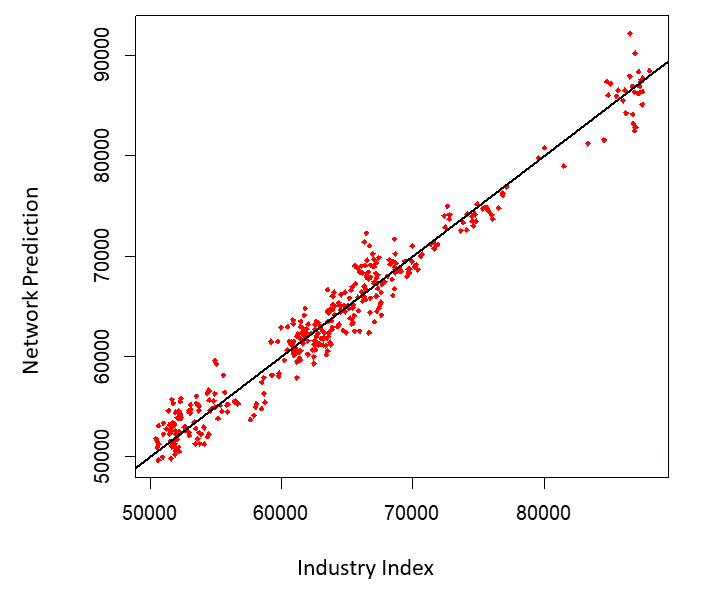
The results of learning feed-forward network presented in Figures 3 (right panel) shows the actual datasets is close to fitted line (perfect fit) and there is no significant deviation between the prediction and the actual values. Figure 4(right panel) represent the perfect fit for industry index approximately. Overall, the results of learning network provide 90 percent accuracy for both indices.


4.1.2 Post sanction and global financial crisis
The second dataset starts from 2014 to 2018. In this period, international energy sanction was eased on Iran and oil price dropped drastically because of the global financial crisis. In this period, the network has 5 inputs (oil, gas and gold price, exchange rate, trading volume) and TEPIX and Industry index as outputs separately. the number of computed nodes in hidden layers is 37. The learning continues till the network became converged. The results with 90 percent accuracy for both TEPIX and industry indices is presented in figure 5 and 6 respectively. Figures show that the feed-forward network has the ability to produce a good prediction by considering a wide range of economic variables. In this period, the model shows a better fit for Industry index in compare with the period of international energy sanction.
The average percentage error (MPE), estimated root mean square error (RMSE) and mean absolute percentage error (MAPE) from learning FFNN for both TEPIX and industry index are listed in Table 2. Given the acceptable performance of FFNN in terms of accuracy, we can conclude that in the first period of study, international energy sanctions tighten on Iran, the model has a better performance for TEPIX (Table 2 shows the smaller error in compare with industry index). During this period, oil price was approximately steady. But industry index that is highly dependent on oil and gas companies, is influenced by the imposed sanctions on foreign investments and oil export. In 2014 to 2018, the model is a better fit for industry index that shows industry index is influenced by oil price shock. During 2009 and 2014, FFNN performs the best in predicting stock index in compare with post international sanctions, which indicates the positive impact of oil price on the stock market in this period.
| International energy sanction | Post-sanction | |||
| Dependent variables | Stock index | Industry index | Stock index | Industry index |
| MAE | 0.107 | 0.116 | 0.107 | 0.09 |
| RMSE | 1106 | 1629 | 1750 | 1734 |
| MAPE | 0.07 | 0.16 | 0.23 | 0.33 |
5 Conclusion
In this paper, we model the impact of oil price volatility on Tehran stock and industry indices. To have a more realistic model, we consider a wide range of economic variables such as gas and gold price, exchange rate (Rial) and trading volume as explanatory variables. We also analyze the aim of the study in two periods of international sanction and post-sanction to provide an overall picture on the impact of both sanctions and oil price shocks on an oil-dependent country such as Iran. We choose Iran as an ideal case for this setting because Iran is one of the largest oil exporters and has been under comprehensive sanctions. The result of feed-forward neural network with 90 percent accuracy indicates the positive impact of oil price on stock and industry indices, which is supported by empirical studies Fang2018 and Ewing2016 and Mezghani2018 . More specifically, the feed-forward neural networks performs better in predicting TEPIX in the period of international sanctions.
In post-sanction and global financial crisis, the model evaluation criteria show a better value for industry index, which means Industry index is influenced by oil price shocks, as expected, industry index movements are more affected by oil price changes fang2017 . We can draw a conclusion the dependency of industry on energy companies makes industry index more vulnerable to endogenous changes in oil market such as oil price shocks. In this paper, we have addressed the important question how changes in the international markets and politics influence stock market and industry in Iran. In future research, we plan to explore the effect of uncertainty in international politics and markets on companies listed in the Tehran stock exchange. Following the impact of uncertainty in politics and international markets on Iran, future works may also pay attention to the changes in other important economic factors such as unemployment rate in Iran as more than 60 percent of Iran population are young professionals. An empirical extension of this paper is also comparing the results of FFNN with other non-linear models.
Conflict of interest
The authors declare that they have no conflict of interest.
References
- (1) Atsalakis, G. S. and Valavanis, K. P., Surveying stock market forecasting techniques soft computing methods, Expert Systems with Applications, Vol. 36, 5932-5941 (2009).
- (2) Angelidis, T., Degiannakis, S. and Filis, G. , US stock market regimes and oil price shocks, Global Finance Journal, Vol. 28, 132-146 (2015).
- (3) Arouri, H., El, M. and Nguyen, K. , Oil prices, stock markets and portfolio investment: Evidence from sector analysis in Europe over the last decade, Energy Policy, Vol. 38, 4528-4539 (2010).
- (4) Basher, S. A. and Sadorsky, P., Oil price risk and emerging stock markets, Global Finance Journal, Vol. 2, 224-251 (2006).
- (5) Bastianin, A., Conti, F. and Manera, M., The impacts of oil price shocks on stock market volatility: Evidence from the G7 countries, Energy Policy, Vol. 98, 160-160 (2016).
- (6) Bissoondeeal, R.K., Karoglou, M. and Gazely, A.M. , Forecasting the UK/US exchange rate with divisia monetary models and neural networks, Scottish Journal of Political Economy, Vol. 58, 127-152 (2011).
- (7) Biglaiser, G. and Lektzian, D, The effects of economic sanctions on targeted countries stock markets. International Interactions, vol. 46 (2020).
- (8) Bollerslev, T, Generalized autoregressive conditional heteroscedasticity, Journal of Econometrics, vol.31, 31307–327 (1986) .
- (9) Engle, R,F, Autoregressive conditional heteroskedasticity with estimates of the variance of UK inflation, Econometrica, vol. 50 987–1008 (1982).
- (10) Ewing, B., and Malik, F., Volatility spillovers between oil prices and the stock market under structural breaks. Global Finance Journal,Vol. 29, 12-12(2016).
- (11) Fahima C. and Ayachi, F. , Non-linear causality between exchange rates, inflation, interest rate differential and terms of trade in Tunisia, African Journal of Economic and Management Studies, Vol. 9, 274-289 (2018).
- (12) Farzanegan, M. and Markwardt, G. , The effects of oil price shocks on the Iranian economy, Energy Economics, Vol. 31, 134-151 (2009).
- (13) Filis, G., Degiannakis, S. and Floros, C. , Dynamic correlation between stock market and oil prices: the case of oil-importing and oil-exporting countries, International Review of Financial Analysis, Vol. 20, 152-152 (2011).
- (14) Galeshchuk, S. , Neural networks performance in exchange rate prediction, Neurocomputing, Vol.172, 446-452 (2016).
- (15) Ghorbani Dastgerdi, H., Yusof,Z. and Shahbaz, M., Nexus between economic sanctions and inflation: a case study in Iran, Applied Economics, 50(49) 5316-5334 (2018).
- (16) Guntner, J.H.F. , How do international stock markets respond to oil demand and supply shocks?, Macroeconomic Dynamics, Vol.18, 1657-1682 (2014).
- (17) Gurusen, G., Kayakulu, G. and Daim, T. , Using artificial neural network model in stock market index prediction, Expert System Application, Vol. 38, 10389–10397 (2011).
- (18) Ince, H., Cebeci, A.F. and Imamoglu, S.Z, An Artificial Neural Network-Based Approach to the Monetary Model of Exchange Rate, Computational Economics, Vol. 53, 53- 817 (2019).
- (19) International Monetary Fund, , Islamic Republic of Iran and the IMF, Retrieved from https://www.imf.org/en/Countries/irn (2018).
- (20) Fang, S. and Egan, P. , Measuring contagion effects between crude oil and Chinese stock market sectors, The Quarterly Review of Economics and Finance, Vol. 68(C), 31-38 (2018).
- (21) Huang, J.I. , The relationship between oil price and bond/stock market: a sectoral analysis, Temple University, 10144417 (2016).
- (22) Kang, W. and Ratti, R.A. , Oil Shocks, Policy Uncertainty and Stock Returns in China, Economics of Transition, Vol. 23, 657-676 (2015).
- (23) Keshavarz Hadad, G.R. and Manavi, H. , Interaction between stock market and foreign exchange market in Iran with an emphasis on the impact of oil shocks, Economic Research in Iran, Vol. 37, 147-169 (2008).
- (24) Kokabisaghi, S., Pauwels, E.J., Meulder, K.V. and Dorsman, A. , Are These Shocks for Real? Sensitivity Analysis of the Significance of the Wavelet Response to Some CKLS Processes, International Journal of Financial Studies, Vol. 6, pages 1-12 (2018).
- (25) Korhonen, I. and Ledyaeva, S. , Trade linkages and macroeconomic effects of the price of oil, ENERGY ECONOMICS, Vol. 32, 848-856 (2010).
- (26) Kitous, A., Saveyn, B., Keramidas, K., Vandyck, T., Rey Los Santos, L. and Wojtowicz, K. , Impact of low oil prices on oil exporting countries, EUR 27909 EN (2016).
- (27) Kristjanpoller, W. and Minutolo, M.C. , Gold price volatility: A forecasting approach using the Artificial Neural Network-GARCH model, Expert Systems with Applications, Vol. 42, 7245-7251(2015).
- (28) Kilian, L. and Park,C. , The impact of oil price shocks on the U.S. stock market, International Economic Review, Vol. 50, 1267-1287 (2009).
- (29) Lu, C. and Wu, J. , An efficient CMAC neural network for stock index forecasting. Expert Systems with Applications, Vol.38, 15194-15201 (2011).
- (30) Mensi, W., Makram, B., Adel, B. and Shunsuke, M., Correlations and volatility spillovers across commodity and stock markets: Linking energies, food, and gold, Economic Modelling, Vol. 32(C), 15-22 (2013).
- (31) MoyaMartinez, P., Ferrer-Lapeña, Ro. And Escribano-Sotos, F., Oil price risk in the Spanish stock market: An industry perspective, Economic Modelling, Vol. 37(C), 280-290 (2014).
- (32) Mezghani, T. and Boujelbène, M. , The contagion effect between the oil market, and the islamic and conventional stock markets of the gcc country, International Journal of Islamic and Middle Eastern Finance and Management, Vol.11, 157-181 (2018).
- (33) Mingming, T. and Jinliang, Z, A multiple adaptive wavelet recurrent neural network model to analyze crude oil prices, Journal of Economics and Business, vol. 64, 275–286 (2012).
- (34) Niknam Esfahani, N. , The impact of macroeconomic variables on the stock market of the oil-exporting countries: The case of Iran, Alliant International University (2016).
- (35) Nusair, S.A. , The effects of oil price shocks on the economies of the gulf cooperation council countries: nonlinear analysis, Energy Policy, Vol. 91, 256–267 (2016).
- (36) Onder, E., Bayır, F. and Hepsen, A. , Forecasting macroeconomic variables using artificial neural network and traditional smoothing techniques, Journal of Applied Finance and Banking, Vol. 3, 73-104 (2013).
- (37) Oskooe, S, A, P, Oil price shocks and stock market in oil-exporting countries: evidence from Iran stock market. OPEC Energy Review, vol. 36, 396–412 (2012).
- (38) Pandey, V. and Vipul. , Volatility spillover from crude oil and gold to BRICS equity markets, Journal of Economic Studies, Vol. 45, 426-440 (2018).
- (39) Park, J. and Ratti, R, A, Oil price shocks and stock markets in the U.S. and 13 European countries, Energy Economics, vol. 30, 2587–2608 (2008).
- (40) Sadorsky, P. , Oil price shocks and stock market activity, Energy Economics, Vol. 21, 449–469 (1999).
- (41) Sabatini,R. , Economic Sanctions: Pressuring Iran’s Nuclear Program, NTI-Monterey Institute of International Studies. Washington, 24 (2010).
- (42) Svitlana, G. , Neural networks performance in exchange rate prediction, Neurocomputing, Vol. 172, 446-452 (2016).
- (43) Salehi, M., Dashtbayaz, M.L., Bahrami, M. and Mosallapour, M. , Relationship between oil price fluctuations and stock price index in Iran, Investment Management and Financial Innovations, Vol.12, 23-33 (2015).
- (44) Ticknor, J.L. , A Bayesian regularized artificial neural network for stock market forecasting, Expert Systems with Applications, Vol. 40, 5501-5506 (2013).
- (45) Tehran Stock Exchange, Archive, https://tse.ir/en/ (2019)
- (46) Wang, Y., Wu, C. and Yang L. , Oil price shocks and stock market activities: evidence from oil-importing and oil-exporting countries, Journal of Comparative Economics, Vol. 41, 1220-1239 (2013).
- (47) Wei, Y. and Guo, X. , Oil price shocks and China stock market, Energy, Vol. 140 (P1), 185-197 (2017).
- (48) Wei, Y, Wang, Y. and Huang, D, Forecasting crude oil market volatility: Further evidence using GARCH-class models. Energy Economics, Vol.32, 1477–1484 (2010).
- (49) Wen, X., Wei, Y. and Huang, D. , Measuring contagion between energy market and stock market during financial crisis: A copula approach, Energy Economics, Vol. 34, 1435–1446 (2012).
- (50) Zhang, C. and Tu, X., The effect of global oil price shocks on China metal markets, Energy Policy, Vol. 90, 131–139 (2016).
- (51) World Bank, Country report, https://data.worldbank.org/country/iran-islamic-rep?view=chart (2018).
- (52) Yu, H., Du, D., Fang, L. and Yan, P. Risk contribution of crude oil to industry stock returns. International Review of Economics and Finance, vol. 58, 179–199 (2018).
- (53) Yong,W. and Hajihosseini, A, Understanding Iran Under Sanctions : Oil and the National Budget, Oxford Energy Comment, 1-18 (2013).