Defect patterns and software metric correlations in a mature ubiquitous system
Abstract
Software engineering is not an empirically based discipline. Consequently, many of its practices are based on little more than a generally agreed feeling that something may be true. Part of the problem is that it is both relatively young and unusually rich in new and often competing methodologies. As a result, there is little time to infer important empirical patterns of behaviour before the technology moves on. Very occasionally an opportunity arises to study the defect growth and patterns in a well-specified software system which is also well-documented and heavily-used over a very long period.
Here we analyse the defect growth and structural patterns in just such a system, a numerical library written in Fortran evolving over a period of 30 years. This is important to the wider community for two reasons. First, the results cast significant doubt on widely-held long standing language-independent beliefs and second, some of these beliefs are perpetuated in modern technologies. It therefore makes good sense to use empirical long-term data as it becomes available to re-calibrate those generalisations. Finally, we analyse the phenomenon of defect clustering providing further empirical support for its existence.
Keywords: Correlations, defects, measurement, numerical software, defect clustering, software metrics
1 Overview
The ability to predict future program failures from static properties of programs (i.e., properties which can be directly measured from the source code) has long been a goal of software engineering researchers. Efforts to predict future failures based on error-prone language features (for example, mechanisms which lead to loss of significant bits) have generally proven fruitful, see [1]. Unfortunately, efforts to find satisfactory correlations between program failure and structural properties, such as the number and type of decisions, are undermined by the very disparate nature of software with a multitude of programming languages employing many different paradigms.
Despite this, some beliefs have become surprisingly well-entrenched across numerous languages in a wide range of application areas. For example, in spite of significant evidence to the contrary (see [2, 3]) cyclomatic complexity [4], a graph theoretic measure essentially related to the number of decisions within a piece of computer software, has been widely used in many disparate developments as a predictor of components which will be unreliable in some sense. The danger of its continuing use is that it has become a design criterion for limiting components to a maximum cyclomatic number as is the case in the Joint Strike Fighter C++ standard, a safety-critical environment, ([5, AV Rule 3]).
Even longer standing is the debate over the goto statement. The result of this debate initiated by Dijkstra [6] and unconstrained by any relevant measurement until very recently [7], was that the goto statement is to this day believed to be strongly correlated with program failure in whatever context it arises, including its implicit forms such as the continue and break statement which appear in numerous modern languages. This appears in such influential standards as the first two editions of MISRA C ([8, Rule 56], [9, Rule 14.4]), and in no less than three forms in the most recent incarnation [10], where the authors decided to downgrade the rule to advisory but added rules banning forward jumps or jumps into a sub-block. It also appears in the Joint Strike Fighter C++ standards, ([5, AV Rule 189]), and the European Space Agency Ada standard [11]. Other language independent code fragments which have invited opprobrium include the so-called dangling else if, being an if else if clause with no else statement ([5] and [9]), and also restrictions on the maximum depth of nesting of control structures, [11].
It is clear then that these and similar beliefs are well-entrenched in modern development. Indeed, they are so well-entrenched that they still appear in prosecution presentations and analyses in high-profile court cases such as the Toyota Unintended Acceleration Bug, [12, 13] including pejorative discussions of the eponymous “spaghetti” code [14]. Some authors rightly question these apparently unassailable beliefs, [15], but what is lacking is supporting evidence. Related attempts to explore this space include learning algorithms for defect prediction [16] but it is not clear how such abstract methods might help us to reject such deeply ingrained beliefs.
We depart from earlier defect studies here by directly analysing a number of such beliefs against a wide collection of metrics which software engineering has thrown up in the last three decades and show that none of these beliefs appear individually to have any statistically significant basis in fact when studied over a long period in a well-documented and well-specified system. This is a crucial point. No previous study has worked with a package of such maturity with a continuous defect history for the 30 years or so of its lifetime at the time this work was carried out. If these beliefs had any substance, such effects should have appeared. This of course is not a guarantee but it is certainly persuasive.
Note that we do not seek to rehabilitate the goto statement or indeed any of the programming fragments which have attracted negative comment over the years. However, we do strongly emphasise the importance of empirical evidence in supporting claims if we are to understand the essence of software engineering in order to improve its rather erratic relationship with systems failure. That such beliefs still appear in a modern context and are accepted without empirical challenge is sufficient motive for the present work. The nature of design and component interactions does indeed evolve with time as programming languages implement more or less of such paradigms as OO, but all programmers must make decisions and such decisions are often tainted with beliefs formulated in the distant past without much intervening influence from measurement.
Not only are some practices condemned without measurement but others are similarly supported without measurement. Although more recent efforts have produced interesting results for structural metrics in OO systems [17], other empirical studies [18] suggest that some of the suggested benefits of such systems may be rather more illusory than was hoped. However, all such efforts rely on the availability of high quality failure records over a period of time coupled with access to source code and excellent version control. Such opportunities do not arise very often and here we are able to analyse one such dataset acquired over an unusually long period and present the results using standard statistical tests of significance as a contribution to the empirical base of this subject. The large number of components measured give much confidence in the results while the relevance of these results to the wider community is unquestionable for the reasons outlined above.
In the interests of both pedagogy and repeatable science, the sanitised raw data and complete means to reproduce all the results of this work will be available for download and analysis333http://www.leshatton.org/ following the recommendations of [19].
1.1 The analysis of a numerical software library
The NAG (Numerical Algorithms Group) Library [20] is a very widely-used set of scientific procedures. Over the last thirty years, they have been continually enhanced to keep pace with research in numerical analysis and have also spread from the original implementation language of Fortran 66 and 77 into other languages such as C, Ada and Fortran 95. Here we analyse the Fortran 77 library over a number of releases which provides an excellent opportunity to study defect growth for several reasons
-
•
The package has a complete and carefully maintained defect history which was embedded in program headers and for which perl scripts to mine the header defect information could easily be designed.
-
•
The package is sufficiently large; 266,123 executable lines of code (XLOC) as analysed in 3659 subroutine/functions,
-
•
As is often the case with software experiments, no usage or coverage data was available but the data shown here covers a period of three decades, a relatively long maturity time and the defect density is likely to be more asymptotically representative.
-
•
The package is of good quality for its generation (1978 onwards) and covers a difficult application area with an asymptotic defect density of 4.9/KXLOC (thousand executable lines of code).
-
•
The package is unusually well-specified for a software system as it implements procedures defined in mathematical notation. It is therefore much less vulnerable to the problems which occur in many systems through imprecisely defined requirements, [19].
-
•
Unlike later standardisations of Fortran, Fortran 77 has an incomplete set of iteration constructs and requires the programmer to construct them with the goto statement, allowing an unusually detailed analysis of the impact of what is colloquially known as “spaghetti code” on the evolution of defect.
1.2 Extraction of static measurements
The complete source code of the library was made available to us and we designed and implemented parsing tools for the full Fortran 77 language, and tested them against the FCVS (Fortran Compiler Validation Suite). This turned out to be necessary in order to be able to extract all the desired static code measurements. Given that most if not all previous work studying defect in software systems uses the somewhat ambiguous LOC (line of code) as an independent variable, it also gave us the opportunity to measure this against the more precise measure of programming language tokens as used by compilers to define programming languages. We will expand on this shortly.
The parsing engine was designed using hand-crafted lexical and syntactical analysers written in ISO C to cater for Fortran features such as
-
•
The generally non-significant behaviour of the space character in Fortran 77 (the first lexical step is to discard all spaces outside strings or in the first 5 character positions of a Fortran line).
-
•
The arbitrary nature of the look-ahead in Fortran necessary to resolve grammatical structures such as the I/O implied DO loop.
The code measurements, often known as metrics, were chosen on the basis of their common occurrence in the literature or anecdotally over the years. As a result, 17 properties were extracted from each of the 3659 components. The five letter codes after each item header will be used as abbreviations for the corresponding parameter throughout the rest of the paper. We will continue to refer to these as metrics following industry practice whilst acknowledging that they do not necessarily preserve conventional mathematical definitions of a metric. Shown alphabetically, they are
-
1.
Number of backward jumps: STBAK. This is included for anecdotal reasons. It is thought to interfere with readability.
-
2.
Cyclomatic complexity: STCYC. This is a graph theoretic measurement which is essentially a count of the number of decisions within a software component, It was first introduced by McCabe [4].
-
3.
Number of dangling elseifs, i.e., an if else if with no else clause: STELF. This is included for anecdotal reasons and is believed to indicate the presence of incomplete logical thought.
-
4.
Number of gotos: STGTO. There has been so much discussion of this over the years since the initial comments in [6], that we felt we could not leave it out. In addition, Fortran 77 has a rich set of goto forms including the arithmetic if and the absence of any form of WHILE construct means that goto statements in various forms are used unusually frequently so the current study is particularly suitable to illuminate this.
-
5.
Knot count: STKNT. A knot is a crossing of control flow as illustrated, for example, by Shooman [21]. Knots only occur in languages which have explicit non-structural jump constructs such as the eponymous goto statement in its various forms. The goto statement is a necessary but not a sufficient condition for a knot as it can be used to simulate nested (knot-free) structures as well as non-nested structures. The existence of knots is often referred to informally as ‘spaghetti’ code.
-
6.
Source lines of code: STLIN. A simple count of the number of source lines of code including comment as would be seen in a text editor. See also STXLN.
-
7.
Extended cyclomatic complexity: STMCC. This is an extension to cyclomatic complexity based on complex predicates [22]. A complex predicate contains either logical disjunctive (‘or’) or conjunctive (‘and’) phrases or both.
-
8.
Maximum level of nesting of if statements: STMIF. This is included for anecdotal reasons. It is thought to be associated with testing difficulties.
-
9.
Total number of unique operands: STOPN. See STOPT.
-
10.
Total number of unique operator tokens: STOPT. A recent look at the application of information theory suggests STOPN and STOPT together play a pivotal role, [23].
-
11.
Path count: STPTH. The path count is the number of ways through a particular program assuming that all paths are equally likely [24]. The rationale behind it is that it is more sensitive to decision complexity than the cyclomatic number (for example, it can distinguish between a sequential series of if statements and a single switch statement containing the same number of clauses which have the same cyclomatic complexity). This is similar to the NPATH metric put forward in [25].
-
12.
Number of subroutines in a file: STSUB. This is included for anecdotal reasons, however, it should be noted that in Fortran 77, unlike C, the file has no special linguistic meaning.
-
13.
Total number of global variables referenced: STTCM. In Fortran Global variables are shared through the blank and named common construct and such variables are shared across all functions referencing those common areas.
-
14.
Total number of operator and operand tokens: STTOT. See STOPT.
-
15.
Number of undeclared variables: STUNV. There has again been largely anecdotal attribution that this indicates some level of sloppiness and may therefore be related to defect.
-
16.
Number of declared objects actually used: STVAR. This is included for anecdotal reasons.
-
17.
Number of executable lines of code: STXLN. Executable lines of code (XLOC) is a count of the number of lines which generate executable code when compiled. Many defect models have been built using executable or one of the other measures of lines of code as an independent variable (see, [26], [27], [28] and many others). The main attraction of using lines of code is that they are usually very easy to measure although they have a built in sensitivity to layout. Note that Fortran continuation lines are included but not separately counted.
2 Statistical analysis
The classic approach in studies like this has been to look for a positive correlation between defect and XLOC or the appearance of a particular programming construct such as the eponymous goto statement, or the presence of if else if statements without an else clause, (the so-called dangling else construct), or the cyclomatic number. The object of such studies is to develop rules, particularly for safety-critical systems, such that the overall level of defect might be reduced by avoiding such constructs.
2.1 Methodology
To support full reproducibility, the dataset, the experiments and the complete means of analysis are all provided with or referenced by this paper. The extraction of the data has already been described in detail in earlier sections. The data was analysed using R with the following parameters:-
R version 3.2.3 (2015-12-10)
Copyright (C) 2015 The R Foundation for Statistical Computing
ISBN 3-900051-07-0
Platform: i686-pc-linux-gnu (32-bit)
We will start then by investigating pairwise correlations in the raw data. The complete dataset consists of 3,659 data points, one for each subprogram for which a complete set of metrics was extracted as defined above.
2.2 Pairwise linear correlations with defects
For each metric, MMMM, the raw data was handled by the following R program, in which the intercept is forced to be zero, which seems reasonable.
df <- read.csv(file="defect_MMMM.csv",head=TRUE)
plot(df)
y <- df$defect
x <- df$MMMM
fm=lm(y~x+0,data=df)
summary(fm)
The results for the pairwise linear model of defect against each metric MMMM are given in Table 1.
| Metric | F-stat | Adj. | p |
|---|---|---|---|
| STBAK | 423.2 | 0.104 | |
| STCYC | 888.5 | 0.195 | |
| STELF | 101.6 | 0.027 | |
| STGTO | 848.6 | 0.188 | |
| STKNT | 348.2 | 0.087 | |
| STLIN | 978.3 | 0.211 | |
| STMCC | 505.1 | 0.121 | |
| STMIF | 316.2 | 0.080 | |
| STOPN | 1017 | 0.218 | |
| STOPT | 796.1 | 0.179 | |
| STPTH | 578.5 | 0.136 | |
| STSUB | 555.9 | 0.132 | |
| STTCM | 522.1 | 0.125 | |
| STTOT | 946.4 | 0.206 | |
| STUNV | 390.7 | 0.097 | |
| STVAR | 1239 | 0.253 | |
| STXLN | 913.9 | 0.200 |
The confidence intervals for the fitting coefficients are not shown for the simple reason that although the fits are highly significant as can be seen by the high F-value and low p, the adjusted R-squared value reveals that individually very little of the variance is explained by any single metric. In other words, they are effectively useless as individual predictors of defect.
To convey the very noisy nature of these data, the pairwise correlation of defects against number of goto statements is shown in Figure 1. This graph is typical of the unsmoothed relationship between defects and most of the metrics in this study.

Given the modest contribution to variance of any individual metric, Principle Component Analysis was then performed on the raw data to explore any possible relationship with linear combinations of metrics revealed by rotating the data cloud.
2.3 Principle Component Analysis
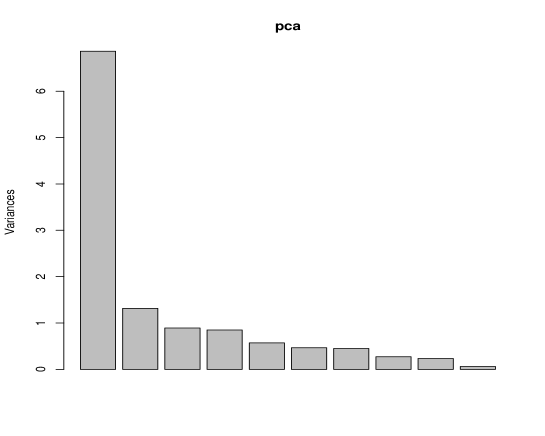
The first step was to compute the variances of the principle components, scaling the data because of the widely different scales of each metric and produce a biplot using the following R script.
## Read in the raw data.
pcadf <- read.csv(file="pca_defect.csv")
pca <- prcomp(pcadf, scale. = TRUE)
## Plot the eigenvalues
setEPS()
postscript("pca_evalues.eps")
plot(pca)
dev.off()

postscript("pca_biplot.eps")
biplot(pca)
dev.off()
The result is shown as Figure 2. As is usually the case with PCA, most of the variance is explained by a small number of components. The ‘knee’ after the first component is not particularly well defined, and we considered only the first two noting that the first four account for around 83% of the total variance.
The resulting biplot is shown as Figure 3. The numbers in black are the rows from the data matrix, whereas the vectors show the contributions and directions with respect to the first two principle components. Whilst generally pointing in the same direction, the biplot shows several clusters. The most significant cluster is essentially related to size and groups STCYC, STOPN, STXLN, STLIN, STTOT and to a lesser extent STUNV. A secondary cluster more related to perhaps departures from nested structure, groups STKNT, STBAK and STGTO. The relationship with defect is however clearly complicated.
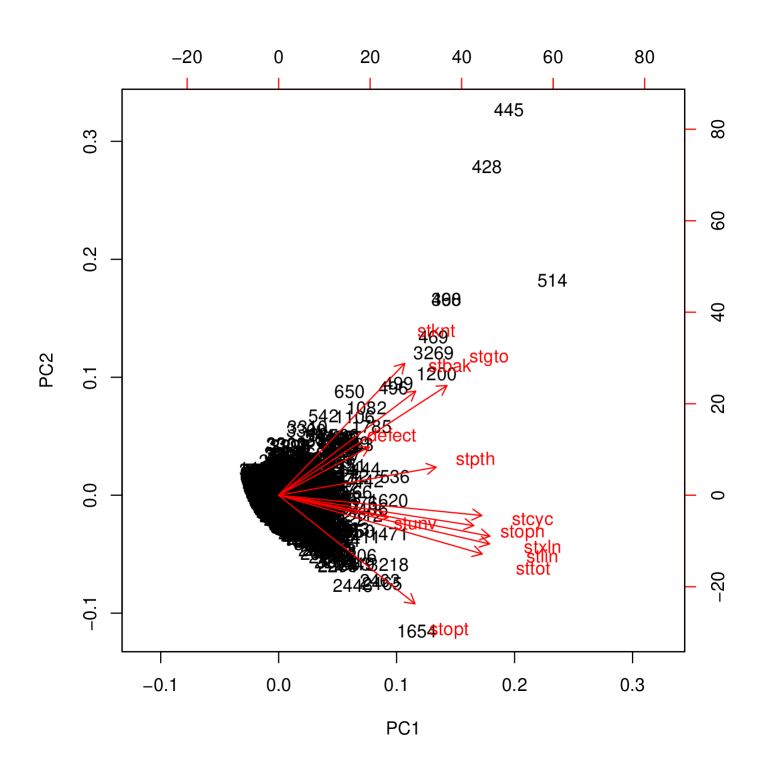
We conclude that in the NAG dataset, there is no simple linear relationship in the raw data between single parameters and defect growth which unequivocally supports the nature of the rules given in the coding standards described earlier even though the dataset is of sufficient maturity that by now, any such phenomenon, if present, would be expected to have manifested itself significantly. Instead, the predominant variability in the data cloud is aligned along a direction which is defined by a complex and relatively evenly balanced combination of several parameters which would appear to defy any attempt at rendering into a simple and intuitively justifiable replacement rule.
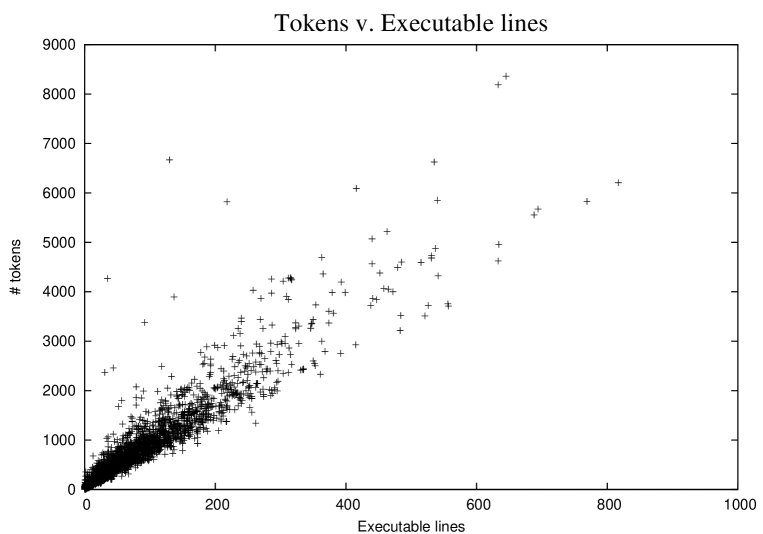
The general similarity of data for each metric suggests the possibility that pairwise combinations of them may be individually highly correlated and we will now investigate this. Since XLOC have played such a part in the historical development of defect analysis in software systems and we are investigating empirical rules which have evolved around using lines of code, we will confine ourselves to studying correlations against XLOC, although we note that the behaviour of a program is defined by its tokens not its lines of code, (which effectively have no meaning in a language compiler). To emphasize this, Figure 4 shows the correlation between XLOC and tokens for each function and subroutine in the NAG library, indicating that they are as expected, highly correlated, but they are not the same and recent studies in the length distribution of software components confirms that the difference can be important, [23].
2.4 Cyclomatic complexity versus XLOC
A short analysis revealed that cyclomatic complexity is very highly correlated with executable lines of code as shown in Figure 5.

Taking the reasonable measure of forcing a zero intercept, yields a regression equation of
| (1) |
The F-statistic in this case is 45200 and the adjusted R-squared value is 0.9251 with . In essence, then this equation states that it is extremely likely that there will be a decision about every 4 executable lines in a typical program in this library, a perhaps not unsurprising observation. This has been noted numerous times, e.g. [27] and also very recently and emphatically across different languages by [29] on a very much larger sample. Here we simply confirm the observation that the cyclomatic complexity appears to add little if any significant information to that already contained in the count of executable lines and the two are almost interchangeable, rather like comparing somewhat noisy temperature measurements in both Fahrenheit and Centigrade.
There is nothing therefore in this study which offers support for standard software engineering folklore relating conventional software metrics with defect in a system of sufficient maturity that any such relationships should by now have appeared at some level of significance. It is reasonable to ask then if there are any useful patterns related to defect which can be identified.
3 Defect clustering in the NAG Fortran library
In the NAG Fortran library, defects were distributed by size and by executable lines of code as shown in Table 2. This is most interesting. The tendency for defects to cluster is particularly prevalent here, with all of the defects so far seen occurring in only 20% of the components, and very close to 80% of them occurring in only 20% of the lines. These data are therefore entirely consistent with the observations of [30].
| Number of defects | Number of components | XLOC |
|---|---|---|
| 0 | 1749 (80.19%) | 120632 (71.97%) |
| 1 | 322 (14.76%) | 31215 (18.62%) |
| 2 | 65 (2.98%) | 8033 (4.79%) |
| 3 | 24 (1.10%) | 3173 (1.89%) |
| 4 | 10 (0.46%) | 1401 (0.84%) |
| 5 | 3 (0.14%) | 507 (0.30%) |
| 6 | 2 (0.09%) | 684 (0.41%) |
| 7 | 1 (0.05%) | 111 (0.07%) |
| 8 | 0 (0.00%) | 0 (0.00%) |
| 9 | 3 (0.14%) | 1122 (0.67%) |
| 10 | 2 (0.09%) | 746 (0.45%) |
At first sight, this table appears to open up forensic possibilities whereby there might be specific reasons why 80% of the components have exhibited no defect in three decades of heavy use. However, the previous studies indicate that if there are, none of the metrics or metric combinations can explain this. As a simple example, perusing Figure 1 reveals that components containing anywhere between 0 and around 190 gotos exhibited zero defect with no obvious pattern.
3.1 Conditional probabilities of defect detection
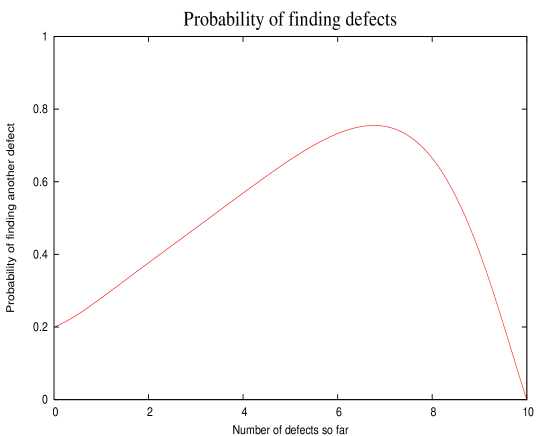
The tendency for defects to cluster may however shed light on optimal defect searching strategies [28]. Specifically, if a component is known to contain a defect, does it make sense to look for more defects in the same component or to look elsewhere? To resolve this we can cast the data of Table 2 into a simple conditional probability.
Let be the probability of finding the th defect in a component given that have been found already in that component. As an example, for Table 2, the conditional probability of finding 4 defects given that we have found 3 already is given by
| (2) |
which is a surprisingly high value. Figure 6 shows the respective probabilities as a function of . It is very clear that up to quite a high number of defects, the conditional probability of finding further defects in the same subroutine/function counter-intuitively continues to increase.
4 Discussion and Conclusions
A large and widely used mature scientific subroutine library has been analysed to test a number of widely-held beliefs about the relationship between defects and either the structural properties of the code or its language features. The relevance of this to the wider community is that such conjectures have been held for many years and are widely applied in modern programming standards even in critical systems, and may therefore influence the failure behaviour of such systems. These include the relationship of defects with the goto statement, dangling else constructs, number of decisions, maximum levels of decision nesting, component size, number of globally accessible variables, and a number of other code features which occur frequently in programming standards for numerous programming languages.
We conclude the following
-
•
No single metric of those analysed here has any statistically significant relationship with the occurrence of defect in the thirty years of use of this ubiquitous software package. In view of their persistence in the folklore and consequent appearance in court proceedings relating to software failure, we single out the goto statement, the cyclomatic complexity, the number of globally accessible variables and measurements of spaghetti code such as knots as being statistically unrelated to the appearance of defect in this package.
-
•
Principle Component Analysis shows that although most of the variance can be explained by a single linear combination of individual metrics, this does not correspond to any simple intuitively useful rule. Rather, the relationship is complex and suggestive of mere data-fitting. This would be particularly true with this dataset if non-linear relationships between metrics were considered, defeating the central object of this paper which is to challenge a number of well-entrenched and incorrect views.
In contrast to these negative conclusions,
-
•
Very strong evidence of defect clustering was found with typically 80% of all components in this package exhibiting no defect in the entire measured life-cycle. The metrics themselves throw no light on why some components develop defect whilst the majority do not, from which we suspect that the effect is essentially a manifestation of randomness in some form.
We stated with evidence, at the beginning of this paper, that a number of long-held beliefs have found their way into modern standards for development across multiple languages, even for safety-critical systems. These have inevitably influenced the way that developers have produced systems so it is of some considerable importance to underpin them with empirical support wherever possible. In the present study on a mature system over many years, a number of those beliefs, if supported, should have left identifiable traces at some level of significance. They have not.
This is just one study but it is large, covers a long period and was carried out in an application area which was unusually well-specified implying that the resulting defect data is of higher precision than in less well-specified areas. Furthermore, the beliefs which were investigated are essentially programming language independent so we would have expected some manifestation of them if they were indeed valid. Perhaps the biggest single lesson therefore is that beliefs which seem reasonable but are unsupported by any empirical evidence simply can not be trusted.
By casting doubt on these beliefs, we do not seek to rehabilitate bad practice, but if we are to make progress in avoiding failures with modern technologies, we need to be able to quantify what “bad practice” actually means, and only those methodologies soundly based on empiricism are likely to be of any lasting help.
This is particularly apposite today where folklore appears to have become an intrinsic part of the forensic process of judging a software system’s quality, potential for failure and indeed potential legal liability.
Finally, this work was completed in around 2005 when the NAG library was approximately 30 years old. It has hung around as a departmental report since at the University of Kent Computing Laboratory but given that software engineering still has a dearth of reliable empirical data, it has been cleaned up here and cast into the context of more recent work. Its message is however undimmed by the passage of time.
References
- Pfleeger and Hatton [1997] S.L. Pfleeger and Les Hatton. Do formal methods really work? IEEE Computer, 30(2):p.33–43, 1997.
- Fenton and Neil [1999] N.E. Fenton and M. Neil. A critique of software defect prediction models. IEEE Transactions on Software Engineering, 25(5):675–689, 1999.
- Shepperd [1988] Martin Shepperd. A critique of cyclomatic complexity as a software metric. Softw. Eng. J., 3(2):30–36, March 1988. ISSN 0268-6961. doi: 10.1049/sej.1988.0003. URL http://dx.doi.org/10.1049/sej.1988.0003.
- McCabe [1976] T. McCabe. A software complexity measure. IEEE Transactions on Software Engineering, 2(4):308–320, 1976.
- JSF [2005] JSF. Air vehicle C++ coding standards, December 2005. URL http://www.jsf.mil/downloads/documents/.
- Dijkstra [1968] E.W. Dijkstra. Go to statement considered harmful. Comm. ACM, 11(3):147–148, 1968.
- Nagappan [2018] Meiyappan Nagappan. Reconsidering whether goto is harmful. IEEE Software, 3(3):93–95, May/June 2018.
- MIRA [1998] MIRA. Guidelines for the use of the programming language C in vehicle based systems, 1998. http://www.misra.org.uk/.
- MIRA [2004] MIRA. Guidelines for the use of the programming language C in critical systems, 2004. URL http://www.misra.org.uk/.
- MIRA [2012] MIRA. Guidelines for the use of the programming language C in critical systems, 2012. URL http://www.misra.org.uk/.
- ESA [1998] ESA. Ada coding standard, October 1998. URL ftp://ftp.estec.es.nl/pub/wm/wme/bssc/bssc983.pdf.
- NASA [2011] NASA. Nasa toyota study, 2011. URL https://www.nasa.gov/topics/nasalife/features/nesc-toyota-study.html. Accessed 07-Jan-2018.
- Koopman [2014] P. Koopman. A case study of Toyota unintended acceleration and software safety, 2014. URL https://users.ece.cmu.edu/k̃oopman/pubs/koopman14_toyota_ua_slides.pdf. Accessed 07-Jan-2018.
- Research and Inc [2013] Safety Research and Strategies Inc. Toyota unintended acceleration and the big bowl of “spaghetti” code, 2013. URL http://www.safetyresearch.net/blog/articles/toyota-unintended-acceleration-and-big-bowl-spaghetti-code. Accessed 07-Jan-2018.
- Cummings [2016] D.M. Cummings. Embedded software under the courtroom microscope: A case study of the Toyota unintended acceleration trial. IEEE Technology and Society Magazine, 35(4):76–84, Dec 2016. doi: 10.1109/MTS.2016.2618681.
- Fu and Menzies [2017] Wei Fu and Tim Menzies. Revisiting unsupervised learning for defect prediction. In Proceedings of the 2017 11th Joint Meeting on Foundations of Software Engineering, ESEC/FSE 2017, pages 72–83, New York, NY, USA, 2017. ACM. ISBN 978-1-4503-5105-8. doi: 10.1145/3106237.3106257. URL http://doi.acm.org/10.1145/3106237.3106257.
- Subramanyam and Krishnan [2003] R. Subramanyam and M.S. Krishnan. Empirical analysis of CK metrics for object-oriented design complexity: Implications for software defects. IEEE Transactions on Software Engineering, 29(4):297–310, April 2003.
- Hatton [1998] Les Hatton. Does OO sync with the way we think ? IEEE Software, 15(3):46–54, 1998.
- Ince et al. [2012] Darrell C. Ince, Leslie Hatton, and John Graham-Cumming. The case for open program code. Nature, 482:485–488, February 2012. doi: 10.1038/nature10836.
- Group [1978–1999] Numerical Algorithms Group. NAG Fortran library, 1978–1999. URL http://www.nag.com/.
- Shooman [1985] M.L. Shooman. Software Engineering. McGraw-Hill, 2nd edition, 1985.
- Myers [1977] G.J. Myers. An extension to cyclomatic measure of program complexity. SIGPLAN Notices, 12(10):61–64, 1977.
- Hatton [2014] Les Hatton. Conservation of information: Software’s hidden clockwork. IEEE Transactions on Software Engineering, 40(5):450–460, May 2014. doi: 10.1109/TSE.2014.2316158.
- Hatton [1995] Les Hatton. Safer C: Developing software in high-integrity and safety-critical systems. McGraw-Hill, 1995. ISBN 0-07-707640-0.
- Nejmeh [1988] B.A. Nejmeh. Npath: A measure of execution path complexity and its applications. Comm. ACM, 31(2):188–200, 1988.
- Lipow [1982] M. Lipow. Number of faults per line of code. IEEE Transactions on Software Engineering, 8(4):437–439, 1982.
- Basili and Perricone [1984] V.R. Basili and B.T. Perricone. Software errors and complexity: an empirical investigation. Comm. ACM, 27(1):42–52, January 1984. URL http://www.lsmod.de/~bernhard/cvs/text/dipl/papers/p42-basili.pdf.
- A. Gunes Koru [2007] Hongfang Liu A. Gunes Koru, Dongsong Zhang. Modeling the effect of size on defect proneness for open-source software. In PROMISE ’07: Proceedings of the Third International Workshop on Predictor Models in Software Engineering, page 10, Washington, DC, USA, 2007. IEEE Computer Society. ISBN 0-7695-2954-2. doi: 10.1109/PROMISE.2007.9.
- van der Meulen [2008] Meine J.P. van der Meulen. The effectiveness of software diversity. Ph.D. Thesis, City University, London, 2008.
- Boehm and Basili [2001] B. Boehm and V.R. Basili. Software defect reduction top 10 list. IEEE Computer, 34(1):135–137, 2001.