AI2D-RST: A multimodal corpus of 1000 primary school science diagrams
Abstract
This article introduces AI2D-RST, a multimodal corpus of 1000 English-language diagrams that represent topics in primary school natural sciences, such as food webs, life cycles, moon phases and human physiology. The corpus is based on the Allen Institute for Artificial Intelligence Diagrams (AI2D) dataset, a collection of diagrams with crowd-sourced descriptions, which was originally developed to support research on automatic diagram understanding and visual question answering. Building on the segmentation of diagram layouts in AI2D, the AI2D-RST corpus presents a new multi-layer annotation schema that provides a rich description of their multimodal structure. Annotated by trained experts, the layers describe (1) the grouping of diagram elements into perceptual units, (2) the connections set up by diagrammatic elements such as arrows and lines, and (3) the discourse relations between diagram elements, which are described using Rhetorical Structure Theory (RST). Each annotation layer in AI2D-RST is represented using a graph. The corpus is freely available for research and teaching.
1 Introduction
Diagrams are a common feature of many everyday media: they can be found everywhere from scientific publications and instruction manuals to newspapers and school textbooks. Barbara Tversky, a cognitive psychologist who has made pioneering contributions to the study of diagrams, observes that their generic purpose is “to structure information to enable comprehension, inference and discovery” (Tversky, 2017, 350). Due to their widespread use, diagrams have been studied from various perspectives. Previous research has examined their visual perception (Hegarty & Just, 1993; Ware, 2012), structure and functions (Engelhardt, 2002; Purchase, 2014; Engelhardt & Richards, 2018) and their role as a tool for supporting thinking and reasoning (Tversky, 2015) and use in education and instruction (Tippett, 2016), to name but a few examples.
In this article, we make a novel contribution to the study of diagrams by presenting AI2D-RST, a corpus of 1000 English-language diagrams that represent topics in primary school natural sciences. The diagrams are described using a new multi-layer annotation schema that seeks to capture their multimodal structure. Our approach to multimodality is linguistically-inspired and semiotically-oriented, that is, we seek to systematically describe how expressive resources such as natural language, illustrations, line art, photographs, lines, arrows and layout are combined in diagrams to make and exchange meanings. To do so, we build on the general framework for multimodal communication proposed in Bateman et al. (2017) and its application to diagrams as set out in Hiippala & Bateman (2020).
The current work is situated within the emerging field of multimodality research, which studies how appropriate combinations of expressive resources emerge in communicative situations (see e.g. Wildfeuer et al., 2020). Despite their growing influence in various fields of study broadly concerned with human communication, many approaches to multimodality remain without adequate empirical support. Although building multimodal corpora is often presented as a solution to this shortcoming due to the success of corpus-based methods in linguistics, developing and applying complex multimodal annotation frameworks requires ample time and resources, and consequently the resulting corpora remain small (Bateman, 2008, 2014b; Thomas, 2014; Hiippala, 2015).
AI2D-RST seeks to reduce the need for time and resources and to scale up the volume of data by building multimodally-informed expert annotations on top of pre-existing crowd-sourced annotations from another dataset, namely the Allen Institute for Artificial Intelligence Diagrams (AI2D) dataset (Kembhavi et al., 2016). The second part of the name, RST, refers to Rhetorical Structure Theory, a theory of discourse structure which we use to describe how diagrams combine multiple expressive resources to fulfil their communicative goals (Mann & Thompson, 1988; Taboada & Mann, 2006; Hiippala & Orekhova, 2018). Overall, the AI2D-RST corpus is intended to serve a dual purpose: to support empirical research on the multimodality of diagrams and their computational processing.
2 Developing multimodal resources for diagrams research
There is a long-standing interest in the computational processing and generation of diagrammatic representations (André & Rist, 1995; Watanabe & Nagao, 1998; Bateman et al., 2001; Carberry et al., 2003; Bateman & Henschel, 2007), which is now resurfacing as recent advances in computer vision and natural language processing are brought to bear on diagrammatic representations (Seo et al., 2015; Sachan et al., 2018, 2019; Choi et al., 2018; Kim et al., 2019; Haehn et al., 2019). Much of this work is driven by research on established computational tasks such as information retrieval and question answering, which now increasingly acknowledge that the scope of these tasks should be extended to modes of expression beyond natural language.
Just how these other modes of expression and their combinations should be described in order to create multimodal resources that can support further research on multimodality remains an open question. This requires an empirical approach, as creating multimodal resources for modes of expression other than natural language raises questions about fundamental issues such as segmentation: how to decompose modes of expression such as diagrams into their constituent parts? We have recently argued in Hiippala & Bateman (2020) that any attempt at a systematic description of diagrams must acknowledge the specific characteristics of the diagrammatic mode – an abstract system capable of instantiating various types of diagrams appropriate for their context of occurrence (cf. e.g. Bateman & Henschel, 2007).
Previous research points at two key characteristics of the diagrammatic mode that need to be accounted for: the use of layout space (Watanabe & Nagao, 1998) and their multimodal discourse structure (Carberry et al., 2003), which are often strongly intertwined in multimodal artefacts with a 2D spatial extent, such as entire page-based documents (Hiippala, 2013). Firstly, diagrams have a spatial organisation in the form of a layout, which can be used to set up discourse relations between instances of expressive resources, including natural language, arrows, lines, illustrations, photographs, line drawings and potentially any resource that may be realised in 2D space (Watanabe & Nagao, 1998). How expressive resources are organized in the layout space can also serve as a strong signal about the purpose and structure of the diagram by generating expectations towards its discourse structure (Holsanova et al., 2009).
This brings us to the second point: diagrams combine expressive resources into discourse structures, which must be resolved to make sense of what the diagram in question attempts to communicate. For this reason, Carberry et al. (2003) argue that understanding diagrams should be framed a discourse-level problem, which has found support in our recent work on the diagrammatic mode (Hiippala & Bateman, 2020). This, however, raises another issue related to segmentation: many theories of discourse assume that discourse segments are identified before determining their interrelations (Grosz & Sidner, 1986; Mann & Thompson, 1988).
Establishing an inventory of discourse segments for diagrams is a particularly challenging task, as the level of detail needed for segmentation varies from one diagram to another, depending on the combination of expressive resources present and the discourse structures they participate in. To exemplify, a diagram featuring a cross-section of an object may need to be decomposed to parts that are picked out by labels, whereas illustrations that feature entire objects do not require such treatment (for a discussion of segmentation, see Hiippala & Bateman, 2020).
Keeping these two key characteristics of diagrams in mind, in the following sections we explicate how we built a new, multimodally-informed annotation schema with multiple layers of description on top of existing crowd-sourced annotations for expressive resources and their positioning in diagram layout. To do so, we start by introducing the AI2D dataset, which provided the crowd-sourced annotations. We then address certain issues with the AI2D annotation schema before motivating our decision to adopt Rhetorical Structure Theory for describing the discourse structure of diagrams in AI2D-RST.
3 The Allen Institute for Artificial Intelligence Diagrams (AI2D) dataset
The AI2D dataset (Kembhavi et al., 2016)111The AI2D dataset is publicly available at https://allenai.org/plato/diagram-understanding/ (Accessed September 3, 2019) was developed to support research on computational tasks such as automatic diagram understanding and visual question answering (see e.g. Kim et al., 2018). The dataset contains 4903 English-language diagrams that represent topics in primary school natural sciences, such as life cycles, food webs and circuits. Each diagram is assigned to one of 17 semantic categories that correspond to topics in this domain.
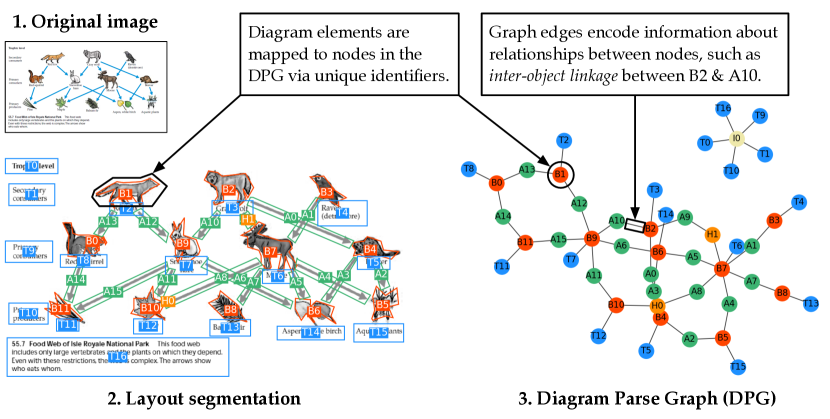
Building on Engelhardt’s (2002) framework for describing diagrammatic representations, Kembhavi et al. (2016, 239) model four types of diagram elements: ‘blobs’ (e.g. illustrations, line art, photographs and other visual modes of expression), written text, arrows and arrowheads. In addition, Kembhavi et al. (2016) define ten potential relationships that can hold between individual diagram elements, which are also drawn from the framework proposed by Engelhardt (2002). These include, among others, relations such as intra-object label, intra-object linkage and arrow descriptor, which seek to capture how diagram elements relate to each other (for a full list of relations, see Kembhavi et al., 2016, 239) AI2D represents diagram structure using a Diagram Parse Graph (DPG), in which the nodes stand for diagram elements whereas the edges encode information about the relations that hold between them. For computational tasks, the node features can be populated using word embeddings or visual features extracted using object detectors, depending on the diagram element type in question.
Figure 1 exemplifies the crowd-sourced annotation for the layout segmentation and DPG for diagram 274 in the AI2D dataset. The diagrams were scraped from Google Image Search by using chapter titles in primary school science textbooks (for ages 6–11) as search terms. The annotations were crowd-sourced using Amazon Mechanical Turk and divided into small tasks to segment the layout and construct a DPG for each diagram. The annotation tasks involved identifying diagram elements, categorising them and defining their interrelations (Kembhavi et al., 2016, 243). Kembhavi et al. (2016, 242) report that the 4903 diagrams in AI2D contain approximately 118 000 diagram elements and 53 000 relationships.
Previous research on the AI2D dataset has shown that inferring the meaning of arrows and lines is context-dependent, and the viewers consistently map the arrows to real-world processes they represent (Alikhani & Stone, 2018). Hiippala & Orekhova (2018), in turn, consider AI2D from the perspective of multimodality research and argue that DPGs conflate the description of various multimodal structures, such as the visual grouping of diagram elements and connections expressed using arrows and lines. Pulling these structures apart could help to understand how diagrams operate multimodally, that is, whether discourse relations are signalled explicitly or implicitly (Watanabe & Nagao, 1998; Carberry et al., 2003).
Moreover, the relation definitions drawn from Engelhardt (2002) focus mainly on local relations between diagram elements, as exemplified by relations such as intra-object label, which is used to describe instances in which one diagram element acts as a label for another. The focus on such local relations between individual diagram elements causes the AI2D annotation schema to fall short in describing the global organisation of a diagram, or how larger units formed of multiple diagram elements relate to each other (see Figure 2).
To summarize, the motivation for developing AI2D-RST can be traced back to two observations. First, the limited scope of relation definitions drawn from Engelhardt (2002) in AI2D led us to consider Rhetorical Structure Theory (RST) as an alternative for describing discourse relations in diagrams, given its previous successful applications to multimodal discourse (see e.g. Taboada & Habel, 2013; Thomas, 2014; Hiippala, 2015). However, during the exploratory work reported in Hiippala & Orekhova (2018), it became evident that a direct conversion to RST was not feasible, but required defining additional annotation layers to establish the units of analysis, as proposed in Bateman (2008).
Second, combining a theory of discourse structure with local and global reach, such as RST, with a multi-layer annotation schema that captures the combinations of expressive resources and their spatial organisation could be used to study whether diagrams signal discourse relations explicitly e.g. using arrows and lines, or whether they are implicit and require the viewers to draw on world knowledge (see also Hiippala & Bateman, 2020). Furthermore, access to crowd-sourced layout segmentations allows scaling up corpus size. With these two observations in mind, we now turn to describe the AI2D-RST annotation schema and its application to the AI2D diagrams.
4 Developing the AI2D-RST corpus
4.1 The AI2D-RST annotation schema
The AI2D-RST annotation schema describes the multimodal structure of diagrams using four annotation layers. These layers, named grouping, macro-grouping, connectivity and discourse structure, are introduced in the following sections. The annotation layers are represented using graphs, which are populated using diagram elements from the AI2D layout segmentation (see Figure 1). The unique identifiers for diagram elements are also carried over from the AI2D layout segmentation to the AI2D-RST graphs, in order to enable cross-references across annotation layers. This kind of stand-off approach to annotation separates the description of different multimodal structures, but allows combining them as necessary using the unique identifiers, which are shared across annotation layers.
4.1.1 Grouping
The grouping layer describes which diagram elements form visual groups, that is, which elements are likely to be perceived as belonging together. The principles behind grouping correspond loosely to Gestalt principles of perception, which often act as guiding principles for designing diagrams and other visualisations (Ware, 2012, 179). The grouping annotation is represented using an undirected, acyclic tree graph, such as the one shown on the right-hand side in Figure 3.
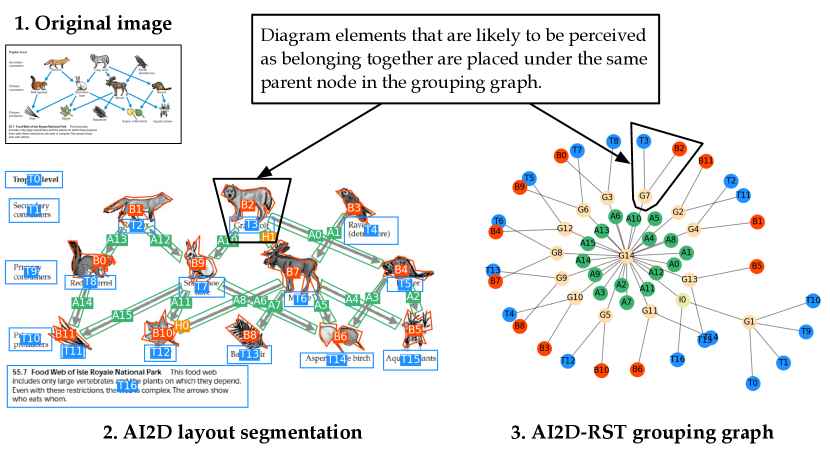
In Figure 3, the root node of the graph is the image constant I0, which stands for the entire diagram. In contrast to AI2D, the AI2D-RST grouping layer includes nodes for only three types of diagram elements, namely blobs, text and arrows, but introduces another node type: groups. Diagram elements that form a visual unit in the layout are placed under the same parent node in the grouping graph. These nodes have the prefix G in their identifier, which stands for a group.
Conversely, besides grouping elements together, the grouping graph also represents which elements are considered independent, or in other words, do not belong to any visual groups. In Figure 3, such independent units include the arrows A0–15 that set up the network of connections between the groups of illustrations and their labels G2–13. These connections are described in the connectivity layer in order to avoid making arbitrary decisions about whether arrows should be grouped with their sources or targets (see Section 4.1.3).
To summarize, the grouping graph provides a foundation for the subsequent annotation layers, namely macro-grouping, connectivity and discourse structure by providing the necessary units of analysis. In practice, the grouping graph allows diagram elements that form visual groups to be picked up for description in these layers by referring to the identifiers of their grouping nodes.
4.1.2 Macro-grouping
Macro-grouping captures the generic principles that govern diagram structure above the level of visual groups identified in the grouping layer, in order to describe why such visual groupings of expressive resources exist in the first place. To draw on an example, the grouping graph shown in Figure 3 consists of the groups G2–G13, which combine an illustration and a written label, and the arrows A0–15. Both groups and arrows form a single visual group, G14, which may be appropriately characterised as a network. We term such constellations of visual groups macro-groups, because they combine multiple visual groups into a larger structure.
Due to their close relation to the grouping layer, the annotation for macro-grouping layer is incorporated into the grouping graph. If the diagram consists of a single macro-group, macro-grouping information is assigned to the root node of the grouping graph (the image constant I0), but if the diagram features multiple macro-groups, this information may be assigned to grouping nodes as well. Figure 3 exemplifies a diagram with multiple macro-groups. The food web under grouping node G14 is assigned the macro-group network, whereas the categories on the left under the grouping node G1 form a vertical organisation, whose function is to provide labels for visual groups in the network.
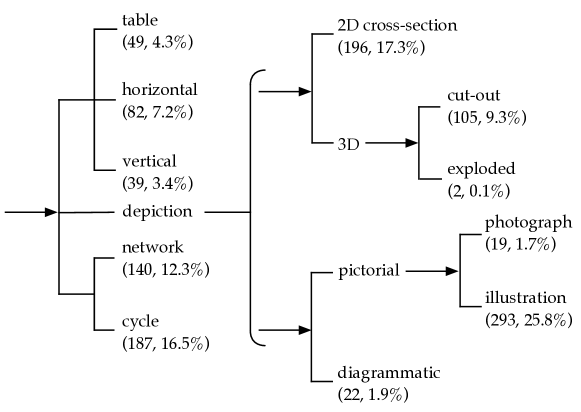
Figure 4 shows a typology of macro-groups developed on the basis of our initial analysis of diagram types in the AI2D-RST corpus. As such, the scope of the typology is not intended to cover the space of possibilities within the entire diagrammatic mode, but is limited to the diagrams in AI2D-RST. In addition to describing the larger organisations of visual groups, macro-groups are intended to provide a set of structural categories that correspond to different diagram types, in contrast to the semantic categories in AI2D, which are based on the subject matter of the diagram. In this way, macro-groups can also be used as target labels for training classifiers.
4.1.3 Connectivity
The connectivity layer describes connections between diagram elements and their groups, which are signalled visually using arrows, lines and other diagrammatic elements capable of expressing connectivity (Tversky et al., 2000). In AI2D-RST, the connectivity annotation covers visually explicit connections between diagram elements only, that is, the arrows and lines must have a clear source and a target, in order to allow the connections to be represented using graphs (cf. Alikhani & Stone, 2018, 3554). The AI2D-RST annotation schema defines three types of connections based on directionality: undirected, directed and bidirectional.
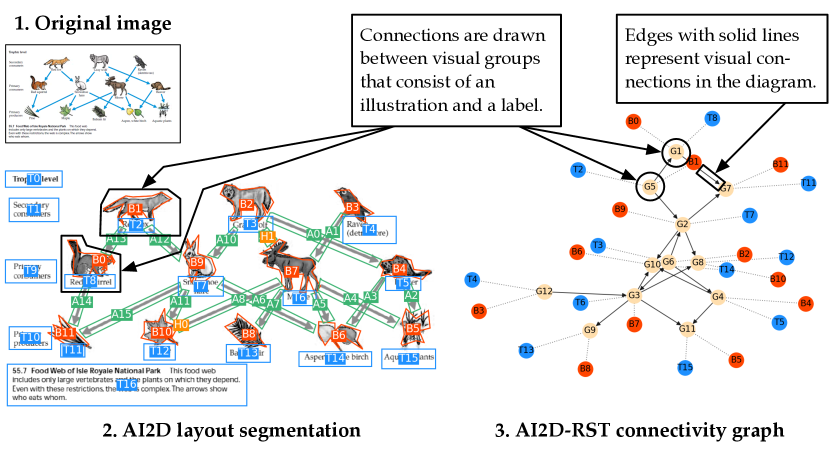
The connectivity annotation is represented using a cyclic mixed graph, which means that the graph may feature both undirected and directed edges. Figure 5 exemplifies a connectivity graph, whose visualization has been enhanced with edges from the grouping graph (for the original grouping graph, see Figure 3), because the connections in Figure 5 are likely to be perceived to hold between visual groups of elements, rather than individual elements, such as labels or illustrations. Annotating connectivity according to visually explicit connections between individual elements, which originate and terminate in both labels and illustrations, as exemplified by the directed connection between the text block T3 (‘Gray wolf’) and the illustration of a hare in B9, results in an incomplete representation of connectivity. This shows why visual groups are needed as basic units of analysis for a graph-based representation of connectivity, which also illustrates how the grouping layer supports other annotation layers by providing the necessary units of analysis.
4.1.4 Discourse structure
Whereas the grouping and connectivity layers seek to capture the diagram structure that is explicitly available for visual inspection, the discourse structure layer attempts to describe the implicit discourse relations that hold between diagram elements and their groups, which viewers may recover from the diagram structure. As such, the discourse structure layer provides the crucial link between multimodal structure and communicative intentions.
For describing the discourse structure of diagrams, AI2D-RST uses Rhetorical Structure Theory (RST; see e.g. Mann & Thompson, 1988; Taboada & Mann, 2006), a theory of textual organisation and coherence which has been previously extended to diagrams in natural language generation (André & Rist, 1995; Bateman et al., 2001; Bateman & Henschel, 2007) and for describing discourse relations in research on multimodal documents and other artefacts (Bateman, 2008; Thomas, 2009; Taboada & Habel, 2013; Hiippala, 2015). This extension of RST, which may be described as multimodal RST, provides the foundation for discourse structure annotation in AI2D-RST, as exemplified in Figure 6.

Both ‘classical’ and multimodal RST provide a set of discourse relations with criteria for their application (Mann & Thompson, 1988; Bateman, 2008). For annotating discourse relations in the AI2D-RST corpus, we used the relation definitions presented in Hiippala (2015, 221–223) which cover the classical RST relations from Mann & Thompson (1988) with the multimodal extension proposed in Bateman (2008). We also introduced an additional relation, cyclic sequence, which is used to describe repeating sequences (see the example in Figure 7).
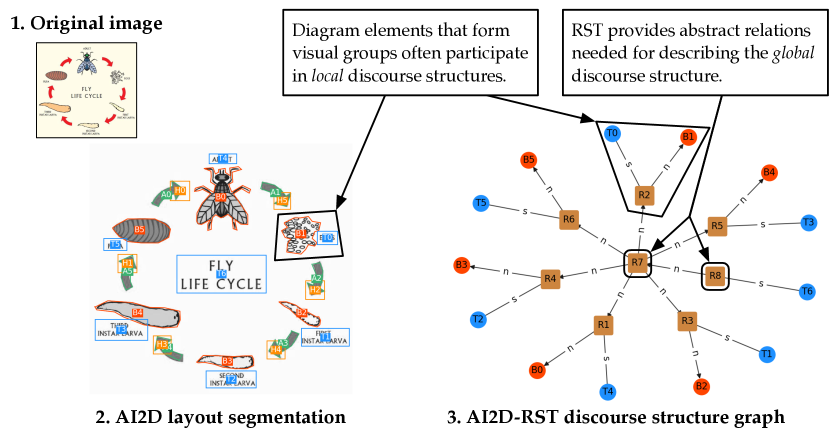
We drew on these relation definitions to describe how elementary discourse units – which in AI2D-RST correspond to diagram elements or their groups – relate to each other. Depending on the relation, one discourse unit may be considered nuclear, or more important, whereas other units act as satellites that play a secondary role. RST terms such relations asymmetric. Symmetric relations, in turn, may have multiple nuclei, indicating equal status among discourse units. The example in Figure 6 exemplifies both symmetric (R2, R3) and asymmetric (R1) relations and illustrates how RST relations are represented in the discourse structure graph. Relations are added to the graph as nodes whose identifier has the prefix R, whereas the edges between these nodes carry information on nuclearity, that is, whether the participating diagram elements act as nuclei or satellites.
Figure 7 shows a more complex example, which illustrates the benefit of adopting RST for describing the discourse structure of diagrams. As pointed out above in Section 3, the relation definitions in the AI2D annotation schema are largely constrained to local relations between adjacent elements. RST, in turn, provides abstract relations that can handle the description of global discourse organisation as well, or how larger constellations of diagram elements relate to each other.
RST analyses are commonly represented using recursive tree diagrams, although this is not a requirement set by the theory (Taboada & Mann, 2006, 435). Wolf & Gibson (2005) have argued that tree structures are too constrained for an accurate representation of discourse structure, because a single discourse unit may be picked up as a part of multiple discourse relations. They propose using graphs as an alternative data structure, which would allow discourse units to participate in multiple relations and abolish the hierarchical tree structure.
The discourse structure layer, however, preserves the hierarchical structure and uses a directed acyclic tree graph to represent RST analyses. This decision is motivated by the use of layout space in diagrams, which is regularly used to set up discourse relations between diagram elements (Waller, 2012; Watanabe & Nagao, 1998). The inherently spatial organisation of diagrams makes constraining the application of discourse relations difficult, particularly in terms of spatial adjacency, that is, limiting relations to elements that are positioned close to each other (cf. Bateman, 2008, 158). We consider preserving the tree structure to impose additional control on the application of RST relations.
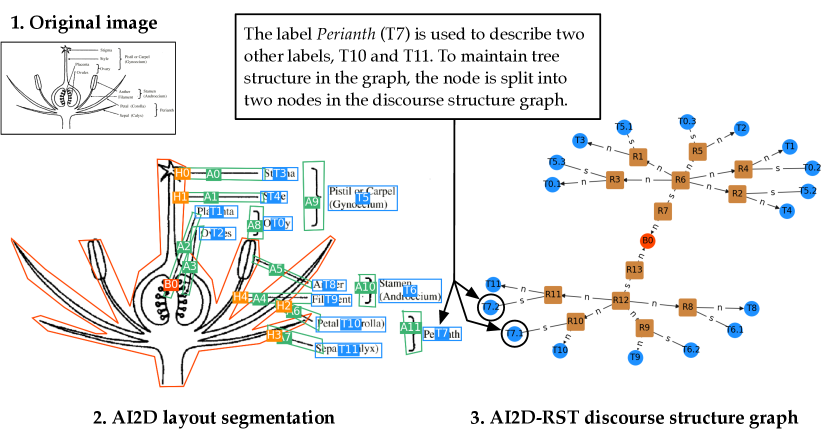
We do, however, acknowledge that like multimodal documents, diagrams can ‘re-use’ discourse units in different rhetorical relations (Bateman, 2008, 159). To account for diagram elements that take on the role of satellites or nuclei in multiple rhetorical relations, we split the diagram elements to preserve the hierarchical structure, as shown in Figure 8. This involves creating copies of a node in the graph, which are identified using a decimal in the node name, such as T7.1 or T7.2. Each copy of the node may be then picked up in the RST analysis while preserving the tree structure. Because the original identifiers are preserved as attributes of the split nodes in the discourse structure graph, the acyclic tree graphs can be easily converted into cyclic graphs favoured by Wolf & Gibson (2005), if necessary.
4.2 Annotators and training
The AI2D-RST diagrams were annotated by five students pursuing BA or MA degrees in English, who received approximately 10 hours of initial training in the form of introductory sessions covering each annotation layer. They also received detailed feedback on their initial work and could pose questions about the application of the annotation schema using an online tool for team collaboration. The annotators were also supported by a document that provided guidelines and preferred solutions to common annotation problems, which is available in the repository associated with this article. We return to discuss the impact that the collaborative annotation process may have had on the reproducibility of the annotation framework at the end of Section 5.
4.3 The annotation tool
We developed an in-house tool to annotate the diagrams. The tool provides a command line interface for building graphs, which are initially populated by nodes from the original AI2D layout segmentation. The tool is written in Python 3.6 and makes extensive use of the matplotlib (Hunter, 2007), NetworkX (Hagberg et al., 2008), OpenCV (Bradski & Kaehler, 2013) and pandas (McKinney, 2010) libraries. The tool and its source code are available with an open license at https://doi.org/10.5281/zenodo.3384751.
4.4 Acquiring the corpus
The AI2D-RST corpus is available for download as JSON files in the Language Bank of Finland: http://urn.fi/urn:nbn:fi:lb-2019120407. Python functions for loading and processing the corpus are provided separately at https://doi.org/10.5281/zenodo.3384751.
5 Measuring the reliability of the annotation
We measured inter-annotator agreement when 355 diagrams had been annotated. At this stage, the annotators were assumed to have familiarised themselves with the annotation schema. Because the data was annotated by five annotators, we used Fleiss’ kappa () as implemented in the statsmodels Python library (Seabold & Perktold, 2010) as the metric for measuring inter-annotator agreement. We report both the original statistic, as proposed by Fleiss (1971), which is calculated using marginal probabilities for each category, and the free-marginal proposed by Randolph (2005), which assumes a uniform distribution over all categories. We refer to Fleiss’ original definition as marginal and Randolph’s alternative as uniform . In addition, we used the irr library (Gamer et al., 2019) for the R programming language (R Core Team, 2019) to calculate class-wise marginal scores for grouping, macro-grouping, connectivity and discourse structure annotations. The results are reported in Sections 5.1, 5.2, 5.3 and 5.4. Finally, in Section 5.5 we model annotator reliability using MACE (Hovy et al., 2013). The raw annotations are provided as CSV files at https://doi.org/10.5281/zenodo.3384751.
5.1 Grouping
| Category | Description | z-score | p-value | |
|---|---|---|---|---|
| Guideline | The AI2D-RST guidelines state that the elements are grouped together. | 0.929 | 47.008 | |
| Proximity | The diagram elements are placed close to each other in the layout space. | 0.851 | 43.046 | |
| Closure | The element encloses the other element. | 0.776 | 39.243 | |
| Similarity | The elements are similar in terms of their visual appearance. | 0.622 | 31.453 | |
| No-group | The elements do not form a valid group according to the AI2D-RST schema. | 0.410 | 20.766 | |
| Continuity | The elements form a continuous unit. | 0.210 | 10.623 | |
| Connectedness | The elements are connected to each other. | -0.003 | -0.159 | 0.874 |
| Symmetry | The elements form a symmetrical shape. | -0.002 | -0.079 | 0.937 |
To evaluate the reliability of grouping layer annotation introduced in Section 4.1.1, we sampled the 355 completed diagrams without replacement for 10% of visual groups composed of diagram elements only, excluding groups whose child nodes included other grouping nodes. This amounted to 256 groups, whose elements were highlighted in the AI2D layout segmentation and presented to the annotators. The annotators were then asked whether the elements form a visual group, as defined in the AI2D-RST annotation schema. If the annotators considered the grouping valid, a follow-up question requested the annotators to name Gestalt principle or annotation guideline that justified their choice. If multiple principles or guidelines were applicable, the annotators were asked to choose the most prominent one. For inter-annotator agreement between five annotators and 256 groups, the marginal was 0.836, while the uniform was 0.894.
Table 1 shows class-wise agreement for Gestalt principles and annotation guidelines, which are sorted in descending order based on their marginal values. The results suggest that the annotation guide supported the consistent description of the data. Most cases in the guideline category consisted of label–line combinations, such as those shown in Figure 6. In principle, such combinations could be grouped together based on several Gestalt principles, such as proximity, continuity and connectedness, but explicating annotation patterns for common diagrammatic structures such as labels and their connecting lines seems to make the decisions less arbitrary. In addition, common spatial- and attribute-based relations that build on Gestalt principles such as proximity, closure and similarity (Engelhardt, 2002, 30), are annotated consistently in the AI2D-RST corpus.
5.2 Macro-grouping
For measuring inter-annotator agreement on the macro-groups introduced in Section 4.1.2, we sampled the 355 completed diagrams without replacement for 33% of macro-groups, which amounted to 119 macro-groups. The annotators were presented with the AI2D layout segmentation and the AI2D-RST grouping graph, which highlighted the node that had been assigned with macro-grouping information. The annotators were then asked which macro-group they would assign to the node in question. For inter-annotator agreement on macro-groups, the marginal was 0.784 and the uniform was 0.800.
| Macro-group | z-score | p-value | Frequency in the entire corpus | |
|---|---|---|---|---|
| Network | 0.884 | 30.480 | 0.123 | |
| Cycle | 0.876 | 30.204 | 0.165 | |
| Cut-out | 0.849 | 29.271 | 0.093 | |
| Slice | 0.754 | 25.996 | 0.173 | |
| Horizontal | 0.726 | 25.031 | 0.072 | |
| Diagrammatic | 0.718 | 24.785 | 0.019 | |
| Illustration | 0.709 | 24.458 | 0.258 | |
| Vertical | 0.702 | 24.228 | 0.034 | |
| Table | 0.247 | 8.537 | 0.043 | |
| Photograph | 0.162 | 5.604 | 0.017 |
Table 2 gives class-wise marginal values for macro-groups in descending order. Agreement is particularly high for visually distinctive macro-groups such as networks, cycles and cut-outs, which occur frequently in the AI2D-RST corpus (see also Figure 4). The values are considerably lower for less common macro-groups such as tables and photographs. Photographs, in particular, are rarely preferred as the main visual mode of expression in the AI2D-RST corpus, as diagrams in the corpus favour illustrations, cut-outs and cross-sections for visual expression. For these prominent macro-groups, agreement remains substantial.
5.3 Connectivity
For connectivity annotation (see Section 4.1.3), we sampled the 355 completed diagrams without replacement for 10% connections holding between diagram elements or their groups, which resulted in 239 connections. The source and target of each connection were highlighted in the AI2D layout segmentation and presented to the annotators, who were then asked to place the connection into one of four categories: directed, undirected, bidirectional or no connection. Measuring inter-annotator agreement returned a marginal of 0.878 and uniform of 0.916. Table 3 gives class-wise marginal values for each connection type. Apart from no connection, agreement is high across all types of connectivity, as might be expected with a low number of categories, which are also visually distinctive and whose structural features are relatively easy to formalize (see Alikhani & Stone, 2018, 3554).
| Connection | z-score | p-value | Frequency in the entire corpus | |
|---|---|---|---|---|
| Directed | 0.910 | 44.512 | 0.511 | |
| Bidirectional | 0.908 | 44.402 | 0.004 | |
| Undirected | 0.900 | 44.003 | 0.485 | |
| No connection | 0.192 | 9.392 | N/A |
5.4 Discourse structure
For evaluating inter-annotator agreement on the discourse structure layer introduced in Section 4.1.4, we sampled the 355 completed diagrams without replacement for 10% of the relations, amounting to a total of 227 RST relations. The AI2D layout segmentation and the AI2D-RST discourse structure graph were presented side-by-side to the annotators, highlighting the RST relation node to be annotated in the discourse structure graph. Measuring overall agreement on the RST relations returned a marginal of 0.733 and a uniform of 0.783.
| Discourse relation | z-score | p-value | Frequency in the entire corpus | |
|---|---|---|---|---|
| cyclic sequence | 0.924 | 44.029 | 0.033 | |
| preparation | 0.870 | 41.471 | 0.054 | |
| property-ascription | 0.870 | 41.468 | 0.070 | |
| joint | 0.827 | 39.419 | 0.109 | |
| identification | 0.798 | 37.998 | 0.439 | |
| connected | 0.766 | 36.492 | 0.030 | |
| sequence | 0.689 | 32.844 | 0.015 | |
| elaboration | 0.620 | 29.540 | 0.134 | |
| circumstance | 0.449 | 21.388 | 0.029 | |
| contrast | 0.308 | 14.656 | 0.024 | |
| class-ascription | 0.266 | 12.680 | 0.028 | |
| conjunction | 0.249 | 11.848 | ||
| disjunction | 0.249 | 11.848 | 0.003 | |
| list | 0.182 | 8.659 | 0.007 | |
| nonvolitional cause | 0.138 | 6.553 | 0.004 | |
| nonvolitional result | 0.078 | 3.738 | 0.006 | |
| means | 0.066 | 3.129 | 0.002 | 0.003 |
| condition | -0.001 | -0.042 | 0.966 | 0.001 |
| purpose | -0.001 | -0.042 | 0.966 | N/A |
| restatement | -0.003 | -0.126 | 0.900 | 0.004 |
Table 4 provides class-wise marginal scores for RST relations that the annotators used during the inter-annotator agreement experiment in a descending order. The results show that annotators consistently agree on common RST relations such as cyclic sequence, which is used to annotate recurring cycles formed by diagram elements, and preparation, which is used to describe the relationship between a title and an entire diagram. These RST relations are associated with visually distinctive macro-groups (cycles) and relatively fixed diagram elements (titles), which is likely to increase agreement. The same applies to frequently occurring relations defined between a label and an object or its part, such as property-ascription, identification and elaboration, whose specific use cases were defined in the annotation guide. In short, the development of an annotation guide seemed to support the consistent annotation of RST relations. Compared to previous studies of inter-annotator agreement using multimodal RST (e.g. Taboada & Habel, 2013), the scores for the AI2D-RST discourse structure layer are promising, as relations with a cover 88.4% of RST relations in the corpus.
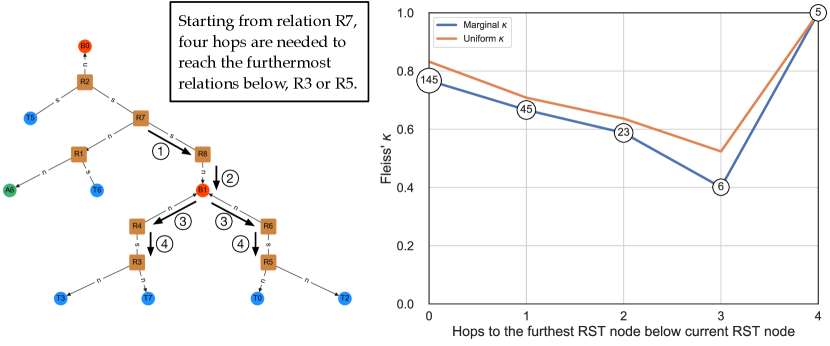
Figure 9 provides an alternative view to the reliability of the discourse structure annotation by measuring inter-annotator agreement at different depths of the RST tree graph. Not surprisingly, agreement is highest at the leaves of the tree graph (hop 0) with a marginal of 0.767 and a uniform of 0.832. These consistently annotated relations mainly cover local discourse structures illustrated in Figure 7, as exemplified by identification (), joint () and property-ascription (). As the values for hops 1–3 show, agreement decreases for relations that are positioned up the tree, which represent the more abstract relations that hold between larger discourse units. Surprisingly, annotators consistently agree on how the relations closest to the root (hop 4) should be annotated. It should be noted, however, that sample sizes are very small for hops 3 and 4 and should therefore be treated with caution.
5.5 Modelling annotator reliability
In addition to measuring inter-annotator agreement, we estimated annotator reliability using MACE (Hovy et al., 2013). MACE, which stands for Multi-Annotator Competence Estimation, models the annotation process by treating the labels as latent variables and uses unsupervised learning to estimate the model parameters. The model seeks to predict whether the annotator is answering dutifully or choosing the answers at random. Hovy et al. (2013, 1124) show that MACE reliability estimates correlate strongly with annotator proficiency. Table 5 shows MACE reliability estimates using default settings, which suggests dutiful annotation with slightly varying competences between annotators.
| Task | Ann. 1 | Ann. 2 | Ann. 3 | Ann. 4 | Ann. 5 |
|---|---|---|---|---|---|
| Grouping | 0.9133 | 0.9378 | 0.9040 | 0.9601 | 0.9430 |
| Macro-grouping | 0.8851 | 0.8052 | 0.9351 | 0.8574 | 0.8954 |
| Connectivity | 0.9478 | 0.9382 | 0.9531 | 0.9364 | 0.9631 |
| Discourse structure | 0.8452 | 0.8698 | 0.8912 | 0.8021 | 0.9249 |
5.6 On the reliability and reproducibility of the AI2D-RST annotation schema
Overall, the results for measuring inter-annotator agreement suggest that the AI2D-RST annotation is applied consistently to the diagrams. The results are particularly promising given that inter-annotator agreement was measured between five annotators. However, it is important to acknowledge that measuring inter-annotator agreement using metrics such as Fleiss’ often involve compromises. In the case of RST, for instance, measuring agreement over a single relation in a given context is very different from constructing entire RST trees and comparing them between annotators. To improve the evaluation of annotation reliability, future studies applying multimodal RST should follow up on recent developments in research on the automatic comparison of RST trees (see e.g. Wan et al., 2019). Alternatively, the approach illustrated in Figure 9 could be used sample relations along the depth of the RST tree in a balanced manner, in order to ensure that agreement is evaluated for both local and global discourse structures.
In terms of the annotation schema, it should be noted that the expert annotators helped to develop the AI2D-RST annotation schema by discussing specific examples with each other, which were then documented in the annotation guide. This violates several principles of reproducibility set out for content analysis in Krippendorff (2013). However, as Artstein & Poesio (2008, 575) point out, content analysis treats the annotation process as an experiment about whether some properties may be consistently detected in a text, whose success is determined by reproducibility of the annotation. In computational linguistics, annotation serves a different purpose, such as creating resources for training and evaluating algorithms, which differs from the goals of content analysis (Reidsma & Carletta, 2007).
Riezler (2014, 240), however, also calls for attention to the consequences of violating the requirement of independence, that is, allowing the annotators to discuss annotation tasks. This is likely to generate implicit knowledge among the annotators, which increases agreement among annotators but hinders reproducibility. This kind of implicit knowledge gives rise to circularity in annotation, which has been acknowledged as a problem in multimodality research (Thomas, 2014). Given the collaborative annotation procedure, it is likely that the AI2D-RST annotations exhibit a degree of circularity.
To evaluate and improve the reproducibility of the AI2D-RST framework, future work should employ naive annotators, who are assigned tasks that do not build on concepts introduced in the annotation framework (see e.g. Asheghi et al., 2016). This kind of non-theoretical grounding (Riezler, 2014) could help to break circularity by evaluating, for instance, whether naive annotators perceive diagram elements to form visual groups (grouping) or whether arrows and lines are considered to signal connections between individual diagram elements or visual groups (connectivity). For discourse structure annotation, Yung et al. (2019) introduce a multi-step procedure for sourcing descriptions of discourse relations from naive annotators. Adopting this approach in multimodal RST, however, would require additional efforts to accommodate the presence of multiple expressive resources.
6 Exploring the AI2D-RST corpus
In this section, we present a brief exploratory analysis of the AI2D-RST corpus. We begin with a rather straightforward approach illustrated in Figure 10, which makes minimal use of the graph-based representations by simply counting instances of diagram elements, macro-groups, rhetorical relations, nuclei and satellites, and types of connections in each diagram. Finally, we also calculate network density for the connectivity graph, which measures the proportion of actual edges present in the graph out of all possible edges. We concatenate these values into a 46-dimensional feature vector and use z-score normalization to scale the values of each dimension to have a mean of 0 and a standard deviation of 1. This provides each diagram in the AI2D-RST corpus with a normalised 46-dimensional feature vector that represents its the multimodal structure.

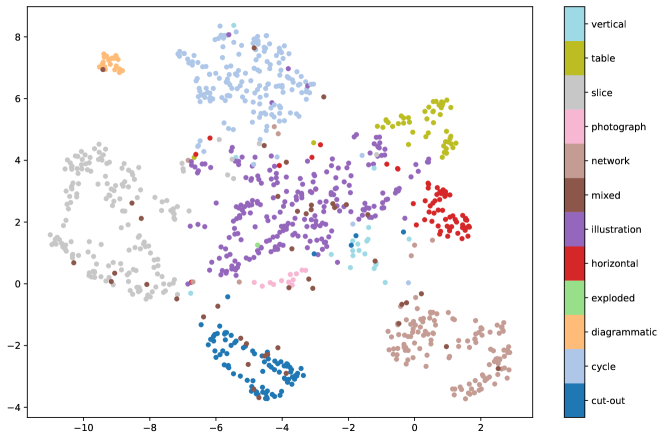
Figure 11 shows a visualisation that uses the UMAP algorithm (McInnes et al., 2018) to reduce the 46-dimensional feature vectors to two dimensions for a visual exploration of the AI2D-RST corpus. When mapping points between high- and low-dimensional spaces, UMAP seeks to preserve both local and global structure of the points in the two spaces. In other words, points that are close to each other in the 46-dimensional space should be close to each other in the two-dimensional space, whereas points that are distant from each other in the 46-dimensional space should remain distant in the two-dimensional space as well.
The UMAP embeddings in Figure 11 show distinct clusters that correspond to specific macro-groups, such as cycles, cross-sections, cut-outs and networks, which illustrate the space of structural variation among the AI2D-RST diagrams. It should be noted, however, that the macro-grouping annotation is explicitly encoded into the 46-dimensional feature vector. This information is thus directly available to UMAP for learning the 2-dimensional embeddings, which the algorithm leverages when clustering points in the low-dimensional space.
Nevertheless, the visualisation in Figure 11 can yield valuable insights into the structural variation among the AI2D-RST diagrams. Firstly, diagrams that feature several macro-groups (see Section 4.1.2) can be found within all major clusters, which suggests that even simple count-based features can capture structural distinctions in diagrams. The diagrams labelled as ‘mixed’ are particularly interesting, as they may yield information on which macro-groups are readily combined with each other in the AI2D-RST corpus. The clusters for individual macro-groups, in turn, appear to capture variation within macro-groups, as exemplified by the clusters for networks and cross-sections, which seem to form two parts. Whether such formations within clusters reflect alternative structural configurations of expressive resources within specific diagram types warrants further analysis.
Secondly, diagrams that feature rigid layouts, such as tabular, horizontal and vertical macro-groups, are not only positioned close to each other, but also form a continuation of the cluster for illustrations. This is not surprising, as tabular, vertical and horizontal macro-groups are typically used to organise multiple instances of visual depictions and their verbal descriptions for presentation, in which the local discourse structures are similar to individual illustrations (for examples of local discourse structures, see Figure 7). The clusters for cut-outs and cross-sections, in turn, are distinct from illustrations, which may be traced back to differences in their discourse structure. Whereas cut-outs and cross-sections typically use labels to pick out parts or regions of a visual depiction, illustrations use labels to identify the entire object. This distinction is captured by their discourse structure annotation.
Thirdly, the diagrammatic macro-group forms a tight cluster, which is clearly separate from other macro-groups. Although the sample size for this macro-group is fairly small (), this is an interesting observation as the UMAP embeddings seem to capture a fundamental difference between the diagrammatic macro-group and other macro-groups in the corpus, which may be traced back to their discourse structure. The diagrammatic macro-group features schematic diagrams such as circuit diagrams, whose elements have fixed meanings, as exemplified by standardized symbols for switches, connections, circuit breakers and the like.
Because their diagram elements have fixed meanings that do not need to be recovered discursively from their context of occurrence, schematic diagrams resist RST analysis. Put differently, there is no need for the viewer to resolve discourse relations between diagram elements, as all the information needed for making sense of the diagram is communicated using arrows and lines that signal connections between diagram elements with fixed meanings. Although these connections are captured by the AI2D-RST connectivity layer, this raises questions about the need to revise the AI2D-RST annotation schema, if it were to be extended to domains featuring many types of schematic diagrams, in order to draw out their differences.
This brief exploratory analysis has illustrated how the AI2D-RST corpus can be used to support empirical research on the multimodality of diagrams. As pointed out above, the features extracted from the corpus made minimal use of the properties of the graph-based representations (see Figure 10). The properties of graphs could be exploited to a much larger extent using algorithms such as graph neural networks (see e.g. Wu et al., 2019), which learn representations of graph-structured data by passing and receiving features between neighbouring nodes. Such methods could be particularly useful for learning representations of discourse structure in diagrams, allowing their computational representation to encode interactions between diagram elements. However, learning these representations directly from the data can be complicated by the relatively small number diagrams in AI2D-RST.
7 Discussion
Developing the AI2D-RST corpus showed that exploiting readily-available annotations can be used to increase the volume of richly-annotated multimodal corpora, but this comes at a cost, particularly for annotating their discourse structure. As explicated in Hiippala & Bateman (2020), identifying the elementary discourse units required by RST and other discourse annotation frameworks is particularly complicated for diagrams, because the extent to which diagrams need to be decomposed to achieve a sufficient inventory of elementary discourse units varies from one diagram to another. In short, the level of detail needed for decomposition depends on the combination of expressive resources and the discourse relations they participate in (see Section 2).
Because the AI2D layout segmentation does not provide this kind of discourse-driven decomposition at various levels of detail, the AI2D-RST annotation schema had to make compromises in the description of discourse structure. The example in Figure 6 illustrates this issue aptly: the written labels are used to pick out parts of the illustration, and to achieve a maximally accurate RST analysis of the diagram, the illustration should be decomposed into its component parts. However, as the crowd-sourced annotators were not instructed to decompose visual expressive resources during layout segmentation, the elementary discourse units needed for a maximally coherent representation of discourse structure within RST are not available (for a discussion of similar problems in annotating comics, see Bateman & Wildfeuer, 2014).
This shortcoming also carries implications for crowd-sourcing annotations for the diagrammatic mode in any domain. Because the discourse structure determines to what extent the diagram must be decomposed, defining crowd-sourcing tasks developed for the annotation of photographic images is unlikely to work for identifying the ‘building blocks’ of diagrams (cf. Kovashka et al., 2016). Instead of defining semantic object classes (i.e. what the diagram element represents), these building blocks should correspond to expressive resources available to the diagrammatic mode, such as written language, arrows, lines and other diagrammatic elements. Crucially, these expressive resources must be complemented by sufficiently fine-grained descriptions of graphic expressive resources, such as line drawings, coloured illustrations, cut-outs, cross-sections and exploded views, and photographs, to name just a few examples. In short, pre-theoretical notions such as ‘language’ and ‘image’ (cf. Bateman, 2014a) are not sufficiently fine-grained to capture the motivated use of distinctive graphic expressive resources in diagrams.
Although the development of AI2D-RST revealed various challenges discussed above, we argue that the corpus is still a valuable resource for studying how the diagrammatic mode is used in the domain of primary school natural sciences and beyond. In the study of multimodal discourse, the corpus could be used for investigating whether discourse relations between diagram elements are signalled visually using arrows and lines or spatially using layout (cf. Watanabe & Nagao, 1998), thus complementing the linguistic research on signalling of discourse relations by Das & Taboada (2018). Such empirically-backed insights could be particularly valuable to educational research on the visual perception of diagrammatic representations and their role in constructing mental models (Tippett, 2016). Another avenue of further research involves the automatic annotation of diagram corpora. The AI2D-RST corpus covers just over 20% of the AI2D dataset, which raises the question whether the 1000 diagrams in AI2D-RST are sufficient for teaching algorithms to generate AI2D-RST representations for the remaining 3900 diagrams in AI2D.
8 Concluding remarks
In this article we introduced AI2D-RST, a new multimodal corpus of 1000 English-language primary school science diagrams, which combines crowd-sourced and expert annotations to provide a rich description of their multimodal structure. The multi-layered, stand-off annotation schema developed for AI2D-RST accounts for (1) the visual grouping of diagram elements, (2) how their connections are signalled using arrows and lines, and (3) the discourse relations between diagram elements using Rhetorical Structure Theory. We measured agreement between five annotators: the results suggest that the annotation schema may be reliably applied to describe diagrams in the AI2D-RST corpus.
As our brief exploratory analysis of the AI2D-RST corpus showed, the combination of multiple annotation layers and graph-based representations can yield valuable insights into the multimodal structure of diagrams. As such, the corpus can support empirical research on diagrams as a mode of expression and their computational processing. In terms of methodology, developing the AI2D-RST corpus illustrated how crowd-sourcing low-level annotations and building expert descriptions on top of them can be used to increase the size of corpora in the field of multimodality research. Insights from linguistically-inspired multimodality research, in turn, can also inform the creation of resources for research on the computational processing and generation of diagrams.
References
- (1)
- Alikhani & Stone (2018) Alikhani, M. & Stone, M. (2018), Arrows are the verbs of diagrams, in ‘Proceedings of the 27th International Conference on Computational Linguistics’, Santa Fe, New Mexico, USA, pp. 3552–3563.
- André & Rist (1995) André, E. & Rist, T. (1995), ‘Generating coherent presentations employing textual and visual material’, Artificial Intelligence Review 9, 147–165.
- Artstein & Poesio (2008) Artstein, R. & Poesio, M. (2008), ‘Inter-coder agreement for computational linguistics’, Computational Linguistics 34(4), 555–596.
- Asheghi et al. (2016) Asheghi, N. R., Sharoff, S. & Markert, K. (2016), ‘Crowdsourcing for web genre annotation’, Language Resources & Evaluation 50(3), 603–641.
- Bateman (2008) Bateman, J. A. (2008), Multimodality and Genre: A Foundation for the Systematic Analysis of Multimodal Documents, Palgrave Macmillan, London.
- Bateman (2014a) Bateman, J. A. (2014a), Text and Image: A Critical Introduction to the Visual/Verbal Divide, Routledge, London and New York.
- Bateman (2014b) Bateman, J. A. (2014b), Using multimodal corpora for empirical research, in C. Jewitt, ed., ‘The Routledge Handbook of Multimodal Analysis’, second edn, Routledge, London and New York, pp. 238–252.
- Bateman & Henschel (2007) Bateman, J. A. & Henschel, R. (2007), Generating text, layout and diagrams appropriately for genre, in I. van der Sluis, M. Theune, E. Reiter & E. Krahmer, eds, ‘Proceedings of the Workshop on Multimodal Output Generation MOG 2007’, Centre for Telematics and Information Technology (CTIT), University of Twente, pp. 29–40.
- Bateman et al. (2001) Bateman, J. A., Kamps, T., Reichenberger, K. & Kleinz, J. (2001), ‘Towards constructive text, diagram, and layout generation for information presentation’, Computational Linguistics 27(3), 409–449.
- Bateman & Wildfeuer (2014) Bateman, J. A. & Wildfeuer, J. (2014), ‘Defining units of analysis for the systematic analysis of comics: A discourse-based approach’, Studies in Comics 5(2), 373–403.
- Bateman et al. (2017) Bateman, J. A., Wildfeuer, J. & Hiippala, T. (2017), Multimodality: Foundations, Research and Analysis – A Problem-Oriented Introduction, De Gruyter Mouton, Berlin.
- Bradski & Kaehler (2013) Bradski, G. & Kaehler, A. (2013), Learning OpenCV: Computer Vision in C++ with the OpenCV Library, 2 edn, O’Reilly, Sebastopol, CA.
-
Carberry et al. (2003)
Carberry, S., Elzer, S., Green, N., McCoy, K. & Chester, D.
(2003), Understanding information graphics:
A discourse-level problem, in ‘Proceedings of the Fourth SIGdial
Workshop of Discourse and Dialogue’.
https://www.aclweb.org/anthology/W03-2101 - Choi et al. (2018) Choi, J., Krishnamurthy, J., Kembhavi, A. & Farhadi, A. (2018), Structured set matching networks for one-shot part labeling, in ‘Proceedings of the 2018 IEEE/CVF Conference on Computer Vision and Pattern Recognition’, pp. 3627–3636.
- Das & Taboada (2018) Das, D. & Taboada, M. (2018), ‘RST Signalling Corpus: a corpus of signals of coherence relations’, Language Resources and Evaluation 52(1), 149–184.
- Engelhardt (2002) Engelhardt, Y. (2002), The Language of Graphics: A Framework for the Analysis of Syntax and Meaning in Maps, Charts and Diagrams, PhD thesis, Institute for Logic, Language and Computation, University of Amsterdam.
- Engelhardt & Richards (2018) Engelhardt, Y. & Richards, C. (2018), A framework for analyzing and designing diagrams and graphics, in P. Chapman, A. Moktefi, S. Perez-Kriz & F. Bellucci, eds, ‘Diagrams 2018: Diagrammatic Representation and Inference’, Vol. 10871 of Lecture Notes in Computer Science, Springer, pp. 201–209.
- Fleiss (1971) Fleiss, J. L. (1971), ‘Measuring nominal scale agreement among many raters’, Psychological Bulletin 76(5), 378–382.
-
Gamer et al. (2019)
Gamer, M., Lemon, J., Fellows, I. & Singh, P. (2019), ‘irr: Various coefficients of interrater
reliability and agreement’.
R package version 0.84.1.
https://CRAN.R-project.org/package=irr - Grosz & Sidner (1986) Grosz, B. J. & Sidner, C. L. (1986), ‘Attention, intentions, and the structure of discourse’, Computational Linguistics 12(3), 175–204.
- Haehn et al. (2019) Haehn, D., Tompkin, J. & Pfister, H. (2019), ‘Evaluating ‘graphical perception’ with CNNs’, IEEE Transactions on Visualization and Computer Graphics 25(1), 641–650.
- Hagberg et al. (2008) Hagberg, A., Swart, P. & Schult, D. (2008), Exploring network structure, dynamics, and function using NetworkX, in ‘Proceedings of the 7th Python in Science Conference’, pp. 11–15.
- Hegarty & Just (1993) Hegarty, M. & Just, M. A. (1993), ‘Constructing mental models of machines from text and diagrams’, Journal of Memory and Language 32(6), 717–742.
- Hiippala (2013) Hiippala, T. (2013), ‘The interface between rhetoric and layout in multimodal artefacts’, Literary and Linguistic Computing 28(3), 461–471.
- Hiippala (2015) Hiippala, T. (2015), The Structure of Multimodal Documents: An Empirical Approach, Routledge, New York and London.
-
Hiippala & Bateman (2020)
Hiippala, T. & Bateman, J. A. (2020), ‘Introducing the diagrammatic mode’, arXiv
2001.11224.
https://arxiv.org/abs/2001.11224 - Hiippala & Orekhova (2018) Hiippala, T. & Orekhova, S. (2018), Enhancing the AI2 Diagrams dataset using Rhetorical Structure Theory, in ‘Proceedings of the Eleventh International Conference on Language Resources and Evaluation (LREC 2018)’, European Language Resources Association (ELRA), Paris, pp. 1925–1931.
- Holsanova et al. (2009) Holsanova, J., Holmberg, N. & Holmqvist, K. (2009), ‘Reading information graphics: the role of spatial contiguity and dual attentional guidance’, Applied Cognitive Psychology 23, 1215–1226.
- Hovy et al. (2013) Hovy, D., Berg-Kirkpatrick, T., Vaswani, A. & Hovy, E. (2013), Learning whom to trust with MACE, in ‘Proceedings of the 2013 Conference of the North American Chapter of the Association for Computational Linguistics: Human Language Technologies’, Association for Computational Linguistics, Atlanta, Georgia, pp. 1120–1130.
- Hunter (2007) Hunter, J. (2007), ‘matplotlib: A 2D graphics environment’, Computing in Science & Engineering 9(3), 90–95.
- Kembhavi et al. (2016) Kembhavi, A., Salvato, M., Kolve, E., Seo, M. J., Hajishirzi, H. & Farhadi, A. (2016), A diagram is worth a dozen images, in ‘Proceedings of the 14th European Conference on Computer Vision (ECCV 2016)’, Springer, Cham, pp. 235–251.
- Kim et al. (2019) Kim, D., Kim, S. & Kwak, N. (2019), Textbook question answering with multi-modal context graph understanding and self-supervised open-set comprehension, in ‘Proceedings of the 57th Annual Meeting of the Association for Computational Linguistics (ACL 2019)’, Association for Computational Linguistics, Florence, Italy, pp. 3568–3584.
- Kim et al. (2018) Kim, D., Yoo, Y., Kim, J., Lee, S. & Kwak, N. (2018), Dynamic graph generation network: Generating relational knowledge from diagrams, in ‘Proceedings of the 2018 IEEE/CVF Conference on Computer Vision and Pattern Recognition (CVPR 2018)’, pp. 4167–4175.
- Kovashka et al. (2016) Kovashka, A., Russakovsky, O., Fei-Fei, L. & Grauman, K. (2016), ‘Crowdsourcing in computer vision’, Foundations and Trends in Computer Graphics and Vision 10(3), 177–243.
- Krippendorff (2013) Krippendorff, K. (2013), Content Analysis: An Introduction to its Methodology, 3 edn, Sage, Thousand Oaks, CA.
- Mann & Thompson (1988) Mann, W. C. & Thompson, S. A. (1988), ‘Rhetorical Structure Theory: Toward a functional theory of text organization’, Text 8(3), 243–281.
- McInnes et al. (2018) McInnes, L., Healy, J., Saul, N. & Grossberger, L. (2018), ‘UMAP: Uniform manifold approximation and projection’, The Journal of Open Source Software 3(29), 861.
- McKinney (2010) McKinney, W. (2010), Data structures for statistical computing in Python, in S. van der Walt & J. Millman, eds, ‘Proceedings of the 9th Python in Science Conference’, pp. 51–56.
- Purchase (2014) Purchase, H. C. (2014), ‘Twelve year of diagrams research’, Journal of Visual Languages and Computing 25(2), 57–75.
-
R Core Team (2019)
R Core Team (2019), R: A Language
and Environment for Statistical Computing, R Foundation for Statistical
Computing, Vienna, Austria.
https://www.R-project.org/ - Randolph (2005) Randolph, J. J. (2005), Free-marginal multirater kappa (multirater free): an alternative to fleiss’ fixed-marginal multirater kappa, in ‘Proceedings of the Joensuu Learning and Instruction Symposium’.
- Reidsma & Carletta (2007) Reidsma, D. & Carletta, J. (2007), ‘Reliability measurement without limits’, Computational Linguistics 34(3), 319–326.
- Riezler (2014) Riezler, S. (2014), ‘On the problem of theoretical terms in empirical computational linguistics’, Computational Linguistics 40(1), 235–245.
- Sachan et al. (2019) Sachan, M., Dubey, A., Hovy, E. H., Mitchell, T. M., Roth, D. & Xing, E. P. (2019), ‘Discourse in multimedia: A case study in extracting geometry knowledge from textbooks’, Computational Linguistics .
- Sachan et al. (2018) Sachan, M., Dubey, K. A., Mitchell, T. M., Roth, D. & Xing, E. P. (2018), Learning pipelines with limited data and domain knowledge: A study in parsing physics problems, in ‘Proceedings of the 32nd Conference on Neural Information Processing Systems (NeurIPS 2018)’.
- Seabold & Perktold (2010) Seabold, S. & Perktold, J. (2010), Statsmodels: Econometric and statistical modeling with Python, in ‘9th Python in Science Conference’, pp. 57–61.
- Seo et al. (2015) Seo, M., Hajishirzi, H., Farhadi, A., Etzioni, O. & Malcolm, C. (2015), Solving geometry problems: Combining text and diagram interpretation, in ‘Proceedings of the 2015 Conference on Empirical Methods in Natural Language Processing (EMNLP 2015)’, Association for Computational Linguistics, Lisbon, Portugal, pp. 1466–1476.
- Taboada & Habel (2013) Taboada, M. & Habel, C. (2013), ‘Rhetorical relations in multimodal documents’, Discourse Studies 15(1), 65–89.
- Taboada & Mann (2006) Taboada, M. & Mann, W. C. (2006), ‘Rhetorical Structure Theory: looking back and moving ahead’, Discourse Studies 8(3), 423–459.
- Thomas (2009) Thomas, M. (2009), Localizing pack messages: A framework for corpus-based cross-cultural multimodal analysis, PhD thesis, University of Leeds.
- Thomas (2014) Thomas, M. (2014), ‘Evidence and circularity in multimodal discourse analysis’, Visual Communication 13(2), 163–189.
- Tippett (2016) Tippett, C. D. (2016), ‘What recent research on diagrams suggests about learning with rather than learning from visual representations in science’, International Journal of Science Education 38(5), 725–746.
- Tversky (2015) Tversky, B. (2015), ‘The cognitive design of tools of thought’, Review of Philosophy and Psychology 6(1), 99–116.
- Tversky (2017) Tversky, B. (2017), Diagrams: cognitive foundations for design, in A. Black, P. Luna, O. Lund & S. Walker, eds, ‘Information Design: Research and Practice’, Routledge, London, pp. 349–360.
- Tversky et al. (2000) Tversky, B., Zacks, J., Lee, P. & Heiser, J. (2000), Lines, blobs, crosses and arrows: Diagrammatic communication with schematic figures, in ‘Diagrams 2000: Theory and Application of Diagrams’, Springer, Berlin, pp. 221–230.
- Waller (2012) Waller, R. H. W. (2012), ‘Graphic literacies for a digital age: The survival of layout’, The Information Society 28(4), 236–252.
- Wan et al. (2019) Wan, S., Kutschbach, T., Lüdeling, A. & Stede, M. (2019), RST-Tace: A tool for automatic comparison and evaluation of RST trees, in ‘Proceedings of the Workshop on Discourse Relation Parsing and Treebanking 2019’, Association for Computational Linguistics, Minneapolis, MN, pp. 88–96.
- Ware (2012) Ware, C. (2012), Information Visualization: Perception for Design, third edn, Elsevier, Amsterdam.
- Watanabe & Nagao (1998) Watanabe, Y. & Nagao, M. (1998), Diagram understanding using integration of layout information and textual information, in ‘Proceedings of the 36th Annual Meeting of the Association for Computational Linguistics and 17th International Conference on Computational Linguistics (ACL’98/COLING’98)’, Association for Computational Linguistics, Montreal, Quebec, Canada, pp. 1374–1380.
- Wildfeuer et al. (2020) Wildfeuer, J., Pflaeging, J., Bateman, J. A., Seizov, O. & Tseng, C., eds (2020), Multimodality: Disciplinary Thoughts and the Challenge of Diversity, De Gruyter, Berlin, Munich and Boston.
- Wolf & Gibson (2005) Wolf, F. & Gibson, E. (2005), ‘Representing discourse coherence: a corpus-based study’, Computational Linguistics 31(2), 249–288.
-
Wu et al. (2019)
Wu, Z., Pan, S., Chen, F., Long, G., Zhang, C. & Yu, P. S.
(2019), ‘A comprehensive survey on graph
neural networks’, arXiv abs/1901.00596.
http://arxiv.org/abs/1901.00596 - Yung et al. (2019) Yung, F., Demberg, V. & Scholman, M. (2019), Crowdsourcing discourse relation annotations by a two-step connective insertion task, in ‘Proceedings of the 13th Linguistic Annotation Workshop’, Association for Computational Linguistics, Florence, Italy, pp. 16–25.