Strong Soft X-ray Excess in 2015 XMM-Newton Observation of BL–Lac OJ 287
Abstract
We report a strong soft X-ray excess in the BL–Lacartae -ray blazar OJ 287 during the long exposure in May 2015, amongst two of the latest XMM-Newton observations performed in May 2015 and 2018. In case of May 2015 observation, a logparabola model fits the EPIC-pn data well while a logparabola plus powerlaw describes the overall simultaneous optical to X-ray spectra, suggesting the excess as the synchrotron tail. This interpretation, however, is inconsistent with the observed spectral break between near-infrared and optical spectra, attributed to standard disk around a supermassive black hole (SMBH). Based on this, we considered two commonly invoked accretion disk based models in AGNs to explain the soft excess: the cool Comptonization component in the accretion disk and the blurred reflection from the partially ionized accretion disk. We found that both cool Comptonization and blurred reflection models provide equally good fit to the data and favor a super-heavy SMBH of mass . Further investigation of about a month long simultaneous X-ray and UV pointing observations revealed a delayed UV emission with respect to the 1.5-10 keV band, favoring X-ray reprocessing phenomenon as the dominant mechanism. The results suggest that the soft excess is probably caused by strong light bending close to the SMBH. The detected soft excess in 2015 data and its disappearance in 2018 data is also consistent with the presence of accretion disk emission, inferred from the NIR-optical spectral break between May 2013 to March 2016.
1 Introduction
OJ 287 is one of the most luminous and rapidly variable BL-Lacartae objects (BLLs) at radio to optical frequencies (Sitko & Junkkarinen, 1985; Stickel et al., 1989). It is also one of the most extensively studied extra-galactic active galactic nuclei (AGNs) over the entire electromagnetic spectrum from radio to -rays (Visvanathan & Elliot, 1973; Hudec et al., 2013; Valtonen et al., 2016; Gupta et al., 2017; Britzen et al., 2018; Goyal et al., 2018; Kushwaha et al., 2018a, b; Kapanadze et al., 2018, and references therein). Apart from the typical stochastic variability of blazars and favorable observational properties like high radio and optical brightness, the most prominent features responsible for making the source famous is the presence of a recurrent regular optical outbursts every -yr (Sillanpaa et al., 1988, 1996a) and its double-peaked structure (Sillanpaa et al., 1996b).
Two interpretations have been suggested in the literature for the regular optical outbursts. One class of models attribute the quasi-periodic outbursts to the interaction dynamics of accretion disk and SMBHs (Sillanpaa et al., 1988; Lehto & Valtonen, 1996) in a binary SMBH system while the other class of models attributes it to the Doppler boosted jet emission as a consequence of geometrical alignment of precessing single (Britzen et al., 2018, and references therein) or double relativistic jets (Qian, 2018, and references therein). The very first model by Sillanpaa et al. (1988) explained the periodicity to increased accretion flow due to tidal disturbances induced by the secondary SMBH in the accretion disk of primary SMBH. The model was modified after the observation of sharp rise during the 1994 and 1996 outbursts by Lehto & Valtonen (1996) who attributed the periodicity and double-peaked structure as the impact of secondary SMBH on the primary accretion disk. The disk-impact binary SMBH model has been fairly successful in predicting the timing of the double-peaked 12-yr quasi-periodic outbursts (Valtonen et al., 2016; Hudec et al., 2013). It attributes the flare emission to thermal bremsstrahlung of the hot gas torn off during the impact and constrains the SMBH masses to and for the primary and secondary SMBHs, respectively (Valtonen et al., 2012, 2016). The geometrical class of models, on the other hand, argue a total system mass in the range of a few times (Shi et al., 2007; Britzen et al., 2018; Qian, 2018, and references therein).
From the shape of the broadband energy spectra, it is known that that OJ 287 is a low-peaked BLL with the peak of the low-energy hump, attributed to synchrotron emission from the jet, at near-infrared (NIR) energies. The high-energy hump in the X-ray to -ray band normally peaks at MeV (Abdo et al., 2010; Kushwaha et al., 2013). The synchrotron-self Compton (SSC) mechanism successfully describes it typical X-ray emission while -ray emission is shown to be due to the inverse Comptonization of a 250 K ( eV) torus photon field (EC-IR Kushwaha et al., 2013), contrary to the generally believed SSC origin of high-energy hump in BLLs. However, during its latest multi-wavelength activity from December 2015 - 2017, OJ 287 exhibited a hardened MeV-GeV emission, showing a clear shift in the peak of the high-energy hump to GeV energies (Kushwaha et al., 2018a, b). At the same time, a spectral break between NIR-optical emission was also observed for the first-time as reported by Kushwaha et al. (2018a). The occurrence of NIR-optical spectral break was traced back to May 2013 (MJD 57439) and continued since then till March 2016. They further showed that the observed MeV-GeV spectral change can be naturally reproduced by external Comptonization but this time by IC of broad line region photons (Kushwaha et al., 2018a) which have been detected during the previous cycles of 12-yr optical outbursts (Nilsson et al., 2010). The NIR-optical spectral break is most naturally explained by the sandard disk emission of a SMBH. Interestingly, its first appearance in May 2013 (MJD 56439; Kushwaha et al., 2018a, 2019) is very close to the impact time predicted in the disk-impact binary SMBH model (Lehto & Valtonen, 1996) in the BH frame. This spectral and temporal coincidence currently tilts the central engine debate in the favor of disk-impact binary SMBH model.
Survey of literature records show that OJ 287 has exhibited the most dramatic spectral variations in X-ray energy band. The reported spectral shapes cover all the possible energy-spectral profiles, from a powerlaw – the typical X-ray spectrum of OJ 287 (Seta et al., 2009; Abdo et al., 2010; Kushwaha et al., 2013) to flat ones, (e.g. Siejkowski & Wierzcholska, 2017; Kushwaha et al., 2018b), extremely soft spectra (e.g. Isobe et al., 2001; Kushwaha et al., 2018b) as well as a mixture of these (e.g. Isobe et al., 2001; Valtonen et al., 2012; Kushwaha et al., 2018a). As already mentioned, the typical powerlaw X-ray energy-spectra are successfully described by SSC emission (Seta et al., 2009; Kushwaha et al., 2013) while the flat and mix spectra (typical+soft) have been argued to be as a result of mixture of synchrotron and the SSC emission (Isobe et al., 2001; Siejkowski & Wierzcholska, 2017) in one interpretation. The other possibility, argued but not yet studied, is an additional spectral component like Bethe-Heitler emission. The extremely soft X-ray spectra observed during the 2016-2017 activity is shown to be a new, additional high-frequency-peaked BLL (HBL) emission component by Kushwaha et al. (2018b), thanks to the coordinated MW follow-ups. In light of this, the extremely soft X-ray spectra (Isobe et al., 2001) which have been observed earlier as well could be the HBL component. Interestingly, within the limit of available records, strongly soft X-ray spectra seem to be a common feature of the source, present for a few years around the -yr quasi-periodic optical outbursts.
In this work, we perform spectral study of the 2015 and 2018 XMM-Newton observations of OJ 287, supplementing with multiple Swift XRT/UVOT observations to explore the soft X-ray excess in the 2015 XMM-Newton data. In the next section, we present details of observation and data reduction. §3 presents the systematic spectral analysis of data and results. In section 4, we report our discussion and conclusions. We used the cosmological parameters , and 111http://www.kempner.net/cosmic.php to calculate the distance.
2 Observation and data reduction
OJ 287 has been observed multiple times by XMM-Newton observatory, mainly around the 12-yr quasi-periodic optical outbursts. Some of the previous observations have been studied in detail by various authors (Gaur et al., 2018; Gupta et al., 2016). The latest observation with 28 ks and the longest exposure ( ks) of this object were performed in May 2018 (MJD=58149-58150) and May 2015 (MJD=57149-57150), respectively. The European Photon Imaging Camera (EPIC)-pn (Turner et al., 2001) was operated in the prime large window mode with the thin filter during both the observations. We also used Swift XRT/UVOT observations from MJD=57140.4 to MJD=57173.6. This period includes the May 2015 XMM-Newton observation.
We followed the standard reduction procedure using the XMM-Newton Science Analysis System (SAS v15.0) (Gabriel et al., 2004) with latest calibration files. First, we reprocessed the EPIC-pn data using epproc and obtained event files. We removed the intervals affected by flaring particle background by examining light curves above to get events file. We used single and double events (PATTERN ) for the EPIC-pn, and omitted events at the CCD edges and bad pixels (FLAG=0). We extracted the source spectrum using a circular region of 50 arcsec, centered at the source. We also obtained a background spectrum from a circular region of the same size away from the source and free from any sources. The resulted net exposures were found to be 53 ks and 19 ks for the 2015 and 2018 observations, respectively. The net count rates in 2-10 keV band were observed to be and counts for the 2015 and 2018 data sets, respectively. We also examined the pileup very carefully using epatplot. We did not find any significant pileup which might affect our analysis. Finally, we generated response matrix and ancillary response files at the source position using the tools rmfgen and arfgen, respectively. We grouped the data using the SAS task specgroup with an oversampling of and minimum counts of per bin.
For the reduction of Swift XRT and UVOT data, we followed the steps described in Pal & Naik (2018). We selected background annular region from 10 arcsec to 20 arcsec centered at the source coordinates. We also omitted the data points from bad patches of the CCD in case of UVOT observations.
3 Data analysis
3.1 Spectral analysis
3.1.1 X-ray ray emission
We used XSPEC v12.10.1 (Arnaud, 1996) to analyze the X-ray spectra of OJ 287 and used the statistics for the model fitting. Unless stated otherwise, the errors on the best-fit parameters are quoted at 90% confidence level, corressponding to =2.706.
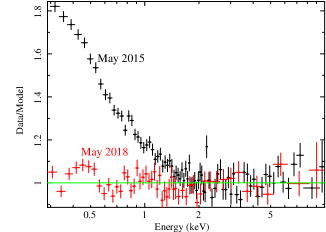
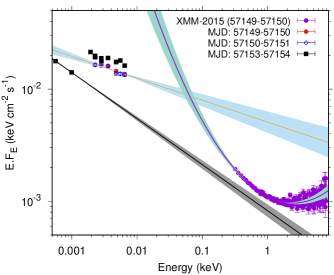
We considered only EPIC-pn data due to its high signal to noise ratio compared to the EPIC-MOS. We began by fitting the 2-10 keV band with an absorbed powerlaw (tbabspowerlaw) model. We fixed the absorption column to the Galactic value of (Dickey & Lockman, 1990). This resulted in a of 157.8/116 and 93.2/97 for the May 2015 and 2018 data respectively, where stands for the degree of freedom. The best-fit power-law photon index was found to be and for the two data sets. Thus, both the data sets represent a different spectral state of the source. We then extrapolated the best-fit model down to 0.3 keV for both the observations as shown in Fig. 1. Surprisingly, the May 2015 data revealed a strong soft X-ray excess, observed rarely in BLLs, but commonly observed in radio quite AGN such as the narrow-line Seyfert type 1 (NLS1)(Leighly, 1999; Crummy et al., 2006; Gierliński & Done, 2004). To investigate this, we then systematically fitted the whole range (0.3–10 keV) with possible phenomenological models, starting first with log-parabola (logpar) and broken power-law emission (bknpower) and then additionally thermal bremsstrahlung (bremss) as per claims in the literature (Valtonen et al., 2016) and finally the two AGNs models: cool Comptonization (Done et al., 2012, :optxagn) and blurred reflection (Dauser et al., 2013; Miniutti & Fabian, 2004, : i.e. relxill).
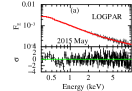
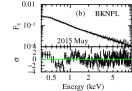
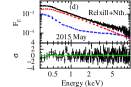
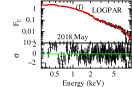
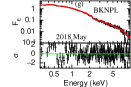
A simple powerlaw model fit to the 2015 data over 0.3–10 keV band resulted in a poor fit () due to the presence of the strong soft excess. Since this AGN is a blazar, the X-ray emission may be described phenomenologically by logpar and bknpower, independently. Fitting tbabslogpar over 0.3–10 keV band resulted in while tbabsbknpower fit resulted in . The best-fit parameters for both models are listed in Table 1 and the corresponding data, model, and residuals (in ) are shown in Fig. 2 (a) and 2 (b). The logpar fit describes the data fairly well, however, it is not consistent with the broadband emission of the source (see §4 and Fig. 5).
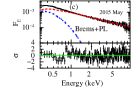
Another claim is thermal bremsstrahlung radiation (Valtonen et al., 2016) from a K gas (Valtonen et al., 2012) around the expected 12-yr quasi-periodic optical outbursts. This temperature corresponds to 25 eV and is irrelevant for the observed soft X-ray excess. Nonetheless, we, additionally explored a redshifted zbremss model along with the above considered models. This model has three parameters–plasma temperature, normalization, and the source redshift. We allowed plasma temperature and its normalization to vary. The fit resulted in . The best-fitting parameters are listed in Table 1 while the plots are shown in top and bottom panels of Fig. 2 (c). During model fitting, we found an statistically acceptable fit with a 25 keV plasma temperature. However, this temperature is too high, dominating the high energy end of the X-ray and is contrary to the general behavior of blazars.
Since an accretion disk emission has been claimed for the NIR-optical spectral break in a systematic analysis by Kushwaha et al. (2018b), we invoked disk-based soft excess models used to explain the soft X-ray excess normally seen in Seyfert type 1 AGN (Crummy et al., 2006; Gierliński & Done, 2004; Done et al., 2012). Though the origin is still unclear, two competing models – blurred reflection and cool Comptonization have been most acceptable. Thus, to a simple absorbed powerlaw model we added a reflection model relxill which is a combination of xillver (García et al., 2011, 2013) and relline (Dauser et al., 2010, 2013). This model calculates the reflected emission at each angle at each radius of the accretion disc (García et al., 2014). The details of parameters of relxill and its different application forms are described briefly on the webpage document222http://www.sternwarte.uni-erlangen.de/~dauser/research/relxill/.
The applied form of relxill assumes that the X-ray source illuminates the accretion disc in a lamppost geometry (Miniutti & Fabian, 2004). The illumination is described as a broken emissivity law which has the form between and ; between and ; where is the radius of the accretion disk, , and are inner and outer emissivity indices; , , and are the inner, break and outer radii of the accretion disk. The other parameters are spin (), inclination angle (), iron abundance relative to solar abundance, illuminating power–law index (), high energy cutoff (), ionization parameter ( with being the source X-ray luminosity and is the hydrogen number density of the disk material) and reflected fraction denoted by . We fixed the iron abundance to 1, the inclination to 3∘, high energy cutoff to 300keV and outer radius to . We tied the relxill photon index to powerlaw photon index and hence the parameter was fixed to under the lamppost scenario. We allowed the rest of the parameters and the fit with tbabs(relxill+powerlaw) model resulted in . To be more realistic, we replaced the phenomenological powerlaw model by nthcomp (Zdziarski et al., 1996; Życki et al., 1999) which can correctly predict the low energy rollover where Galactic absorption can modify the spectrum. We fixed the seed photon temperature at 2 eV and electron temperature associated with X-ray corona to 100 keV. The fit resulted in with results listed in Table 1 and corresponding plots in the top and bottom panels of Fig. 2 (d), respectively.
| Model component | 2015 May | 2018 May |
|---|---|---|
| () | 3.04 (f) | 3.04 (f) |
| Logpar | ||
| slope () | ||
| curv. term () | ||
| Norm.(LP) () | ||
| Stat. () | 202.8/159 | 168.9/138 |
| Bknpower | ||
| Photon index () | ||
| Photon index () | ||
| (keV) | ||
| Norm.(BPL)() | ||
| Stat. () | 234.6/158 | 167.3/137 |
| PL+bremss | ||
| Photon index | ||
| Norm. (nth) () | ||
| plasma temp. () | ||
| Norm. (brem) () | ||
| Stat. () | 211.8/159 | 168.9/137 |
| fE () | ||
| fE () | 2.5 | |
| Nth.+Relxill | ||
| Photon index () | ||
| Norm.(nth) () | ||
| Index1 () | (f) | |
| Index2 () | (f) | |
| Photon index () | (t) | (t) |
| log() | ||
| Inner radius () | ||
| Break radius () | (t) | |
| Spin () | ||
| Norm.(refl) () | ||
| Stat. () | 184.7/154 | 162.3/135 |
| fE () | ||
| fE () | 2.66 | 2.5 |
| optxagnf | ||
| Acc. rate () | ||
| Spin () | ||
| Coronal radius () | ||
| Plasma temp. ( | ||
| Optical depth () | ||
| Frac. power () | ||
| Photon index () | ||
| Stat. () | 188.9/155 | 168.1/134 |
| fE | ||
| fE () | 2.66 | 2.5 |

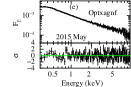
The other widely argued scenario of AGNs soft X-ray excess attributes it to a different plasma embedded in the interior region of the accretion disk. As argued by Done et al. (2012) the gravitational potential energy is released at each point of the accretion disk as a blackbody emission down to Rcorona. Below this radius, the gravitational potential energy is no longer completely thermalized. The energy is distributed into two types of plasma– an optically thick () cool plasma (kTe0.2 keV) for soft X-ray excess emission and an optically thin () hot plasma (kTe 100 keV) emitting power–law continuum above 2 keV. Thus, to the powerlaw, we added optxagnf model which incorporates the above mention scenario. The important parameters of the model are – accretion rate relative to the Eddington rate L/LEdd, mass of the BH MBH and its spin , source luminosity distance DL, cool plasma temperature kTkeV, optical depth of cool plasma, photon index of power-law continuum , power fraction of power-law continuum fpl and Rcorona. We fixed the MBH at (Valtonen et al., 2016; Kushwaha et al., 2018a), DL at 1677 Mpc, f as the power–law component accounts for the hot Comptonizing component and we fixed the normalization to unity to get proper flux and luminosity for the source. We tied the power-law photon index to the photon index of the optxagnf model. Rest of the parameters were allowed to vary. The fit resulted in . Further, since optxagnf can describe hard X-ray power-law continuum, we varied the parameter fpl after removing analytical powerlaw model. This resulted in with best-fit model parameters listed in Table 1 and the plot in the top and bottom panels of Fig. 2 (e), respectively. Additionally, as per other the claims of geometrical models, we also tested MBH of . However, it resulted in a super Eddington accretion rate of about 1.3 in Eddington units, contrary to the expectation of BLLs.
| Model component | Model 1 | Model 2 | |
|---|---|---|---|
| Reddening | Reddening | ||
| Photon index () | Photon index () | ||
| – | – | ||
| Norm.(nth) () | Acc. rate () | ||
| Index1 () | Coronal radius () | ||
| Index2 () | Plasma temp. ( | ||
| Photon index () | (t) | Optical depth () | |
| log() | Frac. power () | ||
| Inner radius () | – | – | |
| Spin () | Spin () | ||
| Break radius () | – | – | |
| Norm.(refl) () | – | ||
| (t) | – | – | |
| Norm.(disk) () | – | – | |
| Stat. () | 194/156 | Stat. () | 200.9/160 |
3.1.2 X-ray to UV/Optical Emission
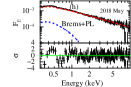
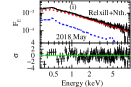
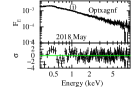
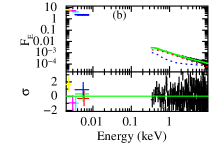
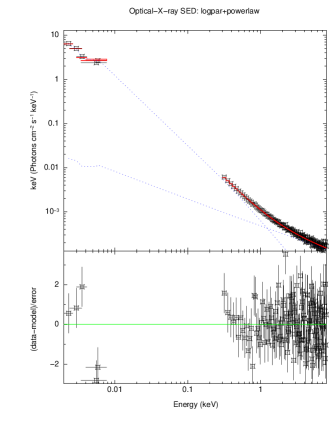
Statistically, log-parabolic emission (logpar), blurred reflection (relxill) and cool Comptonization (optxagnf) models describe the soft X-ray excess equally well. To distinguish between these models, we used the UVOT data from Swift UVOT (MJD=57149-57150) snapshots, observed simultaneously with the 2015 XMM-Newton observation. The extrapolation of best-fitting log-parabolic model of X-rays showed strong residuals in UV/optical band. Having corrected from reddening due to our Galaxy and intrinsic to the source, we added zbremss model to describe the thermal emission as claimed in studies. We found that the zbremss with logpar results in the worst statistic (see Fig. 3(a)). We then extrapolated the best-fit blurred reflection model to UVOT bands and found positive residuals in the low-energy bands. Since the reflection model does not include disk component required for optical-UV spectral break, we added diskbb model with the best-fitting parameters of blurred reflection model. We applied reddening correction due to our Galaxy and intrinsic to the source. We fitted the UV/Optical and X-ray bands jointly and the fit resulted in . Similarly, we also fitted the UV/Optical/X-ray bands using the disk Comptonization model optxagnf which includes the intrinsic disk emission. Having applied reddening correction, we modeled the full band and the fit resulted in . The best-fit model, data and residuals are shown in Fig. 3 (b) and 3 (c) with parameters in Table 2.
3.2 Timing Analysis
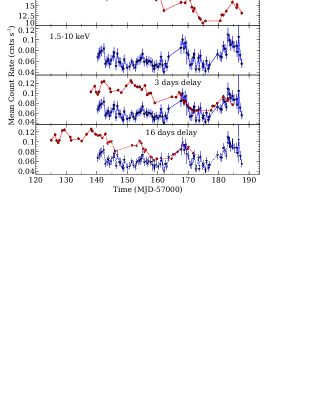
We examined the timing behavior of OJ 287 2015 May observation to look for lags between X-ray and UV emission. We first checked XMM-Newton UVW1 band vis-a-vis X-rays and did not find any lag between them, suggesting that UV may not be related to X-ray within day-long observation. In fact, only the optical data of the 2018 observation show a hint of marginal variability while rest is statistically consistent with no variability. We then used Swift -XRT and simultaneous UV observations taken in UVW1 band obtained on a cadence of about half a day during MJD=57140.4 to MJD=57187.0, as shown in the upper two panels of Fig. 4 (a). Observed light curves are highly variable and the UV band seems to lag behind the 1.5-10 keV X-rays around MJD=57170 and afterward. This could be due to reprocessing as on short time scales OJ 287 normally show simultaneous variability (Kushwaha et al., 2018a, 2013), but has shown lag when an additional competing emission component is present (Kushwaha et al., 2018b). In such cases, available light curves to date can not be used for the analysis due to jet dominated emission.
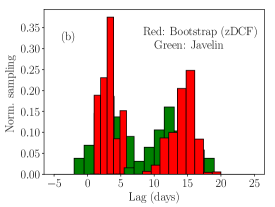
We used JAVELIN code (Zu et al., 2011) to estimate the lag following the procedures described in Pal & Naik (2018) and Pal et al. (2017). We found time-lag of -day and - day for UVW1 compared to X-rays (see Fig. 4 (b)). We cross-checked the lag results with the z-transformed discrete correlation function (zDCF: Alexander (2013)) applying the bootstrap technique (Peterson et al., 1998). In the bootstrap method, we extracted 10000 realizations of the two light curves from the observed light curve pair through Monte Carlo approach by randomizing fluxes and randomly selecting a subset after excluding 20% data points. We then performed cross-correlation on the extracted pairs using the zDCF method, as was done between the originally observed light curves. This approach is a model-independent way of accounting for the effects of flux uncertainties and irregular sampling on the cross-correlation result. The lag results from this are shown in Fig. 4 (b) and as can be seen clearly, the time-lag range agrees with the one found by the JAVELIN.
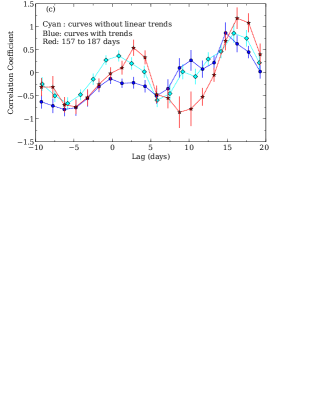
Within the limitations of data reported here, both the -day and -day lag values are supported by the light curves; shown by plotting a shifted UV light curve with respect to the X-ray in the bottom panels of Fig. 4 (a). Further cross-checking with simple Discrete Cross- Correlation (DCF; Edelson & Krolik (1988)), we noticed some discrepancies. The 3-day lag feature was missing when the full light curves were used ( top two panels of Fig. 4 (a)) but was recovered when the linear trends were removed from the light curves e.g., McHardy et al. (2014, 2018). The 3-day lag, however, remains if we consider data after MJD 57157 without even removing the linear trend from the light curves. These outcomes are shown in Fig. 4 (c).
In short, while both the lag values are supported by the data, the -day lag is consistently present in all the methods while the 3-day lag is recovered after eliminating the linear trend while performing DCF analysis. Unfortunately, gaps before and after the used light curves and also the sampling of available data do not allow any further analysis (e.g. significance estimate). Regardless however there is a clear indication of lag.
4 Discussion
We performed a spectral and temporal study of OJ 287 based on the 2015 and 2018 long XMM-Newton observations. Except for a marginal hint of variability in the 2018 XMM-Newton optical data, rest is statistically consistent with no variability within each observation ( mean error in the rate). Spectrally, however, the two observations represent a very different X-ray spectral state of the source. The 2018 X-ray spectrum shows the most generic spectral state of the source characterized by a powerlaw spectrum (Isobe et al., 2001; Seta et al., 2009; Kushwaha et al., 2013; Siejkowski & Wierzcholska, 2017) while the 2015 X-ray spectrum shows strong soft X-ray excess with respect to a powerlaw spectrum below 2.0 keV (figure 1, §3.1). To best of our knowledge, such (soft X-ray) excesses – the focus of our study here, has been reported only once in OJ 287 (Isobe et al., 2001). We systematically investigated the emission mechanisms behind the origin of this excess using models motivated from blazar and normal AGN studies.
4.1 Blazar based models
Blazars are known for variability in all the domains of observation. Spectral changes, as reported in this work, at the low-energy end of the X-ray emission can physically have multiple origins. In addition to the possibility of an altogether new emission component (e.g. Kushwaha et al., 2018a, b), in the general scheme of blazar emission scenario, an appropriate overlap of synchrotron and SSC component can mimic a variety of phenomenological spectral shapes. Literature records on OJ 287 show only one instance of a similar spectral state in the 1994 ASCA observation. A spectral study by Idesawa et al. (1997) reported a power-law photon spectral index of . However, a careful re-analysis by Isobe et al. (2001) found that a broken-powerlaw spectrum with a break at 2 keV describe the data statistically better. Further, the spectral index below 2 keV was consistent with the optical-UV spectrum and hence, they attributed the soft-excess to the “synchrotron soft tail”.
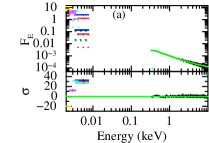
In the current case, we followed a flexible approach and systematically investigated by using with both the possible phenomenological spectral shapes – logparabola and broken-powerlaw models. This allows to capture additional contributions (e.g. Kushwaha et al., 2018b; Isobe et al., 2001). Of the two, we found that a logparabola model provides statistically acceptable description of the 2015 EPIC-pn data (ref. Table 1). A logparabola spectrum within blazar emission scenarios can simply arise from an appropriate combination of the high-energy end of a simple powerlaw synchrotron spectrum or its steeply declining part with the rising part of the SSC emission (ref. Fig. 5, bottom panel). A look at the NIR and optical SEDs around the 2015 observation, as shown in the top plot of Fig. 5, clearly show that the soft X-ray excess lies above the simple powerlaw extrapolation of the NIR data but below the optical-UV data points. Noting that in the most generic spectral state of OJ 287 the optical-UV data simply lies on a power-law (log-parabola) extension of NIR data, the SEDs around 2015 observations suggest two possibilities in the present context – CASE-A: synchrotron spectrum associated with NIR data points extending to X-rays with a powerlaw or steeply declining tail (Fig. 5 grey band). CASE-B: optical-UV being synchrotron with a smoothly declining tail causing the soft X-ray excess (Fig. 5 bottom plot). Below we systematically look into these two possibilities.
CASE-A:
In this case, the optical-UV data remains unexplained, suggesting additional broadband emission component. Attributing NIR-optical break to accretion disk emission as suggested in Kushwaha et al. (2018a), the combined emission still failed to reproduce the UV emission (see Fig. 6 in Kushwaha et al., 2018a, also Kushwaha et al. (2019)). Thus, though this interpretation could provide a viable explanation for soft X-ray excess, the UV data remain unexplained.
CASE-B
As shown in Fig. 5 bottom plot, this scenario successfully reproduces the optical/UV to soft X-ray emission by using logparabola model (logpar) when combined with a powerlaw representing the X-ray emission above the soft X-ray band. The combined logparabola plus powerlaw provide an acceptable fit to the data (). Furthermore, the resulting powerlaw index of 1.6 for X-ray emission is also consistent with the general X-ray spectra of the source. However, this fails to explain the two NIR data points unless the synchrotron peak of its broadband SED which normally peaks at NIR (KJ bands; e.g. Seta et al., 2009; Kushwaha et al., 2013) has shifted to optical energies, making NIR data to be part of spectrum before the peak of synchrotron emission. But NIR-optical SED comparison with 2009 SED does not support such shift (Fig. 2, Kushwaha et al., 2019). Further, even smoothing of the low-energy end to match one of the NIR data on the basis that low-energy hump peaks around NIR bands (e.g. Isobe et al., 2001; Kushwaha et al., 2013, 2018a) leaves the other NIR data points unexplained. It should further be noted that this is not a one odd observational data as the NIR-optical SED trend has been like this since May 2013 (MJD 54639) as reported by Kushwaha et al. (2018a). Thus, though phenomenologically logpar description is fine for X-rays, it is not consistent with the broadband emission characteristics of the source during this period, thereby suggesting some other emission components for the soft X-ray excess.
Another proposal in the literature is a dominant thermal bremsstrahlung emission for the 12-yr quasi-periodic optical outbursts from a thermal gas of temperature K (Valtonen et al., 2016, 2012). However, this temperature corresponds to 25 eV, too small to produce the observed excess in 0.1 – 2 keV (Fig. 3a). Considering this scenario and keeping the temperature free during the fit, we found an statistically acceptable fit with 25 keV plasma. However, this is unphysical as it dominates the high-energy end of the X-ray emission and is contradictory with previous studies and the general X-ray spectral profile of the source being a powerlaw. Combination of logparabola (for synchrotron and its high energy tail), thermal bremsstrahlung, and powerlaw (for SSC) to optical to X-ray data resulted in a very low plasma temperature ( eV), making the bremsstrahlung ineffective with resulting scenario similar to a powerlaw plus logparabola which, as argued above, are in tension with NIR-optical break.
4.2 Radio-quiet AGN/disk based models
The claim of NIR-optical break as accretion disk emission of a SMBH and its presence between May 2013 (MJD 56439) till May 2016 suggests disk-based soft X-ray excess origin as in radio-quiet AGN as potential candidates. We, therefore, investigated this possibility with two of the AGN disk dominant models: cool Comptonization (optxagn) and blurred reflection, argued for the soft X-ray excess often observed in Seyfert galaxies; e.g. Mrk 509 (Mehdipour et al., 2011), 1H 0707–495 (Fabian et al., 2009), II Zw 177 (Pal et al., 2016), ESO 113–G010 (Cackett et al., 2013). We found that both cool Comptonization and blurred reflection plus disk describes the data well (like the logparabola model) and are equally acceptable statistically (see Table 1 and §3).
In the cool Comptonization scenario, the best-fit suggests the observed soft excess is due to inverse Compton scattering of seed photons flux from the disk ( , see table 1) in the cool Comptonizing plasma (kT0.4 keV and 10 in this work). The derived accretion rate for observed soft X-ray excess was found to be 10% of Eddington unit. Such a high accretion rate for prominent soft X-ray excess has been seen in a number of radio-loud narrow line Seyfert type 1 (RLNLS1) AGNs i.e., 1H 0323342 (Ghosh et al., 2018). The temperature and optical depth of the cool plasma embedded in the inner region of the accretion disk are inferred to be keV and , respectively, for the soft X-ray excess in 2015 May observation. Such type of cool plasma has been found in RLNLS1 galaxies i.e., PMN J09480022: (D’Ammando et al., 2014). The flux observed for soft excess in the 0.3-2 keV band was found to be which is comparable to which is claimed in a RLNLS1 PMN J09480022. Thus, the BL-Lac object OJ 287 behaves like a radio loud narrow-line Seyfert galaxies in this particular observation.
Additionally, since SMBH mass is one of the parameter in the cool Comptoniozation scenario, we also checked it by fitting first a SMBH mass of , as suggested by NIR-optical break and also in the disk-impact binary SMBH model. This resulted in a accreting rate of in Eddington units. Fit with an SMBH mass of as argued by jet precession based models, on the other hand, resulted in a super Eddington accretion rate 1.3, contrary to the expectation for BL Lac objects. Thus, the model too supports a very massive SMBH mass as claimed in the binary SMBH and also from the NIR-optical spectral break. It should, however, be noted that central engine mass is not a true discriminator for the two classes of models suggested for -yr QPO as in the geometrical class of models the central engine mass is not connected directly with the model parameters and is inferred based on other observations, unlike the case of disk-impact binary SMBH model.
In case of X-ray reflection under the lamppost geometry, the blurred reflection is very intense and strong (ref. table 1) close to the inner edge of the accretion disk. The emissivity pattern is not uniform and it changes from inner radius to a break radius (inner emissivity index and outer emissivity index ). Thus, the strong soft excess is likely due to the strong light bending in the vicinity of the central SMBH. The best known proxy for the blurred reflection is the broad iron-K emission line near 6 keV (Tanaka et al., 1995). However, the Fe-K emission line is absent in the 2015 observation, and in fact never been detected in OJ 287 or any BLL to best of our knowledge. The fit suggests an intense smearing for blurred reflection, too strong for Fe-K emission line to be seen in the data (see blue dashed line for blurred reflection in Fig. 3(b)). In this scenario, a likely possibility is that the disk may be illuminated by the base of the jet (Pal et al., 2018; McHardy et al., 2014, 2018). We found clear indications of lagging of UVW1 band emission with respect to the hard X-ray emission ( and days, see Fig. 4). Such lags favor the X-ray reprocessing scenario at accretion disk and have been reported in many AGNs where UV is found to be lagging behind X-ray emission as expected in the reprocessing scenario (e.g., Buisson et al., 2017; Pal & Naik, 2018; McHardy et al., 2014, 2018). Additional support for this comes from the general variability trend of OJ 287 where multi-wavelength variations are normally simultaneous on short timescales (Kushwaha et al., 2018a, 2013) with lag reported only when an additional emission component was competing with its general emission (Kushwaha et al., 2018b).
The best-fit reflection+disk model in the optical/UV/X-ray bands suggests a inner disk temperature of 2 eV (ref. table 2). We used theoretical temperature profile (, where , , and are accretion rate in Eddington units, black hole mass in , Schwarzschild radius and disk radius from the centre, respectively) with the best-fit parameter to infer the temperature at the inner edge of the disk. This provided in a temperature of about 2.8 eV, similar to the one inferred from the X-ray/UV/optical modeling, further supporting the disk-impact binary SMBH scenario. Further, the normalization of multi-color blackbody model i.e. diskbb is a function of inner radius of the accretion disk and the luminosity distance along with the inclination of the source. Using inner radius , mass of the black hole , inclination degree and luminosity distance 1652.08 Mpc, we derived the normalization value to be . This is similar with the best-fit value listed in Table 2. Thus, both the observed inner disk temperature and the normalization are in agreement in support for the binary black hole system with a super heavy super massive black hole at the centre.
Both the AGN disk-based models suggest a maximally rotating SMBH, contrary to the tightly constrained spin value of claimed by Valtonen et al. (2016). We tested blurred reflection by fixing the spin parameter at 0.30 and the fit-statistic was marginally disfavored (1.5). This marginal change for a large change in the value of spin suggests that current data are not sufficient to constrain the spin and/or a detailed comparative study is required based on the theoretical premise of the model.
5 Summary and Conclusion
We performed spectral analysis of the two yet unstudied XMM-Newton observations of OJ 287 performed in 2015 and 2018 respectively. Temporally, both the data are statistically consistent with non-variable but are spectrally very different. We found that while the 2018 data represents the typical (most generic) X-ray spectral state of the source characterized by a powerlaw spectrum, the 2015 data show very strong soft X-ray excess. The excess lies above the simple power-law extrapolation of the NIR data points but below the best-fit power-law extrapolation of the optical-UV data points. We systematically explored the physical process behind the spectral shape vis-a-vis consistency with known/established observational properties of OJ 287 as listed below.
-
•
For the X-ray spectrum only, a simple log-parabola model describes the 2015 spectral state statistically well and can be generated with an appropriate overlap of synchrotron tail extended to X-ray energies and the SSC spectrum. However, this interpretation is in conflict with the quasi-simultaneous NIR to optical spectrum of the source.
-
•
Additionally adding a thermal bremsstrahlung emission from a plasma of temperature 25 keV with logparabola also provides an acceptable statistical fit to the X-ray data but is inconsistent with the optical spectrum as well as the general X-ray spectral properties of the source.
-
•
Accretion disk-based models: reflection and cool Comptonization (Table 1) with an intrinsic powerlaw component describes 2015 optical to X-ray spectrum statistically well and is consistent with the general spectral characteristics of OJ 287. Timing analysis indicates a lag of UV emission with respect to X-rays (§3.2), favoring reflection model. Additionally, these models also favor a heavy SMBH of mass for OJ 287, as has been argued by Sillanpaa et al. (1988) and Lehto & Valtonen (1996) in interpreting the 12-yr optical QPO in a binary SMBH framework.
Further, the appearance of the soft excess during 2015 and its absence in 2018 is consistent with the presence of accretion-disk signature (NIR-optical break) between May 2013 to November 2016. Based on these considerations, the soft X-ray excess and UV emission appear to be primarily a result of reflection phenomena.
6 Acknowledgement
Authors are grateful to acknowledge the anonymous referee for his/her thoughtful suggestions and comments which improved the manuscript. MP thanks the financial support of UGC, India program through DSKPDF fellowship (grant no. BSR/2017-2018/PH/0111). MP is also grateful for support of Prof. M. Sami at the Centre for Theoretical Physics, Jamia Millia Islamia, New Delhi. PK acknowledge funding from FAPESP (grant no. 2015/13933-0). This research has made use of archival data of XMM-Newton observatory, an ESA science mission directly funded by ESA Member States and NASA by the NASA Goddard Space Flight Center (GSFC). This research has also made use of the XRT Data Analysis Software (XRTDAS) developed under the responsibility of the ASI Science Data Center (ASDC), Italy.
References
- Abdo et al. (2010) Abdo, A. A., Ackermann, M., Agudo, I., et al. 2010, ApJ, 716, 30, doi: 10.1088/0004-637X/716/1/30
- Alexander (2013) Alexander, T. 2013, arXiv e-prints, arXiv:1302.1508. https://arxiv.org/abs/1302.1508
- Arnaud (1996) Arnaud, K. A. 1996, in Astronomical Society of the Pacific Conference Series, Vol. 101, Astronomical Data Analysis Software and Systems V, ed. G. H. Jacoby & J. Barnes, 17
- Britzen et al. (2018) Britzen, S., Fendt, C., Witzel, G., et al. 2018, MNRAS, 478, 3199, doi: 10.1093/mnras/sty1026
- Buisson et al. (2017) Buisson, D. J. K., Lohfink, A. M., Alston, W. N., & Fabian, A. C. 2017, MNRAS, 464, 3194, doi: 10.1093/mnras/stw2486
- Cackett et al. (2013) Cackett, E. M., Fabian, A. C., Zogbhi, A., et al. 2013, ApJ, 764, L9, doi: 10.1088/2041-8205/764/1/L9
- Crummy et al. (2006) Crummy, J., Fabian, A. C., Gallo, L., & Ross, R. R. 2006, MNRAS, 365, 1067, doi: 10.1111/j.1365-2966.2005.09844.x
- D’Ammando et al. (2014) D’Ammando, F., Larsson, J., Orienti, M., et al. 2014, MNRAS, 438, 3521, doi: 10.1093/mnras/stt2464
- Dauser et al. (2013) Dauser, T., Garcia, J., Wilms, J., et al. 2013, MNRAS, 430, 1694, doi: 10.1093/mnras/sts710
- Dauser et al. (2010) Dauser, T., Wilms, J., Reynolds, C. S., & Brenneman, L. W. 2010, MNRAS, 409, 1534, doi: 10.1111/j.1365-2966.2010.17393.x
- Dickey & Lockman (1990) Dickey, J. M., & Lockman, F. J. 1990, ARA&A, 28, 215, doi: 10.1146/annurev.aa.28.090190.001243
- Done et al. (2012) Done, C., Davis, S. W., Jin, C., Blaes, O., & Ward, M. 2012, MNRAS, 420, 1848, doi: 10.1111/j.1365-2966.2011.19779.x
- Edelson & Krolik (1988) Edelson, R. A., & Krolik, J. H. 1988, ApJ, 333, 646, doi: 10.1086/166773
- Fabian et al. (2009) Fabian, A. C., Zoghbi, A., Ross, R. R., et al. 2009, Nature, 459, 540, doi: 10.1038/nature08007
- Gabriel et al. (2004) Gabriel, C., Denby, M., Fyfe, D. J., et al. 2004, in Astronomical Society of the Pacific Conference Series, Vol. 314, Astronomical Data Analysis Software and Systems (ADASS) XIII, ed. F. Ochsenbein, M. G. Allen, & D. Egret, 759
- García et al. (2013) García, J., Dauser, T., Reynolds, C. S., et al. 2013, ApJ, 768, 146, doi: 10.1088/0004-637X/768/2/146
- García et al. (2011) García, J., Kallman, T. R., & Mushotzky, R. F. 2011, ApJ, 731, 131, doi: 10.1088/0004-637X/731/2/131
- García et al. (2014) García, J., Dauser, T., Lohfink, A., et al. 2014, ApJ, 782, 76, doi: 10.1088/0004-637X/782/2/76
- Gaur et al. (2018) Gaur, H., Mohan, P., Wierzcholska, A., & Gu, M. 2018, MNRAS, 473, 3638, doi: 10.1093/mnras/stx2553
- Ghosh et al. (2018) Ghosh, R., Dewangan, G. C., Mallick, L., & Raychaudhuri, B. 2018, MNRAS, 479, 2464, doi: 10.1093/mnras/sty1571
- Gierliński & Done (2004) Gierliński, M., & Done, C. 2004, MNRAS, 349, L7, doi: 10.1111/j.1365-2966.2004.07687.x
- Goyal et al. (2018) Goyal, A., Stawarz, Ł., Zola, S., et al. 2018, ApJ, 863, 175, doi: 10.3847/1538-4357/aad2de
- Gupta et al. (2016) Gupta, A. C., Kalita, N., Gaur, H., & Duorah, K. 2016, MNRAS, 462, 1508, doi: 10.1093/mnras/stw1667
- Gupta et al. (2017) Gupta, A. C., Agarwal, A., Mishra, A., et al. 2017, MNRAS, 465, 4423, doi: 10.1093/mnras/stw3045
- Hudec et al. (2013) Hudec, R., Bašta, M., Pihajoki, P., & Valtonen, M. 2013, A&A, 559, A20, doi: 10.1051/0004-6361/201219323
- Idesawa et al. (1997) Idesawa, E., Tashiro, M., Makishima, K., et al. 1997, PASJ, 49, 631, doi: 10.1093/pasj/49.6.631
- Isobe et al. (2001) Isobe, N., Tashiro, M., Sugiho, M., & Makishima, K. 2001, PASJ, 53, 79, doi: 10.1093/pasj/53.1.79
- Kapanadze et al. (2018) Kapanadze, B., Vercellone, S., Romano, P., et al. 2018, MNRAS, 480, 407, doi: 10.1093/mnras/sty1803
- Kushwaha et al. (2019) Kushwaha, P., de Gouveia Dal Pino, E. M., Gupta, A. C., & Wiita, P. J. 2019, in Proceeding of Science, Vol. 329, PoS(BHCB2018), 22, doi: 10.22323/1.329.0022
- Kushwaha et al. (2013) Kushwaha, P., Sahayanathan, S., & Singh, K. P. 2013, MNRAS, 433, 2380, doi: 10.1093/mnras/stt904
- Kushwaha et al. (2018a) Kushwaha, P., Gupta, A. C., Wiita, P. J., et al. 2018a, MNRAS, 473, 1145, doi: 10.1093/mnras/stx2394
- Kushwaha et al. (2018b) —. 2018b, MNRAS, 479, 1672, doi: 10.1093/mnras/sty1499
- Lehto & Valtonen (1996) Lehto, H. J., & Valtonen, M. J. 1996, ApJ, 460, 207, doi: 10.1086/176962
- Leighly (1999) Leighly, K. M. 1999, ApJS, 125, 317, doi: 10.1086/313287
- McHardy et al. (2014) McHardy, I. M., Cameron, D. T., Dwelly, T., et al. 2014, MNRAS, 444, 1469, doi: 10.1093/mnras/stu1636
- McHardy et al. (2018) McHardy, I. M., Connolly, S. D., Horne, K., et al. 2018, MNRAS, 480, 2881, doi: 10.1093/mnras/sty1983
- Mehdipour et al. (2011) Mehdipour, M., Branduardi-Raymont, G., Kaastra, J. S., et al. 2011, A&A, 534, A39, doi: 10.1051/0004-6361/201116875
- Miniutti & Fabian (2004) Miniutti, G., & Fabian, A. C. 2004, MNRAS, 349, 1435, doi: 10.1111/j.1365-2966.2004.07611.x
- Nilsson et al. (2010) Nilsson, K., Takalo, L. O., Lehto, H. J., & Sillanpää, A. 2010, A&A, 516, A60, doi: 10.1051/0004-6361/201014198
- Pal et al. (2017) Pal, M., Dewangan, G. C., Connolly, S. D., & Misra, R. 2017, MNRAS, 466, 1777, doi: 10.1093/mnras/stw3173
- Pal et al. (2018) Pal, M., Dewangan, G. C., Kembhavi, A. K., Misra, R., & Naik, S. 2018, MNRAS, 473, 3584, doi: 10.1093/mnras/stx2608
- Pal et al. (2016) Pal, M., Dewangan, G. C., Misra, R., & Pawar, P. K. 2016, MNRAS, 457, 875, doi: 10.1093/mnras/stw009
- Pal & Naik (2018) Pal, M., & Naik, S. 2018, MNRAS, 474, 5351, doi: 10.1093/mnras/stx3103
- Peterson et al. (1998) Peterson, B. M., Wanders, I., Horne, K., et al. 1998, PASP, 110, 660, doi: 10.1086/316177
- Qian (2018) Qian, S. 2018, arXiv e-prints, arXiv:1811.11514. https://arxiv.org/abs/1811.11514
- Seta et al. (2009) Seta, H., Isobe, N., Tashiro, M. S., et al. 2009, Publications of the Astronomical Society of Japan, 61, 1011, doi: 10.1093/pasj/61.5.1011
- Shi et al. (2007) Shi, W., Liu, X., & Song, H. 2007, Ap&SS, 310, 59, doi: 10.1007/s10509-007-9413-z
- Siejkowski & Wierzcholska (2017) Siejkowski, H., & Wierzcholska, A. 2017, MNRAS, 468, 426, doi: 10.1093/mnras/stx495
- Sillanpaa et al. (1988) Sillanpaa, A., Haarala, S., Valtonen, M. J., Sundelius, B., & Byrd, G. G. 1988, ApJ, 325, 628, doi: 10.1086/166033
- Sillanpaa et al. (1996a) Sillanpaa, A., Takalo, L. O., Pursimo, T., et al. 1996a, A&A, 305, L17
- Sillanpaa et al. (1996b) —. 1996b, A&A, 315, L13
- Sitko & Junkkarinen (1985) Sitko, M. L., & Junkkarinen, V. T. 1985, PASP, 97, 1158, doi: 10.1086/131679
- Stickel et al. (1989) Stickel, M., Fried, J. W., & Kuehr, H. 1989, A&AS, 80, 103
- Tanaka et al. (1995) Tanaka, Y., Nandra, K., Fabian, A. C., et al. 1995, Nature, 375, 659, doi: 10.1038/375659a0
- Turner et al. (2001) Turner, M. J. L., Abbey, A., Arnaud, M., et al. 2001, A&A, 365, L27, doi: 10.1051/0004-6361:20000087
- Valtonen et al. (2012) Valtonen, M. J., Ciprini, S., & Lehto, H. J. 2012, MNRAS, 427, 77, doi: 10.1111/j.1365-2966.2012.21861.x
- Valtonen et al. (2016) Valtonen, M. J., Zola, S., Ciprini, S., et al. 2016, ApJ, 819, L37, doi: 10.3847/2041-8205/819/2/L37
- Visvanathan & Elliot (1973) Visvanathan, N., & Elliot, J. L. 1973, ApJ, 179, 721, doi: 10.1086/151911
- Zdziarski et al. (1996) Zdziarski, A. A., Johnson, W. N., & Magdziarz, P. 1996, MNRAS, 283, 193
- Zu et al. (2011) Zu, Y., Kochanek, C. S., & Peterson, B. M. 2011, ApJ, 735, 80, doi: 10.1088/0004-637X/735/2/80
- Życki et al. (1999) Życki, P. T., Done, C., & Smith, D. A. 1999, MNRAS, 309, 561, doi: 10.1046/j.1365-8711.1999.02885.x