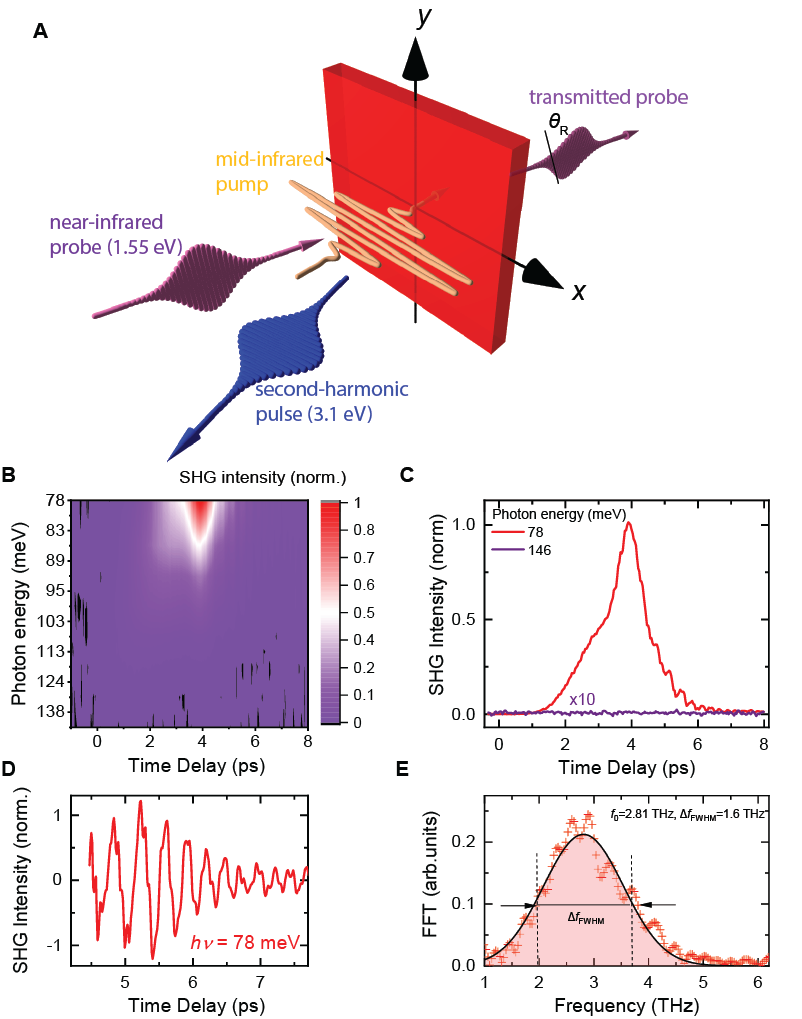
Light-driven ultrafast phonomagnetism
Abstract
Exciting atomic oscillations with light is a powerful technique to control the electronic properties of materials, leading to remarkable phenomena such as light-induced superconductivity and ultrafast insulator to metal transitions. Here we show that light-driven lattice vibrations can be utilised to encode efficiently spin information in a magnetic medium. Intense mid-infrared electric field pulses, tuned to resonance with a vibrational normal mode of antiferromagnetic DyFeO3, drive the emergence of long-living weak ferromagnetic order. Light-driven phonon displacements promptly lower the energy barrier separating competing magnetic states, allowing the alignment of spins to occur within a few picoseconds, via non-equilibrium dynamics of the magnetic energy landscape.
The ability to encode spin information with minimal energy dissipation is of great scientific and technological interest Wolf2001 . In magnetoelectric materials, controlling spins via strain and electric fields becomes viable, providing an energy-efficient route towards information recording Mundy2016 ; Manipatruni2018 ; Schlom2014 ; Spaldin2019 . Recently, selective excitation of elementary vibrations of the crystal lattice (phonons) by ultrashort pulses of light has emerged as a novel, low-energy route to control material properties, extending strain engineering to the ultrafast timescales Rini2007 ; Fausti2011 ; Mankowsky2014 ; Kubacka2014 ; Mitrano2016 ; Subedi2014 ; Knap2016 . Although pioneering experiments have demonstrated that driving optical phonons can affect magnetism Nova2017 ; Maehrlein2018 , no switching of the spin orientation and light-induced magnetic symmetry breaking has been shown so far. Ultrafast magnetic switching is a thriving field but its main focus until now has been the excitation of spin dynamics via electronic absorption Schlauderer2019 ; Stupakiewicz2017 . Here we investigate light-induced magnetism in dysprosium orthoferrite (DyFeO3), a magnetoelectric material with one of the strongest interactions between spins and the crystal lattice Tokunaga2008 ; Nakajima2015 . We show that a sub-ps pulse of an intense mid-infrared electric field, tuned to resonance with a phonon mode, drives a coherent spin-reorientation within a half-cycle of the spin precession, developing long-living weak ferromagnetic order. Light-induced magnetism emerges via a non-equilibrium metastable route, inaccessible via a thermodynamic transformation. We show that phonomagnetism originates from ultrafast lattice control of the anisotropic exchange interaction.
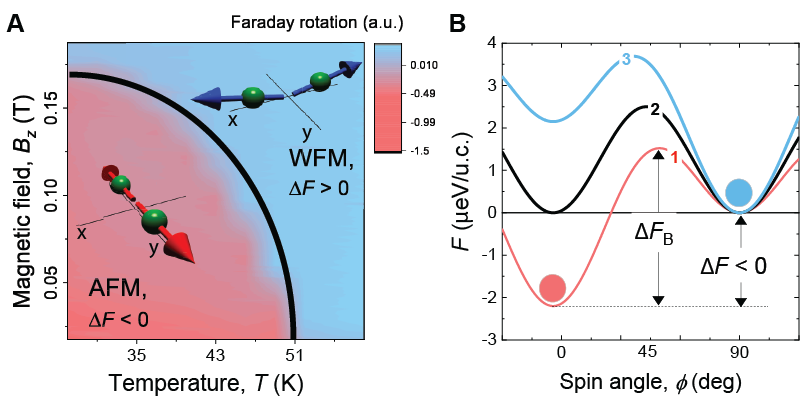
The magnetic insulator \ceDyFeO3 crystallizes in a perovskite orthorhombic structure and exhibits antiferromagnetic spin order set by the Fe-Fe isotropic and the Fe-Dy anisotropic exchange interactions Yamaguchi1974 . The anisotropic exchange results in the spin reorientation transition, in which the direction of the magnetic easy-axis for the iron spins changes between - and -crystal axis upon crossing the Morin point (=51 K) Afanasiev2015 . The reorientation is accompanied by a change in magnetic symmetry, from a purely antiferromagnetic state (AFM), to a weakly ferromagnetic state (WFM) characterized by the emergence of a net magnetization (supplementary text S2). The Morin transition in DyFeO3 is of the first-order and is heavily influenced by the nucleation processes resulting in a very narrow temperature hysteresis.
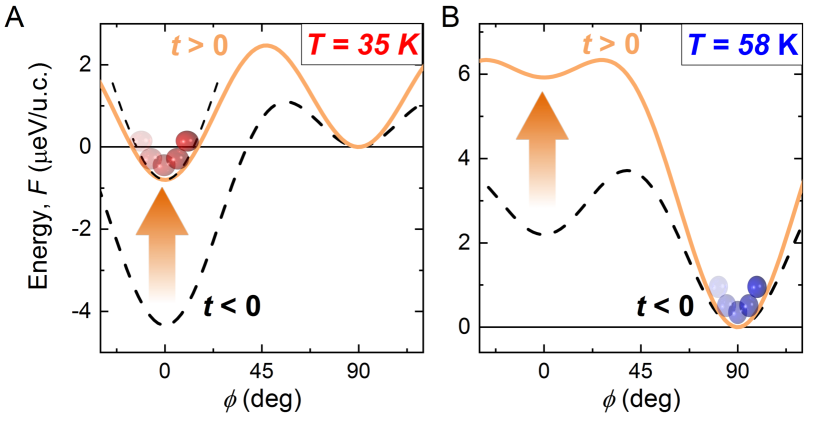
The spin-reorientation is described by the magnetic anisotropy energy which depends on the temperature and the angle the spins form with the -axis Zvezdin1979 . In a broad temperature range this potential features two characteristic minima at and (see Fig. 1) signaling two ordered states Afanasiev2016 . The height of the kinetic barrier separating the two competing states, as well as their relative energy, is controlled by the strength of the Fe-Dy exchange. This interaction is strongly sensitive to changes in the crystal environment, both via direct modulation of the Fe-Dy electronic overlap and changes in the orbital state of the rare-earth multiplet Khim2011 ; Baierl2016 . In our study, we consider light-induced oscillations of atoms driven far from their equilibrium positions to manipulate the magnetic energy landscape Mankowsky2016 ; Fechner2018 in order to realize the lattice control of the spin arrangement on the ultrafast timescale.
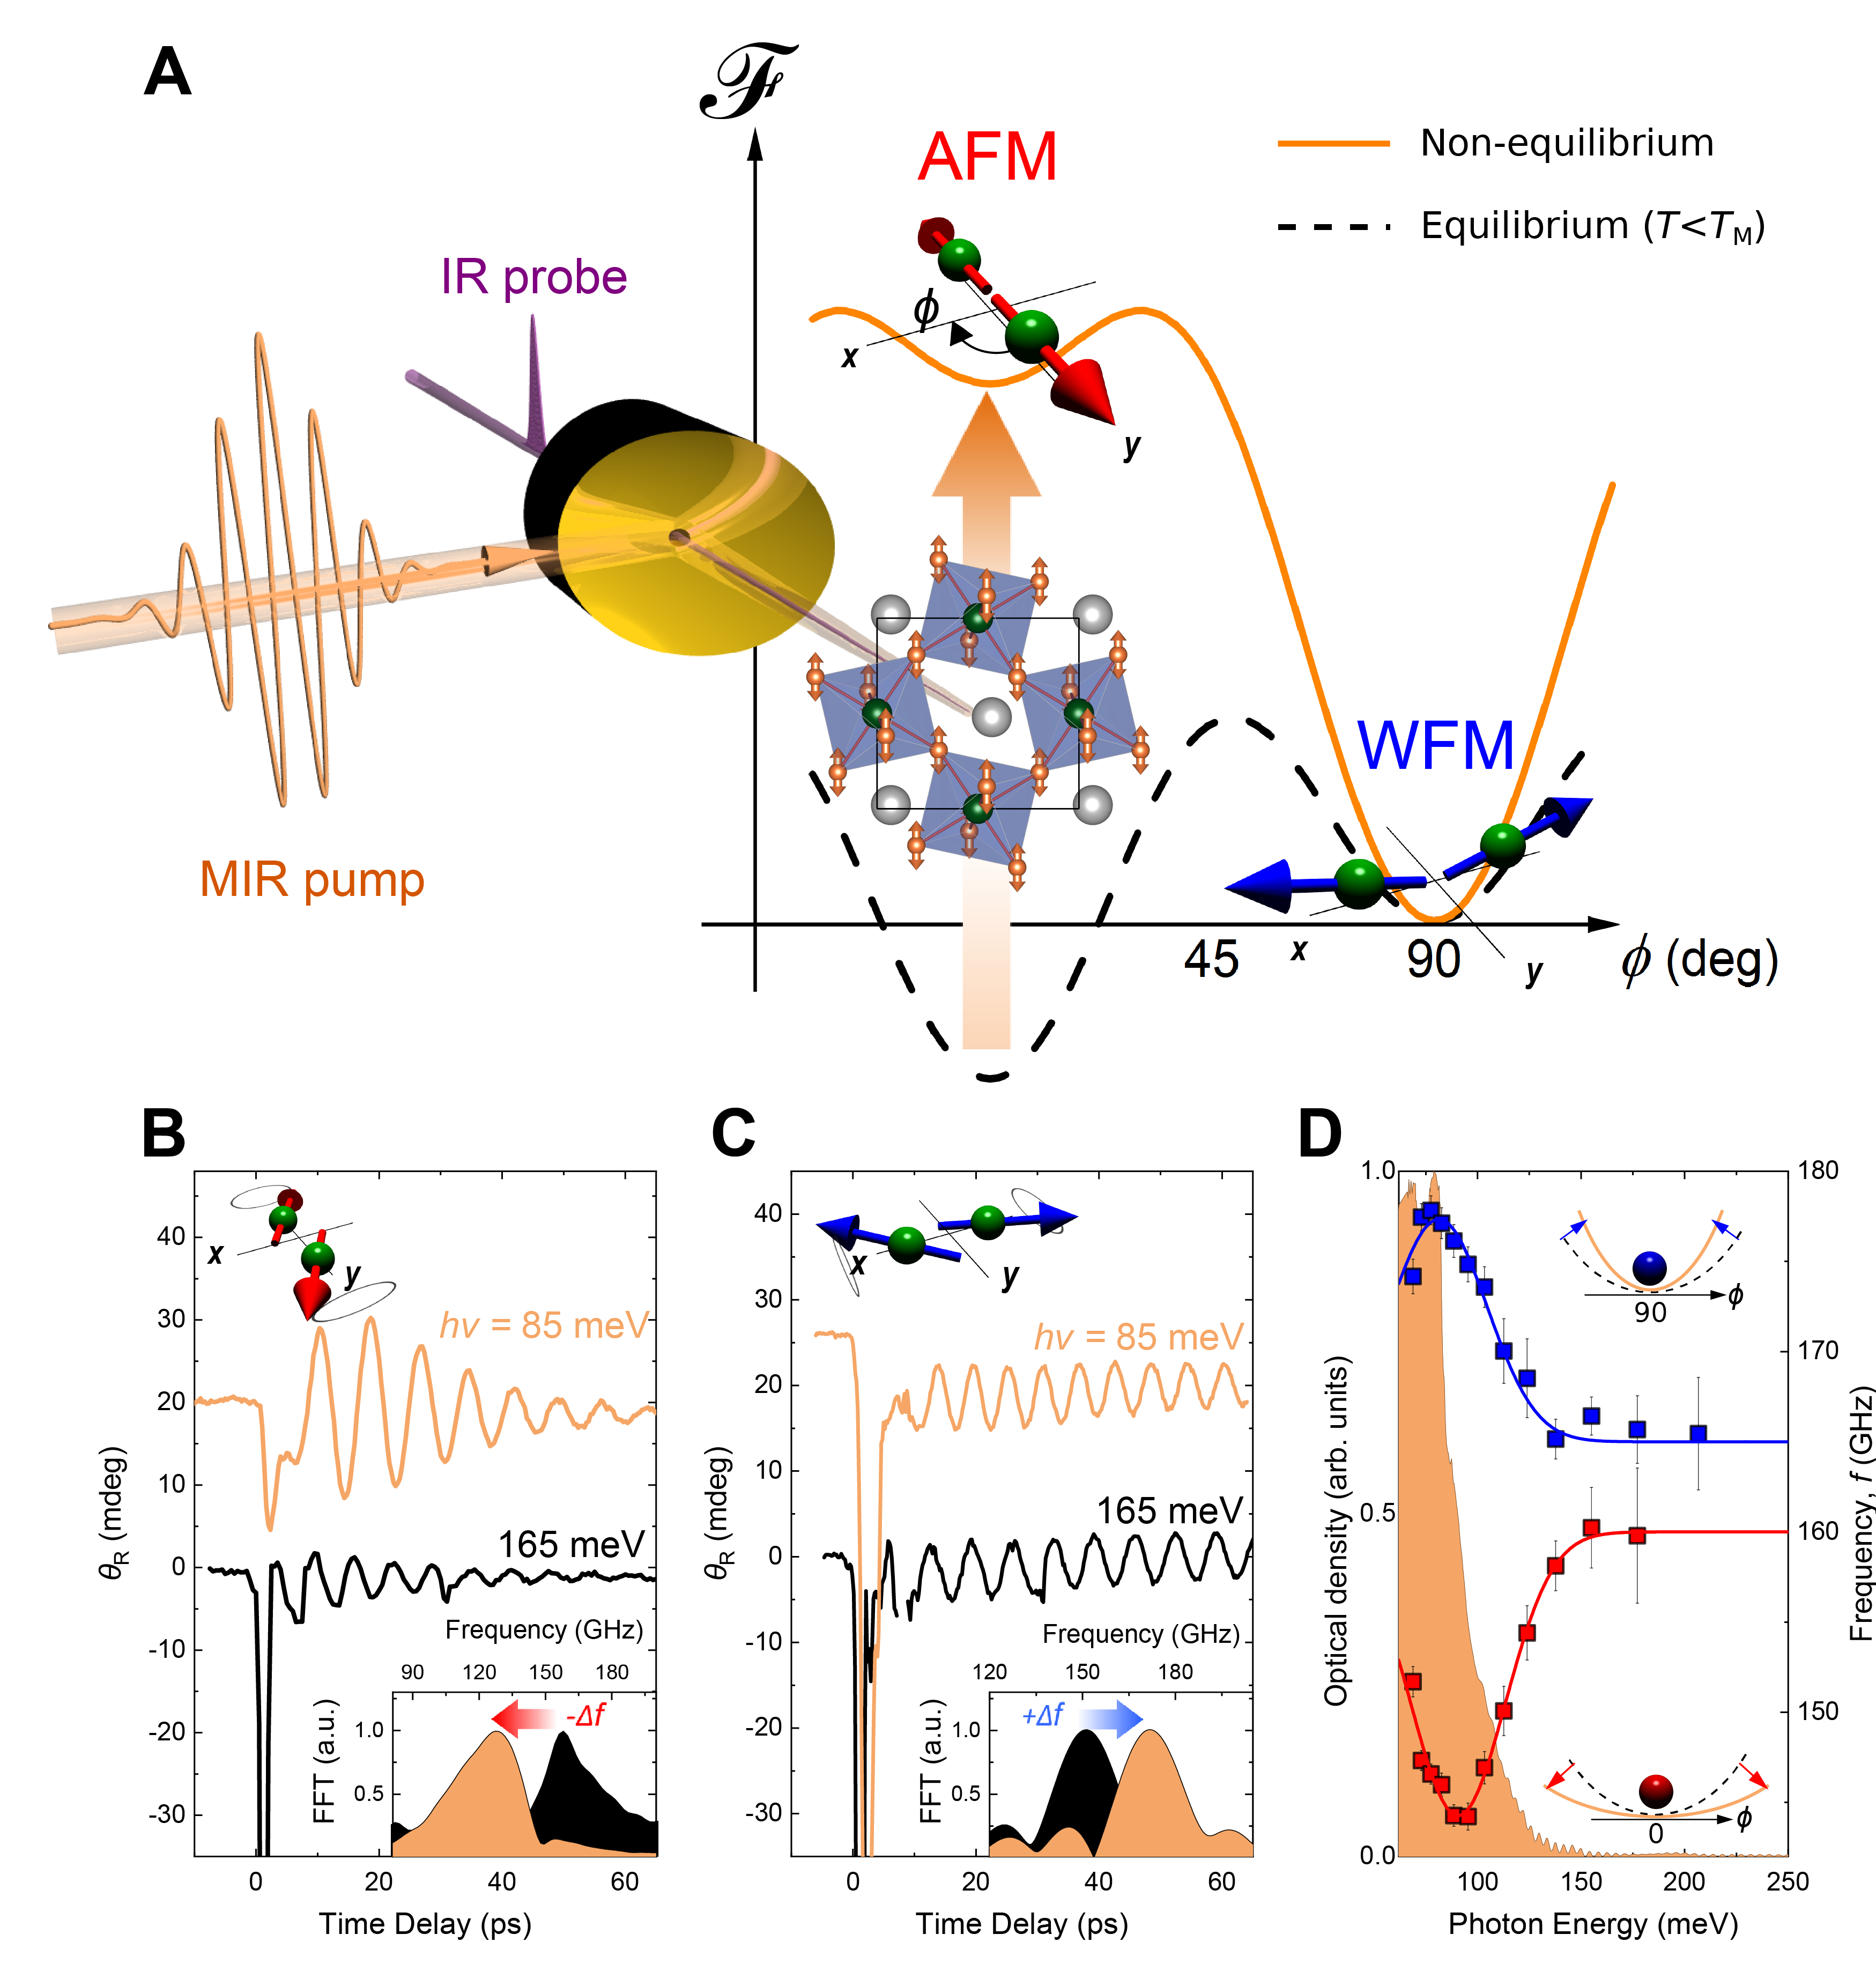
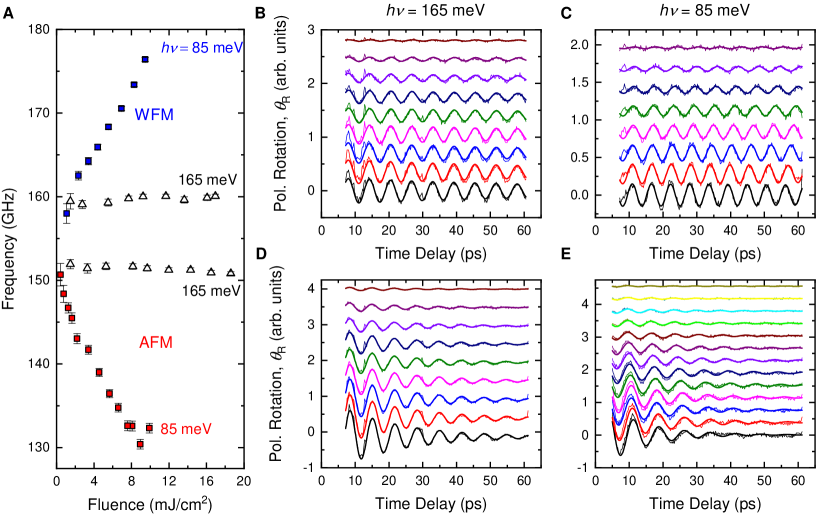
In our experiments we investigate spin dynamics in single crystals of -cut \ceDyFeO3. The light-excitation is provided by an intense (electric field in excess of 10 MV/cm), phase-locked mid-infrared impulsive source (250 fs, ), tunable in a broad photon energy range from . This energy range covers the broad absorption peak of the highest frequency B infrared-active phonon mode, associated with periodic stretching of the \ceFe-\ceO bonds, see Fig. 1a and Fig. S4,S5. The ensuing spin dynamics is measured, in a conventional pump-probe scheme, by tracking the polarization rotation, imprinted by the magneto-optical Faraday effect, on co-propagating near-infrared probe pulses at the photon energy of . In our experimental geometry, the Faraday rotation probes the magnetization dynamics along the normal direction. Importantly, the frequency of the antiferromagnetic spin precession mode (the soft mode of the Morin phase transition), informs us on the local curvature of the magnetic potential, according to the relation , both in the AFM () and WFM () phases Yusupov2010 ; Yamaguchi2015 .
Figure 1c and 1d show light-induced dynamics of the Faraday signal in the AFM and WFM phases revealing coherent oscillations, corresponding to spin precession around their respective equilibria. These dynamics are induced by pump pulses tuned in resonance with the lattice vibrational mode (85 meV). As a control experiment, we excite magnon oscillations via impulsive stimulated Raman scattering (ISRS) Kalashnikova2007 ; Afanasiev2016 using pulses (165 meV) tuned away from lattice or electronic resonances. These conventional time-domain spectroscopy measurements serve as a probe of the curvature of the equilibrium potential.
A comparison of the Fourier spectra (insets in Fig. 1b and 1c) reveals that the frequency of the spin precession excited by pulses in resonance with the lattice mode is shifted as compared to the equilibrium value given by the ISRS driven reference. The sign of the shift depends on the initial magnetic configuration, being red in the AFM phase and blue in the WFM phases. To underscore the resonant character of the frequency shift we tune the photon energy of the pump pulse across the phonon resonance and extract the central frequency of the spin oscillations (Fig. 1d). The data acquired in both magnetic phases show that the onset of the frequency-shift follows closely the spectrum of the linear absorption of the B phonon mode, revealing a correlation between light-driven lattice and spin dynamics. These non-linear dynamics of the magnetic soft mode contain important information on the effects of phonon-pumping on the magnetic potential. The red shift indicates a flattening of the potential energy in vicinity of the AFM minimum (), which may lead to a phase instability. The blue shift observed in the WFM phase points at an increased curvature and phase stability in vicinity of the WFM minimum ().
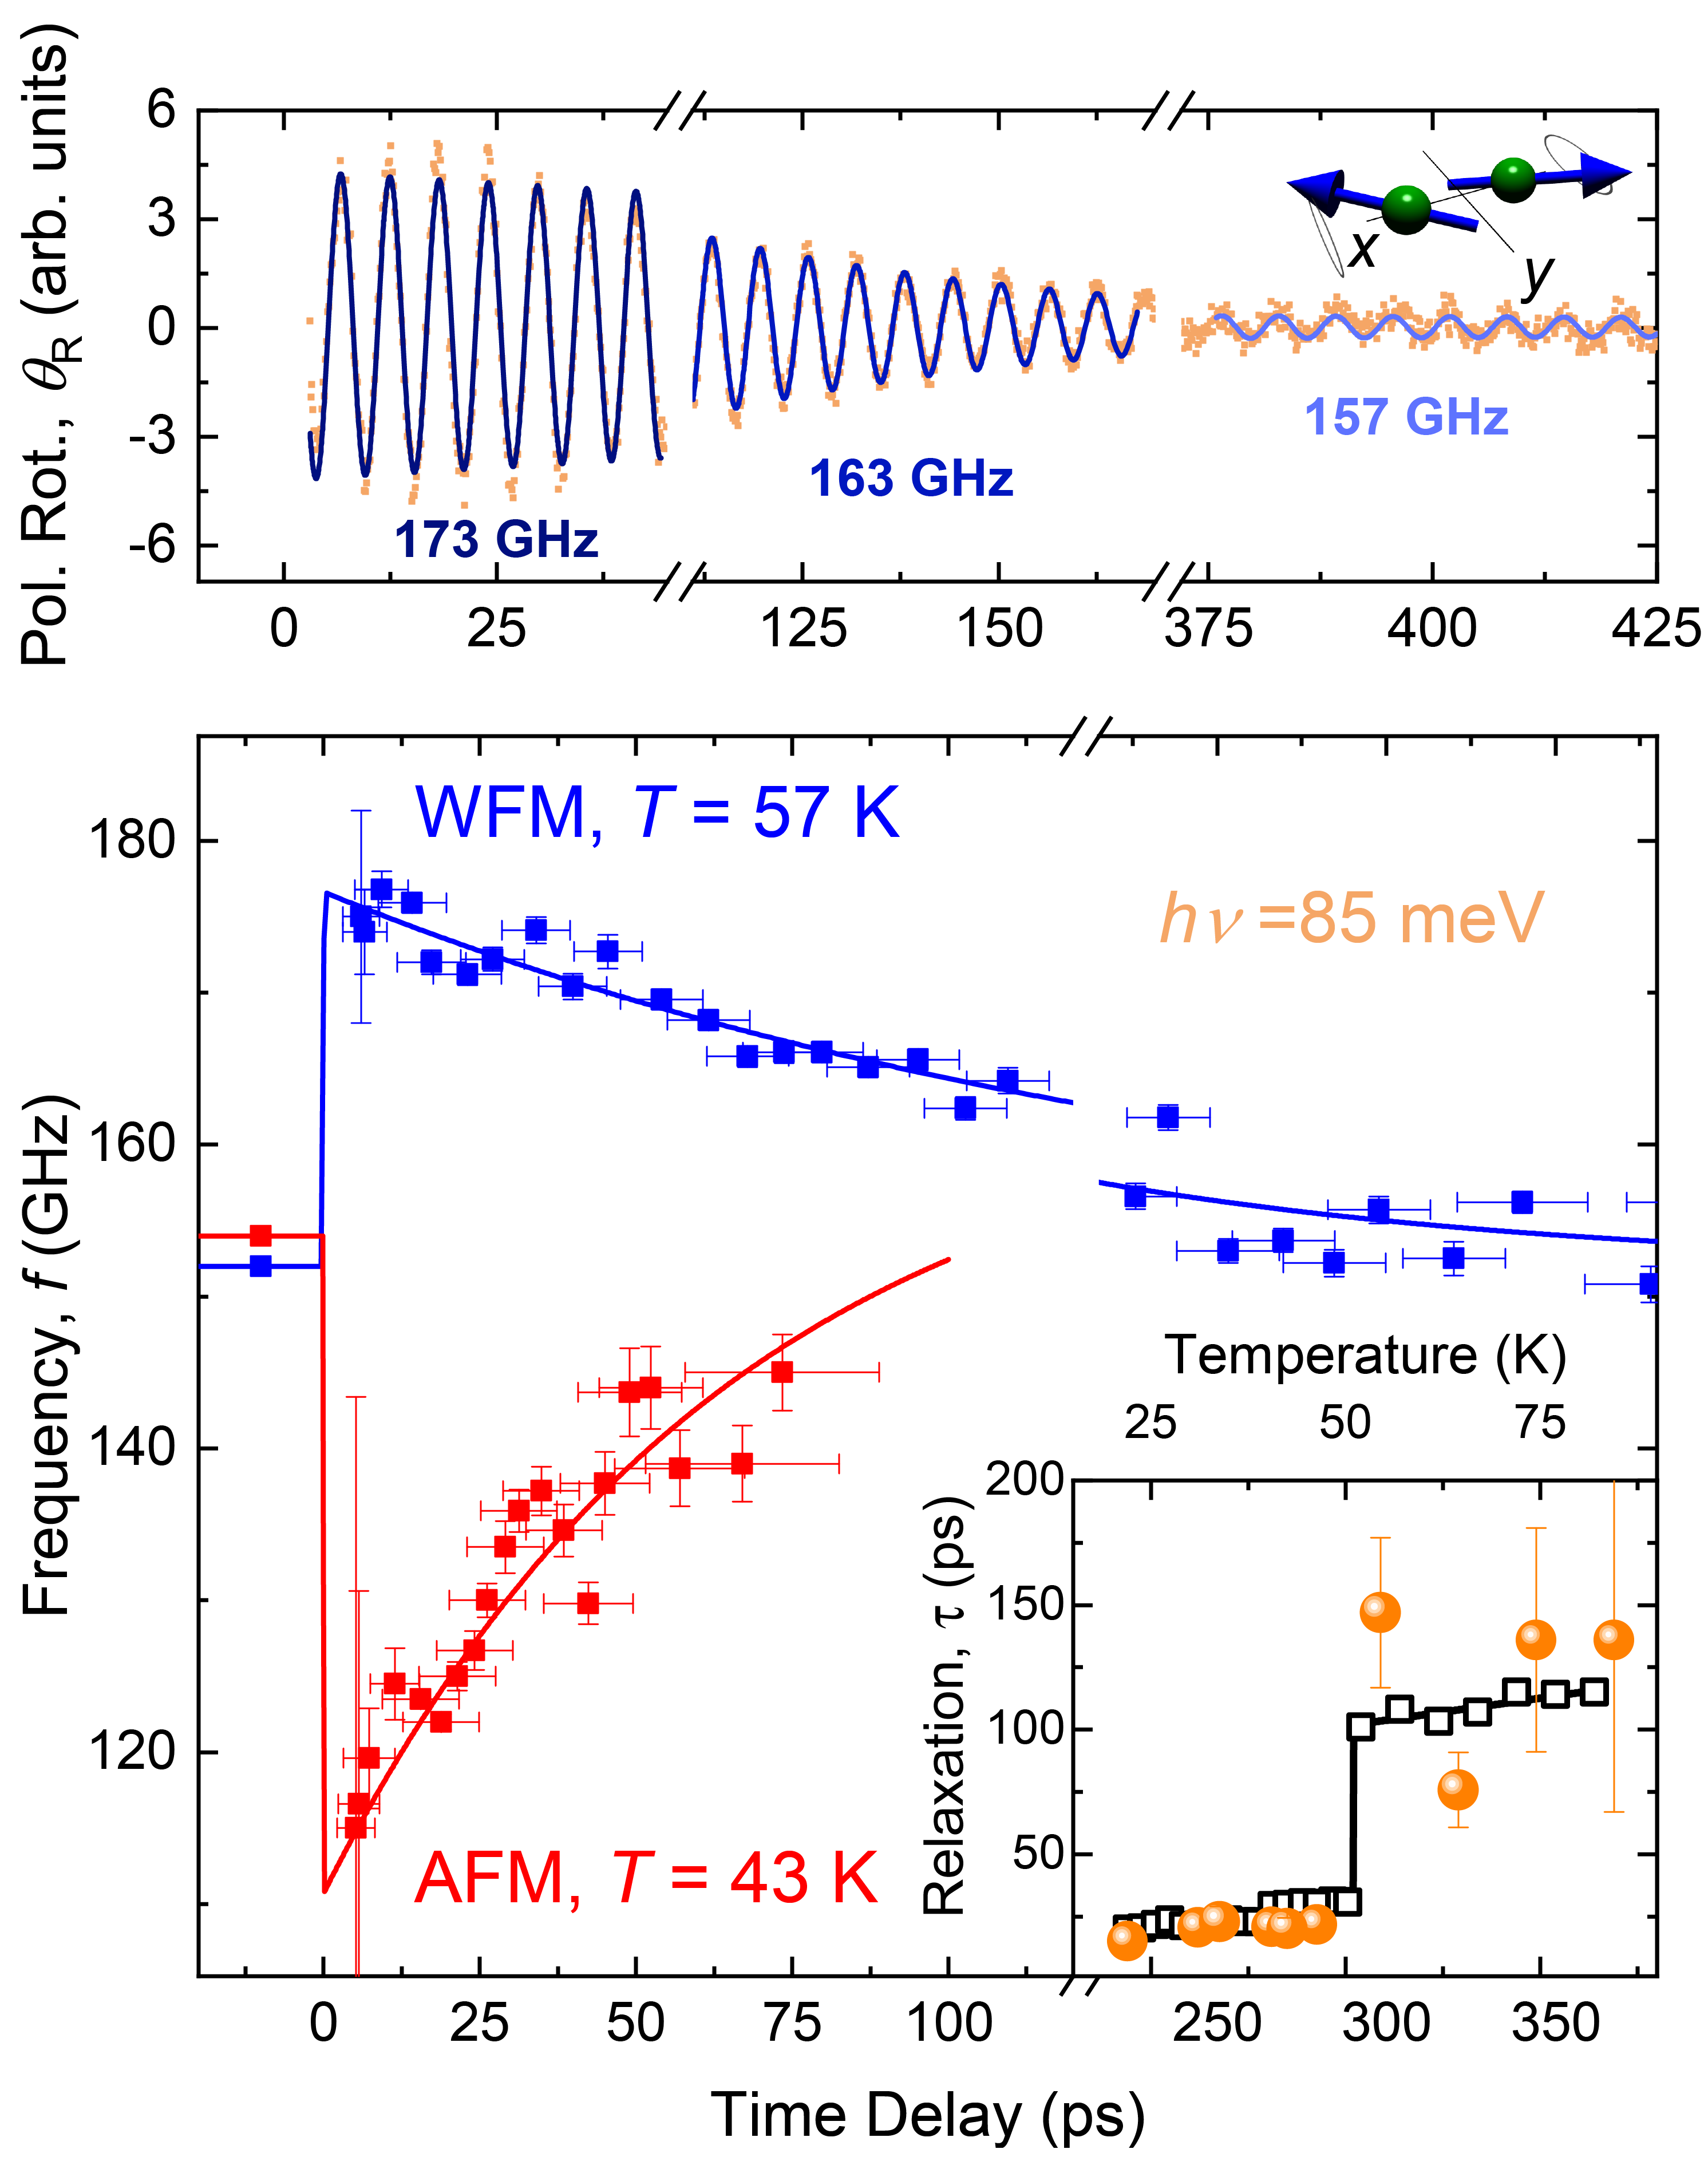
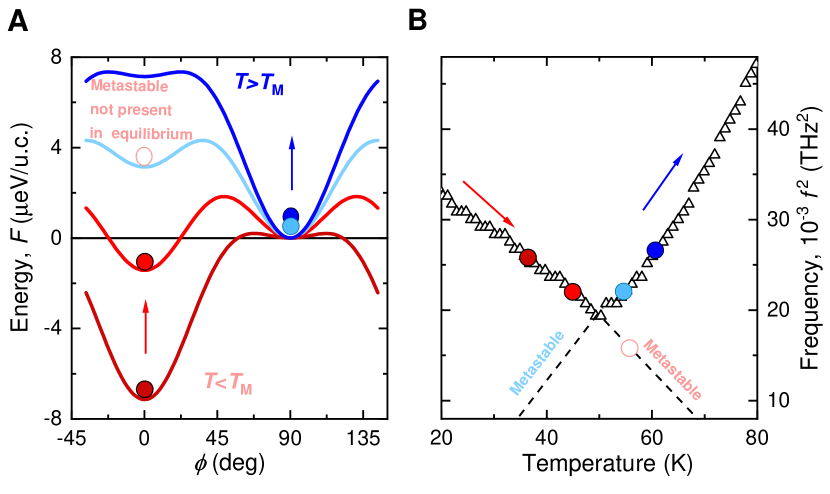
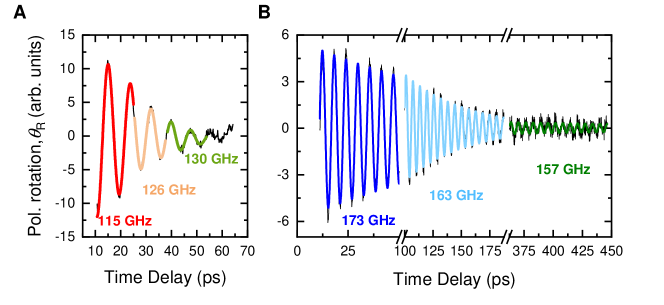
Time-resolved Fourier analysis indicates that the change in frequency occurs within a half-cycle of the first oscillation, defining an upper bound for the phonon-driven changes in the magnetic potential of about . This value is nearly one order of magnitude smaller than the one reported for optical pumping of the - electronic transitions Yamaguchi2015 . Thus, the observed ultrafast response excludes heat-driven spin-lattice relaxation as the origin of the initial kinetics. Remarkably, the change in frequency persists for a time exceeding significantly the precession period, as shown in Fig. 2. We note that the relaxation time (inset Fig. 2) and its temperature dependence closely follow the characteristic equilibrium decay time of the spin precession (Fig. S8).
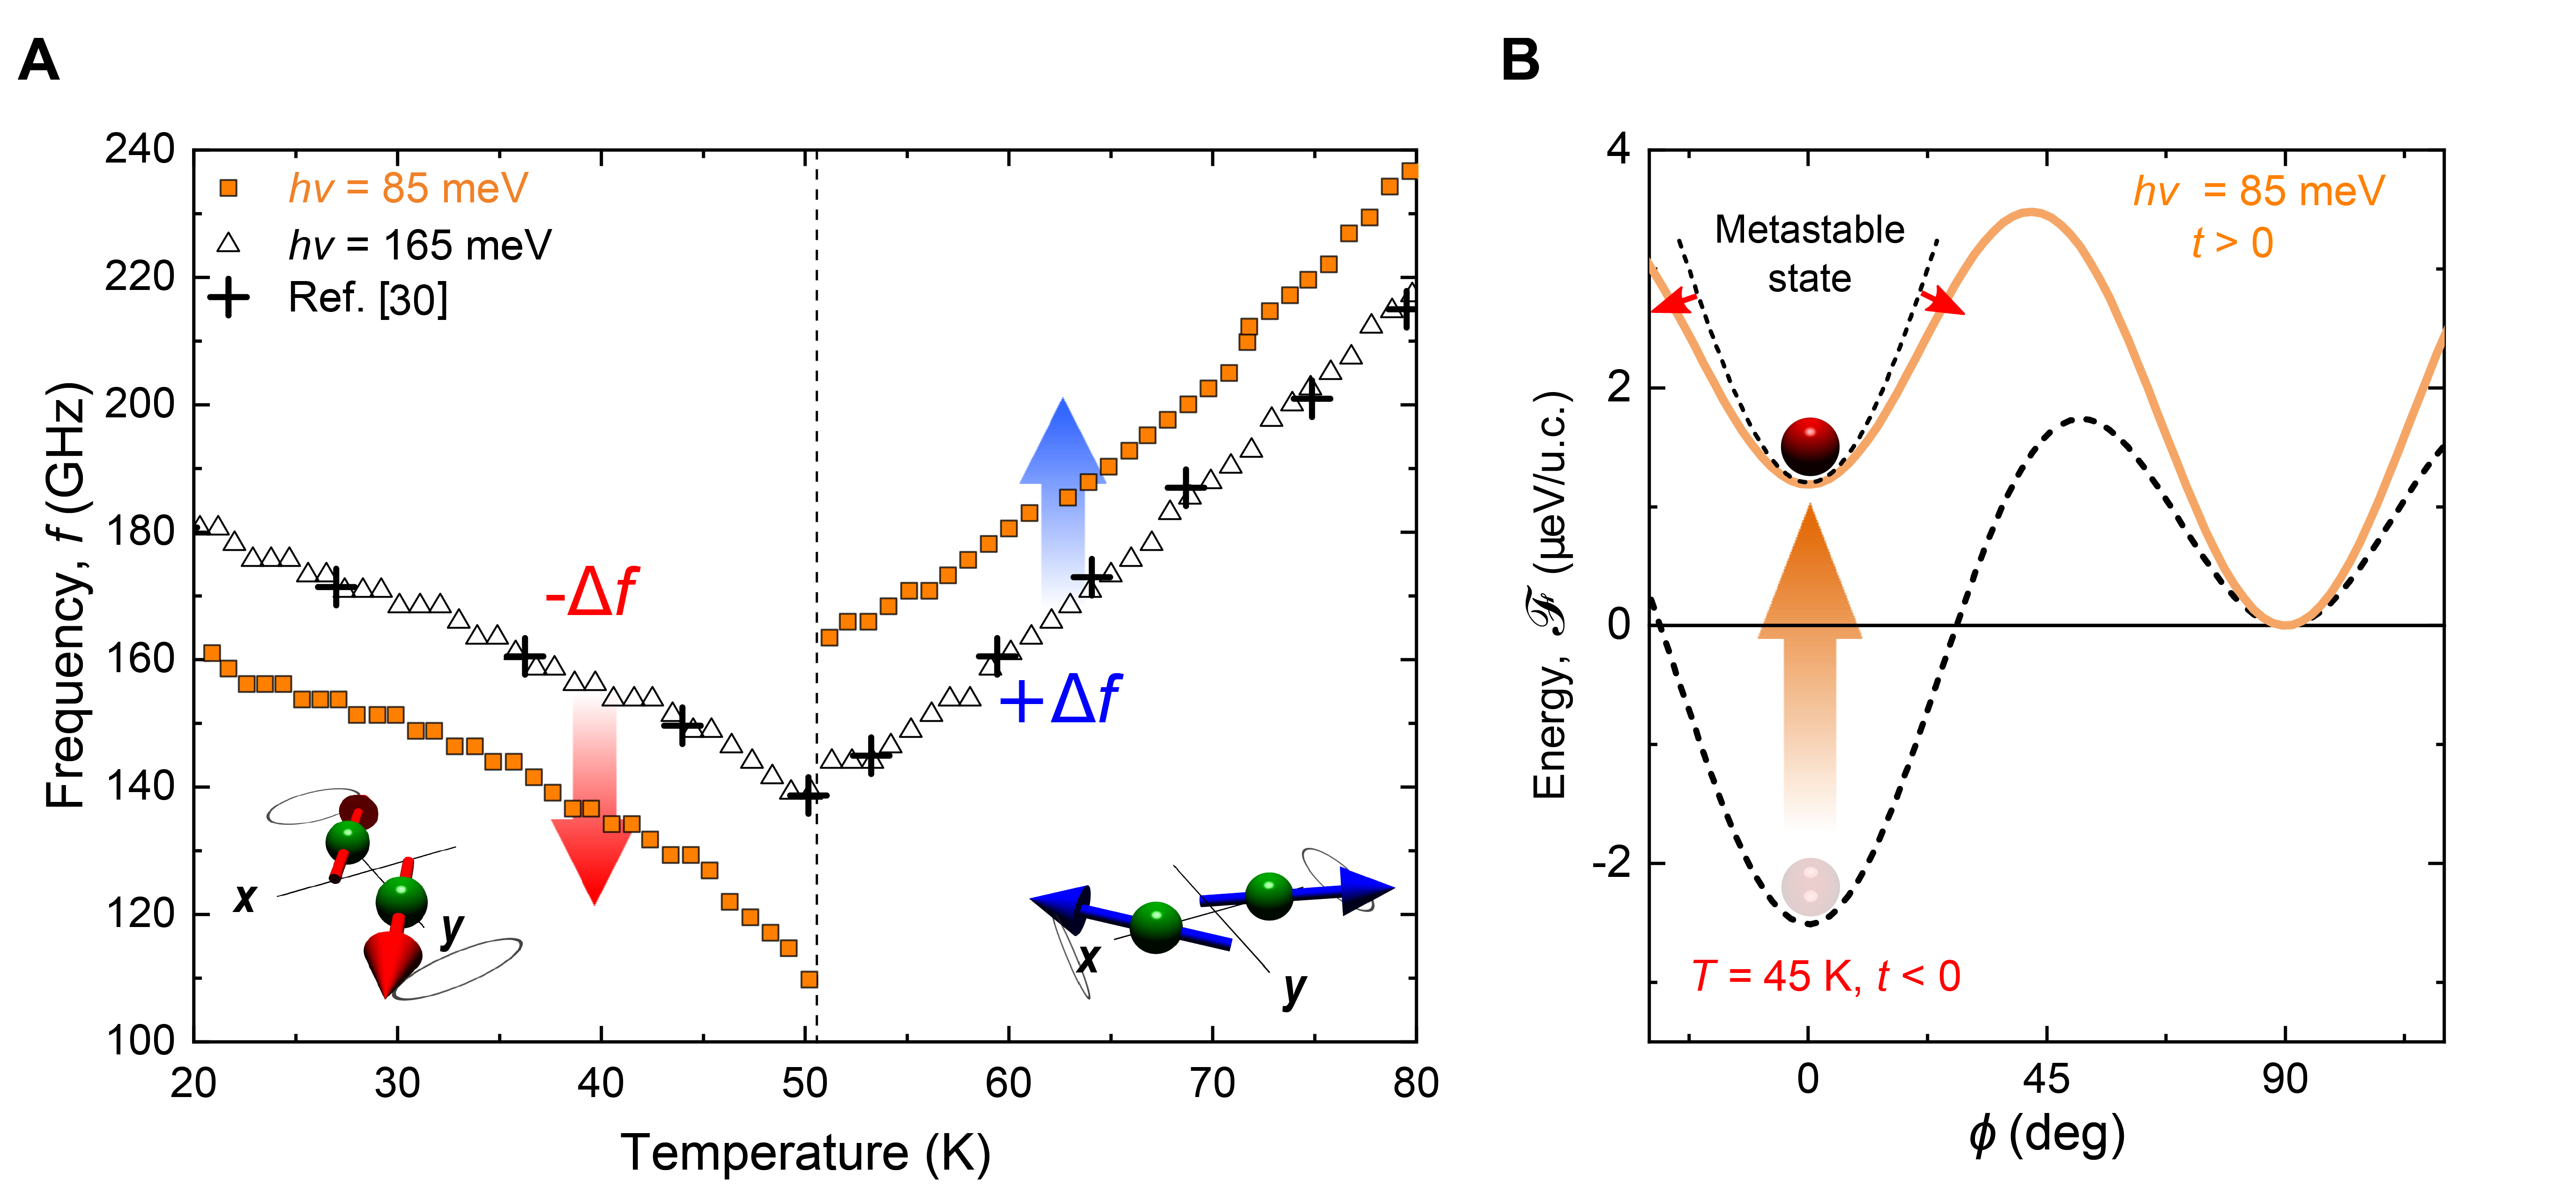
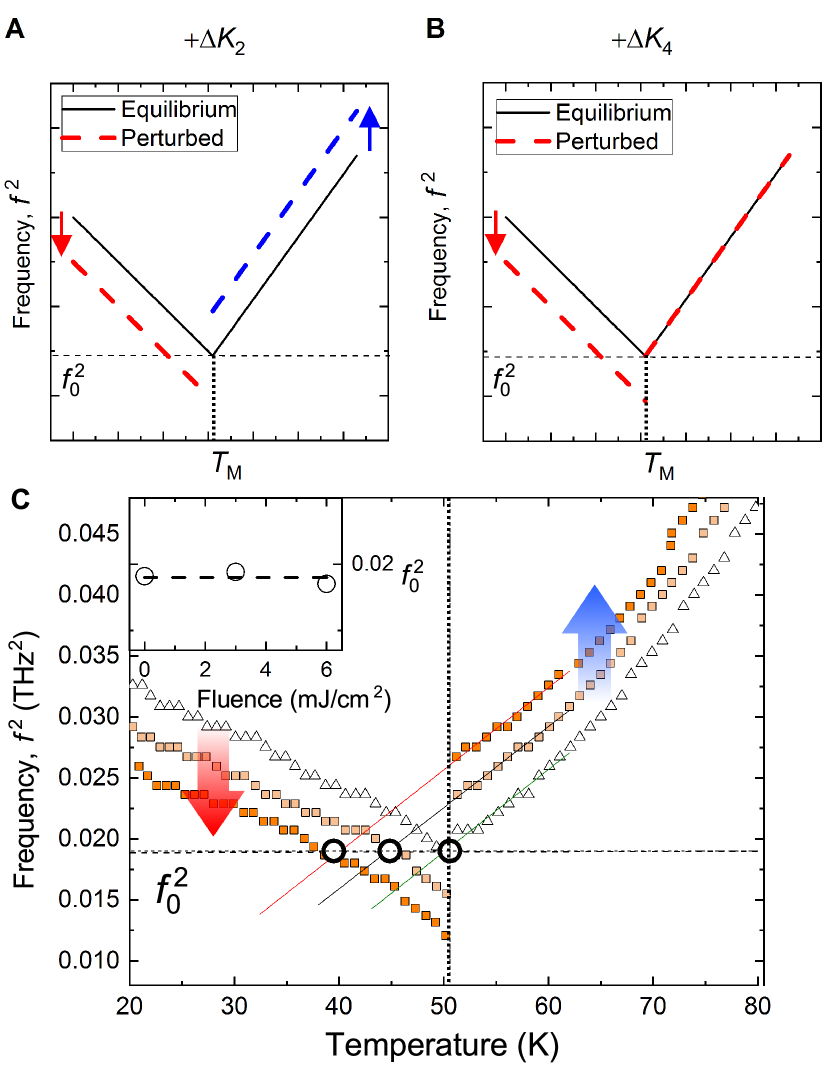
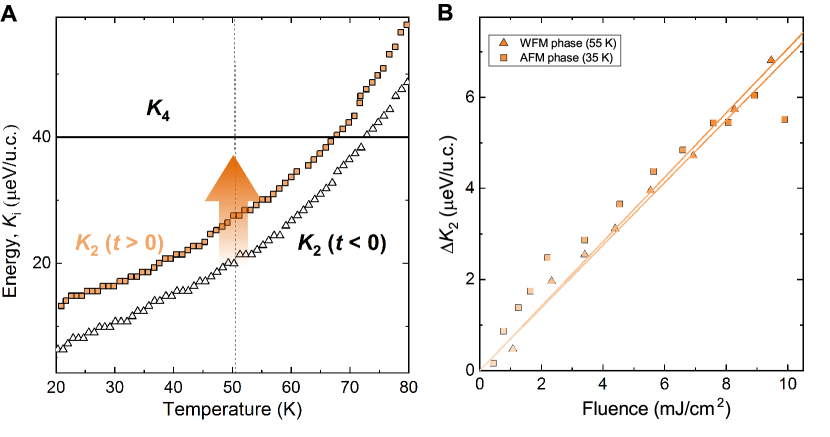
As shown in Fig. 3a, measurements of the frequency of the magnetic mode as a function of temperature reveal a cusp-like evolution in proximity to , in close agreement with Ref. Balbashov1985 . In contrast, the frequency of the phonon-driven oscillations at is characterized by a pronounced discontinuity of more than and frequencies well below the minimum value attainable at equilibrium. From the analysis of the temperature dependence of the phonon frequencies, we map out the magnetic potential (see supplementary text S4 for details) before () and after () laser excitation, see Figure 3b. Importantly, phonon-pumping significantly increases the energy of the AFM state simultaneously lowering the kinetic barrier, such that close to the AFM phase may lose its stability.
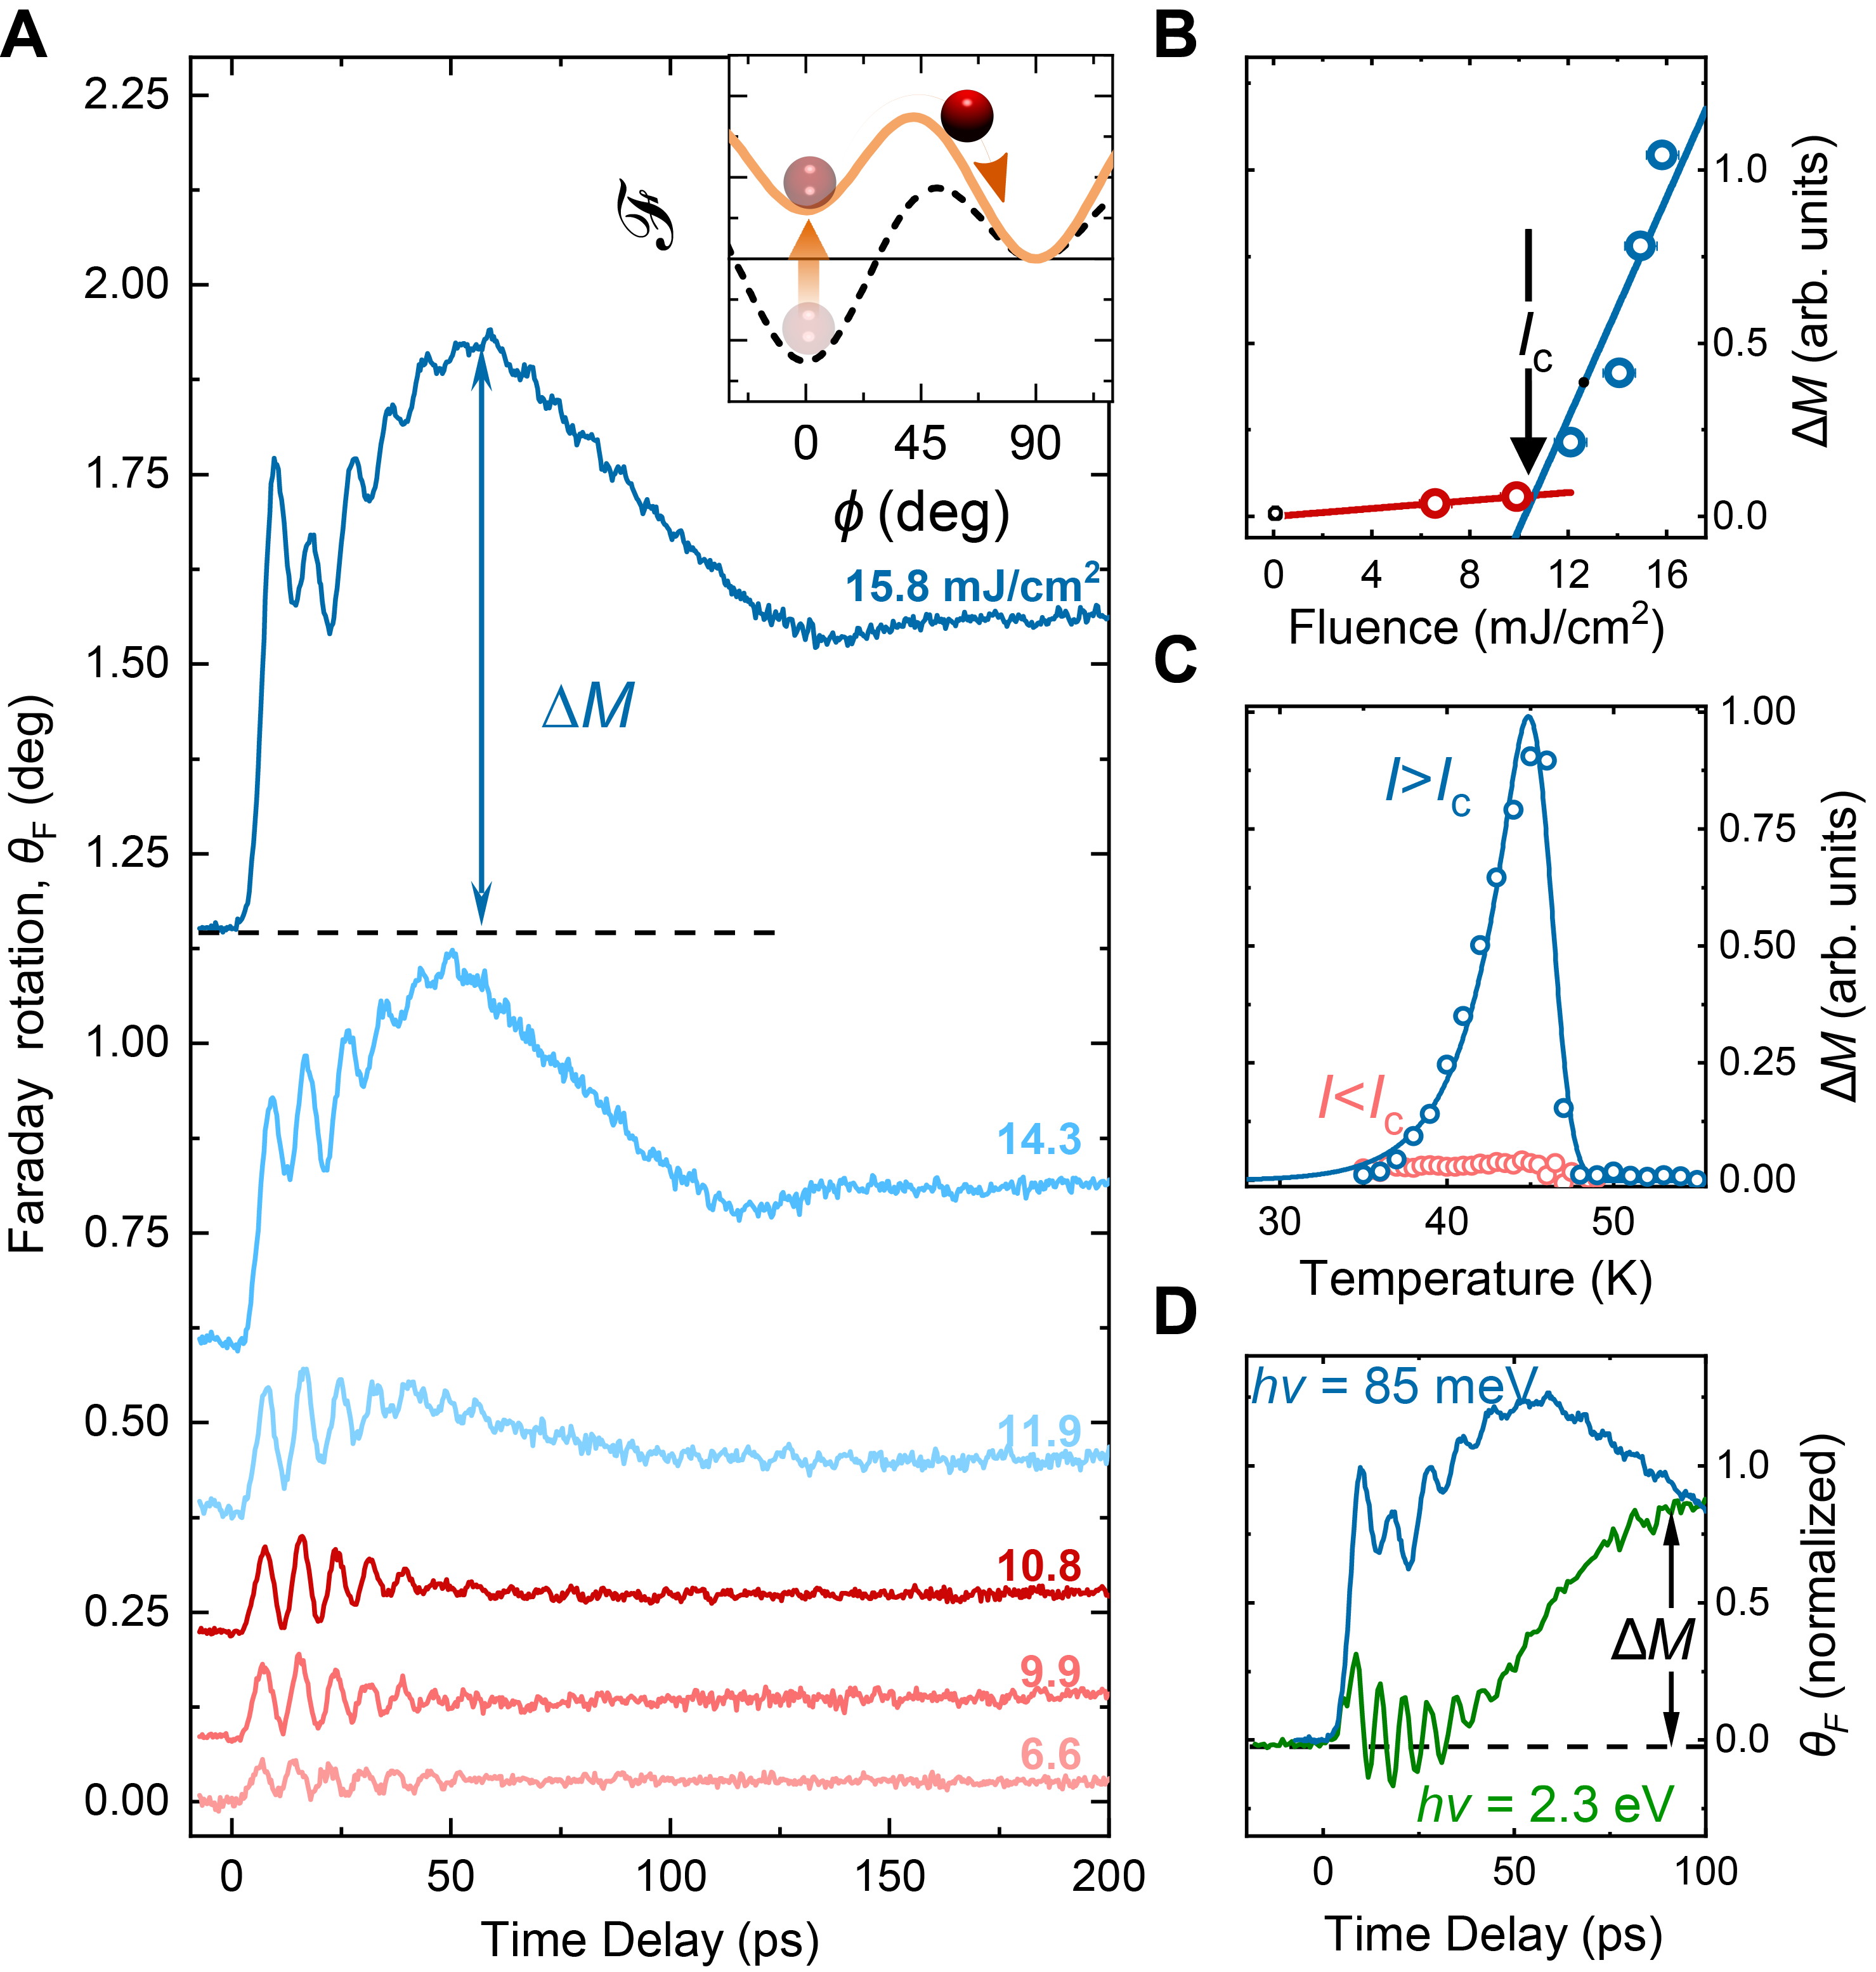
The observation of light-induced metastability and the lowering of the kinetic barrier indicate that phonomagnetism can be used to promote an ultrafast spin-reorientation and drive a transformation from the AFM phase to the WFM phase (inset Fig. 4a). In order to explore this scenario we perform time-resolved measurements of the magnetization dynamics for a set of progressive pump fluences in vicinity of , as shown in Figure 4a. Two distinct regimes are observed above and below a critical fluence (see Fig. 4b). For pump fluences below the pump drives a nearly harmonic response of spins mainly influencing its amplitude and frequency. However, upon exceeding the value of , the course of the magnetization dynamics changes dramatically. A long-lived (>) offset, odd parity with respect to the sign of the applied field, develops within nearly a half-period of the spin precession(<), marking the coherent emergence of a transient magnetization . As the temperature is varied, it becomes apparent that the magnetisation peaks nearly at and completely vanishes for (see Fig. 4c). The presence of a well-defined fluence threshold, as well as the observation of the photo-induced macroscopic magnetization inherent to the WFM phase, are clear signatures that phonon pumping drives the coherent reorientation of spins accompanied by a change in the magnetic symmetry.
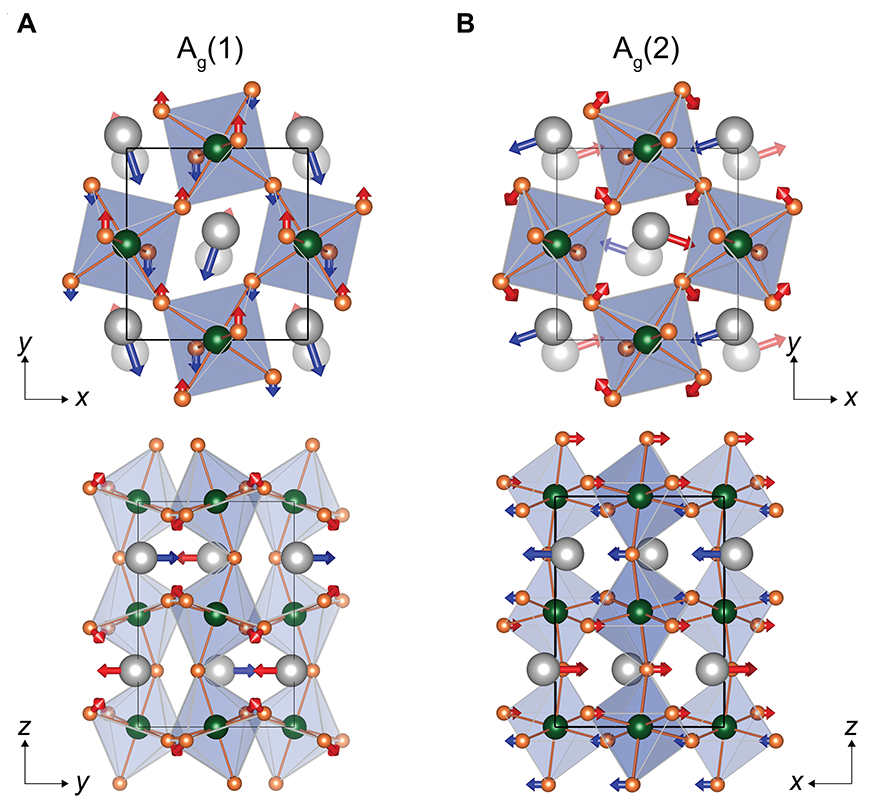
The phenomenological model indicates that all the observed dynamics are governed by phonon-induced changes in the strength of the \ceFe-\ceDy exchange (see supplementary information). We also use density functional theory calculations (see supplementary text S4) to model microscopic non-linear lattice dynamics and find that Ag Raman distortions (a combination of antipolar Dy motions and oxygen octahedra rotations) have the strongest symmetry-allowed coupling with the B1u mode excited at resonance. Time-resolved measurements of the reflected probe pulse at twice the incident energy (second harmonic generation) are sensitive to structural dynamics (see supplementary text S4B) and are consistent with the non-linear excitation of these low-energy modes. Our calculations further indicate that a lattice distortion with the symmetry of the Ag mode can strongly perturb the \ceFe-\ceDy exchange, underscoring a good agreement between the phenomenological and the microscopic model.
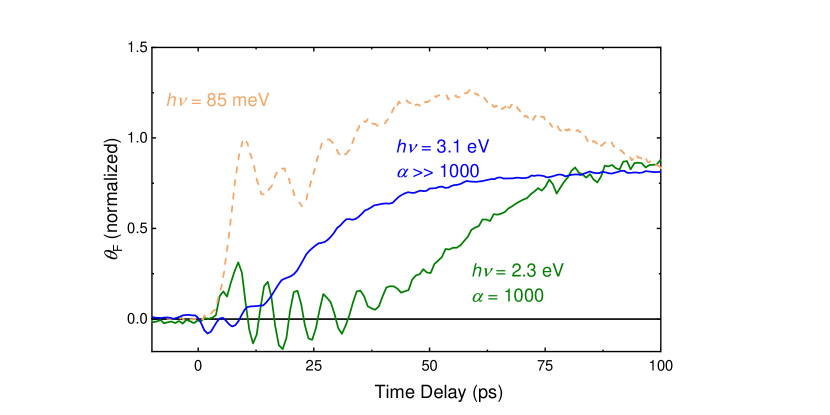
In Fig. 4d we compare the spin-reorientation transition obtained in DyFeO3 via conventional photomagnetism (excitation with photon energy , above the material’s band gap) with the phonomagnetism discussed here. We note that the photomagnetic response leads to the development of a net magnetisation on a time scale of 100 ps, consistent with a laser-induced heating of the electron, lattice and the rare-earth spin system Yamaguchi2015 . In contrast, the phonomagnetic route develops light-induced magnetism within a half cycle of the spin precession, below 5 ps. This time scale points at phonon-induced atomic displacements and reconfiguration of the anisotropic exchange interactions as the driving force of the spin alignment.
By optical pumping of lattice vibrations we have investigated a new route to reshape magnetic potentials and initiate ultrafast magnetic transitions. Using a phenomenological description and first-principles calculations we have demonstrated that the mechanism is based on a lattice-driven change of the magnetic anisotropy (exchange interaction between rare-earth and transition metal ions). We anticipate that a similar mechanism will be active in other magnetic materials featuring anisotropic interactions such as rare-earth based compounds (manganites, vanadates and orthochromites) and type-II multiferroics Cheong2007 ; Tokura2014 . Our findings highlight new avenues for the manipulation of ferroic order on ultrafast timescales and provide a new platform for magnonics.
Acknowledgments: We thank S. Heirman for assistance in measuring linear absorption in the mid-infrared spectral range and T. C. van Thiel for fruitful discussions.
Funding: This work was supported by the EU through the European Research Council, Grant No. 677458 (AlterMateria), The Netherlands Organization for Scientific Research (NWO/OCW) as part of the Frontiers of Nanoscience program (NanoFront), and VENI-VIDI-VICI program, the European Union’s Seventh Framework Program (FP7/2007-2013)/ERC Grant Agreement No. 339813 (Exchange), the program Leading Scientist of the Russian Ministry of Science and Higher Education (14.Z50.31.0034), the Ministry of Science and Higher Education of the Russian Federation in the framework of Increase Competitiveness Program of NUST MISiS (No. K2-2017-005), implemented by a governmental decree dated 16th of March 2013, N211, and by the National Academy of Sciences of Ukraine via Project No. 1/17-N. E.B. and A.S. thank the FRS-FNRS, ARC AIMED project, the CÉCI supercomputer facilities (Grant No. 2.5020.1) and Tier-1 supercomputer of the Fédération Wallonie-Bruxelles funded by the Walloon Region (Grant No. 1117545).
Author contributions: A.D.C. conceived the project with D.A. D.A and J.R.H. carried out the experiments and analyzed the data. D.A., R.V.M. and A.V.K. identified the material system for the project and contributed to the analysis. B.A.I and Y.B. contributed to theoretical treatment of experimental results. A.S. and E.B. performed the DFT calculations. All authors discussed the results. The manuscript was written by D.A., J.R.H. and A.D.C. with feedback from all coauthors.
Competing interests: The authors declare no competing interests. Data and materials are available on a reasonable request.
Materials and Methods
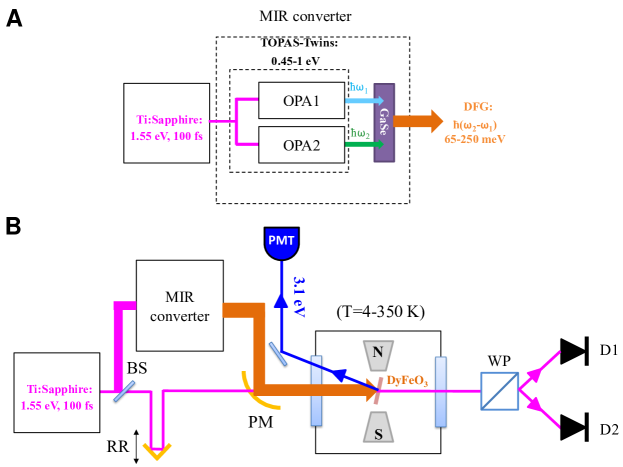
S1. Experimental setup
The intense pump pulses with wavelengths in the mid-infrared (MIR) spectral range used in this experiment, were generated via difference frequency generation (DFG) in a \ceGaSe crystal using the output beams of two commercially available, independently tunable optical parametric amplifiers (OPAs) integrated into a single housing (Light Conversion, TOPAS-Twins). The OPAs were pumped by a commercially available amplified Ti:Sapphire laser system (Coherent, Astrella) delivering pulses at a repetition rate with a duration of and a photon energy of . The OPAs were seeded by the same white light generated in a sapphire crystal, which ensures separately tunable, but phase-locked output pulses Sell2008 with photon energies in the range of . As a result, when the pulses are mixed in the GaSe crystal, the generated MIR pulses are carrier envelope phase (CEP) stable Baltuska2002 , linearly polarized and their energy lies in the range from with an average pulse duration of around . In the experiments, the mid-infrared pulses were focused onto the sample surface to a spot with a diameter of about , using an off-axis parabolic mirror. The scheme of the setup for generation of the MIR pulses (MIR converter) is shown in Fig. S1A. The experimental geometry employed for measuring pump-induced dynamics is shown in Fig. S1B. The polarization rotation of the linearly polarized probe pulse, imprinted by the magneto-optical Faraday effect, was measured with the help of a polarization bridge (Wollaston prism) and a balanced photodetector. The pump-induced changes to the crystal symmetry of \ceDyFeO3 were monitored via time-resolved measurements of the reflected probe pulse at twice the incident energy (), detected in the reflection geometry.
Supplementary Text
S2 First-order spin reorientation phase transition of the Morin type in
.1 Phase diagram of the phase transition
Below the Néel temperature , the \ceFe^3+ spins in \ceDyFeO3 are ordered antiferromagnetically. The magnetic phase diagram of \ceDyFeO3 includes a collinear antiferromagnetic (AFM) phase with the spins oriented along the -axis and a weakly ferromagnetic (WFM) phase with the spins oriented along the -axis Treves1965 . The AFM phase is stabilized at low temperatures ( = ) and can be transformed to the WFM phase either by an increase in temperature or by application of an external magnetic field applied along the -crystallographic axis.Afanasiev2015 The transition between the phases proceeds as a first-order phase transition. The measurements of the static Faraday rotation as a function of the applied magnetic field for various temperatures shown in Fig. S2A reveal the phase diagram of the magnetic states.
The phase transition demonstrates a very narrow (<) temperature hysteresis Belov1976 ; Eremenko1987 ; Maziewski1977 ; Gnatchenko1989 ; Szymczak1983 ; Gnatchenko1981 . In Refs. Eremenko1987 ; Szymczak1983 it was assumed that this nearly hysteresis-free character of the transition arises from a high sensitivity of the spin-orientation phase transition to lattice deformations and imperfections of the crystals. These factors contribute to prompt nucleation of the new magnetic phase, once the energy balance is altered, making the hysteresis extremely narrow in vicinity of .
.2 Free energy potential of the phase transition
The spontaneous spin-reorientation transition in \ceDyFeO3 in zero magnetic field is governed by the magneto-crystalline energy:
| (S1) |
which depends on the temperature and the angle that the spins form with the -axis Zvezdin1979 ; Balbashov1985 . The magnetic anisotropy parameters and originate from the temperature-dependent exchange interaction between the iron and dysprosium ions and the temperature-independent magnetic anisotropy of the iron ion .
Figure S2b shows that the relative energy of the AFM and WFM phases ( when the energy of the AFM phase is lower than that of the WFM) as well as the height of the kinetic potential barrier is controlled by the ratio of the two positively defined phenomenological parameters and . We note that this potential cannot account for the hysteresis-free character of the phase transition and rather represents the free-energy potential of a single nucleus. The adiabatic phase changes in the equilibrium are governed by the value and not by the height of the kinetic barrier .
.3 Relation between the curvature of the magnetic potential and frequency of the soft mode spin precession.
Using the equilibrium magnetic potential (Eq. S1), the frequency of the antiferromagnetic spin precession , the soft mode of the phase transition, in the AFM (, ) and the WFM (, ) phases can be obtained from:
| (S2) |
Here, , with and the angular and regular spin precession frequency respectively. is the so-called exchange frequency, defined as the angular frequency of the spin precession in the exchange field of the magnet, such that , where is the gyromagnetic ratio. is the saturation magnetization of a single Fe3+ sublattice, given by the -factor and Bohr magneton divided by the unit cell volume containing 4 iron ions. Comparing the potentials depicted in Fig. S3A, one can see that upon transition from the AFM to WFM phases softening of the frequency in vicinity of the (Fig. S3B) is caused by flattening of the potential function at the AFM minimum. We note that complete flattening, manifested by the frequency going to zero, does not occur in equilibrium, see the dashed line in Fig. S3B. This is because as the temperature is increased to the nucleation process transfers all the phase to the energetically more favorable WFM minimum (). The similar situation occurs with the WFM minimum when is approached from above.
S3. Light-induced excitation of coherent spin precession
.1 Crystal structural and absorption spectrum of
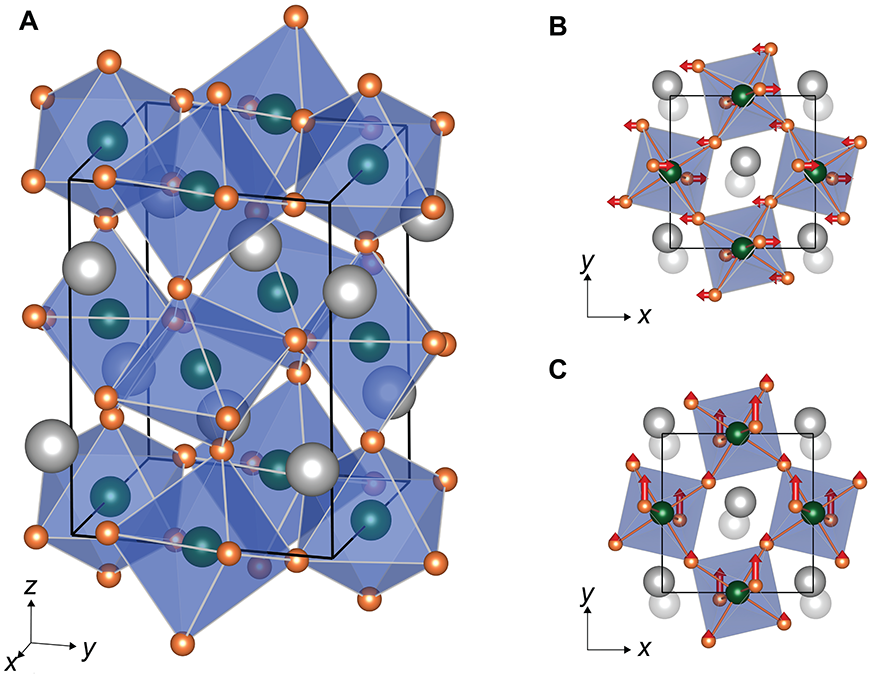
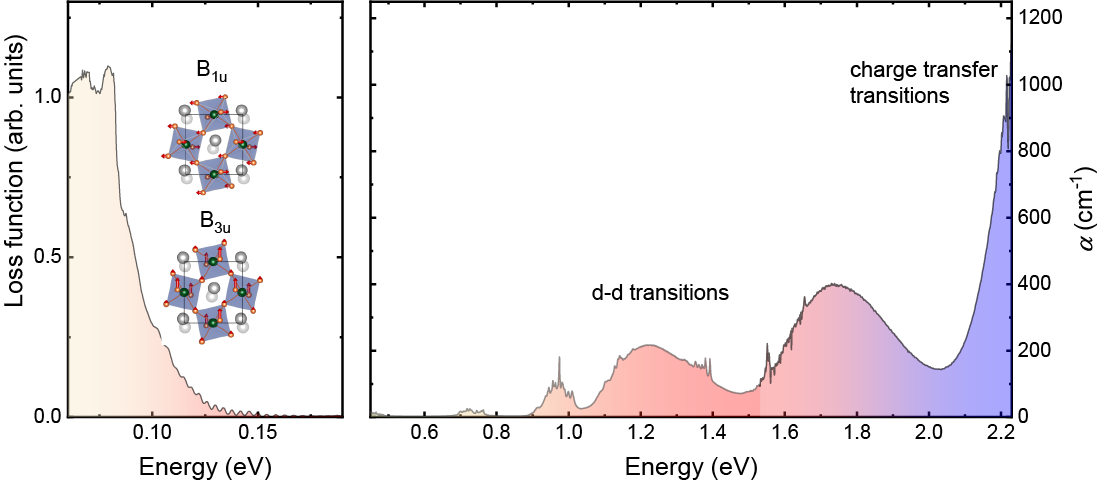
DyFeO3 crystallizes in a perovskite orthorhombic structure (Pnma space group). Its crystal structure is shown in S4a. In our experiments, the ultrashort MIR pulses were tuned in resonance with the highest-frequency, nearly-degenerate and phonon modes. The atomic motion comprising these phonon modes are shown in S4b,c. The electric field of the ultrashort pulses (travelling in the -direction) can couple to these modes, which have their dipole moment in the - plane.
In order to understand and compare the effect of excitation with pump pulses with a different photon energy, we studied the steady-state absorption spectrum of \ceDyFeO3. For the infrared wavelengths, the total transmission of the sample was measured using a Nicolet 6700 Fourier transform infrared (FTIR) spectrometer, which led to the loss function in Fig. S5 (left panel). At higher energies, the absorption of the sample shown in the right panel of Figure S5 was determined using a white light source and a set of Oceanview spectrometers. The broad absorption peaks below are due to \ceFe^3+ - transitions, while the onset of the large peak at high energies is due to charge-transfer excitations. Wood1970
.2 Dependence on photon energy of the pump pulse
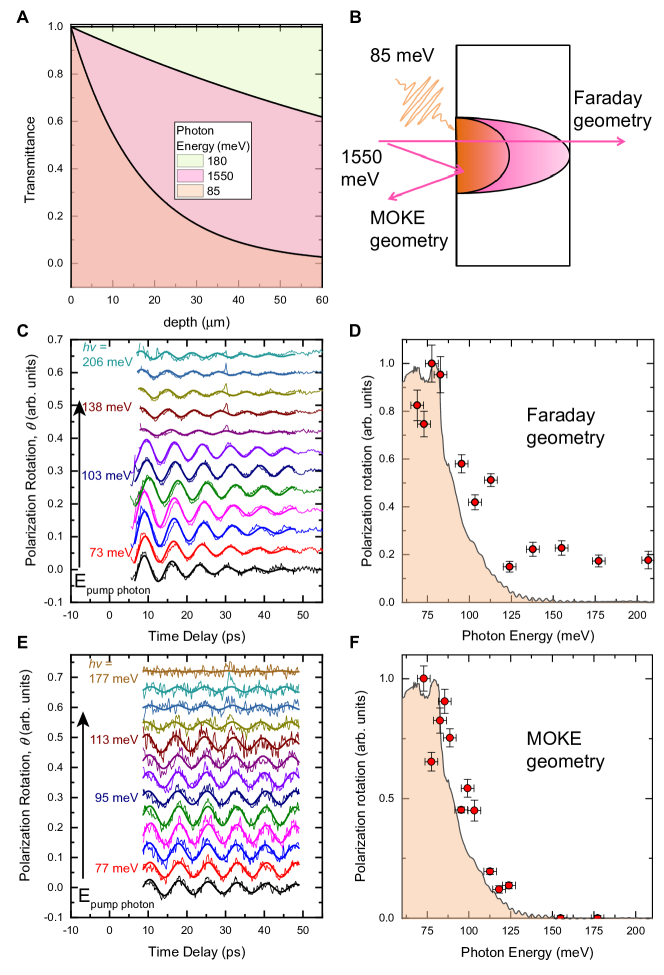
To study effect of the pump photon energy on the excitation of the coherent spin precession, we tuned the photon energy of the pump pulse across the phonon resonance and extracted the amplitude of the spin oscillations, see Fig. S6. The volume of the sample which is probed or excited is defined by the penetration depth of the incident light. This quantity is strongly dependent on the photon energy. The dependency is especially pronounced in vicinity of optical resonances such as formed by the absorption of the infrared-active phonon mode. At these energies, the penetration depth of the incident light is significantly decreased. In our experiment the photon energy of the probe light remained constant throughout all measurements, implying that the probed volume is also constant. The pump energy, on the other hand, was varied in the broad energy range including the phonon absorption range. As a consequence the penetration depth of the pump, and therefore the excited volume, changed strongly (see Fig. S6A).
To avoid this mismatch, we performed a set of the experiments in a reflection geometry employing the polar magneto-optical Kerr effect (p-MOKE), see Fig. S6B. In reflection only a nearly homogeneously excited thin top layer of the sample is probed. Hence these measurements form a way to determine the genuine magnetization dynamics as a function of the pump photon energy.
Figure S6c,d show the pump-induced spin precession and extracted amplitude as a function of the pump photon energy measured at constant power of the pump beam as performed in the Faraday transmission geometry. Figure S6e,f show the results of a similar measurement, in this case performed in the reflection (MOKE) geometry.
A significantly more pronounced resonant character of the excited spin precession as a function of the photon energy is seen for the MOKE experiment compared to the Faraday rotation. We note that in the MOKE experiment no excitation of the spin precession was observed after off-resonant excitation. In contrast, in the Faraday experiment the spin oscillations were also clearly observed for the off-resonant excitation, which reveals that their presence in the Faraday signal is a result of the integration of the magneto-optical signal across the sample thickness. To summarize, the reflection geometry reveals the highly resonant character of the excitation of the spin precession as function of the pump photon energy.
.3 Dependence on the orientation of the pump polarization plane
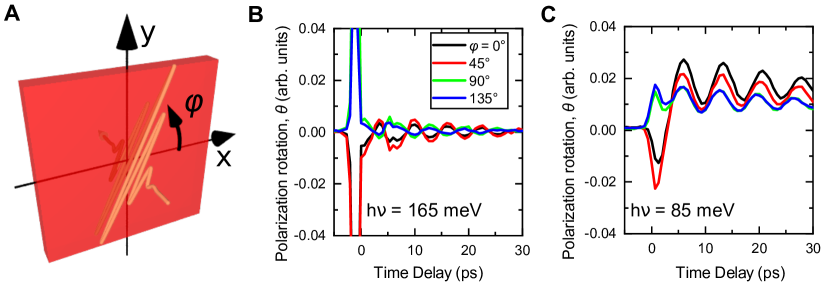
To reveal the excitation mechanism of the spin precession at different energies of the pump photon, we focus on pump pulses having photon energies either resonant or off-resonant with the absorption line of the phonon mode. We studied the dependence of the spin precession on the polarization of the pump pulse for off- () and on-resonant pumping (). Measurements were performed for a set of four distinct orientations of the polarizations of the pump pulse. The orientations correspond to the electric field of the pump pulse oriented either along or in-between the sample’s in-plane crystallographic - and -axis (see Fig. S7A)
In the case of off-resonant pumping, we find that the orientation of the polarization of the pump pulse determines the initial phase of the spin precession phase, as shown in Fig S7b. The polarization dependence is reminiscent of the one expected for the inverse Cotton-Mouton effect (ICME) Kalashnikova2007 ; Afanasiev2016 , a type of impulsive stimulated Raman scattering (ISRS), via which coherent spin precession is excited by linearly polarized ultrashort pulses. In striking contrast to off-resonant pumping, no effect of the pump polarization on the phase of the spin precession is observed when the sample is pumped at the photon energy matching the phonon resonance, as is shown in Fig. S7C. A slight difference in frequency of the observed oscillations is explained by a difference in fluence of the pump pulse used to excite the spin dynamics (). The absence of any dependence on the pump polarization is a strong indication that a different excitation mechanism is at play.
.4 Temperature dependence
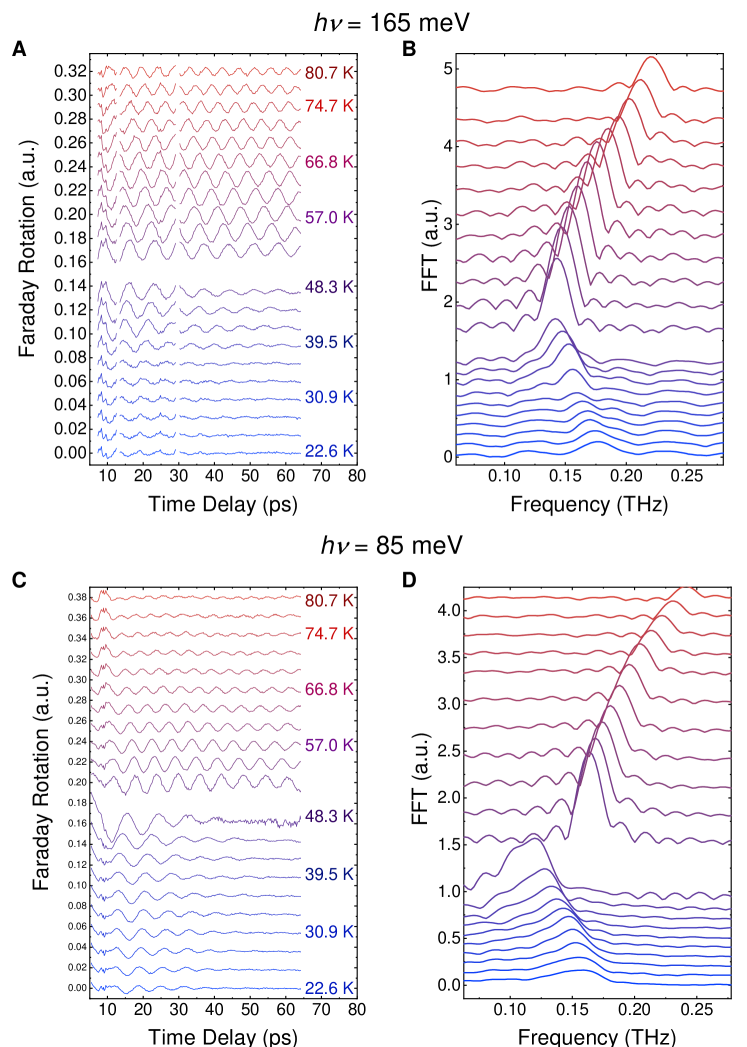
In the main text (Figure 3a) we reported the spin precession frequency obtained after exciting the \ceDyFeO3 sample at different pump photon energies as a function of temperature. Here we report the time-domain dynamics of this mode following excitation energy in resonance with the phonon () and off-resonance in the transparency range () from which the frequencies were extracted by taking the spectra of oscillatory signals. Both the time-domain dynamics and the Fourier spectra are shown in Fig. S8. The Fourier spectra show clear maxima corresponding to the spin precession mode, with a softening close to the phase transition temperature around .
.5 Dependence on the fluence of the pump pulse
The spin precession frequencies were extracted from the waveforms corresponding to resonant () and off-resonant () phonon excitation for different fluences. The results are shown in Fig. S9A. The frequency changes linearly with fluence in both magnetic phases for excitation in resonance with the phonon. For the off-resonant excitation, the frequency is nearly independent of the fluence. The corresponding time-dynamics from which these frequencies were extracted are shown in Fig. S9B-E.
.6 Time-evolution analysis of the soft-mode frequency
In order to reveal the dynamics of the altered spin precession frequency, we estimated its emergence and relaxation time, by performing a time-resolved analysis of the frequency of the spin oscillations. Figure S10a,b show time-resolved traces of the spin oscillations in the AFM and WFM phases. The fits with damped sine function were applied to time slices of the magnetic dynamics at consecutive time-delays following the resonant pump excitation and reveal a gradual change in the frequency. To obtain a deeper insight into the dynamics of the frequency we reduced the length of the section to approximately half of the spin precession period. The ultimate resolution of this method is limited to a half-period of the spin-precession time which amounts to around . The extracted values of the transient frequencies are shown in Fig. 2 in the main text. The uncertainty in x-values in this figure denote the width of the time window which was used for the fit.
S4 Phonon-driven control of the magneto-crystalline anisotropy
.1 Selective control of parameters defining the anisotropy
In order to study the impact of resonant pumping of the lattice vibrational mode on the temperature dependence of the spin precession frequency, we initially assume that the resonant excitation changes one of the two anisotropy parameters. These anisotropy parameter describe the magnetic potential (Eq. S1.) We introduce renormalized (transient) anisotropy parameters for which the equilibrium values get an addition and such that:
| (S3) | ||||
Figure S11a and S11b demonstrate the effect of each of these additives on the temperature dependence of the squared spin precession frequency . A qualitative comparison of these plots with the experimental data shown in Fig. S11C points that the phonon pumping mainly influences thee anisotropy parameter.
.2 Reconstructing the transient potential using spin precession
As the curvature at the potential minimum defines the frequency of the soft mode oscillations, we used the frequency of the spin precession excited by the ISRS-mechanism (off-resonant excitation at ) and by the phonon-pumping (resonant excitation at ) to reconstruct the exact profile of the potential function before () and after () the phonon-pumping. First we determined the strength of the temperature independent parameter by exploiting the fact that at the transition temperature the anisotropy parameters are coupled by the relation:
| (S4) |
Hence, the temperature-independent value of the anisotropy can be extracted from the square of the angular frequency exactly at , using Eq. S2 such that:
| (S5) |
The value of for the oscillations excited by the lattice pumping can be found by intersecting the squared frequency branches corresponding to the AFM and WFM phases as exemplified in Fig. S11C. The inset in this figure shows that is independent of the laser fluence and equals = , matching the value of the in equilibrium. This complies with our conclusions that the phonon-pumping does not affect . We used the following material parameters to extract the value of the energy:
| Parameters | Calculated value | |||||
|---|---|---|---|---|---|---|
| () Balbashov1985 | () | () Balbashov1985 | M0 (eV/(T u.c.)) | (THz/T) | () Treves1965 | (/u.c.) |
| 3.5 | 1565 | 8.0 | 0.028 | 262 | 40 | |
The value of was calculated to match the experimentally defined value of from Ref. Balbashov1985 with Eq. S5.
Once the value of the constant is known, the temperature dependence of the constant can be extracted using:
The results are presented in Fig. S12A and confirm that the phonon pumping changes the value of . The change is continuous at and follows a linear dependence on the pump fluence, see Fig. S12B. The evolution of the reconstructed magnetic potential before and after the excitation is shown in Fig. S13A and S13B, respectively.
.3 Effect of the laser fluence on the spin precession frequency and the anisotropy constant
The linear dependence of on the pump fluence signals a quadratic dependence on the amplitude of the electric field of the pump pulse. This can be easily understood if we consider the expansion of in a series of the normal phonon coordinate :
| (S6) |
with being phenomenological constants. The phonon coordinate is defined as , where and are the amplitude and the frequency of the infrared-active phonon, respectively. Since the frequency of the infrared-active phonon is significantly higher than the one of the spin precession (), Eq. S6 has to be time-averaged. The averaging shows that the phonon-driven additive is determined by the rectified part of the phonon-coordinate which depends quadratically on the amplitude , such that:
| (S7) |
Thereby it explains the observed quadratic dependence of the additive on the amplitude of the driving electric field. To explain a possible physical origin of this quadratic dependence we performed a set of the DFT simulations to find micorscopic sources of such nonlinear lattice-driven response.
S5. Nonlinear lattice dynamics and their effect on magnetic interactions
.1 Theory DFT simulations
.1.1 Technical details
We simulated the phase of \ceDyFeO3 through density functional theory (DFT) Hohenberg1964 ; Kohn1965 and its projected augmented wave (PAW) Blochl1994 flavour as implemented in the ABINIT package Gonze2002 ; abinit2016 ; Torrent2008 . The PAW atomic potentials used for \ceFe and \ceO were downloaded from the GBRV pseudopotential library Garrity2014 with , , , and , considered as valence states for \ceFe and \ceO respectively. For \ceDy we used the PAW atomic potential from M. Topsakal et al. Topsakal2014 , where the valence states are , , and (with electrons in the valence). We used the PBEsol GGA functional Perdew2008 for the exchange correlation interaction and Hubbard corrections Liechtenstein1995 on both \ceFe and \ceDy of respectively have been used to have the closest possible properties with respect to experiments (lattice constants). All the calculations were done with a 664 mesh of k-points for the reciprocal space and a cut-off energy on the plane wave expansion of 36 Hartree and 72 Hartree for the second finer grid inside the PAW spheres. To calculate the phonons, the frozen phonon technique has been used through the phonopy software Togo2015 .
| Phonon mode | () | ||||
|---|---|---|---|---|---|
| B1u(1) | 13.14 | ||||
| B1u(2) | 21.70 | ||||
| B1u(3) | 31.00 | ||||
| B1u(4) | 34.47 | ||||
| B1u(5) | 39.92 | ||||
| B1u(6) | 43.02 | ||||
| B1u(7) | 48.72 | ||||
| B1u(8) | 61.62 | ||||
| B1u(9) | 67.32 | ||||
| B2u(1) | 18.84 | ||||
| B2u(2) | 20.08 | ||||
| B2u(3) | 32.23 | ||||
| B2u(4) | 37.19 | ||||
| B2u(5) | 43.52 | ||||
| B2u(6) | 60.75 | ||||
| B2u(7) | 65.34 | ||||
| B3u(1) | 12.40 | ||||
| B3u(2) | 23.18 | ||||
| B3u(3) | 29.01 | ||||
| B3u(4) | 35.95 | ||||
| B3u(5) | 38.31 | ||||
| B3u(6) | 41.16 | ||||
| B3u(7) | 52.57 | ||||
| B3u(8) | 63.73 | ||||
| B3u(9) | 65.09 |
| Phonon mode | Ref. | Exp. | |||
| Ag(1) | 13.27 | 13.89 | 14.01 | ||
| Ag(2) | 16.49 | 16.74 | 17.36 | ||
| Ag(3) | 30.87 | 32.48 | 32.36 | ||
| Ag(4) | 40.67 | 41.16 | 42.28 | ||
| Ag(5) | 50.58 | 52.32 | 52.32 | ||
| Ag(6) | 50.58 | 51.45 | 51.70 | ||
| Ag(7) | 51.20 | 52.32 | 52.32 | ||
| Ag(8) | 59.51 | 60.75 | 61.49 | ||
| B1g(1) | 16.86 | 16.74 | – | ||
| B1g(2) | 30.38 | 31.00 | – | ||
| B1g(3) | 43.76 | 44.51 | 44.76 | ||
| B1g(4) | 51.95 | 52.94 | 52.94 | ||
| B1g(5) | 73.27 | 73.52 | – | ||
| B2g(1) | 13.27 | 13.51 | 13.76 | ||
| B2g(2) | 19.22 | 19.96 | 20.21 | ||
| B2g(3) | 36.95 | 38.56 | 40.29 | ||
| B2g(4) | 43.15 | 43.52 | – | ||
| B2g(5) | 58.77 | 59.76 | 61.25 | ||
| B2g(6) | 65.34 | 66.21 | – | ||
| B2g(7) | 75.63 | 75.88 | 77.36 | ||
| B3g(1) | 14.88 | 15.25 | – | ||
| B3g(2) | 38.06 | 38.56 | – | ||
| B3g(3) | 51.70 | 52.57 | 53.68 | ||
| B3g(4) | 56.41 | 57.03 | 58.77 | ||
| B3g(5) | 78.98 | 78.98 | 79.22 |
.1.2 Phonons
In Tables S2 and S3 we report calculated IR and Raman-active mode frequencies. Both the Raman and IR active modes are in good agreement with the experiments and previous DFT calculations done by Weber et al. Weber2016 . The few small deviations between our results and the previous calculations can be due to the use of different lattice parameters (experimental cell parameters were used by Weber et al. while we used relaxed PBEsol cell parameters), to the different PAW atomic potentials or because we used f-electrons in the valence for Dy.
.1.3 Phonon-phonon coupling model
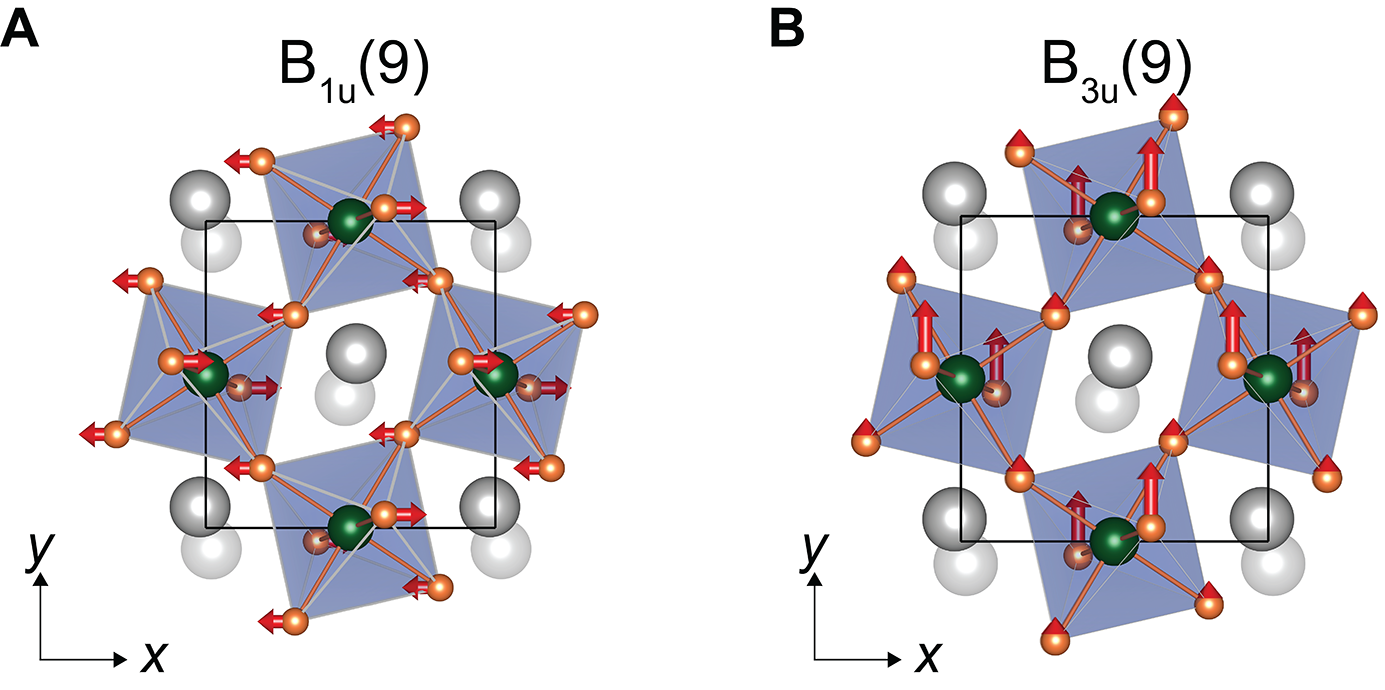
In our experiment the laser pulse excites the B1u(9) (Fig. S14A) and B3u(9) (Fig. S14B) modes having the highest frequencies. These two modes are polar in the and -directions and correspond to a stretching of the oxygen bonds.
We studied different possibilities of phonon-phonon coupling that can cause a change in the magnetic interactions.
One possibility is the nonlinear coupling of IR modes to other phononic modes, dubbed nonlinear phononics Mankowsky2014 ; Forst2011 . According to this mechanism when large-amplitude atomic vibrations are excited, a non-linear response sets in, causing a net shift of the lattice energy potential along a (Raman- or Infrared-active) normal mode coordinate for a time given by the lifetime of the infrared-active phonon. The ensuing net distortion can consequently change the magnetic interactions of \ceDy and \ceFe and result in spin reorientation. To determine the relevant nonlinear phonon-phonon couplings, we used the potential energy containing several anharmonic phonon-phonon interactions:
| (S8) |
In Eq. S8, are mode amplitudes of phonon mode X (X = IR,R) with eigenfrequencies . , , , and are coefficients fitted against DFT data in the spirit of Ref. Juraschek2017 .
We have considered the highest IR frequency B1u(9) mode excited by the laser and its couplings to each Ag mode because they are the first order couplings coming into play in the 20 atoms perovskite phase. The Ag mode label being invariant under all the symmetry operations of the crystal, any coupling order with this mode is allowed such that the lowest order coming is of the type . As one can see in Table S4, of all the coupling orders, the parameter gives the strongest coupling with the B1u mode.
| Coupled modes | CR | dIR | dR | ||
|---|---|---|---|---|---|
| B1u–Ag(1) | -0.004 | 0.0072 | 0.000 | 0.0681 | 0.000 |
| B1u–Ag(2) | 0.003 | 0.0072 | 0.000 | 0.1246 | 0.000 |
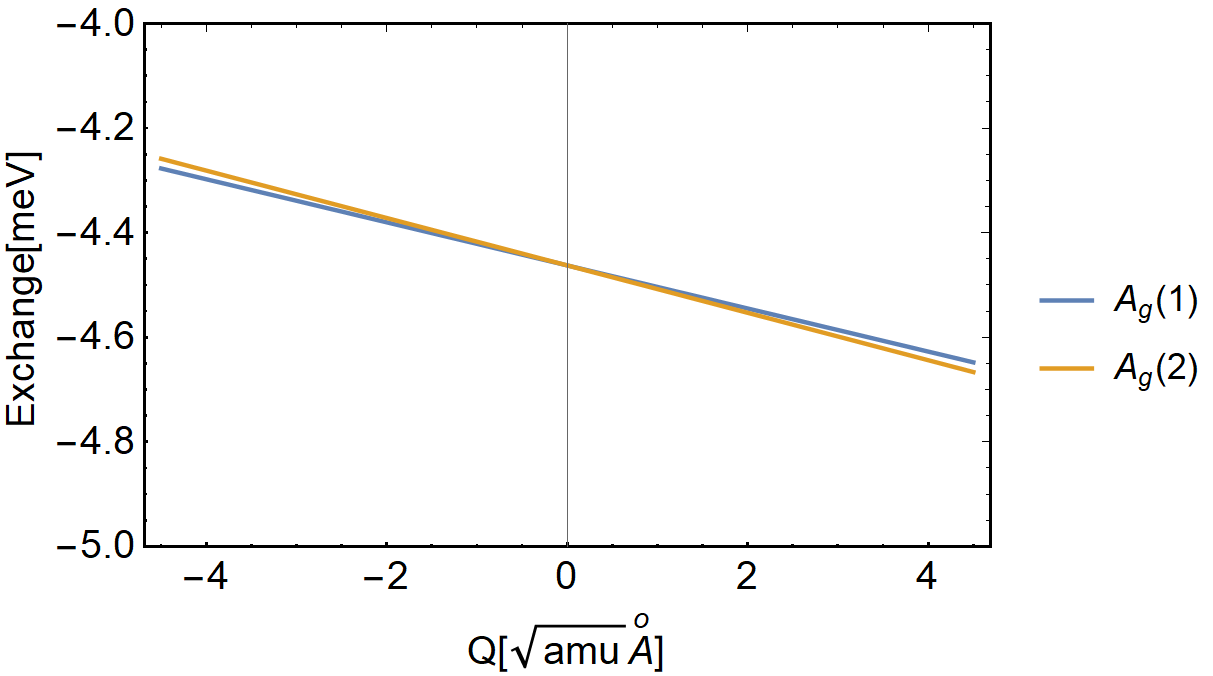
After having fitted the coupling coefficients between the B1u(9) mode and the Ag modes, we found that the second lowest frequency Ag(2) mode (see its schematic representation in Fig. S15B) gives the strongest coupling , closely followed by the first one Ag(1) (see Fig. S15A.)
This also shows that considering the lowest Ag mode frequency by default is not necessarily physically relevant since, for small frequency differences, if the coupling parameter is larger for the second highest frequency mode than for the first one, it can dominate the dynamics of the system.
The main difference between the Ag(1) and Ag(2) modes is in the way the antipolar motions of \ceDy ions are involved. Using the high symmetry reference cubic perovskite we can observe that the Ag(1) mode is dominated by the cubic X point antipolar motion mode of \ceDy atoms (with coordinate [1/2, 0, 0] of the cubic Brillouin zone and symmetry label X), while the Ag(2) mode is dominated by the R point mode (coordinate [1/2, 1/2, 1/2] of the cubic Brillouin zone and symmetry label R). By doing the same analysis for the B1u(9) mode, we found that this polar mode is dominated by the M cubic mode label involving oxygen octahedral rotations ( in Glazer notation Glazer1972 ) plus the polar mode label (with polarization direction along the direction) plus R antipolar motions of the \ceDy atoms. Note that the Dy atoms have a very small amplitude contribution to the mode eigenvector due to the fact that at high frequency they are much less involved in the phonon vibrations. The fact that the B(9) allows, by symmetry, antipolar motions of \ceDy of the same type as the Ag(2) mode (R label for both) can explain why this Ag(2) mode has a larger coupling with the B(9) mode than the Ag(1) mode.
.1.4 Magnetic interactions
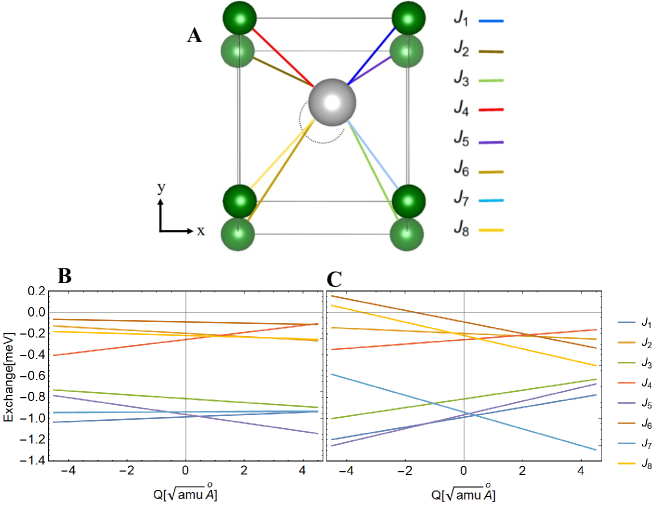
To study how the indirectly driven Ag modes can change the magnetic interaction between \ceDy and \ceFe, we used a Green’s function method to calculate the superexchange interaction as a function of the Ag modes amplitude following the scheme of Korotin et al. Korotin2015 . We report the evolution of the \ceDy-\ceFe and \ceFe-\ceFe superexchanges with respect to both Ag(1) and Ag(2) mode amplitudes.
We observe that the two Raman-active modes can drive different modifications of the Fe-Dy superexchange, which can be decomposed into eight contributions related to the eight Fe ions surrounding one Dy ion as shown in Fig. S16A. In Fig. S16B,C it is shown that for example, and have opposite trends with respect to both Ag(1) and Ag(2) mode condensation, while all the other have the same trend. We also note that the Ag(2) mode has a larger effect on the than the Ag(1) mode (a larger slope of the linear vs mode amplitude trend). Table S5 summarizes the linear variation of exchange with respect to the amplitude of the mode () for both \ceFe-\ceDy and \ceFe-\ceFe superexchanges. The Ag modes affect much more the \ceFe-\ceDy exchange than the \ceFe-\ceFe one, the \ceFe-\ceFe exchange variation being negligible.
| Exchange | Ag(1), % | Ag(2), % |
|---|---|---|
| J1 | -0.011 | -0.047 |
| J2 | 0.077 | 0.060 |
| J3 | 0.022 | -0.050 |
| J4 | -0.129 | -0.081 |
| J5 | 0.041 | -0.067 |
| J6 | 0.059 | 0.607 |
| J7 | -0.001 | 0.084 |
| J8 | 0.037 | 0.289 |
| Fe-Fe | 0.001 | 0.001 |
To have the net change in exchange interaction between each ion and its neighbours, we summed all the exchanges and fit the the data with a linear equation. Fig. S17 shows the change in this net superexchange for the Ag(1) and Ag(2) modes. As can be seen, the Ag(2) mode has a slightly larger slope compared to the A(1) mode and if we include the larger coupling of this mode to the B1u(9) mode we could say that this mode has bigger effect in modifying the interaction between \ceDy and \ceFe. However, both interactions result in a change with same sign and the final change in the superexchange will be the sum of the two contributions.
As stated before, the Ag(1) mode is dominated by cubic X-point antipolar motions of \ceDy while the Ag(2) mode is dominated mainly by the cubic R-point motions of \ceDy which might play a role in making the exchange interactions more sensitive to this mode. We thus conclude that it is the Ag(2) mode excitation which modifies the \ceFe-\ceDy superexchange in the \ceDyFeO3 dynamics the most and that it can be a driving force of the light-induced renormalization of the magnetic anisotropy potential.
.2 Experimental indications of nonlinear lattice dynamics
In order to gain insight in the structural dynamics induced after phonon excitation, the transient state of the sample was monitored through time-resolved second harmonic generation (SHG) of the probe pulse at the photon energy of in a reflection geometry. The SHG signal at a photon energy twice the original () was measured simultaneously with the rotation of the probe polarization plane in the transmission (Faraday geometry), as is schematically shown in Fig. S18A. In equilibrium, \ceDyFeO3 has a centrosymmetric structure at all temperatures and therefore no second harmonic signal is observed. However, as the pump pulse is tuned in resonance with the phonon mode, a transient, second harmonic signal appears, as shown in Fig. S18B. The strongly wavelength-dependent signal is not observed when the pump pulse energy is off-resonant with the phonon-mode. Examples of these traces are shown in Fig. S18C comparing on-resonant and off-resonant excitation. The wavelength-dependence implies that the second harmonic signal is phonon-driven and indicates the strong connection between phonon-excitation and the transient state of the lattice. An important note must be made that this signal had a strong dependence on the relative orientations of the pump and probe pulse polarization. The largest SHG signal was measured with orthogonal pump and probe polarization (and the measured component of the second harmonic signal parallel to the pump polarization). Compared to the polarization rotation of the transmitted probe (which was used to determine the time zero overlap with the pump), the signal shows a non-trivial delay, followed by a slow rise, peaking after around . Upon decay, oscillations in this signal appear after , which are shown in Fig.S18D. The FFT spectrum of this oscillatory signal is shown in Fig. S18E. The oscillations have a central frequency of (), close to the lowest-energy A(1) and B(1) mode (see Table S3 and Table S2). This is a strong indication that, following the concept of nonlinear phononics, excitation of the highest-energy lattice vibrations leads dynamics of lower energy modes.
S5. Ultrafast phonon-driven magnetic phase transition in
.1 Magnetic component of the transient dynamics
In the main text in Fig. 4, the Faraday rotation after phonon excitation is presented for a set of progressive excitation fluences. To avoid an influence of possible artefacts of nonmagnetic origin, we performed the measurements of polarization rotation in vicinity of the Morin transition at two polarities of the applied magnetic field . The Faraday rotation was then calculated as the difference
| (S9) |
This is exemplified in Fig. S19. It is this resulting Faraday rotation which was presented in Fig. 4 in the main text.
.2 Temperature and field dependence
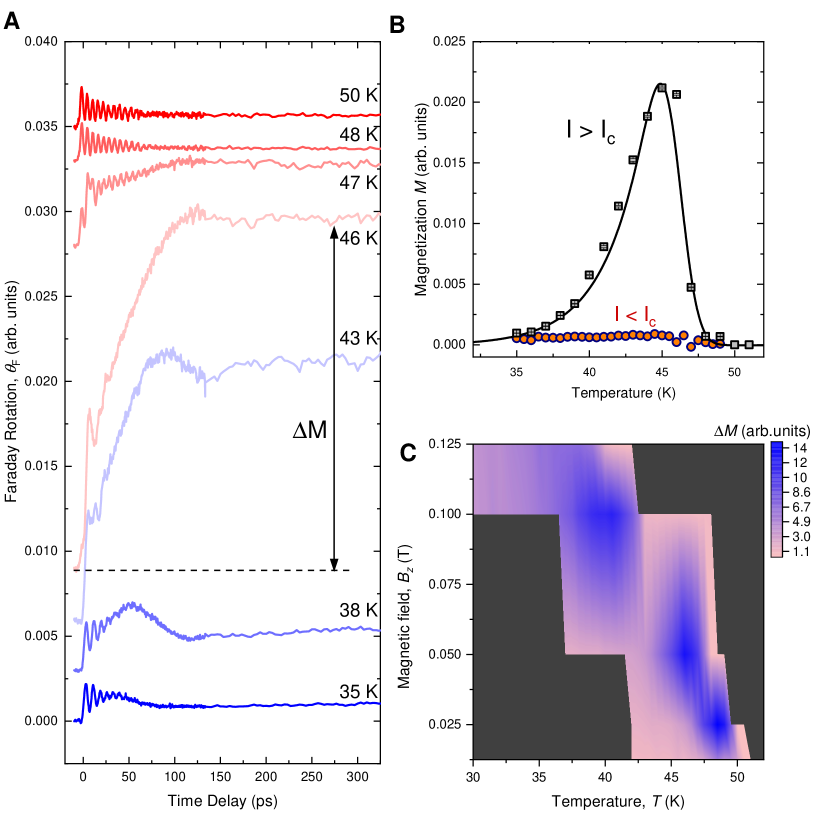
Figure S20a shows the magnetization dynamics after resonant phonon excitation for different temperatures for a pump fluence which exceeds the threshold value , . A substantial increase in the magnetic signal close to the transition is observed. It is this offset at long time delay vs. temperature which is shown in Fig. S20B. Similar measurements at a pump fluence below the threshold value led to the other data in this figure. The pump-probe measurements in which the phase transition from the AFM to the WFM state was studied, were all performed using a magnetic field. The field is necessary to lift the degeneracy of the WFM states having magnetization directed either parallel or antiparallel with the -axis. The applied field has an influence on the HT-region in which the transient phase transition is observed. This is shown in Fig. S20C, where the magnitude of the photo-induced magnetization is summarized for different applied magnetic fields and temperatures. The transition region shifts to lower temperatures with larger applied field, resembling the behaviour of the Morin temperature in equilibrium (see Fig. S2A).
.3 Non-thermal kinetics of the phonon-induced magneticc phase changes.
It is important to compare the observed kinetics of the ultrafast Morin phase transition launched via the phonon-pumping with those driven via a dissipative mechanism. Therefore we performed an auxiliary experiment in which the sample was excited with visible light having a photon energy of and , above the change-transfer electronic gap Wood1970 . Here the optical absorption is large (), see Fig. S5 and the transition is expected to be driven by the heat deposited in the medium. As was shown in the main text, Fig. 4D, the experiment shows that although the spin oscillations are launched nearly instantaneously for high photon energy excitation with pump fluences similar to those for the phonon-pumping, it takes more than before a photo-induced magnetization starts to appear and about to complete the growth. This is shown again in Fig. S21 and compared to the phase transition dynamics after excitation of the phonon mode. This indicates that the heat-driven evolution of the potential is significantly slower than the one guided by coherent pumping of the lattice. Note that the optical absorption at the above-bandgap energy of and especially is significantly larger than the optical absorption due to phonons at . The relatively slow dynamics can be explained by the slow heat transfer from the excited electrons to the electrons of \ceDy^3+, which determine the dynamics of the magnetic potential DeJong2011 . This kinetics stands in a sharp contrast with the one studied here by phonon pumping where the potential is altered on a timescale shorter than a single-cycle of the coherent spin precession. All this leads us to conclude that a very different mechanism from regular heating is at play in the case of phonon pumping.
.
References
- (1) S. Wolf, D. Awschalom, R. Buhrman, J. Daughton, S. Von Molnar, M. Roukes, A. Y. Chtchelkanova, and D. Treger. Spintronics: a spin-based electronics vision for the future. Science, 294(5546):1488–1495, 2001.
- (2) J. A. Mundy, C. M. Brooks, M. E. Holtz, J. A. Moyer, H. Das, A. F. Rébola, J. T. Heron, J. D. Clarkson, S. M. Disseler, Z. Liu, et al. Atomically engineered ferroic layers yield a room-temperature magnetoelectric multiferroic. Nature, 537(7621):523–527, 2016.
- (3) S. Manipatruni, D. E. Nikonov, C.-C. Lin, B. Prasad, Y.-L. Huang, A. R. Damodaran, Z. Chen, R. Ramesh, and I. A. Young. Voltage control of unidirectional anisotropy in ferromagnet-multiferroic system. Sci. Adv., 4(11):eaat4229, 2018.
- (4) D. G. Schlom, L.-Q. Chen, C. J. Fennie, V. Gopalan, D. A. Muller, X. Pan, R. Ramesh, and R. Uecker. Elastic strain engineering of ferroic oxides. MRS Bull., 39(2):118–130, 2014.
- (5) N. Spaldin and R. Ramesh. Advances in magnetoelectric multiferroics. Nat. Mater., 18:203–212, 03 2019.
- (6) M. Rini, N. Dean, J. Itatani, Y. Tomioka, Y. Tokura, R. W. Schoenlein, and A. Cavalleri. Control of the electronic phase of a manganite by mode-selective vibrational excitation. Nature, 449(7158):72–74, 2007.
- (7) D. Fausti, R. I. Tobey, N. Dean, S. Kaiser, A. Dienst, M. C. Hoffmann, S. Pyon, T. Takayama, H. Takagi, and A. Cavalleri. Light-induced superconductivity in a stripe-ordered cuprate. Science, 331(6014):189–191, 2011.
- (8) R. Mankowsky, A. Subedi, M. Först, S. O. Mariager, M. Chollet, H. T. Lemke, J. S. Robinson, J. M. Glownia, M. P. Minitti, A. Frano, M. Fechner, N. A. Spaldin, T. Loew, B. Keimer, A. Georges, and A. Cavalleri. Nonlinear lattice dynamics as a basis for enhanced superconductivity in YBa2Cu3O6.5. Nature, 516:71–73, 2014.
- (9) T. Kubacka, J. A. Johnson, M. C. Hoffmann, C. Vicario, S. De Jong, P. Beaud, S. Grübel, S. W. Huang, L. Huber, L. Patthey, Y. D. Chuang, J. J. Turner, G. L. Dakovski, W. S. Lee, M. P. Minitti, W. Schlotter, R. G. Moore, C. P. Hauri, S. M. Koohpayeh, V. Scagnoli, G. Ingold, S. L. Johnson, and U. Staub. Large-amplitude spin dynamics driven by a thz pulse in resonance with an electromagnon. Science, 343(6177):1333–1336, 2014.
- (10) M. Mitrano, A. Cantaluppi, D. Nicoletti, S. Kaiser, A. Perucchi, S. Lupi, P. Di Pietro, D. Pontiroli, M. Riccò, S. R. Clark, D. Jaksch, and A. Cavalleri. Possible light-induced superconductivity in K3C60 at high temperature. Nature, 530:461–464, 2016.
- (11) A. Subedi, A. Cavalleri, and A. Georges. Theory of nonlinear phononics for coherent light control of solids. Phys. Rev. B, 89:220301, 2014.
- (12) M. Knap, M. Babadi, G. Refael, I. Martin, and E. Demler. Dynamical Cooper pairing in nonequilibrium electron-phonon systems. Phys. Rev. B, 94(21):214504, 2016.
- (13) T. F. Nova, A. Cartella, A. Cantaluppi, M. Först, D. Bossini, R. Mikhaylovskiy, A. V. Kimel, R. Merlin, and A. Cavalleri. An effective magnetic field from optically driven phonons. Nat. Phys., 13(2):132, 2017.
- (14) S. F. Maehrlein, I. Radu, P. Maldonado, A. Paarmann, M. Gensch, A. M. Kalashnikova, R. Pisarev, M. Wolf, P. M. Oppeneer, J. Barker, and T. Kampfrath. Dissecting spin-phonon equilibration in ferrimagnetic insulators by ultrafast lattice excitation. Sci. Adv., 4(7):eaar5164, 2018.
- (15) S. Schlauderer, C. Lange, S. Baierl, T. Ebnet, C. P. Schmid, D. C. Valovcin, A. K. Zvezdin, A. V. Kimel, R. V. Mikhaylovskiy, and R. Huber. Temporal and spectral fingerprints of ultrafast all-coherent spin switching. Nature, 569(7756):383–387, 2019.
- (16) A. Stupakiewicz, K. Szerenos, D. Afanasiev, A. Kirilyuk, and A. Kimel. Ultrafast nonthermal photo-magnetic recording in a transparent medium. Nature, 542(7639):71, 2017.
- (17) Y. Tokunaga, S. Iguchi, T. Arima, and Y. Tokura. Magnetic-field-induced ferroelectric state in DyFeO3. Phys. Rev. Lett., 101:097205, 2008.
- (18) T. Nakajima, Y. Tokunaga, Y. Taguchi, Y. Tokura, and T. H. Arima. Piezomagnetoelectric effect of spin origin in dysprosium orthoferrite. Phys. Rev. Lett., 115(19):1–5, 2015.
- (19) T. Yamaguchi. Theory of spin reorientation in rare-earth orthochromites and orthoferrites. J. Phys. Chem. Solids, 35(4):479–500, 1974.
- (20) D. Afanasiev, A. Zvezdin, and A. Kimel. Laser-induced shift of the Morin point in antiferromagnetic DyFeO3. Opt. Express, 23(18):23978–23984, 2015.
- (21) A. Zvezdin and V. Matveev. Theory of the magnetic properties of dysprosium orthoferrite. Sov. Phys. JETP, 50:543–548, 1979.
- (22) D. Afanasiev, B. Ivanov, A. Kirilyuk, Th. Rasing, R. Pisarev, and A. Kimel. Control of the ultrafast photoinduced magnetization across the Morin transition in DyFeO3. Phys. Rev. Lett, 116(9):097401, 2016.
- (23) T.-Y. Khim, M. Eom, J. Kim, B.-G. Park, J.-Y. Kim, and J.-H. Park. Strain control spin reorientation transition in DyFeO3/SrTiO3 epitaxial film. Appl. Phys. Lett., 99(7):072501, 2011.
- (24) S. Baierl, M. Hohenleutner, T. Kampfrath, A. Zvezdin, A. Kimel, R. Huber, and R. Mikhaylovskiy. Nonlinear spin control by terahertz-driven anisotropy fields. Nat. Photon., 10(11):715, 2016.
- (25) R. Mankowsky, M. Först, and A. Cavalleri. Non-equilibrium control of complex solids by nonlinear phononics. Rep. Prog. Phys., 79(6):064503, 2016.
- (26) M. Fechner, A. Sukhov, L. Chotorlishvili, C. Kenel, J. Berakdar, and N. A. Spaldin. Magnetophononics: Ultrafast spin control through the lattice. Phys. Rev. Mat., 2(6):64401, 2018.
- (27) R. Yusupov, T. Mertelj, V. V. Kabanov, S. Brazovskii, P. Kusar, J.-H. Chu, I. R. Fisher, and D. Mihailovic. Coherent dynamics of macroscopic electronic order through a symmetry breaking transition. Nat. Phys., 6:681–684, August 2010.
- (28) K. Yamaguchi, T. Kurihara, H. Watanabe, M. Nakajima, and T. Suemoto. Dynamics of photoinduced change of magnetoanisotropy parameter in orthoferrites probed with terahertz excited coherent spin precession. Phys. Rev. B, 92:064404, Aug 2015.
- (29) A. Kalashnikova, A. Kimel, R. Pisarev, V. Gridnev, A. Kirilyuk, and Th. Rasing. Impulsive generation of coherent magnons by linearly polarized light in the easy-plane antiferromagnet FeBO3. Phys. Rev. Lett., 99(16):167205, 2007.
- (30) A. Balbashov, A. Volkov, S. Lebedev, A. Mukhin, and A. Prokhorov. High-frequency magnetic properties of dysprosium orthoferrite. Zh. Eksp. Teor. Fiz, 88:974–987, 1985. [Sov. Phys. JETP 61 (3), 573 (1985)].
- (31) S.-W. Cheong and M. Mostovoy. Multiferroics: a magnetic twist for ferroelectricity. Nat. Mater., 6(1):13–20, 2007.
- (32) Y. Tokura, S. Seki, and N. Nagaosa. Multiferroics of spin origin. Rep. Prog. Phys., 77(7):076501, 2014.
- (33) A. Sell, A. Leitenstorfer, and R. Huber. Phase-locked generation and field-resolved detection of widely tunable terahertz pulses with amplitudes exceeding 100 MV/cm. Opt. Lett., 33(23):2767–2769, 2008.
- (34) A. Baltuška, T. Fuji, and T. Kobayashi. Controlling the carrier-envelope phase of ultrashort light pulses with optical parametric amplifiers. Phys. Rev. Lett., 88(13):133901, 2002.
- (35) D. Treves. Studies on orthoferrites at the weizmann institute of science. J. Appl. Phys., 36(3):1033–1039, 1965.
- (36) K. P. Belov, A. K. Zvezdin, A. M. Kadomtseva, and R. Levitin. Spin-reorientation transitions in rare-earth magnets. Physics-Uspekhi, 19(7):574–596, 1976.
- (37) V. V. Eremenko and N. Kharchenko. Magneto-optics of antiferromagnets. Phys. Rep., 155(6):379–401, 1987.
- (38) A. Maziewski and R. Szymczak. Visual observation of phase domains in dysprosium orthoferrite. J. Phys. D Appl. Phys., 10(4):L37–L39, 1977.
- (39) S. Gnatchenko, N. Kharchenko, P. Lebedev, K. Piotrowski, H. Szymczak, and R. Szymczak. Magneto-optical studies of HT phase diagram for DyFeO3 (H //a). J. Magn. Magn. Mater., 81(1-2):125–132, 1989.
- (40) R. Szymczak. Domain structure in single crystal ferromagnetic oxide films near the phase transitions. J. Magn. Magn. Mater., 35(1–3):243–248, 1983.
- (41) S. Gnatchenko, V. Eremenko, and N. Kharchenko. Anti-ferromagnetic boundary as a nucleation line of the weak ferromagnetic phase during the AFM-WFM phase-transition in disprosium ortho-ferrite. Fiz. Nizk. Temp+, 7(12):1535–1543, 1981.
- (42) D. Wood, J. Remeika, and E. Kolb. Optical spectra of rare-earth orthoferrites. J. Appl. Phys., 41(13):5315–5322, 1970.
- (43) P. Hohenberg and W. Kohn. Inhomogeneous electron gas. Phys. Rev., 136:B864–B871, 1964.
- (44) W. Kohn and L. J. Sham. Self-consistent equations including exchange and correlation effects. Phys. Rev., 140:A1133–A1138, 1965.
- (45) P. E. Blochl. Projector augmented-wave method. Phys. Rev. B, 50:17953, 1994.
- (46) X. Gonze, J.-M. Beuken, R. Caracas, F. Detraux, M. Fuchs, G.-M. Rignanese, L. Sindic, M. Verstraete, G. Zerah, F. Jollet, M. Torrent, A. Roy, M. Mikami, P. Ghosez, J.-Y. Raty, and D. Allan. First-principles computation of material properties: The ABINIT software project. Comput. Mater. Sci., 25:478–492, 11 2002.
- (47) X. Gonze, F. Jollet, F. A. Araujo, D. Adams, B. Amadon, T. Applencourt, C. Audouze, J.-M. Beuken, J. Bieder, A. Bokhanchuk, E. Bousquet, F. Bruneval, D. Caliste, M. Côté, F. Dahm, F. D. Pieve, M. Delaveau, M. D. Gennaro, B. Dorado, C. Espejo, G. Geneste, L. Genovese, A. Gerossier, M. Giantomassi, Y. Gillet, D. Hamann, L. He, G. Jomard, J. L. Janssen, S. L. Roux, A. Levitt, A. Lherbier, F. Liu, I. Lukac̆ević, A. Martin, C. Martins, M. Oliveira, S. Poncé, Y. Pouillon, T. Rangel, G.-M. Rignanese, A. Romero, B. Rousseau, O. Rubel, A. Shukri, M. Stankovski, M. Torrent, M. V. Setten, B. V. Troeye, M. Verstraete, D. Waroquiers, J. Wiktor, B. Xu, A. Zhou, and J. Zwanziger. Recent developments in the ABINIT software package. Comput. Phys., 205:106–131, 2016.
- (48) M. Torrent, F. Jollet, F. Bottin, G. Zerah, and X. Gonze. Implementation of the projector augmented-wave method in the ABINIT code: Application to the study of iron under pressure. Comput. Mater. Sci., 42:337–351, 2008.
- (49) K. F. Garrity, J. Bennett, K. Rabe, and D. Vanderbilt. Pseudopotentials for high-throughput DFT calculations. Comput. Mater. Sci., 81:446–452, 2014.
- (50) M. Topsakal and R. Wentzcovitch. Accurate projected augmented wave (PAW) datasets for rare-earth elements (RE = La-Lu). Comput. Mater. Sci., 95:263–270, 2014.
- (51) J. P Perdew, A. Ruzsinszky, G. Csonka, O. A Vydrov, G. E Scuseria, L. Constantin, X. Zhou, and K. Burke. Restoring the density-gradient expansion for exchange in solids and surfaces. Phys. Rev. Lett., 100:136406, 2008.
- (52) A. Liechtenstein, V. Anisimov, and J. Zaanen. Density-functional theory and strong interactions: Orbital ordering in Mott-Hubbard insulators. Phys. Rev. B, 52:R5467–R5470, 1995.
- (53) A. Togo and I. Tanaka. First principles phonon calculations in materials science. Scr. Mater., 108:1–5, 2015.
- (54) M. Weber, M. Guennou, H. J. Zhao, J. Iniguez, R. Vilarinho, A. Almeida, J. Moreira, and J. Kreisel. Raman spectroscopy of rare-earth orthoferrites RFeO3 (R=La, Sm, Eu, Gd, Tb, Dy). Phys. Rev. B, 94:214103, 2016.
- (55) M. Först, C. Manzoni, S. Kaiser, Y. Tomioka, Y. Tokura, R. Merlin, and A. Cavalleri. Nonlinear phononics as an ultrafast route to lattice control. Nat. Phys., 7(11):854, 2011.
- (56) D. M. Juraschek, M. Fechner, and N. A. Spaldin. Ultrafast structure switching through nonlinear phononics. Phys. Rev. Lett., 118(5), 2017.
- (57) A. M. Glazer. The classification of tilted octahedra in perovskites. Acta Cryst. B, B28:3384–3392, 1972.
- (58) D. M. Korotin, V. V. Mazurenko, V. I. Anisimov, and S. V. Streltsov. Calculation of exchange constants of the Heisenberg model in plane-wave-based methods using the Green’s function approach. Phys. Rev. B, 91:224405, 2015.
- (59) J. A. De Jong, A. V. Kimel, R. V. Pisarev, A. Kirilyuk, and T. Rasing. Laser-induced ultrafast spin dynamics in ErFeO3. Phys. Rev. B, 84(10):1–8, 2011.