Photon-driven broadband emission and RF injection locking of THz quantum cascade laser frequency combs
Abstract
We present homogeneous quantum cascade lasers (QCLs) emitting around 3 THz which display bandwidths up to 950 GHz with a single stable beatnote. Devices are spontaneously operating in a harmonic comb state, and when in a dense mode regime they can be injection locked at the cavity roundtrip frequency with very small RF powers down to -55 dBm. When operated in the electrically unstable region of negative differential resistance, the device displays ultra-broadband operation exceeding 1.83 THz () with high phase noise, exhibiting self-sustained, periodic voltage oscillations. The low CW threshold (115 A cm-2) and broadband comb operation () make these sources extremely appealing for on-chip frequency comb applications.
keywords:
terahertz, quantum cascade laser, frequency comb, injection locking, domain formationETH all]Institute of Quantum Electronics, Eidgenössische Technische Hochschule Zürich, Switzerland
\abbreviationsQCL, FC, THz
{tocentry}
![[Uncaptioned image]](/html/1912.00890/assets/ToC.png)
Injection Locking map, broad spectrum and sketch of a device.
1 Introduction
In recent years, quantum cascade lasers (QCLs) have become increasingly interesting as on-chip sources of mid-IR 1 and THz 2 frequency combs, with the main target of spectroscopic applications 3, 4, 5. The compact and all-integrated nature of these devices, combined with their high power-per-comb-tooth compared to difference frequency generation (DFG) combs derived from shorter wavelength sources, makes them ideal candidates for portable, high speed dual comb spectrometers 6, 7, 8. The THz devices display several interesting features, as the optical resonator based on a double metal provides a cutoff-free waveguide with a weak frequency depended figure of merit, making these devices well suited for ultra-broadband operation and dual comb spectroscopy 9, 10, 11. Latest developments in high temperature operation of THz QCLs 12 hold promise also for Peltier cooled operation of fundamental THz combs.
The extreme flexibility and wavelength agility of quantum cascade active regions has allowed for lasing over one octave from the same device 13, where different active regions have been combined into the same waveguide. The broadening of the gain spectrum and its shape can be engineered to minimise chromatic dispersion, which is the main limiting factor towards the achievement of a full octave spanning on-chip frequency comb 13. However, the heterogeneous cascade concept also comes with some drawbacks; the RF injection locking of these structures is generally more difficult with respect to the homogeneous ones 14, 15 and the design process is prone to uncertainties due to the need for precise matching of the current through the QCL sections.
2 THz QCL design & operation characteristics
We present here a QCL design which is derived from our previous 4 quantum well structure 16, optimized for wide bandwidth and low threshold operation. The design relies on a high degree of diagonality of the lasing transition. The lifetime of the upper state and the gain recovery time are also increased, as already experimentally verified for the previous, less diagonal structure showing a gain recovery time of 35 ps 17, significantly larger than the 10 ps found for a bound-to-continuum THz design under lasing operation in Ref. 18. The increased lifetime would in fact change the typically non-resonant optical response to modulation currents for QCLs towards a resonant one, making the design more prone to amplitude modulation up to tens of GHz. 19
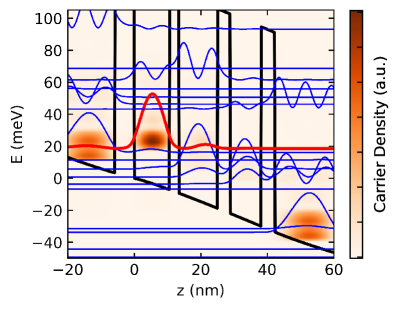
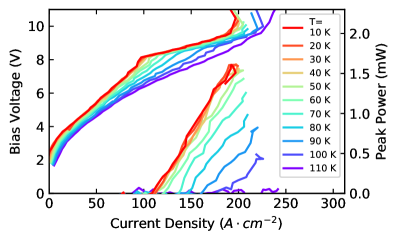
The bandstructure of one period of the laser is reported in Fig. 1. The heterostructure was grown by molecular beam epitaxy (MBE) on a semi insulating GaAs substrate in the GaAs/Al0.15Ga0.85As material system. Thermocompressive Au-Au (500/500 nm) wafer bonding on a receptor substrate was followed by dry-etching double-metal laser ridges with ICP and top metallization (Ti/Au, 10/200 nm). The ridges feature setbacks on either side for transverse mode control as reported in Ref. 20. In Fig. 2 we present the light-current-voltage (LIV) curve as a function of temperature for a 1.5 mm long and 70 m wide device operated with a pulse length of 1 at 100 kHz. For low temperatures we observe an uncorrected single-facet peak output power of 1.6 mW and a threshold current density of 110 A/cm2. The laser operates up to a maximum temperature of 100 K. As expected for strongly diagonal designs both in mid-IR 21 and THz QCLs 22 we observe a sharp kink in the IV curve at the laser threshold indicating a pronounced photon driven transport.
In the following, we present a series of measurements which are performed simultaneously, i.e. applied voltage and current in Figs. 3, 4 and 8 represent the same measurement run to provide the best correlation of the data. The QCL device was mounted in a flow cryostat, aligned to a Fourier transform infrared spectrometer (FTIR) (Bruker, Vertex 80v), powered by a CW current/voltage source (Keithley 2000 with an additional RC filter) over a bias-tee (SHF BT 45D, 1-45 GHz) and connected as well to a spectrum analyzer (SA) (Rohde&Schwarz, FSW 64) over the bias-tee. An additional bias connection allowed for observing the instantaneous voltage over the QCL with an oscilloscope (LeCroy, HDO6104). The SA and oscilloscope measurements were performed three times before spectrum acquisition and once afterwards for consistency check. In Fig. 3 (a) we plot a series of CW spectra as a function of applied bias to the laser. Here, the current source was switched to operate as a voltage source allowing to enter the normally inaccessible negative differential resistance (NDR) regime of the QCLs in CW (electronic circuit similar as in Ref. 23). The device is a relatively short Fabry-Perot cavity of 1.2 mm and 90 m width.
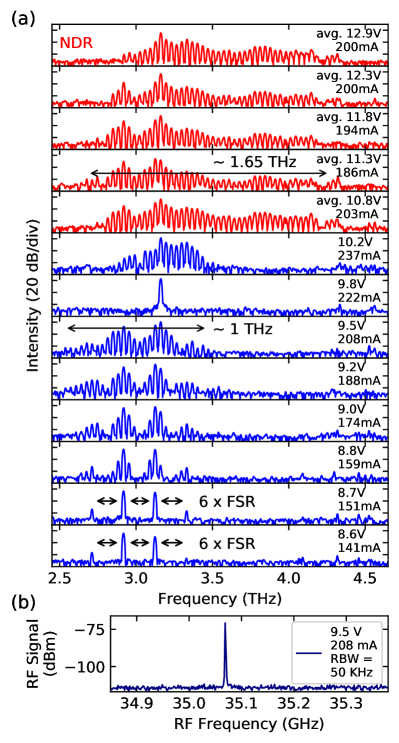
At low currents in Fig. 3 (a), corresponding to the first part of the dashed L-I curve in Fig. 4 (a) in black, the laser is spontaneously operating on the so-called harmonic state, recently demonstrated and discussed in mid-IR QCLs 24, 25. Such a lasing state is characterised by a spectrum displaying mode separations of several cavity roundtrip frequencies. Its origin lies in the interaction between population pulsations and population gratings in the laser cavity where a nonlinearity is present. We observe harmonic state signatures starting from a bias current of and a harmonic mode spacing of GHz. To fully prove the coherence of the modes a multi-heterodyne beat against another QCL comb would be necessary. After this harmonic state the emission spectrum evolves into a dense multimode state, progressively broadening to span from 2.53 THz to 3.47 THz for mA and 9.5 V. At the same time a single narrow beatnote is observed in Fig. 3 (b), indicating comb operation. At 215 mA the laser abruptly turns into single mode operation at 3.1 THz: in the IV curve in Fig. 4 (a) this is visible as a precursor to the strong NDR happening at mA.
Inside the NDR region the instantaneous CW bias voltage is in fact pulsating at RF frequencies, which we have measured by acquiring the bias drop on the laser with an oscilloscope.
These intensity pulsations group into two different regimes which have main frequency components of 54 MHz resp. 40 MHz and occur for applied voltages of 10.9 V to 11.2 V resp. 11.3 to 12.9 V. For each regime a typical time trace is presented in Fig. 4 (b) showing a stable intensity pulsation. Similar self-pulsations were already observed in a THz QCL under long current pulse driving close to the laser threshold, and was attributed to domain formation inside the device by Winge et al. 23 supported by a theoretical model (see also Ref. 23, 26, 27, 28, 29, 30, 31). A quantitative view with time resolved measurements is discussed in the next section. In this NDR regime the spectral output of the laser spans an extensive frequency range from 2.6 to 4.3 THz, about 1.7 THz which corresponds to a fractional with respect to the central frequency THz. Further devices showed lasing spanning over 1.83 THz in this regime, see Fig. 6 (a). This represents the highest relative frequency span for a homogeneous quantum cascade laser structure so far.

If the laser structure is driven in current mode, we observe a radically different behaviour; in Fig. 4 (a) we plot the overlap of 3 measurements each of the CW current driven IV of a lasing device for increasing (green) resp. decreasing (red) currents at 20 K together with one IV curve of a non-lasing structure (blue) at 40 K. The current is swept from zero to higher values in the lasing device up to 240 mA (223 A/ cm2, same value as for the voltage driven NDR). At NDR the device shows a hysteresis on the curves of lasing and non-lasing devices.
By calculating the differential resistance from the voltage driven IV curve in Fig. 4 (a) we can estimate the ratio by 32, 33
| (1) |
where resp. is the differential resistance above resp. below threshold, the lower state lifetime and with the upper state lifetime and the non-radiative lifetime. Entering the values from Fig. 4 (a) we find . This value is roughly twice that reported in Ref. 33 and indicates a long upper state lifetime. This result is also supported by the non-equilibrium Green’s function (NEGF) simulations in the following section, where the corresponding scattering rates calculated in the Wannier basis provides a ratio of 0.83 at 50 mV/period and = 150 K. Additionally, we find that the diagonal transition has a relatively low computed maximum oscillator strength between the upper state and the lower states of from the lasing threshold to the NDR.
3 Non-Equilibrium Green’s Function Simulation and Time-Resolved Spectrum
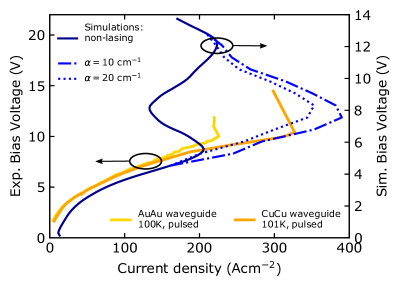
In order to explain the experimental observations of a pulsating laser in the NDR region, we now present NEGF 34 simulations of the laser under operation, as well as time-resolved spectrum measurements. In the NEGF formalism used here, the photo-induced current can be included by increasing the ac field strength in the simulations until the gain clamps at some assumed value for the total losses 35. At a lattice temperature of K there is still enough gain for significant photo-driven transport, even for losses as high as 10 cm-1 and 20 cm-1, as shown in Fig. 5. This performance is most likely overestimated since electron-electron scattering has been neglected in these simulations, which can significantly deteriorate the performance 36. The simulations show that the laser turns on at the first alignment peak close to 6 V, and the strong photo-induced current allows the laser to operate into the bias region where the non-lasing device shows NDR (indicated by the dark-blue dashed line). Such a clear NDR feature is not seen in the experimental non-lasing device driven in voltage mode, most likely because of leakage currents through high lying parasitic states. At a bias around 8 V the gain begins to drop and as a result so does the photo-driven current, which creates an NDR region for the lasing device where in the absence of lasing the differential resistance returns to positive values. Above this bias, the laser operates with high optical power in an unstable electrical region. This can explain the broad spectra observed in this bias region for the experimental device in Fig. 3, as the laser can alternate between different bias points at a constant current density. In addition, electric field domains can be formed where separate sections of the laser are biased with different voltages simultaneously.
Since the peak current density shows a strong temperature dependence a quantitative comparison between the simulated currents at 150 K with the LIV at low temperatures for the device employing Au-Au waveguide is not possible. Therefore, we also fabricated a device with a Cu-Cu waveguide which showed significant photo-driven transport even at 100 K cryostat temperature, as seen by the orange solid line in Fig. 5. Just as in the simulations, at the alignment bias where the slope of the IV curve flattens out, the device starts to lase and pushes the operation opposite to the non-lasing NDR region. At a higher bias, the current starts to again decrease as the gain diminishes. The difference in bias between the experimental and simulated curves is explained by an estimated contact Schottky bias drop of 0.9 V for the Au-Au device and 0.6 V for the Cu-Cu device, and an additional series resistance providing lower slope in the IV curve.
The LIV curve provides insights on the electrical origin of the self-pulsation, but additional gain simulations are necessary to explain the broadened spectrum. Also more sophisticated models rely on accurate gain predictions as explained in Ref. 23. Therefore, we now compare the simulated and experimental emission spectrum evolution in Fig. 6. Panel (a) presents the broadest spectrum spanning 1.83 THz of a 1.45 mm long device in the intensity pulsating regime with high phase noise. The spectrum is compared additionally to the electroluminescence measurement of a non-lasing device (short cavity of 0.345 mm) in Fig. 6 (b) and to the simulated gain in Fig. 6 (c). The bandwidths of the electroluminesence and the simulated gain agree reasonably with each other and as well with the minimal and maximal observed frequency in all measured devices indicated by the red dashed lines in (c). However, the bandwidth at a given bias point is significantly narrower than the spectrum in (a). In the simulation the 20 cm-1 contour line is marked to represent the estimated value of the waveguide losses. The simulated gain curve reproduces well the trend of frequency vs. bias, although the simulations predict emission at frequencies below 2.5 THz. Actually, the waveguide losses are non-uniform and increase for lower frequencies due to the presence of lossy side-absorbers and can explain the absence of lower modes in the experiments. In the inset of Fig. 6 (b) we plot an electroluminescence spectrum taken at 10 V bias where a 1 THz broad signal is measured agreeing with the 1 THz spectra observed in Fig. 3.

Connecting to the above discussion regarding laser operation in the photo-driven NDR region, combining the simulated spectra around 7 V with those around 10 V would reproduce a spectral width similar to that observed in Fig. 6 (a). A photo-driven domain formation could therefore explain the observed broad spectra in the high phase-noise regime. However, such a phenomenon would require a more sophisticated modeling as the different domains would affect the current-voltage relationship in an intricate manner.
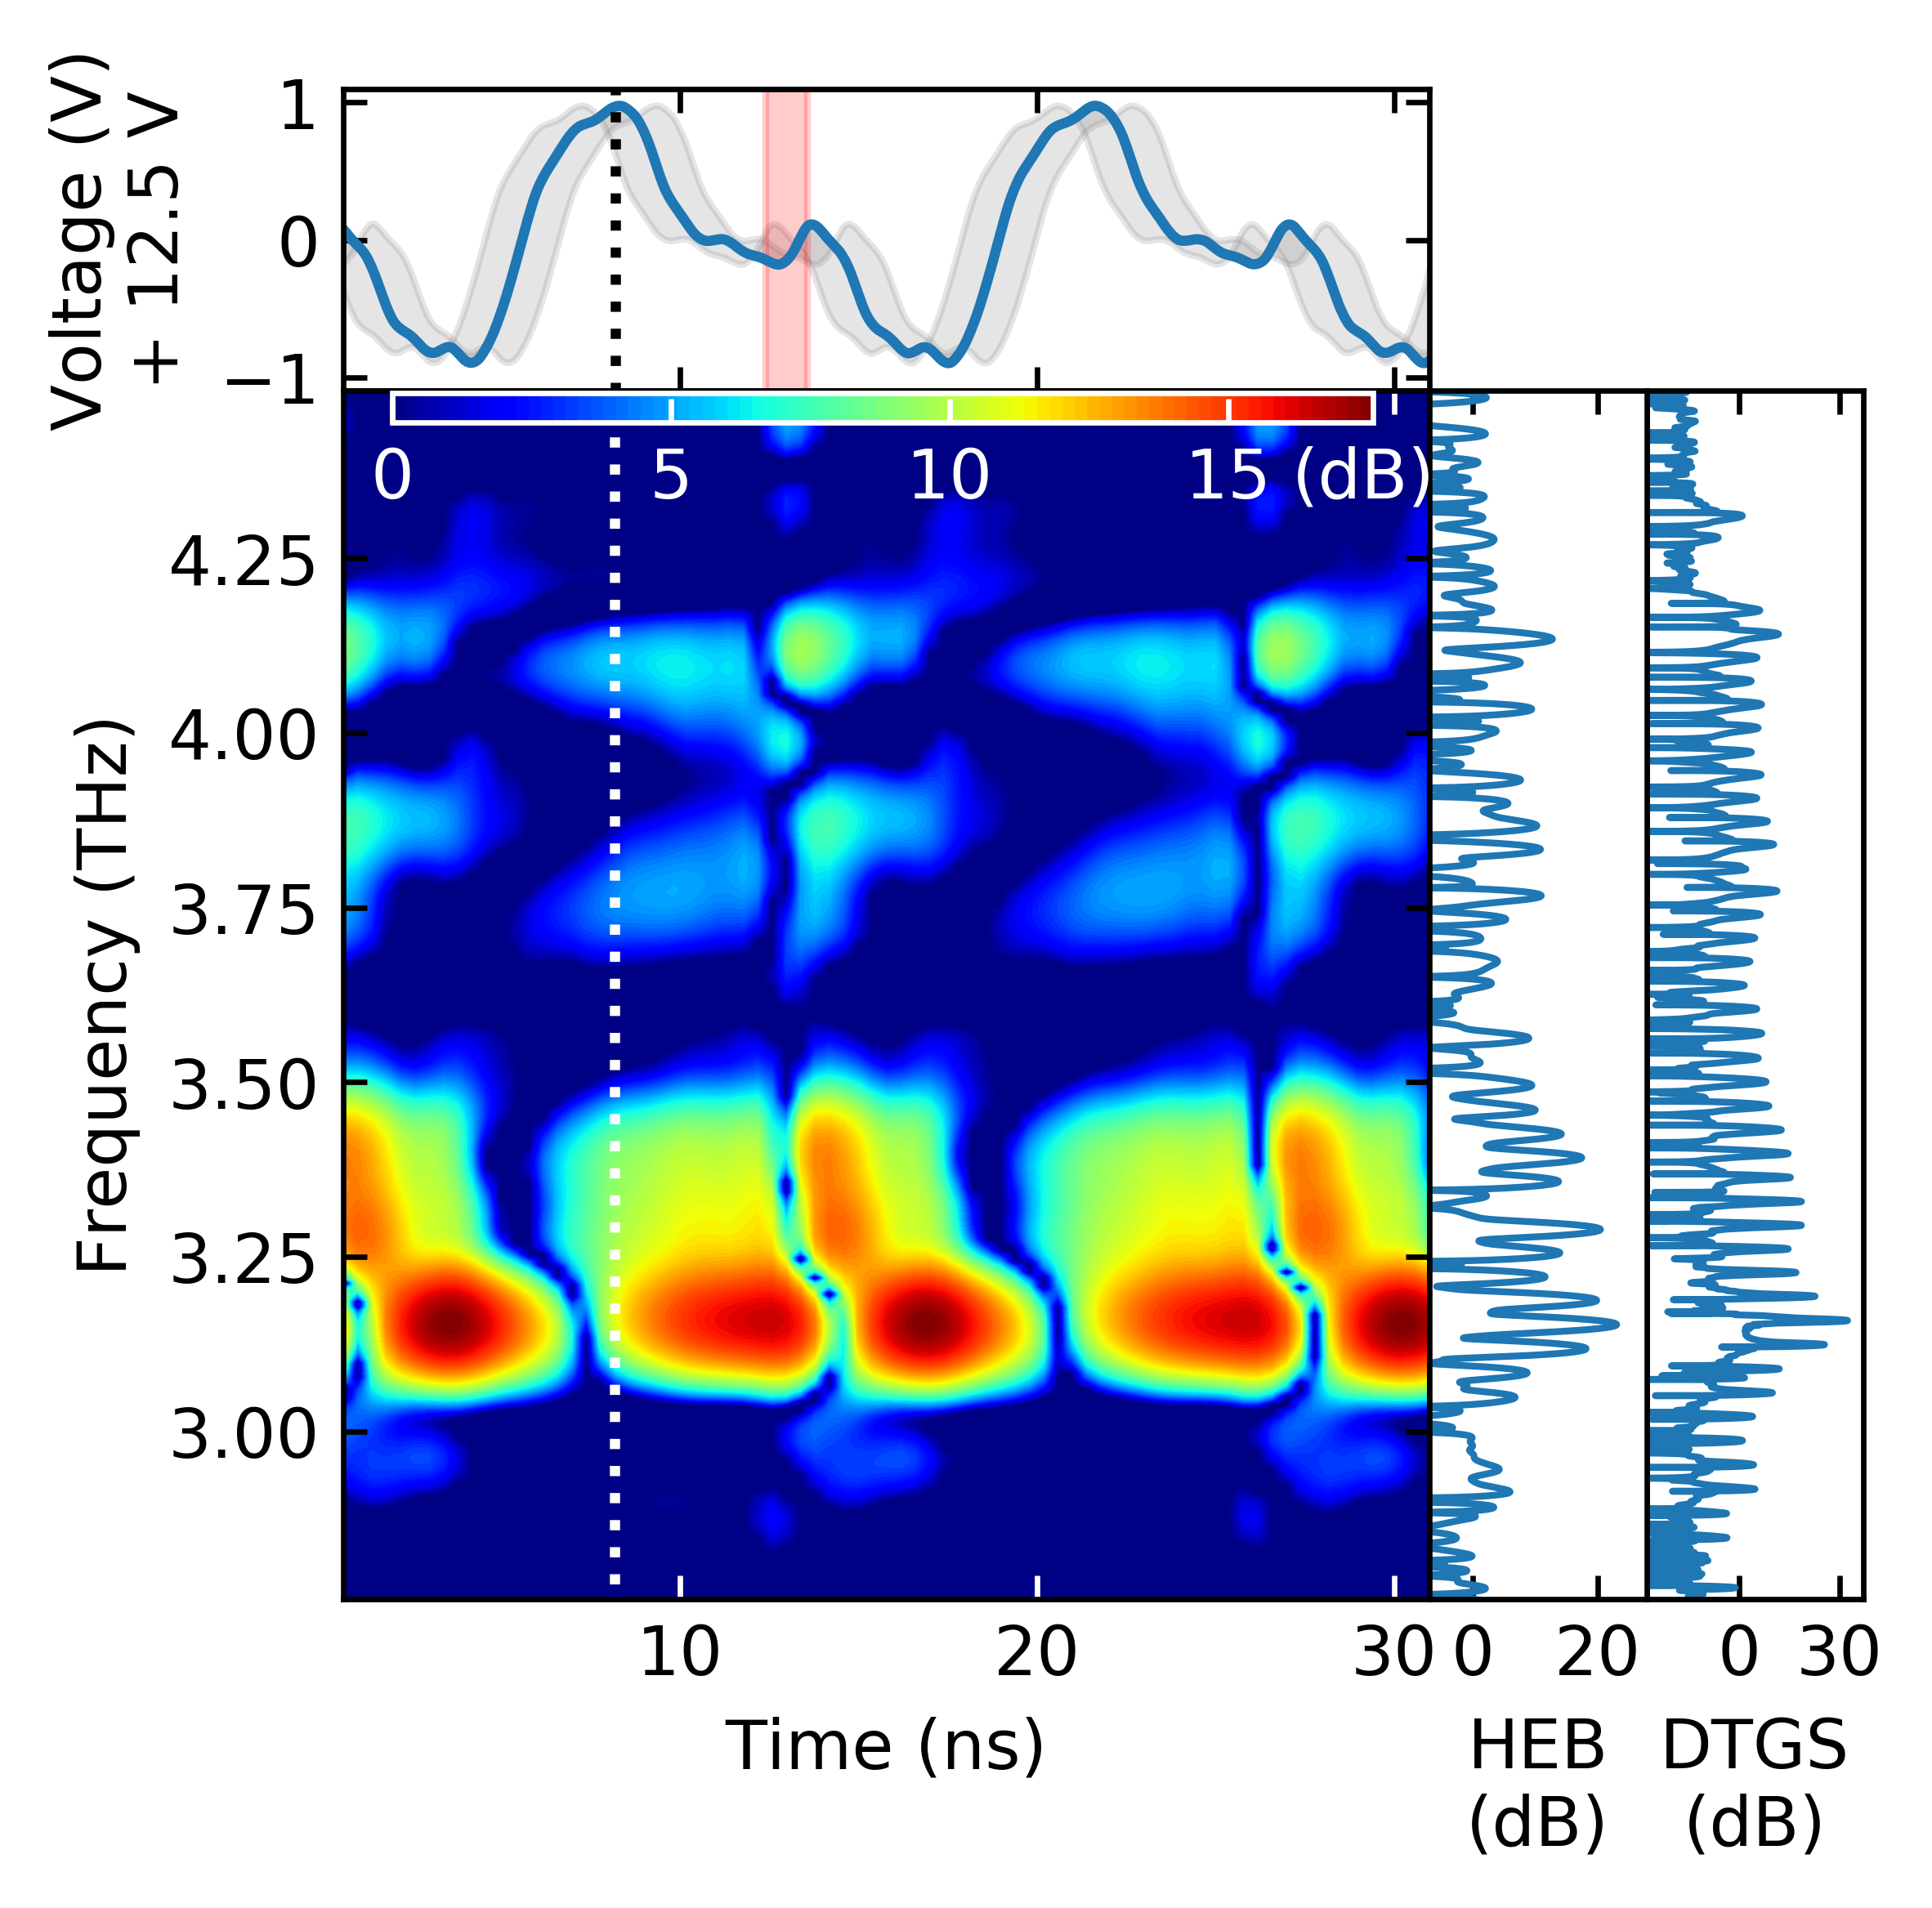
Nevertheless, spectral pulsation of the device can be directly measured due to the self-sustained pulsation of the bias voltage. Therefore, we perform a step-scan FTIR measurement with a fast detector (Superconducting Hot-Electron Bolometer (HEB) by Scontel) and trigger on the FTIR step followed by a trigger on the self-sustained oscillation with a fast oscilloscope. A 2 s long time trace of the detector and voltage signal is recorded and by post-processing sliced into the oscillation period length and averaged. A 20 ns time delay due to different travelling times for the voltage signal (cables) and detector signal (optical path + cables) is measured (cables) resp. calculated (optical path) and accounted for in the analysis. In the end we can reconstruct an interferogram for each point on the voltage oscillation, i.e as a function of time. Due to the detector’s 200 MHz amplifier bandwidth limit and signal-to-noise consideration the data is further averaged over 1.2 ns time intervals. The resulting spectrogram is shown in Fig. 7 together with the voltage signal (top) and the spectra from the total HEB signal and the reference measurement of the FTIR deuterated triglycine sulfate (DTGS) detector (right). The gray shaded area around the voltage oscillation indicates the uncertainty in the delay between voltage signal and spectrogram, whereas the red shaded region shows the 1.2 ns window for averaging. For visibility short interferograms are used for the spectrogram, whereas for the HEB spectrum (vertical side of Figure) the full interferogram length was taken. Therefore, the spectrogram shows the spectral regions which are present for each time step rather than the individual modes. An animation of the time resolved spectra, taking the hole interferogram, is provided in the supplementary material. From the spectrogram we deduce that there are clear periodic changes in the emission spectrum during one period of the voltage oscillation. These results suggest domain formation occuring inside the QCL, rather than the bias changing uniformly over the whole structure.
4 Injection locking & Coherence properties
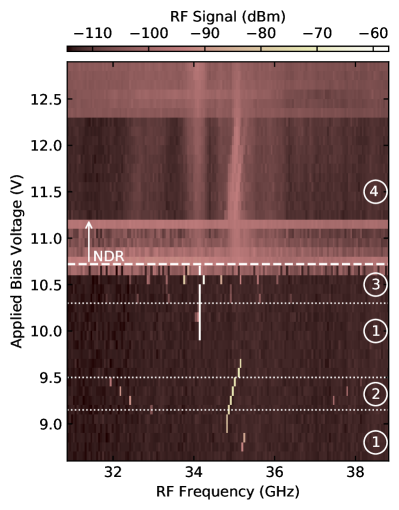
We now discuss the spectral coherence properties of the studied laser as a function of the different biasing regimes. In Fig. 8 we present a beatnote map recorded with a spectrum analyser which extracts the signal with a bias-tee from the bias line of the laser. The beatnote map was recorded simultaneously to the spectra in Fig. 3 (a) and the data is binned along the RF frequency axis to make the beatnote clearly visible in the colormap. Below the NDR there are regions where one (label (1)) or several extremely narrow beatnotes (label (2), (3)) appear. In the regions labeled as (2) resp. (3) the multi-mode appearance is actually sidebands of the main narrow beatnote 14 which are amplitude resp. frequency modulated. When the laser enters the NDR region the beatnote broadens, showing that the laser is operating in a high phase noise regime labeled as (4). Here, two broad signals can be observed around 34 GHz and 35 GHz, respectively. Each of these two signals have their corresponding narrow beatnote in the stable regimes (1) and (3) for the signal around 34 GHz, and regimes (1) and (2) for the signal around 35 GHz. This suggests that the broad spectrum observed in the NDR region is due to both the low-bias and high-bias regimes being present at the same time in the QCL.
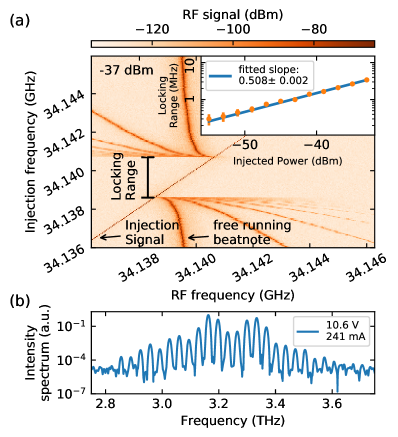
Providing the bias line with another bias-tee and employing a microwave generator we can investigate the frequency locking characteristics of the laser structures in the stable operating regime 37. The cryostat is equipped with 40 GHz RF cables and 18 GHz SMA connectors at the cryo finger connected to gold pads followed by gold wires to the QCL. The total losses from cables, bias-tee, connectors, gold pads and wires are estimated to be 25 dB around 35 GHz, deduced from transmission measurements. A typical injection locking map is reported in Fig. 9 (a) for an estimated injected microwave power of -37 dBm at the QCL. It is evident that the laser beatnote is pulled towards the injected signal and successively locked. The sidebands, which are generated, are typical for this kind of experiments 38. A maximum locking range of 4 MHz is achieved for an injected power of -33 dBm, where we injection lock more than 20 laser modes. The reported locking range as a function of the injected microwave power in the inset of Fig. 9 (a) shows a very good agreement with Adler’s model equation which describes the injection locking as a function of the Injected power, the RF quality factor of the slave resonator and the injection frequency 39. Our results compare well with the ones reported in Ref.15 where a THz QCL operating in double metal waveguide with a beatnote at very similar frequency was investigated. Our injection locking range is a factor of 10 smaller, and this could be ascribed to the non-optimal RF matching of our cryo head which translates into an effectively higher quality factor for the RF cavity. In Fig. 9 (b) we measured the spectrum of the lasing device at 241 mA, 10.6 V at 20 K under injection-locking with -26 dBm power at the laser. For these injection powers the emission spectra typically stayed unchanged.
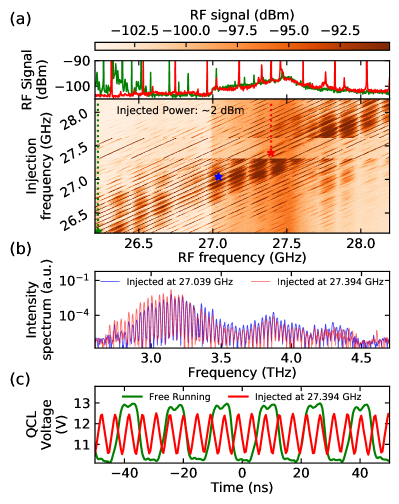
Furthermore, we investigate injection locking in the high phase noise regime, i.e. with a broad RF signal. Such a regime below the NDR is presented in Fig. 10 (a) in green, where the injection is still far from the RF signal. The injection power at the laser is estimated to be 2 dBm, and the signal is cut above -90 dBm and binned into groups of 5 along the RF frequency axis for visibility. The modulation of the injection sidebands along the RF frequency axis is due to the resonances of the circulator used . The abrupt kink at 27 GHz is an artifact from the spectrum analyzer. The high phase noise signal has an SNR of roughly 3 dBm and spans from 27 GHz to 27.6 GHz. By sweeping the injection frequency we observe multiple regions where the high phase noise signal can be locked or partially locked, i.e presence of side bands, to the reference signal. In these regions the noise floor is recovered as presented in Fig. 10 (a) in blue and red indicating locking of the modes. In the regime of locked beatnote we recorded the spectra, see Fig. 10 (b). We are clearly able to substantially change the emission spectrum depending on the injection frequency.

By switching the operation point to the NDR, i.e. having voltage oscillations, we repeat the previous injection locking experiment. The results are shown in Fig. 11. There are two main differences compared to the former: First, the injection signal shows many side modes and in the regime from 27.35 GHz to 27.65 GHz we observe a change in the side bands with keeping the high phase noise nearly unchanged. The side bands arise from the QCL voltage oscillation shown in Fig. 11 (c), green curve, whose main frequency component is 63 MHz, fitting to the side band spacing. Sweeping the injection frequency further, the side band spacing changes to 216 MHz, corresponding to new a voltage oscillation (red curve of Fig. 11 (c)). At this point the modes are not locked to the injection, as can be seen from the unchanged high phase noise. Comparing the spectra of the two oscillating regions we observe again a change in the spectra due to the injection. Interestingly the changed oscillation remains stable when switching off the injection signal, even in the presence of FTIR feedback. Hence, multiple stable solutions of the voltage oscillation and consequently of the domain formation exist for the same bias point.
5 Conclusion
We have presented a broadband, homogeneous THz QCL with a low current threshold. The emission bandwidth is roughly 1 THz with a simultaneously narrow and strong beatnote, indicating comb operation. By entering the NDR regime, lasing up to a bandwidth of nearly 1.83 THz was observed. A reasonable agreement of measured LIV and spectral width of the devices with NEGF simulation was found, which together with the time-resolved spectral measurements suggest domain formation inside the device as the origin of the observed wide emission spectrum and self-pulsations. Finally, the low power injection locking capability of the device was demonstrated and by a strong RF injection in the high phase noise regime we observed a clear influence on both the laser emission and the self-pulsating behaviour. Therefore, the presented active region design can serve as a building block towards broadband, on-chip, octave-spanning THz QCL combs40.
We acknowledge the financial support from H2020 European Research Council Consolidator Grant (724344) (CHIC) and (766719) (FLASH) and from Schweizerischer Nationalfonds zur Förderung der Wissenschaftlichen Forschung (200020-165639) as well as the help form P. Täschler and discussions with C. Sirtori and S. Barbieri.
Supporting Information Available:
-
•
Time-Resolved-Spectrum.mp4: The movie shows the spectral evolution in time with respect to the observed bias voltage oscillation. The data set is the same as for Fig.7 in the Manuscript but full length taken. It provides an alternative view on the measurement results.
This Material is available free of charge via Internet at http://pubs.acs.org
References
- Hugi et al. 2012 Hugi, A.; Villares, G.; Blaser, S.; Liu, H. C.; Faist, J. Mid-Infrared Frequency Comb Based on a Quantum Cascade Laser. Nature 2012, 492, 229–233
- Burghoff et al. 2014 Burghoff, D.; Kao, T.-Y.; Han, N.; Chan, C. W. I.; Cai, X.; Yang, Y.; Hayton, D. J.; Gao, J.-R.; Reno, J. L.; Hu, Q. Terahertz Laser Frequency Combs. Nat. Photonics 2014, 8, 462–467
- Scalari et al. 2019 Scalari, G.; Faist, J.; Picqué, N. On-Chip Mid-Infrared and THz Frequency Combs for Spectroscopy. Appl. Phys. Lett. 2019, 114, 150401
- Mottaghizadeh et al. 2017 Mottaghizadeh, A.; Gacemi, D.; Laffaille, P.; Li, H.; Amanti, M.; Sirtori, C.; Santarelli, G.; Hänsel, W.; Holzwart, R.; Li, L. H.; Linfield, E. H.; Barbieri, S. 5-Ps-Long Terahertz Pulses from an Active-Mode-Locked Quantum Cascade Laser. Optica, OPTICA 2017, 4, 168–171
- Wang et al. 2017 Wang, F. et al. Short Terahertz Pulse Generation from a Dispersion Compensated Modelocked Semiconductor Laser (Laser Photonics Rev. 11(4)/2017). Laser Photonics Rev. 2017, 11, 1770042
- Geiser et al. 2018 Geiser, M.; Klocke, J. L.; Mangold, M.; Allmendinger, P.; Hugi, A.; Jouy, P.; Horvath, B.; Faist, J.; Kottke, T. Single-Shot Microsecond-Resolved Spectroscopy of the Bacteriorhodopsin Photocycle with Quantum Cascade Laser Frequency Combs. Biophysical Journal 2018, 114, 173a
- Klocke et al. 2018 Klocke, J. L.; Mangold, M.; Allmendinger, P.; Hugi, A.; Geiser, M.; Jouy, P.; Faist, J.; Kottke, T. Single-Shot Sub-Microsecond Mid-Infrared Spectroscopy on Protein Reactions with Quantum Cascade Laser Frequency Combs. Anal. Chem. 2018, 90, 10494–10500
- Garrasi et al. 2019 Garrasi, K.; Mezzapesa, F. P.; Salemi, L.; Li, L.; Consolino, L.; Bartalini, S.; De Natale, P.; Davies, A. G.; Linfield, E. H.; Vitiello, M. S. High Dynamic Range, Heterogeneous, Terahertz Quantum Cascade Lasers Featuring Thermally Tunable Frequency Comb Operation over a Broad Current Range. ACS Photonics 2019, 6, 73–78
- Rösch et al. 2016 Rösch, M.; Scalari, G.; Villares, G.; Bosco, L.; Beck, M.; Faist, J. On-Chip, Self-Detected Terahertz Dual-Comb Source. Appl. Phys. Lett. 2016, 108, 171104
- Yang et al. 2016 Yang, Y.; Burghoff, D.; Hayton, D. J.; Gao, J.-R.; Reno, J. L.; Hu, Q. Terahertz Multiheterodyne Spectroscopy Using Laser Frequency Combs. Optica 2016, 3, 499
- Sterczewski et al. 2019 Sterczewski, L. A.; Westberg, J.; Wysocki, G. Computational Coherent Averaging for Free-Running Dual-Comb Spectroscopy. Opt. Express 2019, 27, 23875
- Bosco et al. 2019 Bosco, L.; Franckié, M.; Scalari, G.; Beck, M.; Wacker, A.; Faist, J. Thermoelectrically Cooled THz Quantum Cascade Laser Operating up to 210 K. Appl. Phys. Lett. 2019, 115, 010601
- Rösch et al. 2015 Rösch, M.; Scalari, G.; Beck, M.; Faist, J. Octave-Spanning Semiconductor Laser. Nat. Photonics 2015, 9, 42–47
- Li et al. 2015 Li, H.; Laffaille, P.; Gacemi, D.; Apfel, M.; Sirtori, C.; Leonardon, J.; Santarelli, G.; Rösch, M.; Scalari, G.; Beck, M.; Faist, J.; Hänsel, W.; Holzwarth, R.; Barbieri, S. Dynamics of Ultra-Broadband Terahertz Quantum Cascade Lasers for Comb Operation. Opt. Express, OE 2015, 23, 33270–33294
- Gellie et al. 2010 Gellie, P.; Barbieri, S.; Lampin, J.-F.; Filloux, P.; Manquest, C.; Sirtori, C.; Sagnes, I.; Khanna, S. P.; Linfield, E. H.; Davies, A. G.; Beere, H.; Ritchie, D. Injection-Locking of Terahertz Quantum Cascade Lasers up to 35GHz Using RF Amplitude Modulation. Opt. Express 2010, 18, 20799
- Amanti et al. 2009 Amanti, M. I.; Scalari, G.; Terazzi, R.; Fischer, M.; Beck, M.; Faist, J.; Rudra, A.; Gallo, P.; Kapon, E. Bound-to-Continuum Terahertz Quantum Cascade Laser with a Single-Quantum-Well Phonon Extraction/Injection Stage. New J. Phys. 2009, 11, 125022
- Derntl et al. 2018 Derntl, C. G.; Scalari, G.; Bachmann, D.; Beck, M.; Faist, J.; Unterrainer, K.; Darmo, J. Gain Dynamics in a Heterogeneous Terahertz Quantum Cascade Laser. Appl. Phys. Lett. 2018, 113, 181102
- Markmann et al. 2017 Markmann, S.; Nong, H.; Pal, S.; Fobbe, T.; Hekmat, N.; Mohandas, R. A.; Dean, P.; Li, L.; Linfield, E. H.; Davies, A. G.; Wieck, A. D.; Jukam, N. Two-Dimensional Coherent Spectroscopy of a THz Quantum Cascade Laser: Observation of Multiple Harmonics. Opt. Express 2017, 25, 21753
- Faist 2013 Faist, J. Quantum Cascade Lasers, first edition ed.; Oxford University Press, 2013; OCLC: ocn835962241
- Bachmann et al. 2016 Bachmann, D.; Rösch, M.; Süess, M. J.; Beck, M.; Unterrainer, K.; Darmo, J.; Faist, J.; Scalari, G. Short Pulse Generation and Mode Control of Broadband Terahertz Quantum Cascade Lasers. Optica, OPTICA 2016, 3, 1087–1094
- Faist et al. 1997 Faist, J.; Capasso, F.; Sirtori, C.; Sivco, D. L.; Hutchinson, A. L.; Cho, A. Y. Laser Action by Tuning the Oscillator Strength. Nature 1997, 387, 777–782
- Scalari et al. 2010 Scalari, G.; Amanti, M. I.; Walther, C.; Terazzi, R.; Beck, M.; Faist, J. Broadband THz Lasing from a Photon-Phonon Quantum Cascade Structure. Opt. Express, OE 2010, 18, 8043–8052
- Winge et al. 2018 Winge, D. O.; Dupont, E.; Wacker, A. Ignition of Quantum Cascade Lasers in a State of Oscillating Electric Field Domains. Phys. Rev. A 2018, 98
- Kazakov et al. 2017 Kazakov, D.; Piccardo, M.; Wang, Y.; Chevalier, P.; Mansuripur, T. S.; Xie, F.; Zah, C.-e.; Lascola, K.; Belyanin, A.; Capasso, F. Self-Starting Harmonic Frequency Comb Generation in a Quantum Cascade Laser. Nat. Photonics 2017, 11, 789
- Piccardo et al. 2018 Piccardo, M.; Chevalier, P.; Mansuripur, T. S.; Kazakov, D.; Wang, Y.; Rubin, N. A.; Meadowcroft, L.; Belyanin, A.; Capasso, F. The Harmonic State of Quantum Cascade Lasers: Origin, Control, and Prospective Applications. Opt. Express, OE 2018, 26, 9464–9483
- Wienold et al. 2011 Wienold, M.; Schrottke, L.; Giehler, M.; Hey, R.; Grahn, H. T. Nonlinear Transport in Quantum-Cascade Lasers: The Role of Electric-Field Domain Formation for the Laser Characteristics. J. Appl. Phys. 2011, 109, 073112
- Lu et al. 2006 Lu, S. L.; Schrottke, L.; Teitsworth, S. W.; Hey, R.; Grahn, H. T. Formation of Electric-Field Domains in Quantum Cascade Laser Structures. Phys. Rev. B 2006, 73
- Wacker 2002 Wacker, A. Semiconductor Superlattices: A Model System for Nonlinear Transport. Phys. Rep. 2002, 357, 1–111
- Bonilla and Grahn 2005 Bonilla, L. L.; Grahn, H. T. Non-Linear Dynamics of Semiconductor Superlattices. Rep. Prog. Phys. 2005, 68, 577–683
- Esaki and Tsu 1970 Esaki, L.; Tsu, R. Superlattice and Negative Differential Conductivity in Semiconductors. IBM J. Res. Dev. 1970, 14, 61–65
- Esaki and Chang 1974 Esaki, L.; Chang, L. L. New Transport Phenomenon in a Semiconductor "Superlattice". Phys. Rev. Lett. 1974, 33, 495–498
- Blaser et al. 2001 Blaser, S.; Diehl, L.; Beck, M.; Faist, J.; Oesterle, U.; Xu, J.; Barbieri, S.; Beltram, F. Characterization and Modeling of Quantum Cascade Lasers Based on a Photon-Assisted Tunneling Transition. IEEE J. Quantum Electron. 2001, 37, 448–455
- Scalari et al. 2009 Scalari, G.; Walther, C.; Fischer, M.; Terazzi, R.; Beere, H.; Ritchie, D.; Faist, J. THz and Sub-THz Quantum Cascade Lasers. Laser Photonics Rev. 2009, 3, 45–66
- Wacker et al. 2013 Wacker, A.; Lindskog, M.; Winge, D. O. Nonequilibrium Green’s Function Model for Simulation of Quantum Cascade Laser Devices Under Operating Conditions. IEEE J. Sel. Top. Quantum Electron. 2013, 19, 1–11
- Lindskog et al. 2014 Lindskog, M.; Wolf, J. M.; Trinite, V.; Liverini, V.; Faist, J.; Maisons, G.; Carras, M.; Aidam, R.; Ostendorf, R.; Wacker, A. Comparative Analysis of Quantum Cascade Laser Modeling Based on Density Matrices and Non-Equilibrium Green’s Functions. Appl. Phys. Lett. 2014, 105, 103106
- Franckié et al. 2018 Franckié, M.; Bosco, L.; Beck, M.; Bonzon, C.; Mavrona, E.; Scalari, G.; Wacker, A.; Faist, J. Two-Well Quantum Cascade Laser Optimization by Non-Equilibrium Green’s Function Modelling. Appl. Phys. Lett. 2018, 112, 021104
- Hillbrand et al. 2019 Hillbrand, J.; Andrews, A. M.; Detz, H.; Strasser, G.; Schwarz, B. Coherent Injection Locking of Quantum Cascade Laser Frequency Combs. Nature Photonics 2019, 13, 101–104
- St-Jean et al. 2014 St-Jean, M. R.; Amanti, M. I.; Bernard, A.; Calvar, A.; Bismuto, A.; Gini, E.; Beck, M.; Faist, J.; Liu, H. C.; Sirtori, C. Injection Locking of Mid-Infrared Quantum Cascade Laser at 14 GHz, by Direct Microwave Modulation. Laser Photonics Rev. 2014, 8, 443–449
- Siegman 1986 Siegman, A. E. Lasers; University Science Books, 1986
- Li et al. 2019 Li, H.; Li, Z.; Wan, W.; Zhou, K.; Liao, X.; Yang, S.; Wang, C.; Cao, J. C.; Zeng, H. Compact and real-time terahertz dual-comb spectroscopy using a self-detection scheme. 2019; \urlhttps://arxiv.org/abs/1904.03330v3