Pilot Hi Survey of Planck Galactic Cold Clumps with FAST
Abstract
We present a pilot Hi survey of 17 Planck Galactic Cold Clumps (PGCCs) with the Five-hundred-meter Aperture Spherical radio Telescope (FAST). Hi Narrow Self-Absorption (HINSA) is an effective method to detect cold Hi being mixed with molecular hydrogen H2 and improves our understanding of the atomic to molecular transition in the interstellar medium. HINSA was found in 58% PGCCs that we observed. The column density of HINSA was found to have an intermediate correlation with that of 13CO, following . Hi abundance relative to total hydrogen [Hi ]/[H] has an average value of , which is about 2.8 times of the average value of previous HINSA surveys toward molecular clouds. For clouds with total column density N cm-2, an inverse correlation between HINSA abundance and total hydrogen column density is found, confirming the depletion of cold Hi gas during molecular gas formation in more massive clouds. Nonthermal line width of 13CO is about 0-0.5 km s-1 larger than that of HINSA. One possible explanation of narrower nonthermal width of HINSA is that HINSA region is smaller than that of 13CO. Based on an analytic model of H2 formation and H2 dissociation by cosmic ray, we found the cloud ages to be within 106.7-107.0 yr for five sources.
Subject headings:
ISM: clouds — ISM: evolution — ISM: molecules.1. Introduction
Cold molecular cores/clumps is the cradle of star formation. Statistical properties of prestellar cores/clumps are beneficial for understanding general evolution progress of star formation. The Planck Catalogue of Galactic cold clumps (PGCCs) released by Planck satellite (Planck Collaboration et al. 2016) contains 13188 sources with dust temperature ranging from 5.8 to 20 K. These cold clumps, identified based on the 5’ beam of Planck, contain low-mass cores to large molecular clouds, providing us a chance of investigating star formation in various scales, from 0.1 to tens of pc.
Spectral observations toward PGCCs provide extra kinematic and chemical properties compared to multi-band continuum observations. Molecular line surveys have been taken in CO (1-0) (Wu et al. 2012; Liu et al. 2012, 2016, 2018), C2H (N=1-0) and N2H+ (J=1-0) (Liu et al. 2019), HCO+ and HCN (J=1-0) (Yuan et al. 2016). These molecular transitions are collisionally excited with critical density 103 cm-3, making them tracers of dense gas. With multiple tracers, the age of a cloud can be modeled through chemical reaction networks to reproduce the observed line ratio, e.g., [C2H]/[N2H+] (Pan et al. 2017; Liu et al. 2019). Such estimate, however, is hardly quantitative calculation and model dependent, due to the complexities of reaction networks and incomplete knowledge of key parameters, such as densities.
Hi could be a tracer of cloud age too. When a cloud cools and evolves, the abundance of Hi in the cloud decreases with time. Cosmic ray dissociation maintains a small content of Hi even in the central, dense region of molecular clouds, where Hi is shielded from being dissociated by UV photons and cools through collision with H2 (Solomon & Werner 1971; Goldsmith & Li 2005). The cold Hi appears as absorption against its bright Hi background and correlates with molecular emission. It is called Hi Narrow Self-Absorption (HINSA), and has been widely detected toward dark clouds in the Taurus/Perseus region and nearby molecular clouds (Li & Goldsmith 2003) and molecular clouds (Krčo & Goldsmith 2010). HINSA is a special case of Hi Self-Absorption (HISA), which is common and has been introduced as an effective tool to study Galactic Hi distribution (e.g., Gibson et al. 2000; Dickey et al. 2003; Kavars et al. 2003). HISA usually arises in cold neutral medium (CNM) from different mechanisms, e.g., temperature fluctuations, thus may not match with molecular emission. For the case of HINSA, it is closely associated with molecular clouds in terms of sky position, velocity, and non-thermal line width. With HINSA analysis, a “ring" of enhanced Hi abundance was clearly seen toward dark cloud B227 (Zuo et al. 2018).
With an instantaneous effective area of 300 m diameter, the Five-hundred-meter Aperture Spherical radio Telescope (FAST, Nan et al. 2011) located in Southern-west of China is the most sensitive radio telescope in Hi band. FAST began its commissioning after Sep 25, 2016. Its commissioning progress was reviewed in Jiang et al. (2019). The 19 beam receiver was installed on FAST in mid May of 2018. Spectral backend for the 19 beam receiver was installed in late July, 2018.
In this paper, we introduced pilot spectral observations with 19 beam receiver of FAST. The paper is structured as follows: Observation information is described in Section 2. Analysis of deriving physical parameters is shown in Section 3. The results and discussion are presented in Section 4. We summarize our conclusion in Section 5.
2. Observations and Data Archive
2.1. Observations of Hi
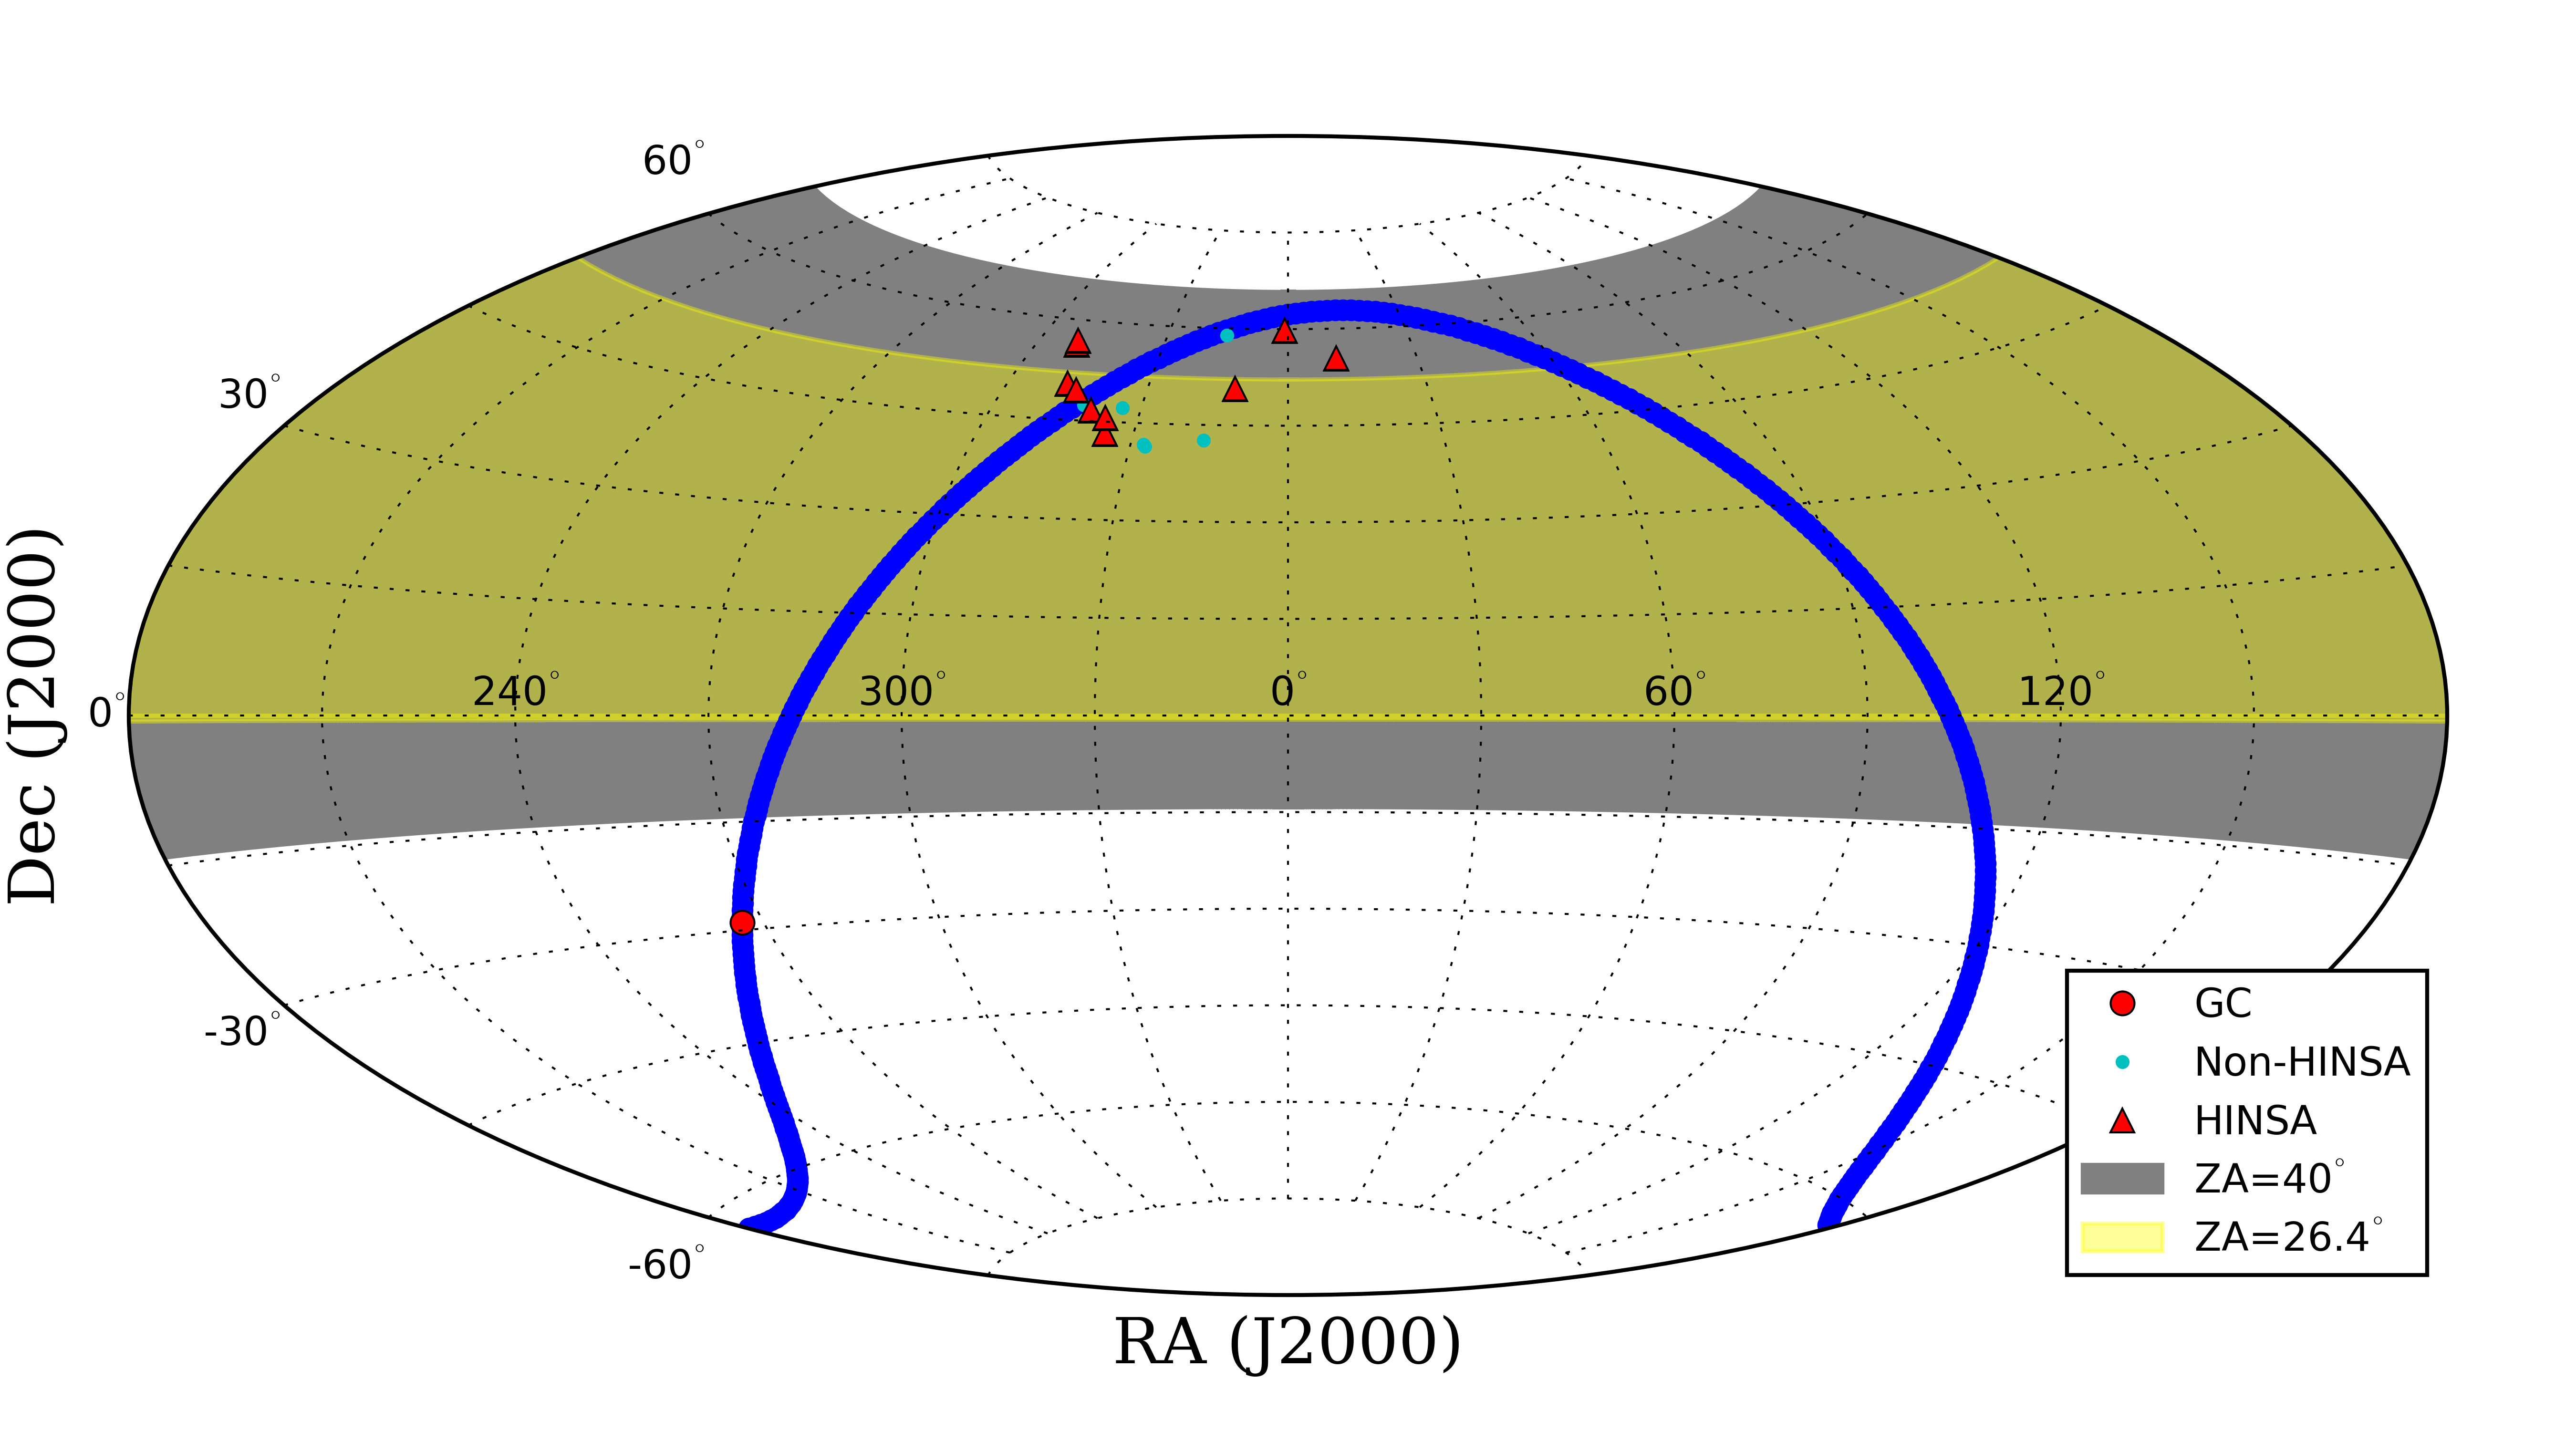
We selected our sources from the catalogue of Wu et al. (2012) and its followup survey projects, in which more than 674 PGCCs were observed in J=1-0 transition of CO and its isotopes. Two criteria were applied: (1) position of the source is within FAST sky coverage but is out of sky coverage of Arecibo 305m telescope; (2) strong CO emission is detected toward the source. Position distribution of observed 17 PGCCs is shown in Fig. 1.
The FAST observations were conducted between 2018 December 16 and 2019 January 2. We observed the Hi 1420.4058 MHz transition with the central beam of the 19-beam receiver on FAST, which corresponds to a beam width (Full Width at Half Maximum; FWHM) of 2.9 arcmin. The pointing error is 0.15 arcmin at 1420 MHz (Jiang et al. 2019).
Single pointing observations of PGCCs were taken with the narrow mode of spectral backend. This mode has 65536 channels in 31.25 MHz bandwidth, resulting in velocity resolution of 0.1 km s-1 at 1.420 GHz. Each source was integrated for 10 minutes with a sampling rate of 1.0066 s. For intensity calibration, noise signal with amplitude of 11 K was injected under a period of 2.0132 s, which is synchronized with sampling rate.
After intensity calibration, spectral baseline was removed by applying a linear fitting of line-free range within [-300,300] km s-1. During observations, system temperature was around 18 K. Reduced root mean square (rms) of the final spectrum is 35 mK, which is consistent with theoretical sensitivity calculation. FAST’s current setup does not include a local oscillator (LO), and therefore neither doppler tracking nor frequency switching are available.
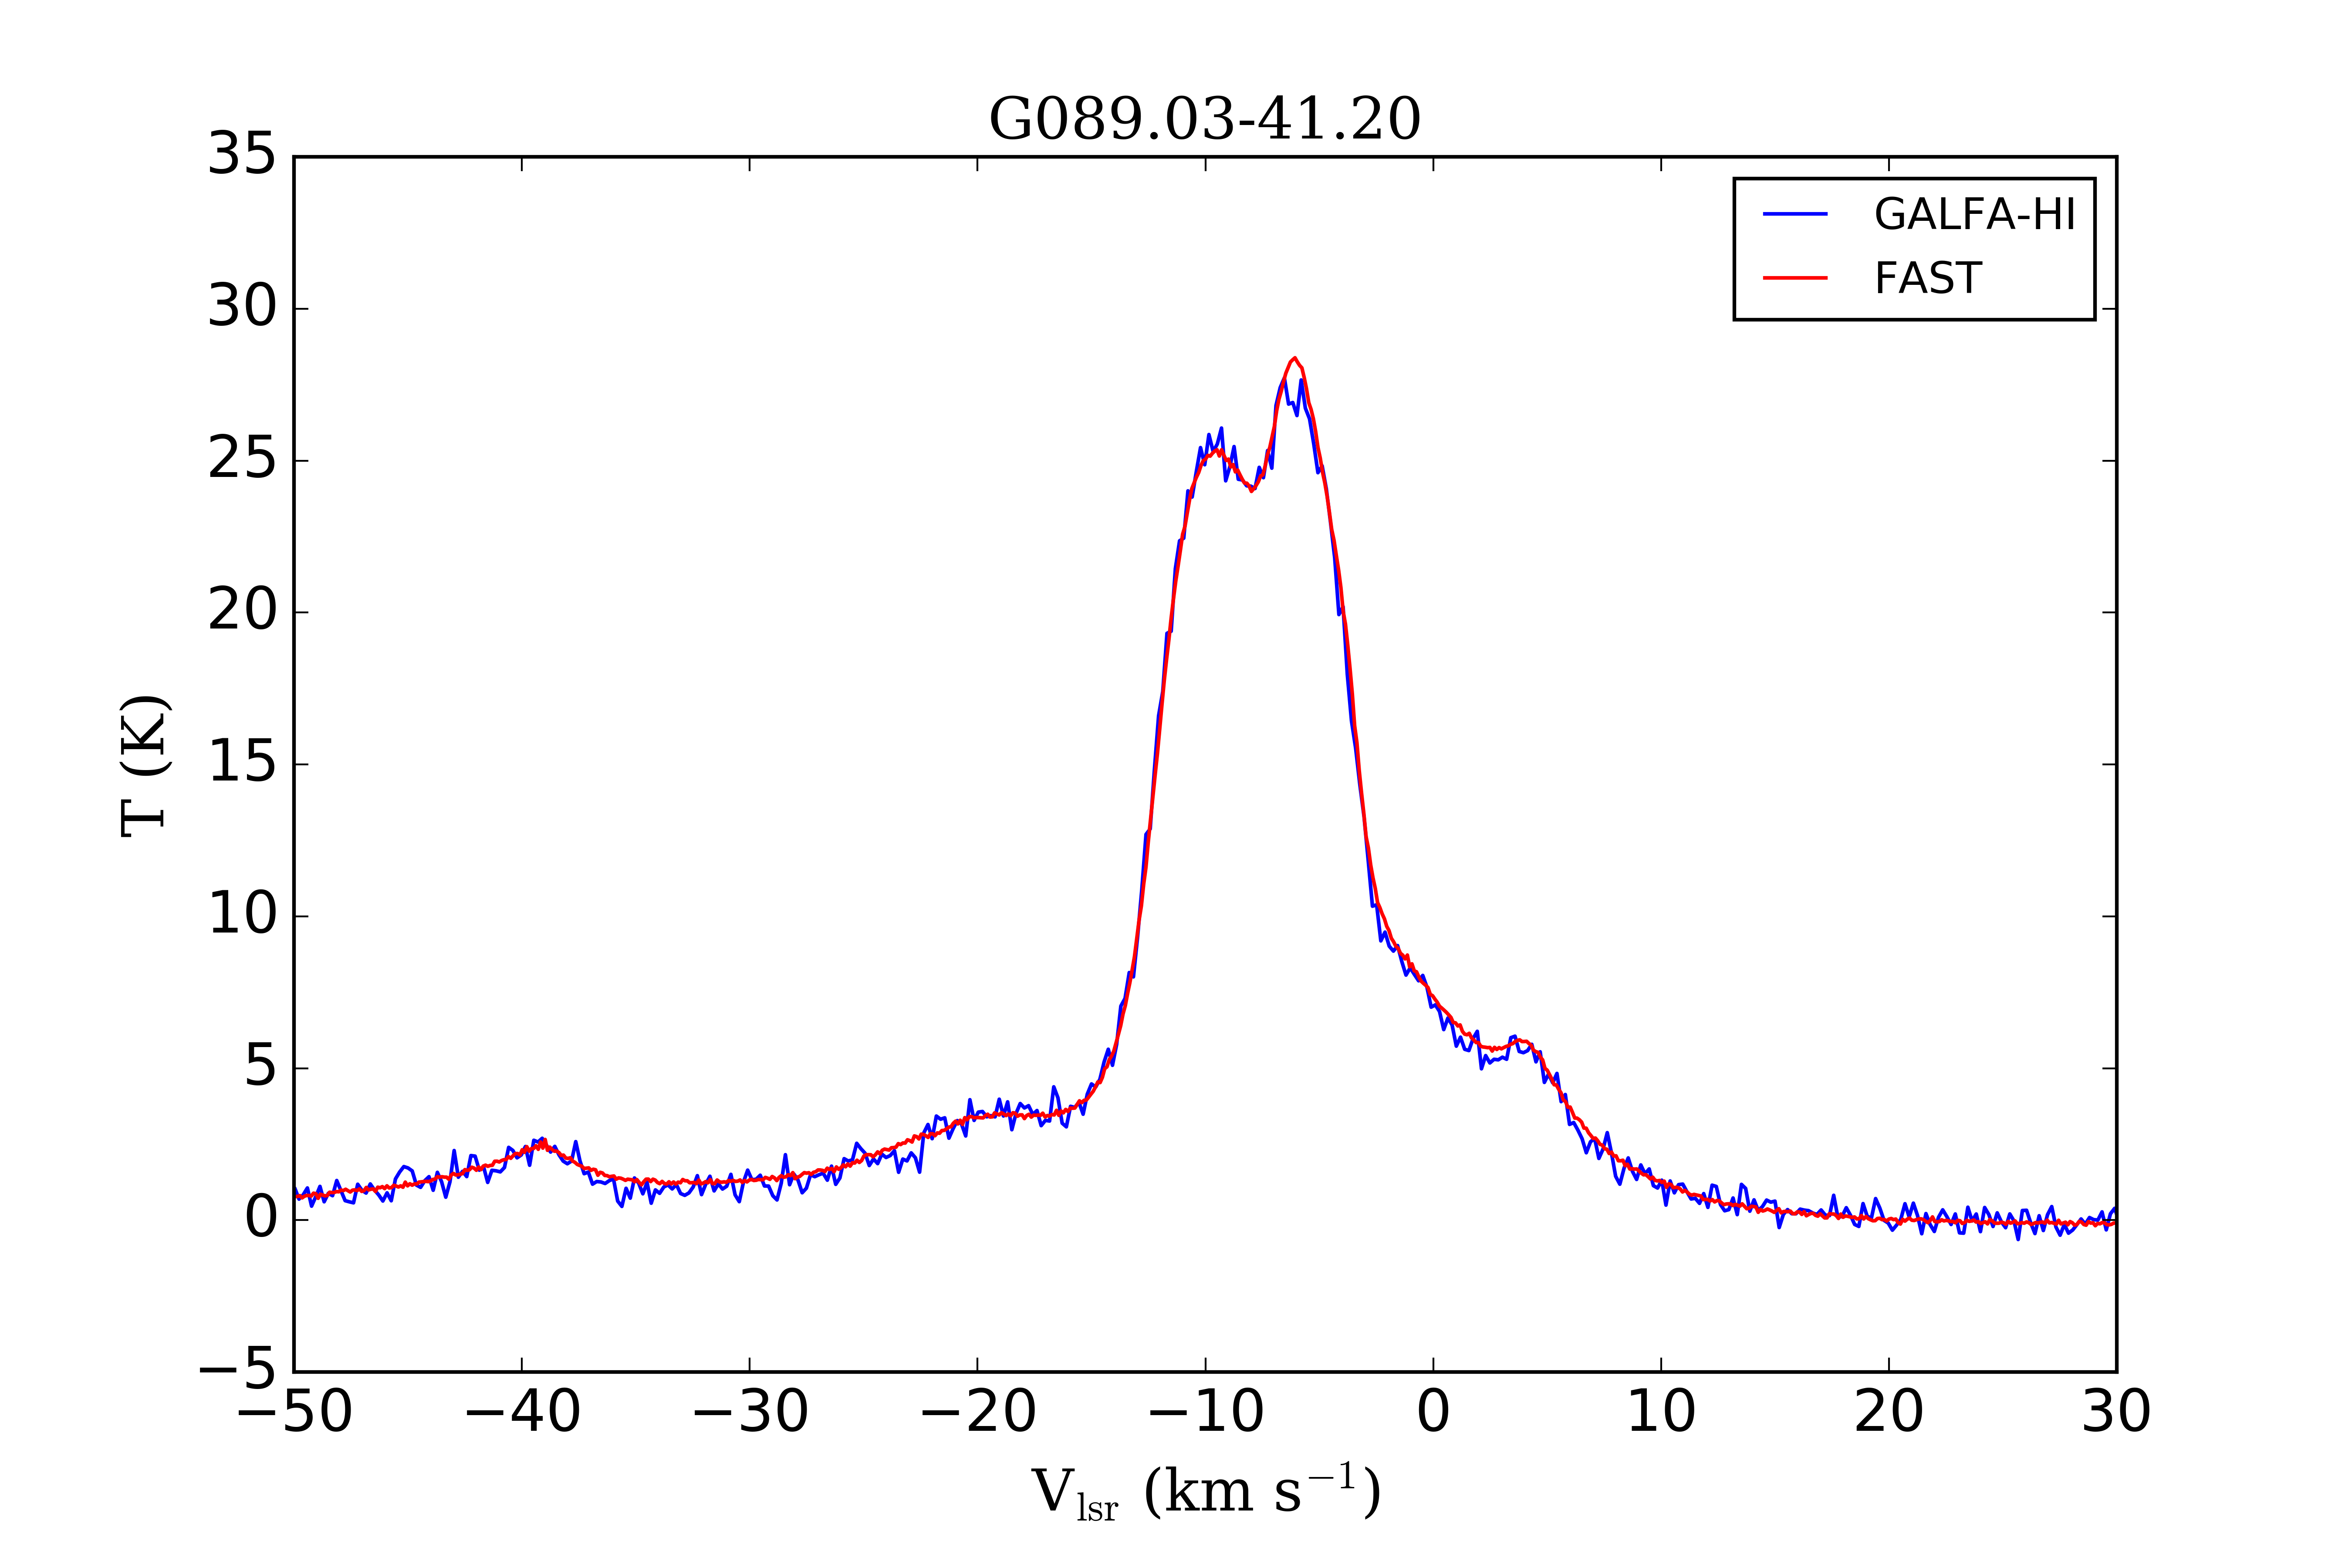
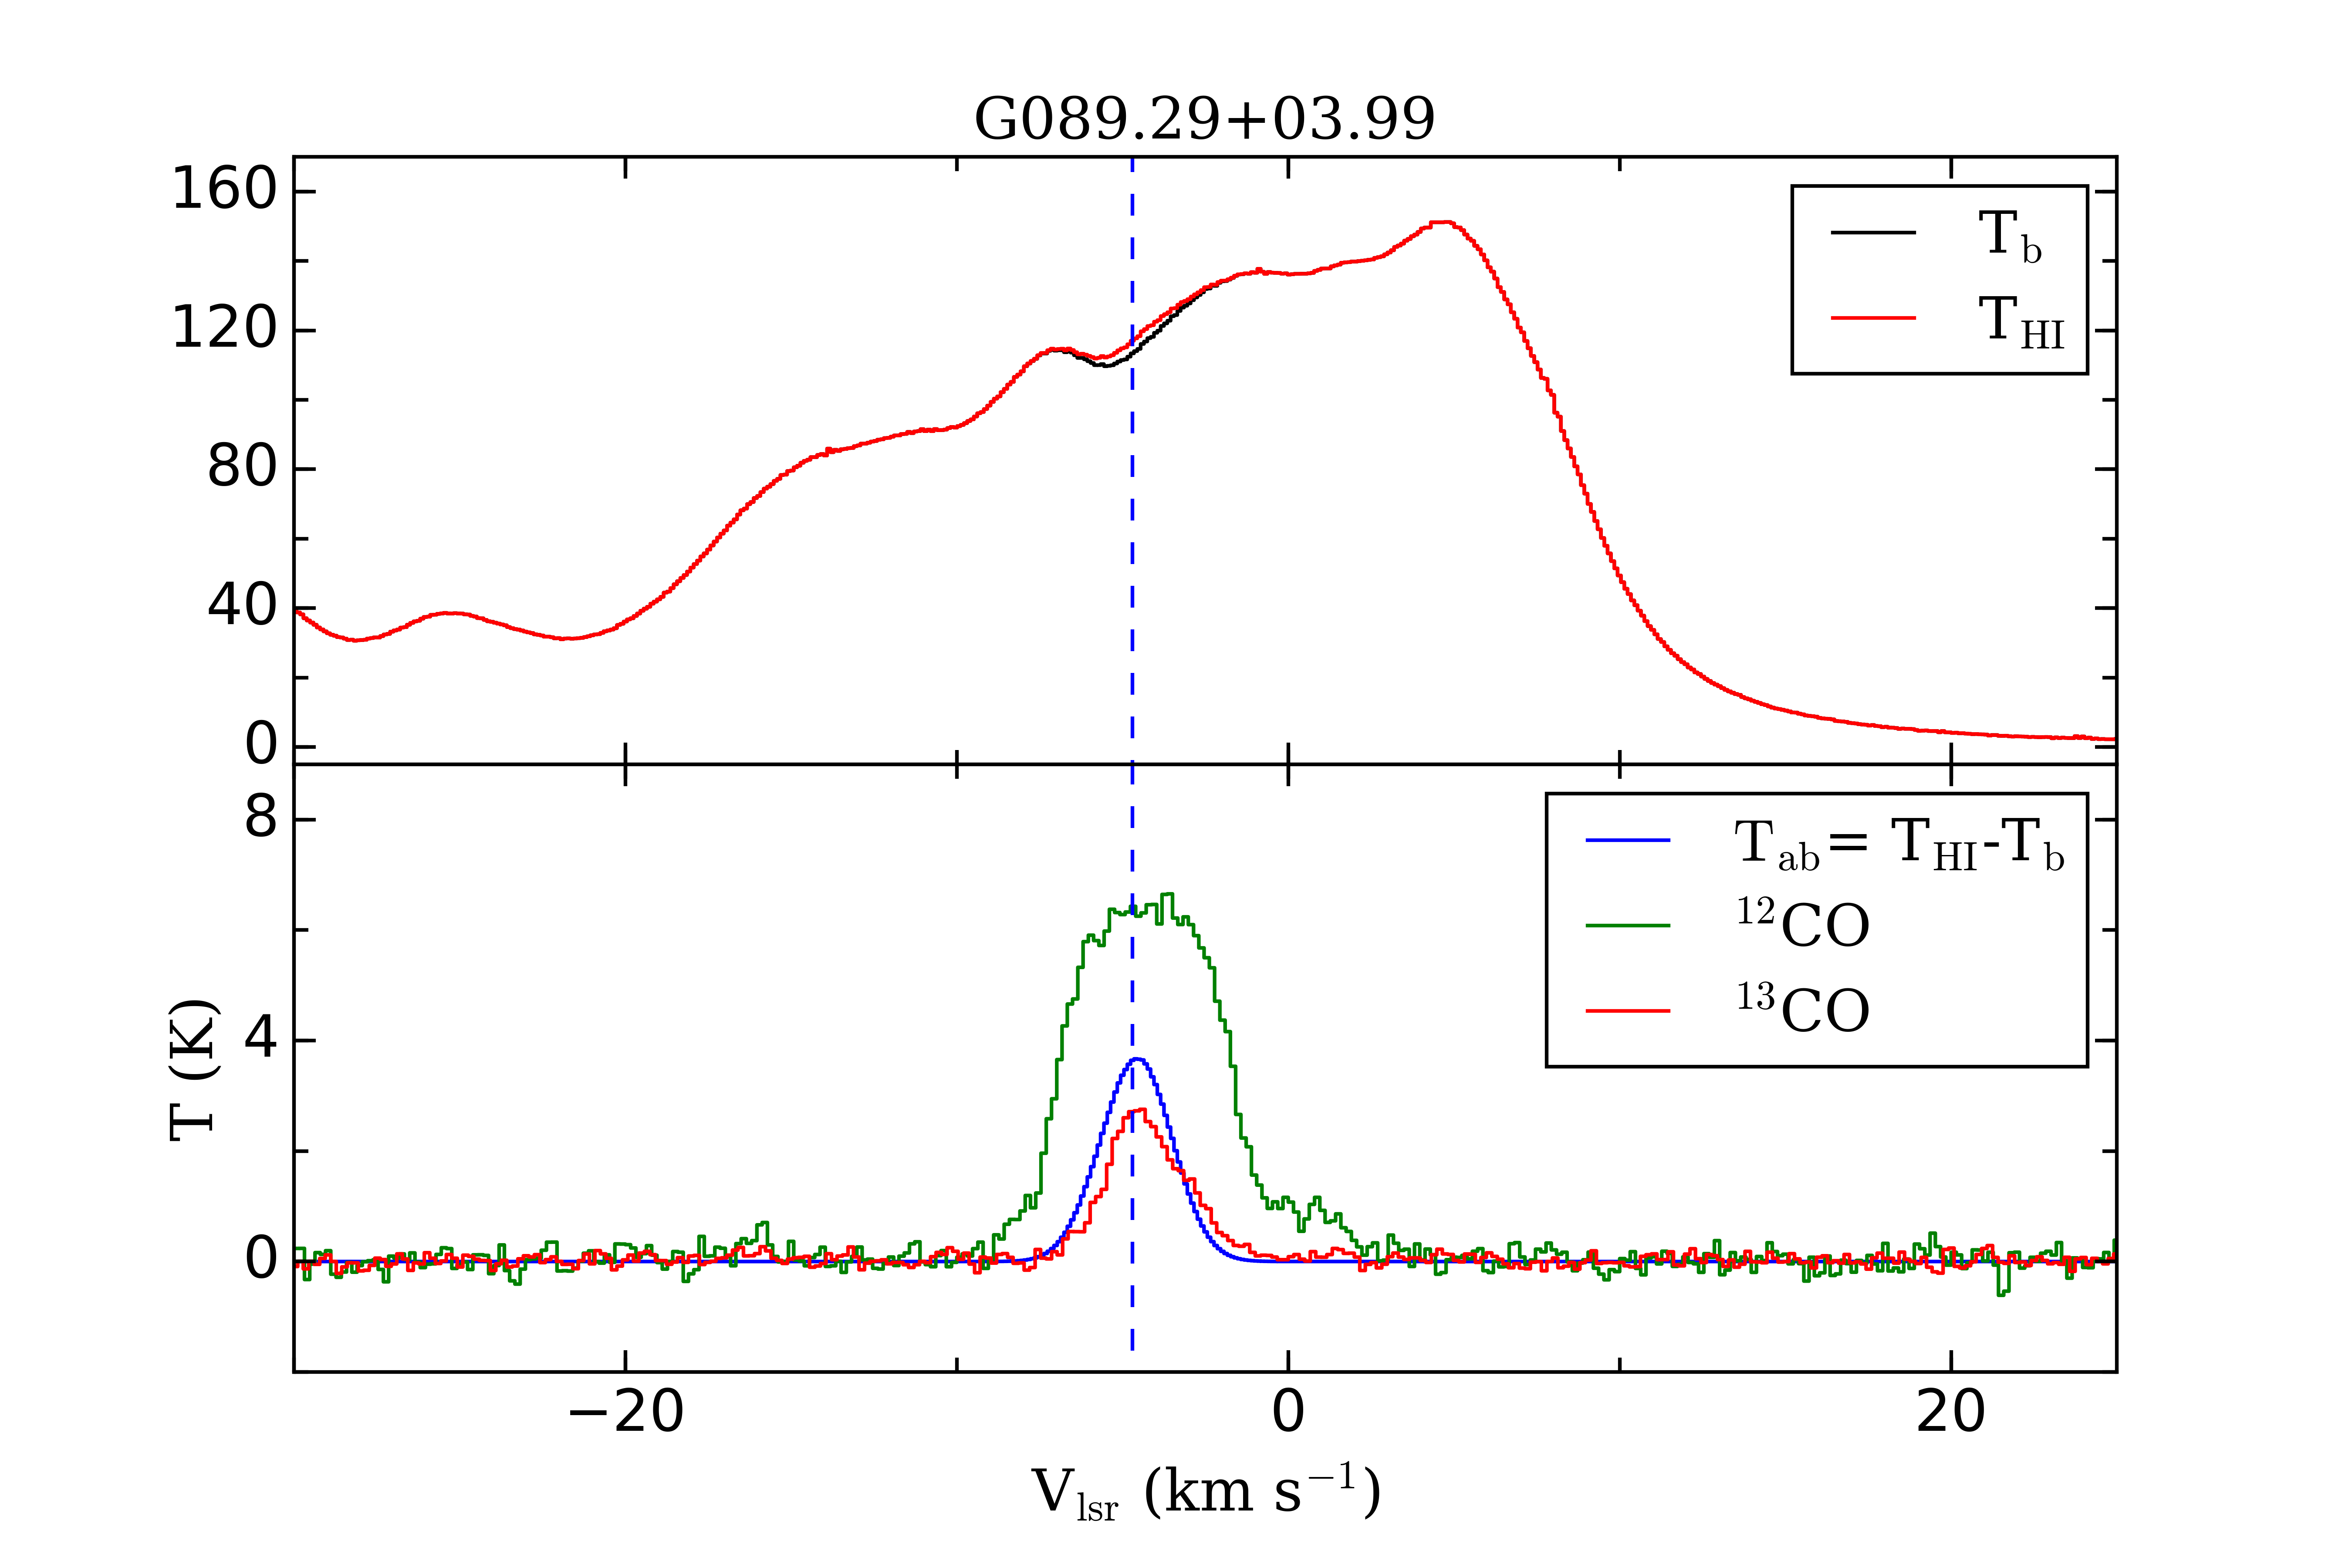
In order to test the validity of our data reduction, the PGCC source G089.29+03.99 located within the sky coverage of Arecibo telescope was observed. The observed spectrum with FAST is expressed in antenna temperature () while the data of GALFA-HI (Peek et al. 2011, 2018) is expressed in brightness temperature (). We define a ratio to convert measured to , . A value of is used for comparing observation results of G089.29+03.99. As shown in Fig. 2, we have consistent spectrum for FAST and Arecibo.
At Hi band, telescope efficiency of FAST is almost a constant value of 0.6 when zenith angle (ZA) is less than 26.4∘ and decreases linearly when ZA is greater than 26.4∘ (Jiang et al. 2019). This implies a value of 1.67 within . This value is larger than required conversion value of 1.15 between FAST and Arecibo toward G089.29+03.99. Three main effects may contribute to this difference.
-
1.
The GALFA-HI map was not sampled at the center position precisely of the PGCC source G098.29+03.99, while we pointed directly at the source.
-
2.
The flux for the GALFA-HI map was bootstrapped using the Leiden/Argentine/Bonn (LAB) survey (Kalberla et al. 2005). This means that while on a large scale the flux of the map is very accurate, there may be small-scale fluctuations.
-
3.
The GALFA map was partially corrected for stray radiation, while we did not.
We applied and corrected its dependence of ZA to derive from .
2.2. CO and Dust Archive Data
The 12CO(1-0) and 13CO(1-0) data were obtained under single pointing mode for investigating dynamic evolution of PGCCs with PMO 13.7m and TRAO-14m telescopes (Wu et al. 2012; Liu et al. 2016). Angular resolution of both PMO 13.7m and TRAO-14m is 1 arcmin (FWHM) at 115 GHz. The backend of PMO 13.7m provides bandwidth of 1 GHz and frequency resolution of 61 kHz (0.16 km s-1 for 12CO and 0.17 km s-1 for 13CO). While the backend of TRAO-14m provides bandwidth of 125 MHz and frequency resolution of 15 kHz. This frequency resolution leads to velocity resolution of 0.04 km s-1 at 115.271 GHz. The spectral resolution of TRAO-14m were smoothed to that of PMO 13.7m.
The dust temperature and dust reddening toward each source were derived from Planck Collaboration et al. (2016), in which the data were smoothed into FWHM of 5 arcmin.
3. Analysis
We start analysis by identifying molecular components in velocity based on multiple gaussian fitting of molecular spectrum. There are two factors: 12CO profile may be affected by self-absorption due to its large optical depth, making it difficult to distinguish component numbers; C18O has a relatively low abundance compared to 12CO. Its emission is weak and may be ‘missed’ under our observational sensitivity. Considering these factors, we identify velocity components with 13CO spectral data, whose emission is relatively optically thinner than 12CO and strong enough to be detected. A total of 23 components are identified toward 17 PGCCs. Each component is fitted with a Gaussian function.
Next, we check if there exists a corresponding Hi absorption feature toward each 13CO emission component. Hi fluctuation is common in Hi spectra. It may arise from either kinematic effect of two Hi clouds in different velocity or absorption of cold Hi cloud against brighter Hi background. A feature of Hi fluctuation is identified as HINSA only when there is corresponding 12CO or 13CO emission. This method of identifying HINSA through single pointing spectrum could not absolutely exclude the coincidence between Hi fluctuation from kinematic effect and 13CO emission. As discussed in Gibson et al. (2000), geometry inspection of Hi mapping would improve this situation.
For these identified HINSA components, we calculated excitation temperature and column density of atomic and molecular content. They are shown as follows.
3.1. CO Excitation
For all observed PGCCs components, temperature ratio between 12CO and 13CO emission is around 2. This value is much smaller than Galactic [12C/13C] ratio ( 60; Lucas & Liszt 1998) in ISM, leading to a reasonable assumption that 12CO is optically thick, . Assuming a filling factor of 1, the excitation temperature of 12CO equals brightness temperature of 12CO.
The excitation temperature of 13CO, is assumed to be same of . The optical depth of 13CO, is given by
| (1) |
under the assumption of .
The column density of 13CO is derived through the following equation (Li 2002; Qian et al. 2012),
| (2) |
in which is brightness temperature of 13, is the optical depth of 13CO, . The uncertainty of was calculated by uncertainty propagation of spectral rms of 12CO and 13CO data.
The above analysis of 13CO are derived under the assumption of local thermal equilibrium (LTE). Application of non-LTE analysis leads to a consistent result with that of LTE for PGCC (Liu et al. 2016).
3.2. Physical Parameters of HINSA
Li & Goldsmith (2003) proposed a three-compnent model of HINSA, which consists of warm Hi background and foreground gas with a central cold Hi cloud along line of sight. In this model, optical depth of background and foreground Hi gas are and , respectively. The factor is defined as =/(+). Kinematic distance of each PGCC component was derived through Galactic rotation curve (Brand, & Blitz 1993). We combine kinematic distance and Galactic Hi surface density distribution (Nakanishi, & Sofue 2003) to estimate along sightline of the PGCC. This is different from the formula adopted in Li & Goldsmith (2003), which is reasonable for cloud with high Galactic latitude but would be invalid for cloud in the Galactic plane. Details of this calculation could be found in section 4.2 of Tang et al. (2016). and represent observed Hi brightness temperature spectrum and brightness temperature spectrum when central cold Hi cloud is absent, respectively. Absorption temperature, = could be described with (Li & Goldsmith 2003) ,
| (3) |
where is continuum temperature including cosmic microwave background (CMB, 2.73 K), Galactic synchrotron radiation ( 0.7 K), and continuous emission from other radiation mechanisms. The value of is derived by the equation = 2.7 + (/408 MHz)-2.8, in which is continuum temperature around 408 MHz (Haslam et al. 1982), and is frequency of Hi emission. Derived value of toward our targets ranges from 3.8 to 5.6 K. is the excitation temperature of HINSA component, and depends on kinetic temperature Tk and effective temperature of radiation field. The gas of observed PGCCs are in molecular phase, resulting a reasonable assumption that . The value of is around 0.9. We follow Li & Goldsmith (2003), the value of is assumed as 0.1, which implies a total optical depth of unity along Galactic sightline. This assumption would not significantly affect the result. The optical depth of HINSA, is an unknown parameter to be solved. Assuming a Gaussian broadening, is described in the formula of , in which is peak optical depth at central velocity.
is recovered Hi spectrum without absorption from the central cold cloud. There are many methods to derive , for instance, averaging nearby spectra without this absorption cloud (e.g., Gibson et al. 2000) or fitting observed profile with polynomial (e.g., Li & Goldsmith 2003). Considering complexity of Hi emission around the Galactic plane, the method of observing off positions or fitting with polynomial may introduce significant uncertainty. The method of polynomial fitting depends on choice of polynomial index.
HINSA and molecular hydrogen are believed to mix well inside the cloud. Total velocity broadening of each transition, , in which and represent thermal broadening due to collision and non-thermal broadening including turbulence, magnetic field and other effects. Krčo et al. (2008) introduced a new method to derive by utilizing physical information (central velocity, non-thermal linewidth and kinematic temperature) derived from CO data to constrain fitting of HINSA profile. We introduce this method for analysis in this paper. For each HINSA component, 4 parameters of HINSA are fitted with the following considerations (Krčo & Goldsmith 2010):
-
1.
Central velocity. A maximum deviation of 10% linewidth from central velocities of 13CO is allowed.
-
2.
Non-thermal linewidth. It is allowed within 50% deviation from fitting 13CO.
-
3.
Kinematic temperature, which is derived from 12CO and is kept as a constant during fitting.
-
4.
Optical depth. This is a relative free parameter without priori information. Initial value of 0.1 with limitation of [0,10] is adopted during fitting.
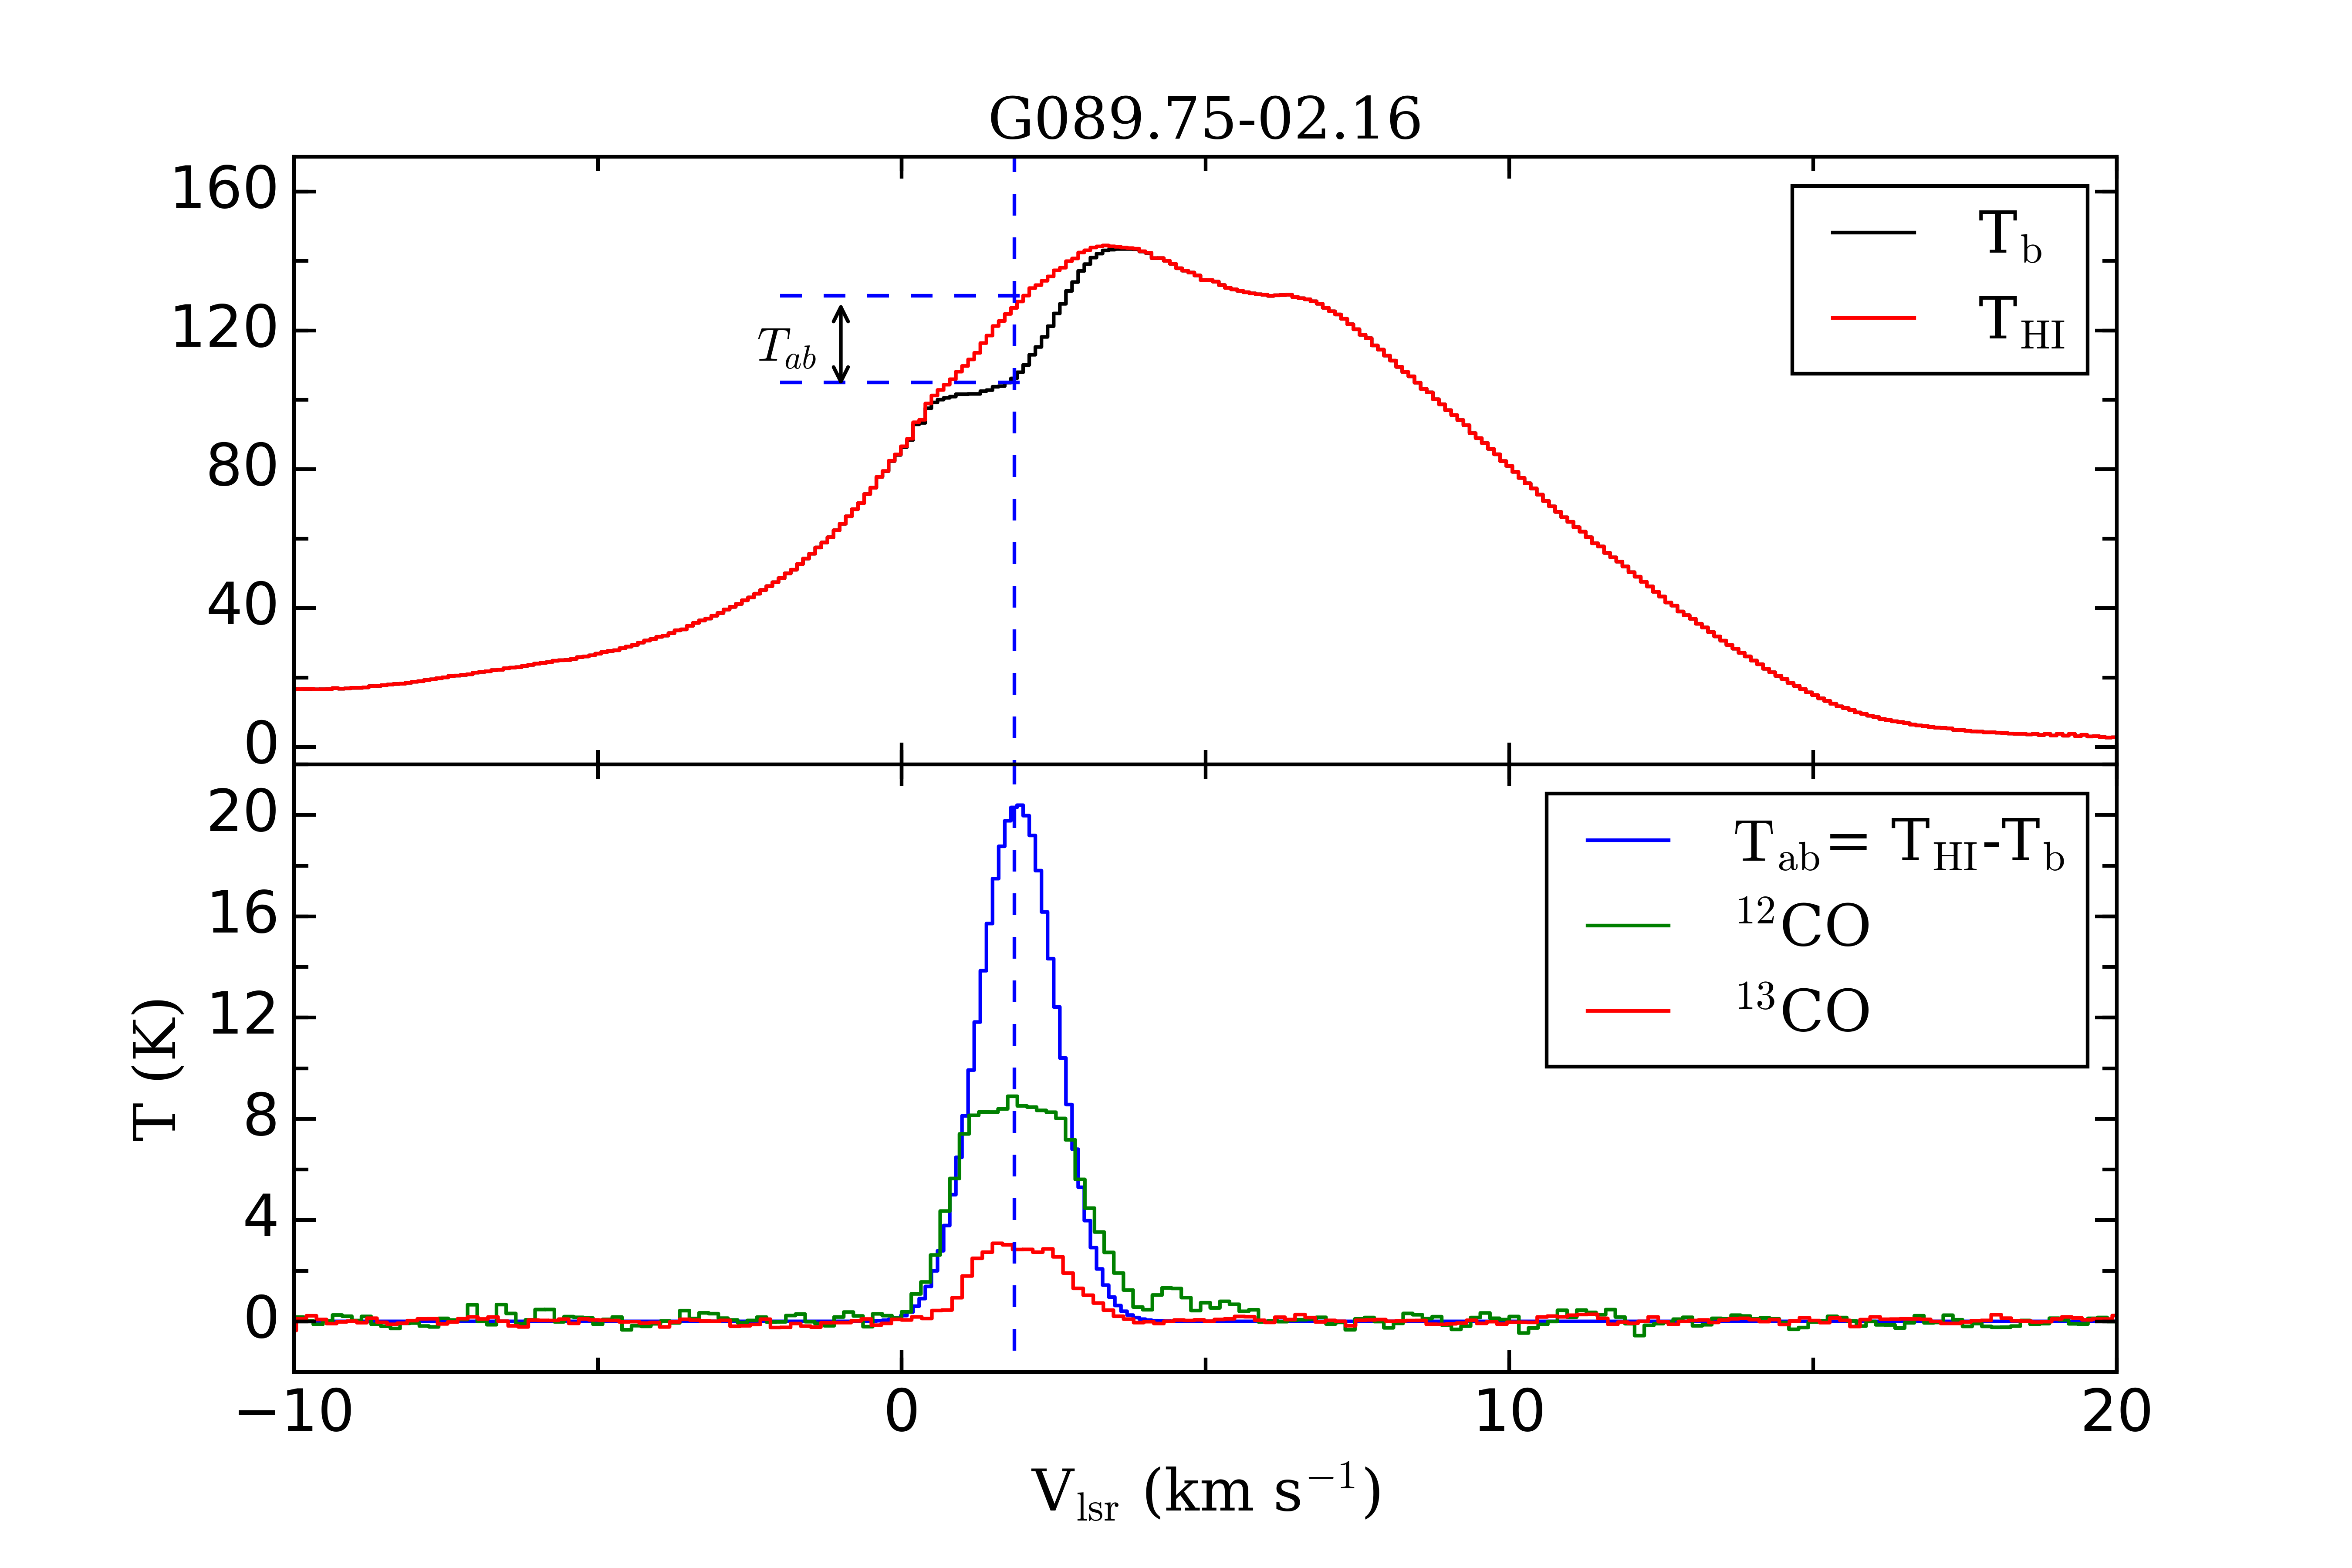
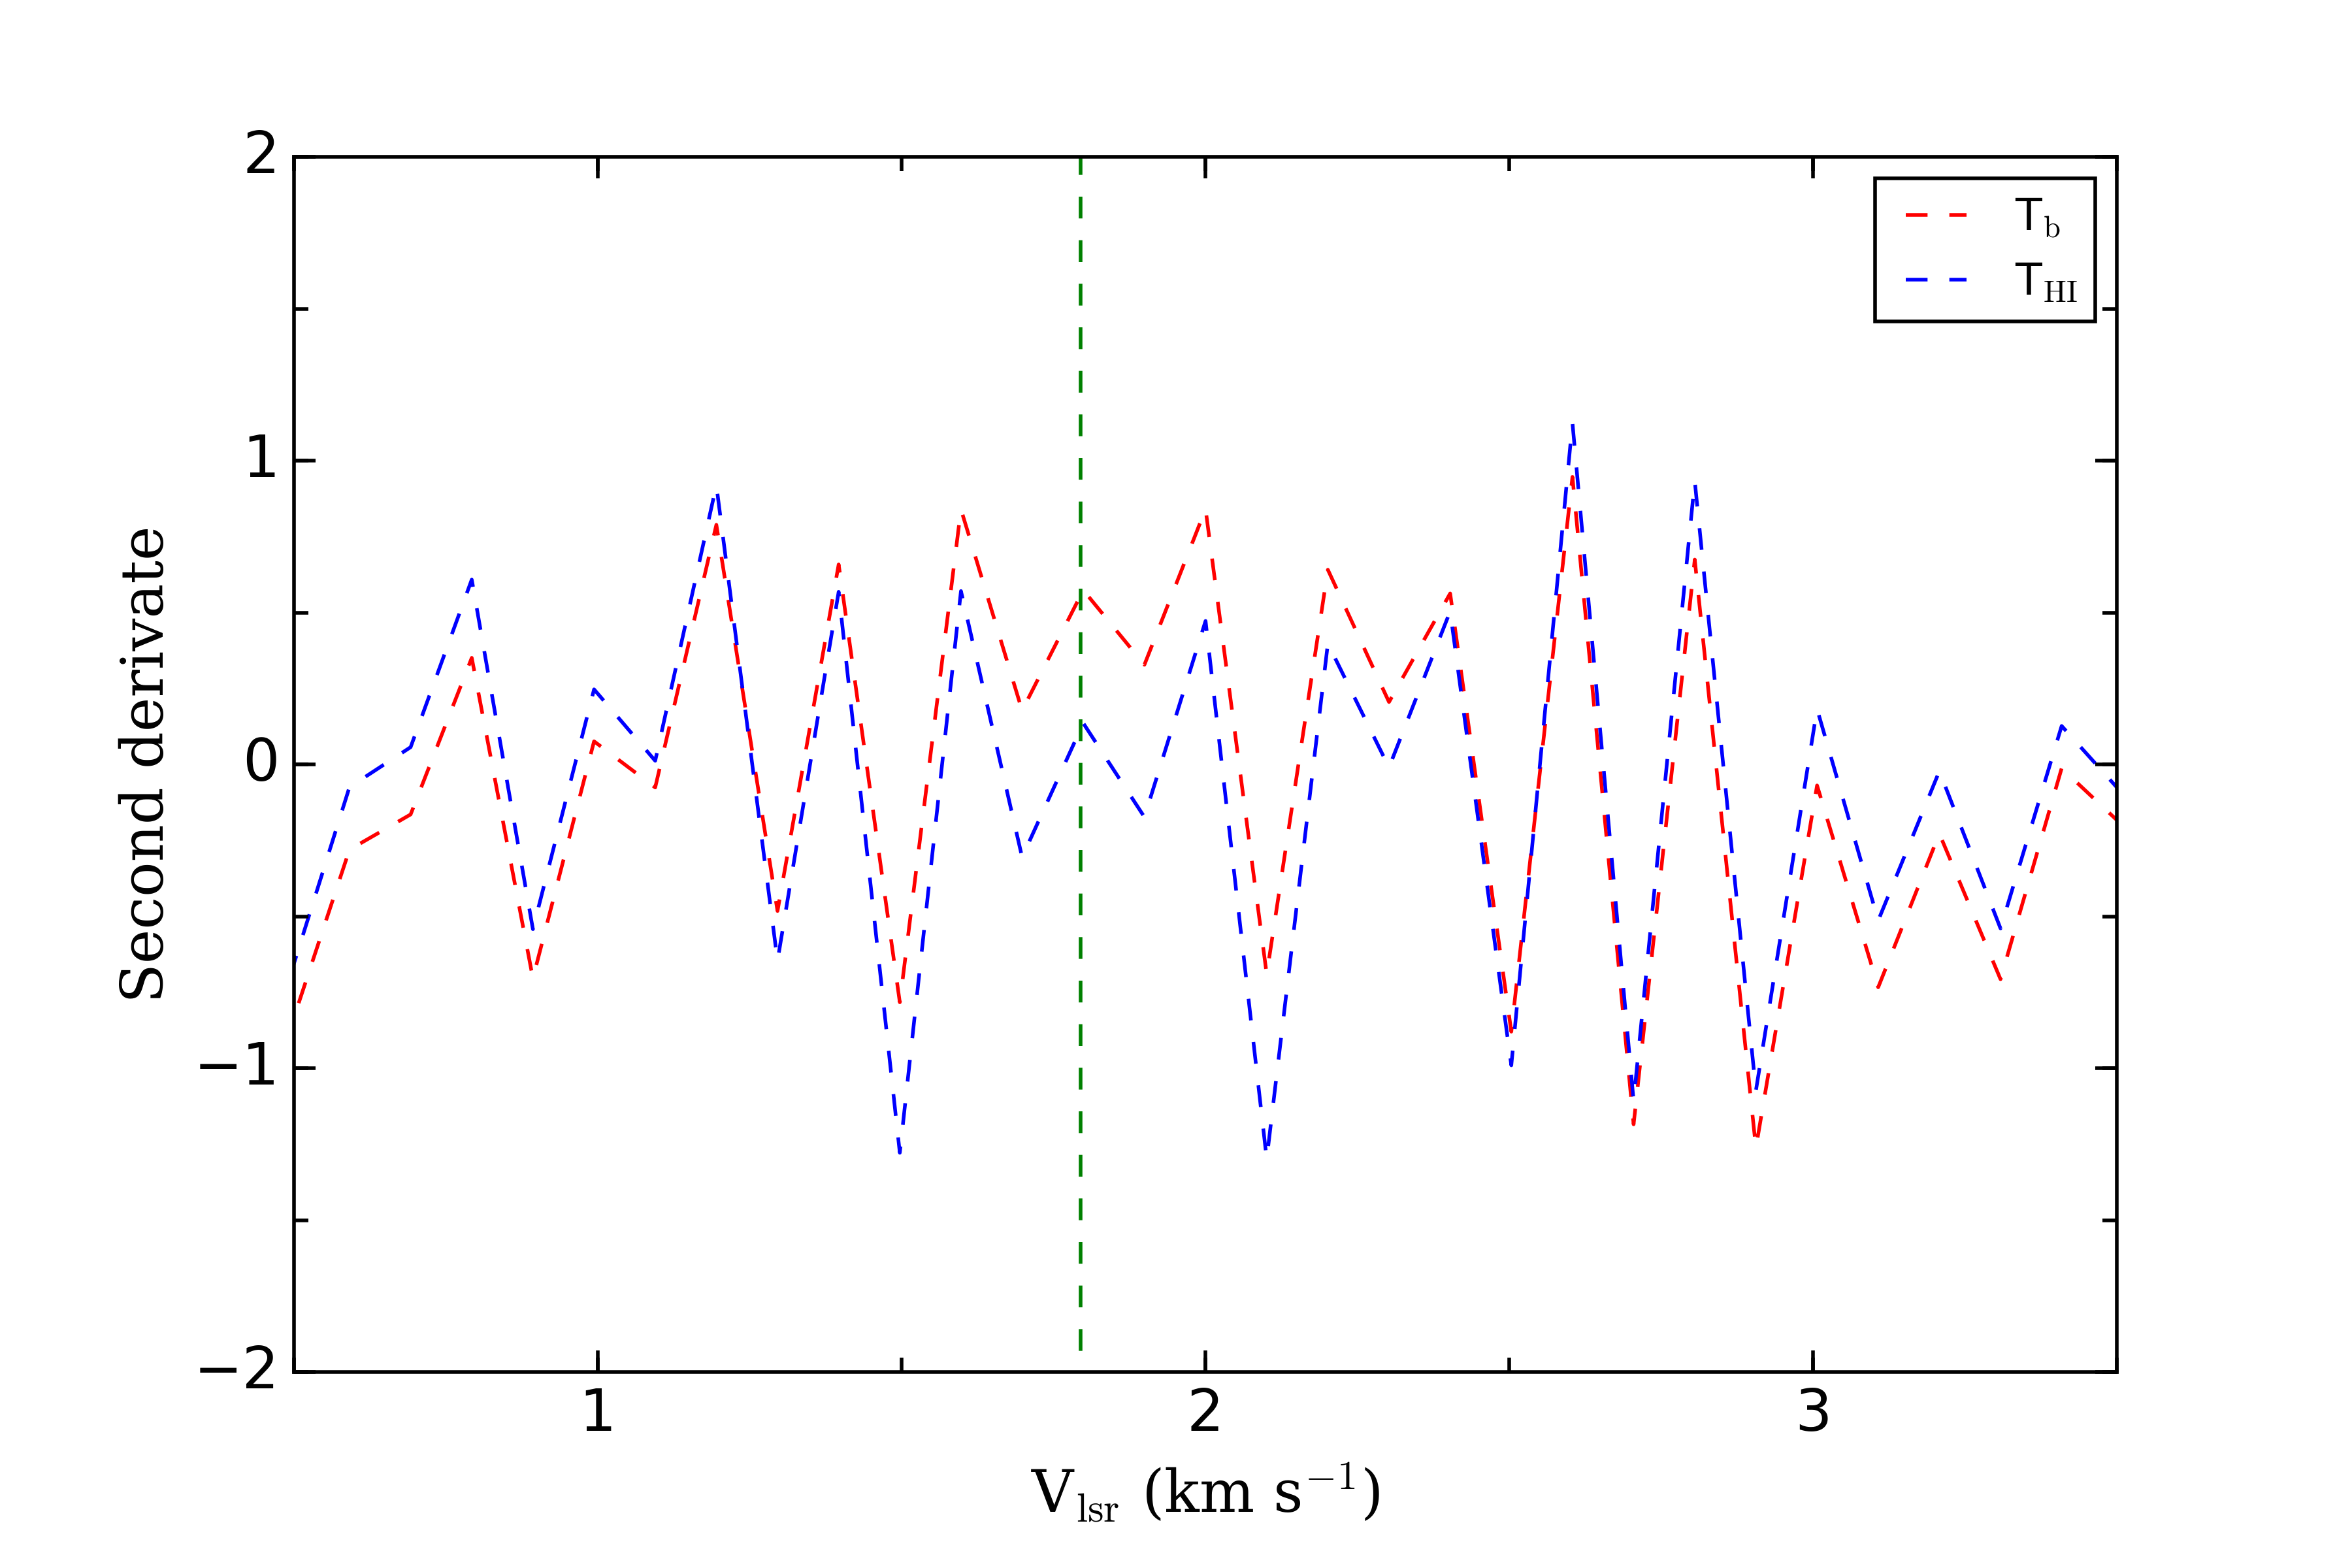
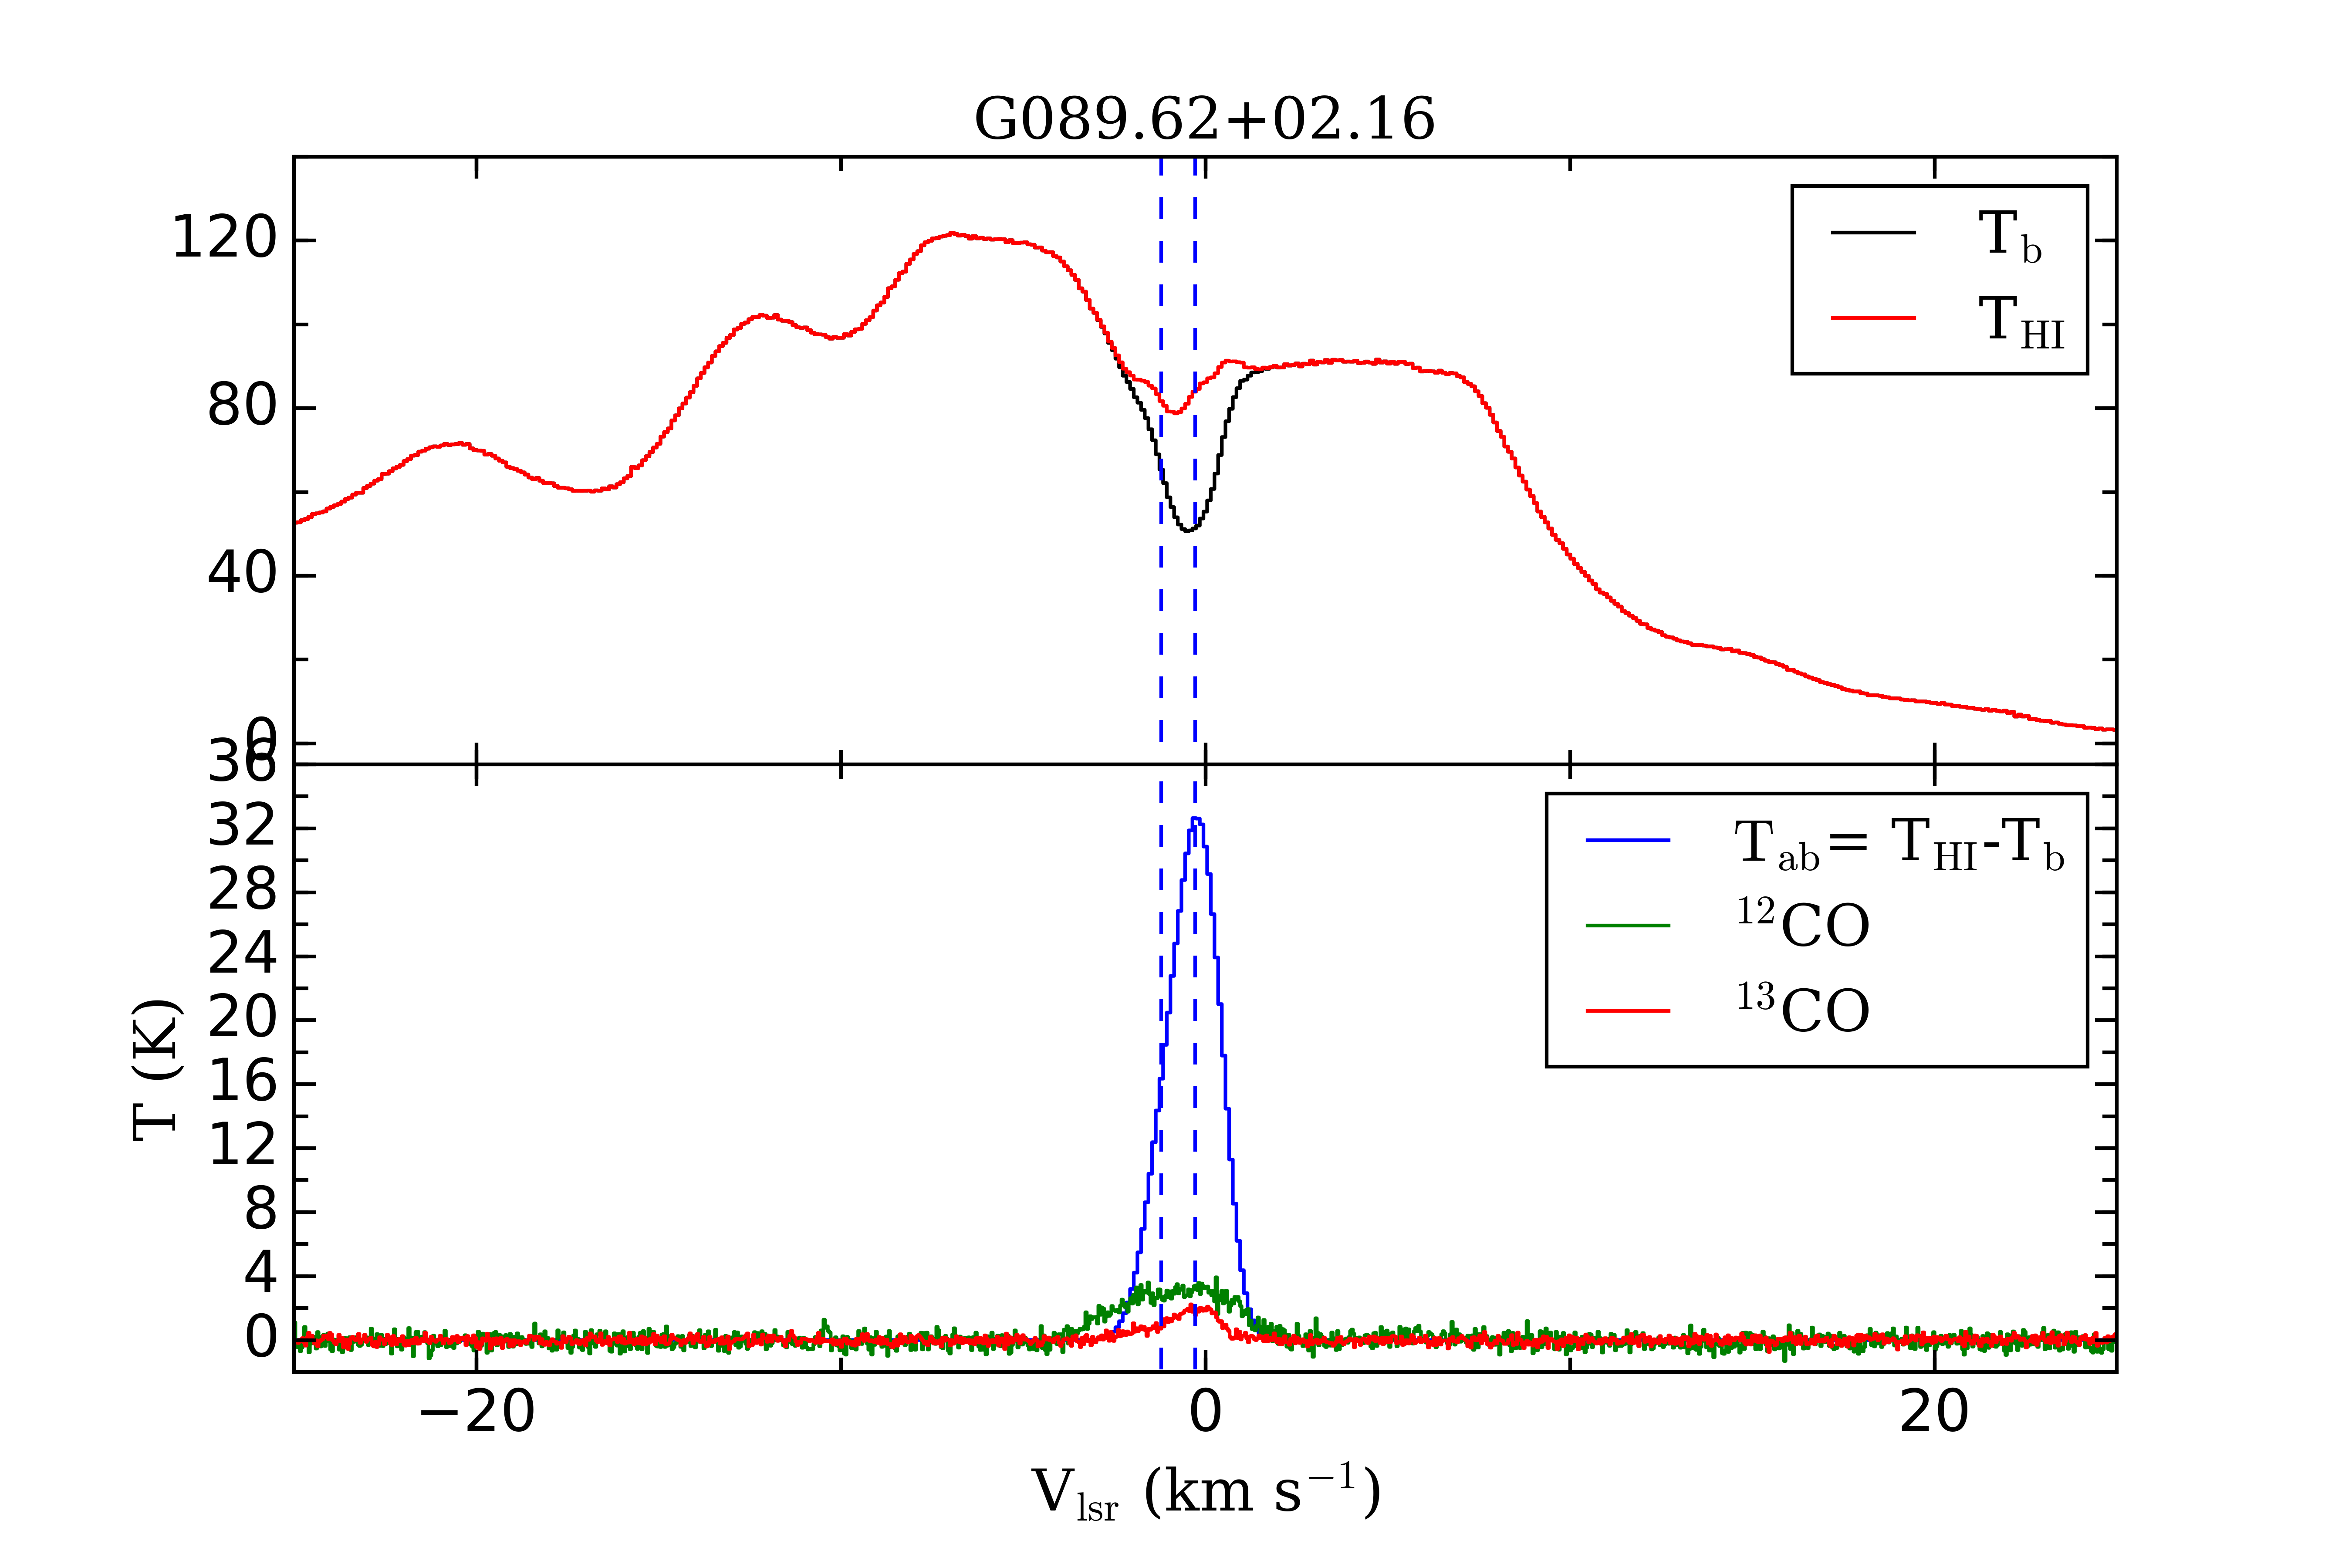
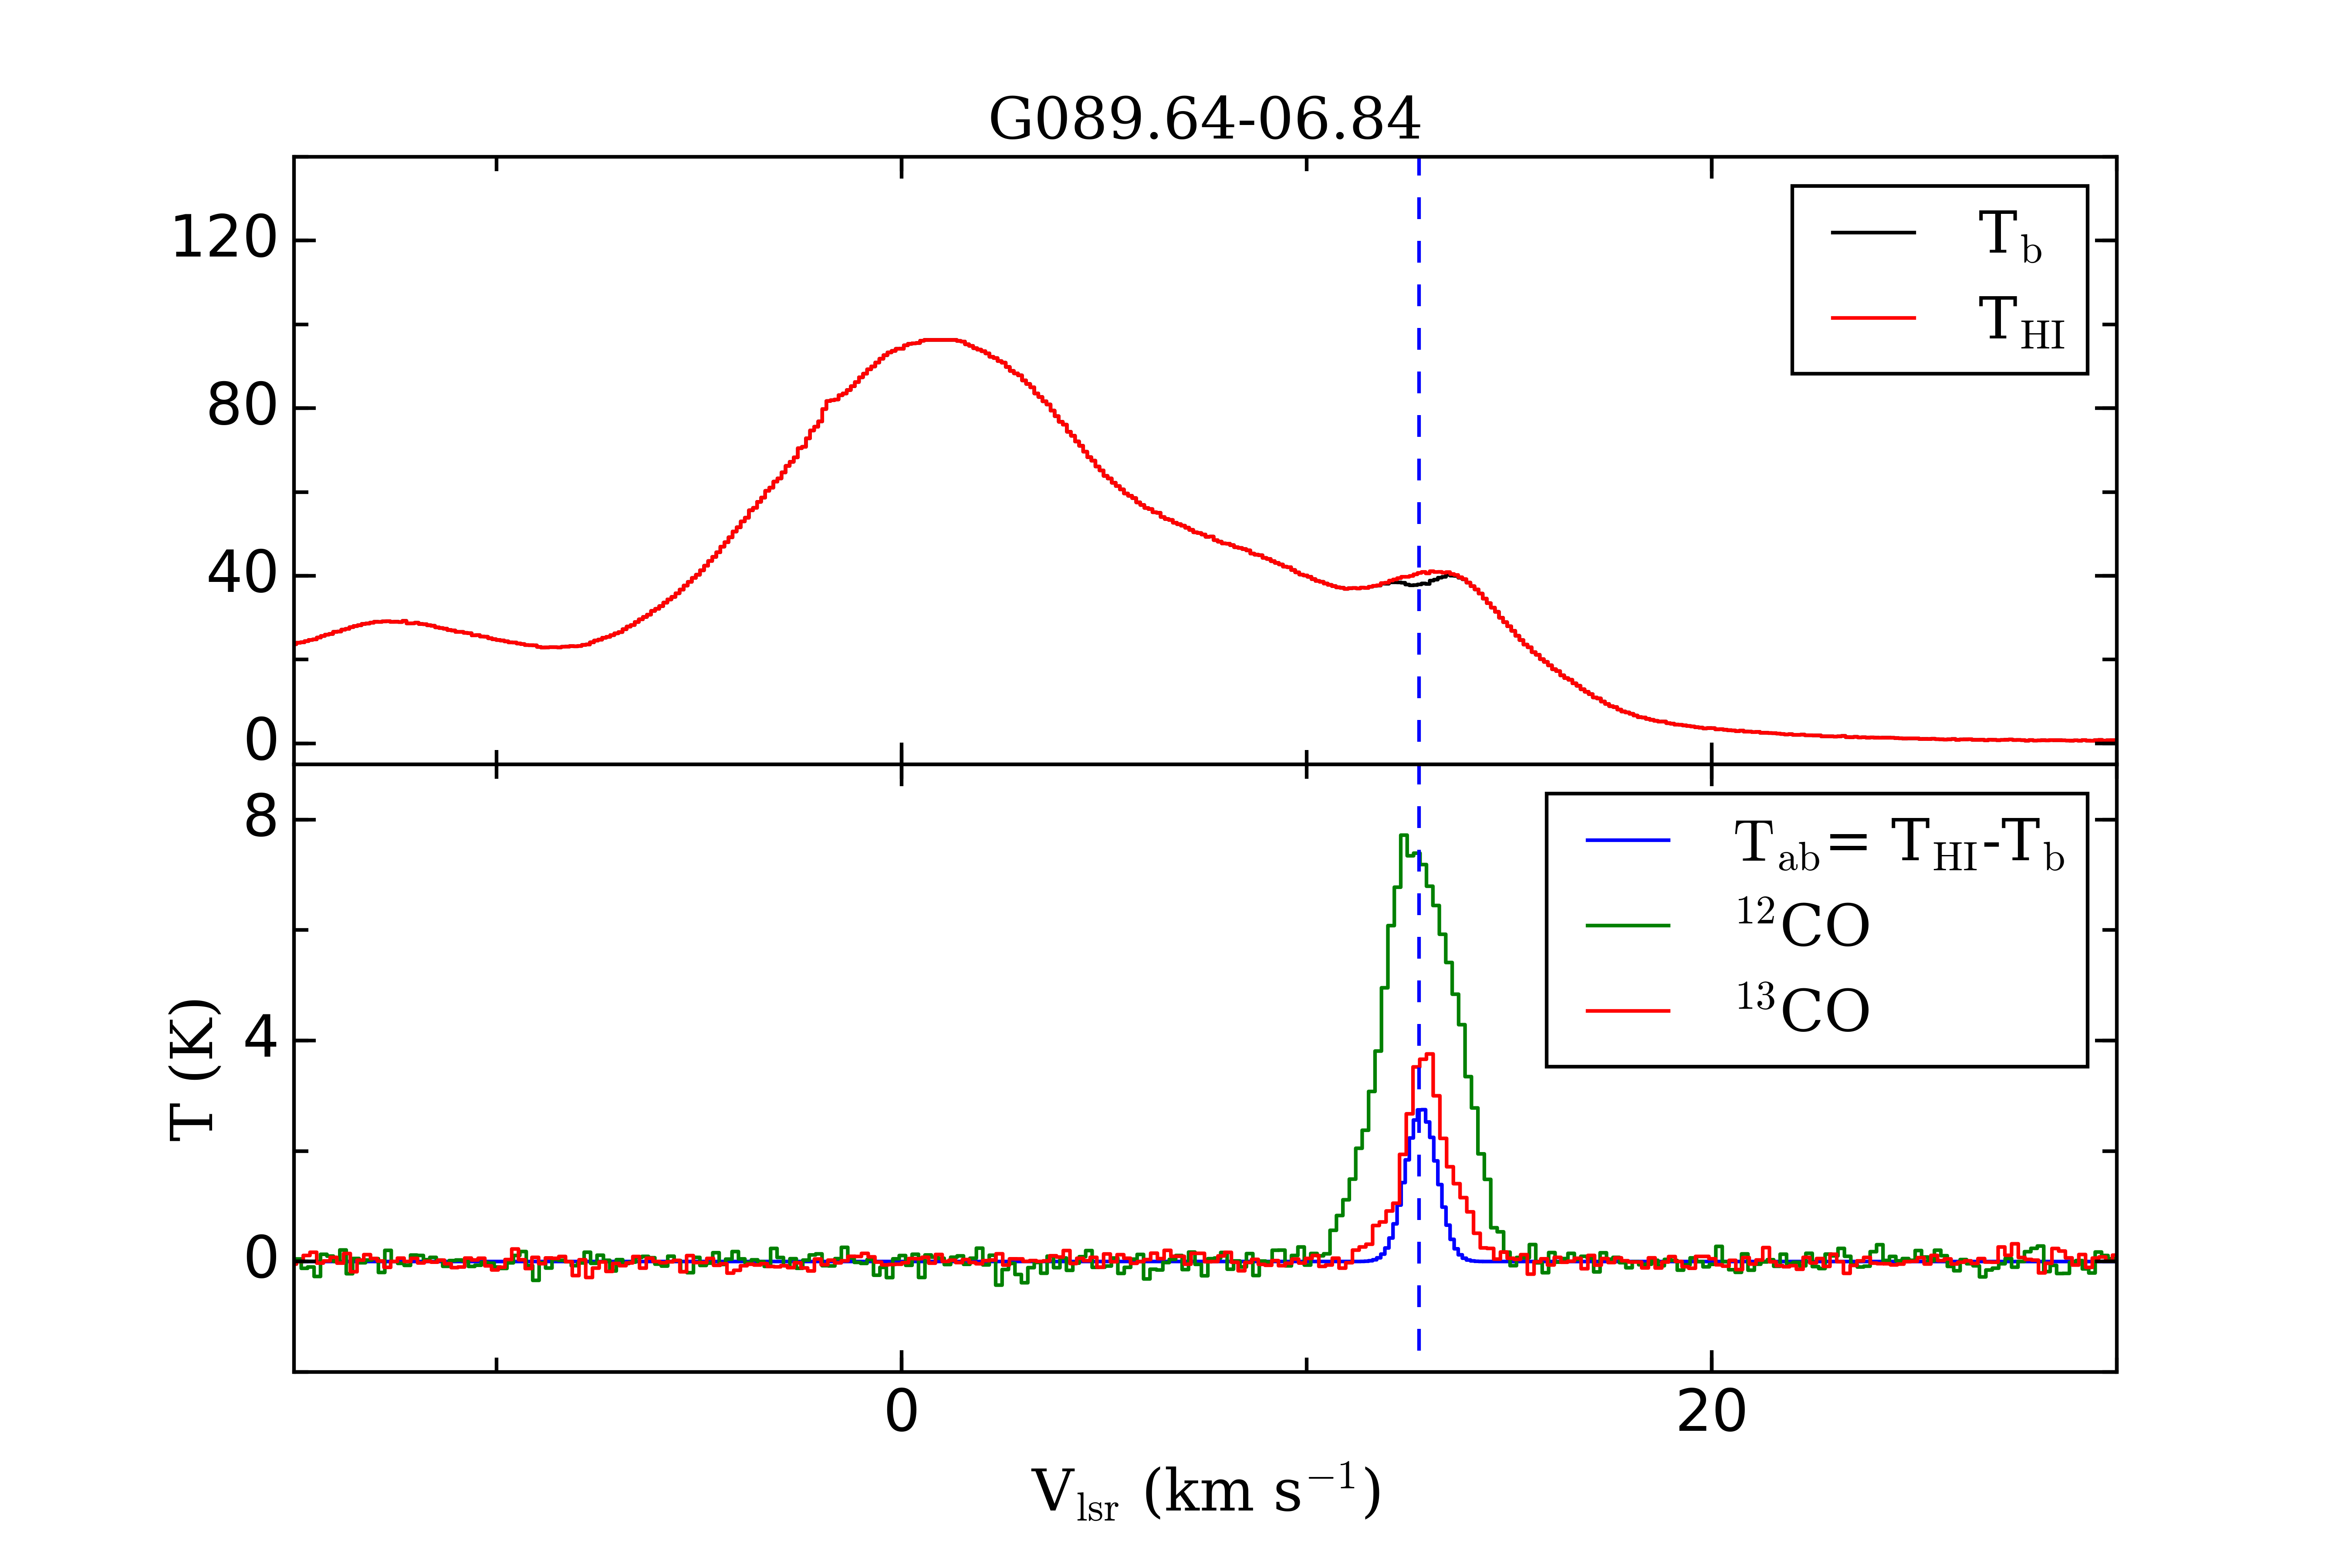
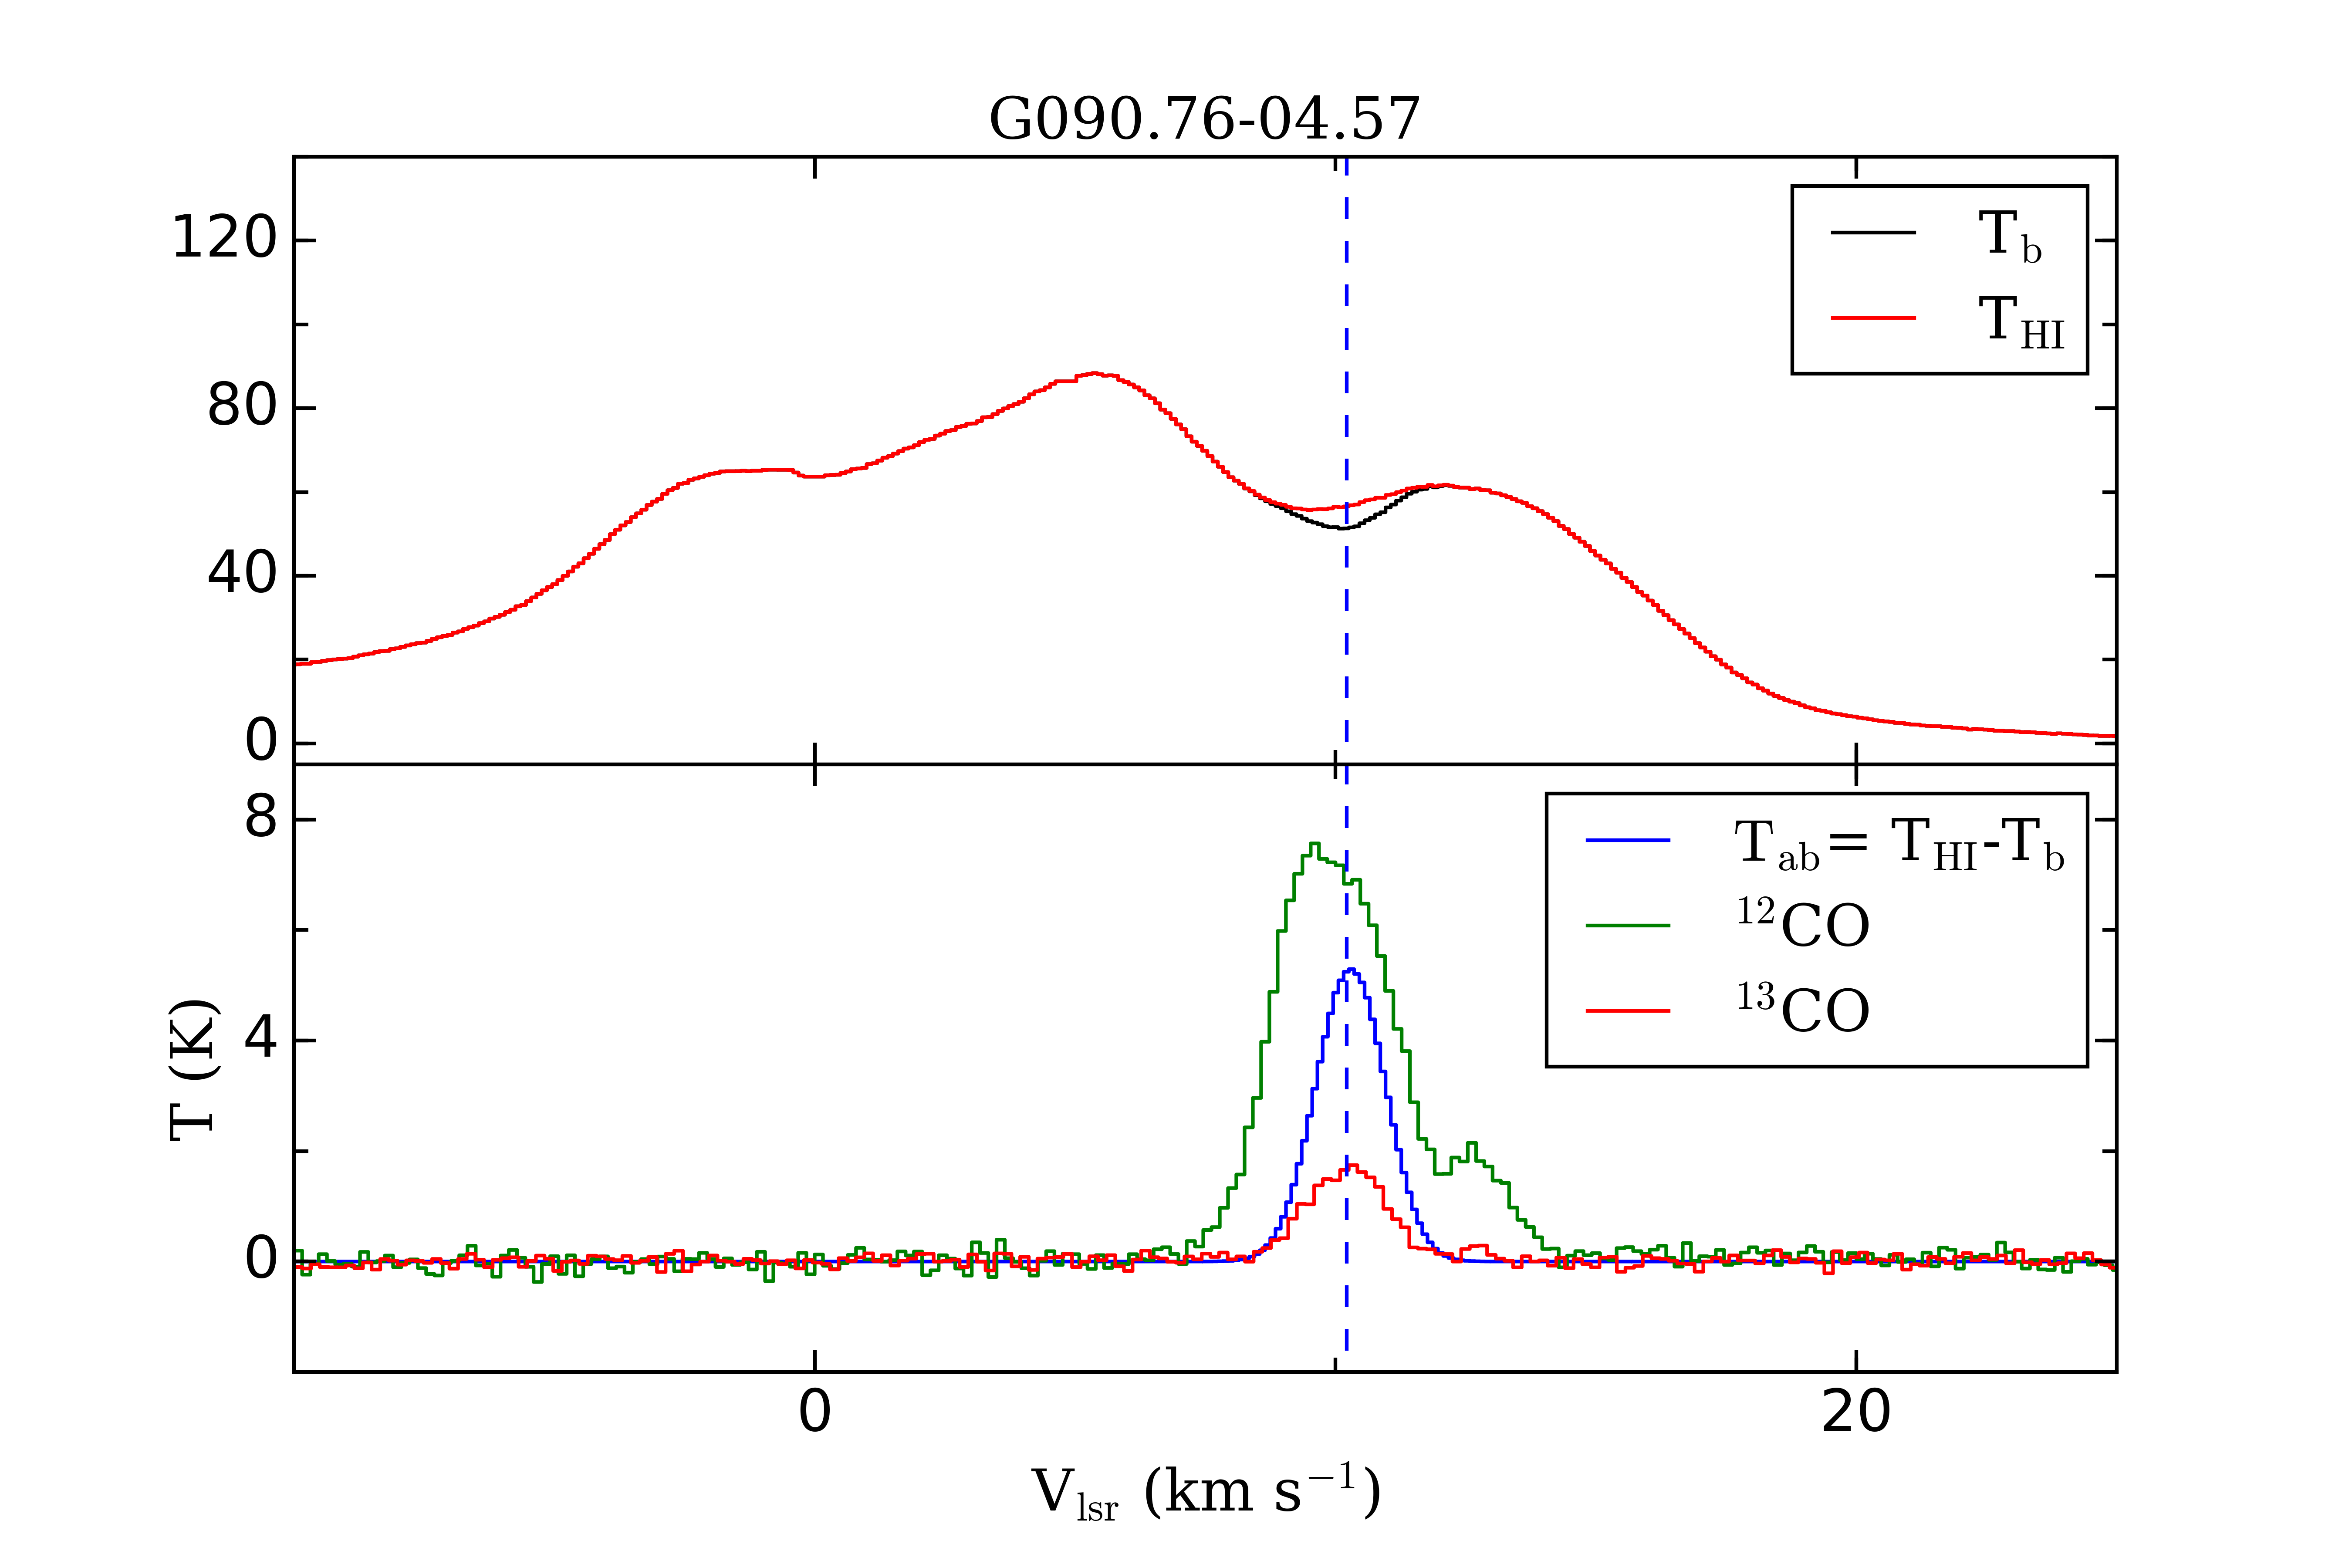
Since the width of HINSA is narrow, HINSA feature would become apparent in second derivative of observed spectrum (Kavars et al. 2005). The minimization of the integrated squared sum of second derivative would be sufficient to remove HINSA feature (Krčo et al. 2008). We follow Krčo et al. (2008) to derive by fitting a least minimum of second derivation of the input spectrum. This method performs perfect for simple spectrum but may lead to large deviation for complex spectrum. The above constraints of inputting parameters are introduced to reduce uncertainty during fitting. An example of HINSA fitting is shown in Fig. 3. Corresponding second derivatives of and profile is shown in Fig. 4. It is clearly seen that second derivatives at central velocity becomes flat. Column density of HINSA is calculated by (Li & Goldsmith 2003),
| (4) |
where , and are peak optical depth, excitation temperature, and width of HINSA, respectively. The uncertainty of N(HINSA) is estimated through uncertainty propagation during fitting , and .
3.3. Total Column Density of Hydrogen
We obtained total column density of molecular hydrogen and its uncertainty from Planck Collaboration et al. (2016). toward each PGCCs is derived from color extinction E(B-V), which is based on multi-band continuum emission. Obtained value of consists contribution from all gas components along line of sight of PGCCs. For PGCCs with two or more components, we assume of each component is linearly correlated with its column density of 13CO. The column density of hydrogen of each component is then calculated with
| (5) |
No estimates of are given toward PGCCs G089.62+02.16 and G093.16+09.61. of gas components in these two sources are calculated from N(13CO). Thus we have
| (6) | ||||
| (7) |
where is 13CO/H2 ratio in a cloud. It contains two parts, and . They are 13C/12C and 12CO/H2 ratio, respectively. In previous research, the value of these two parts are generally adopted as 1/60 and 1 in Galactic ISM (e.g., Liu et al. 2016).
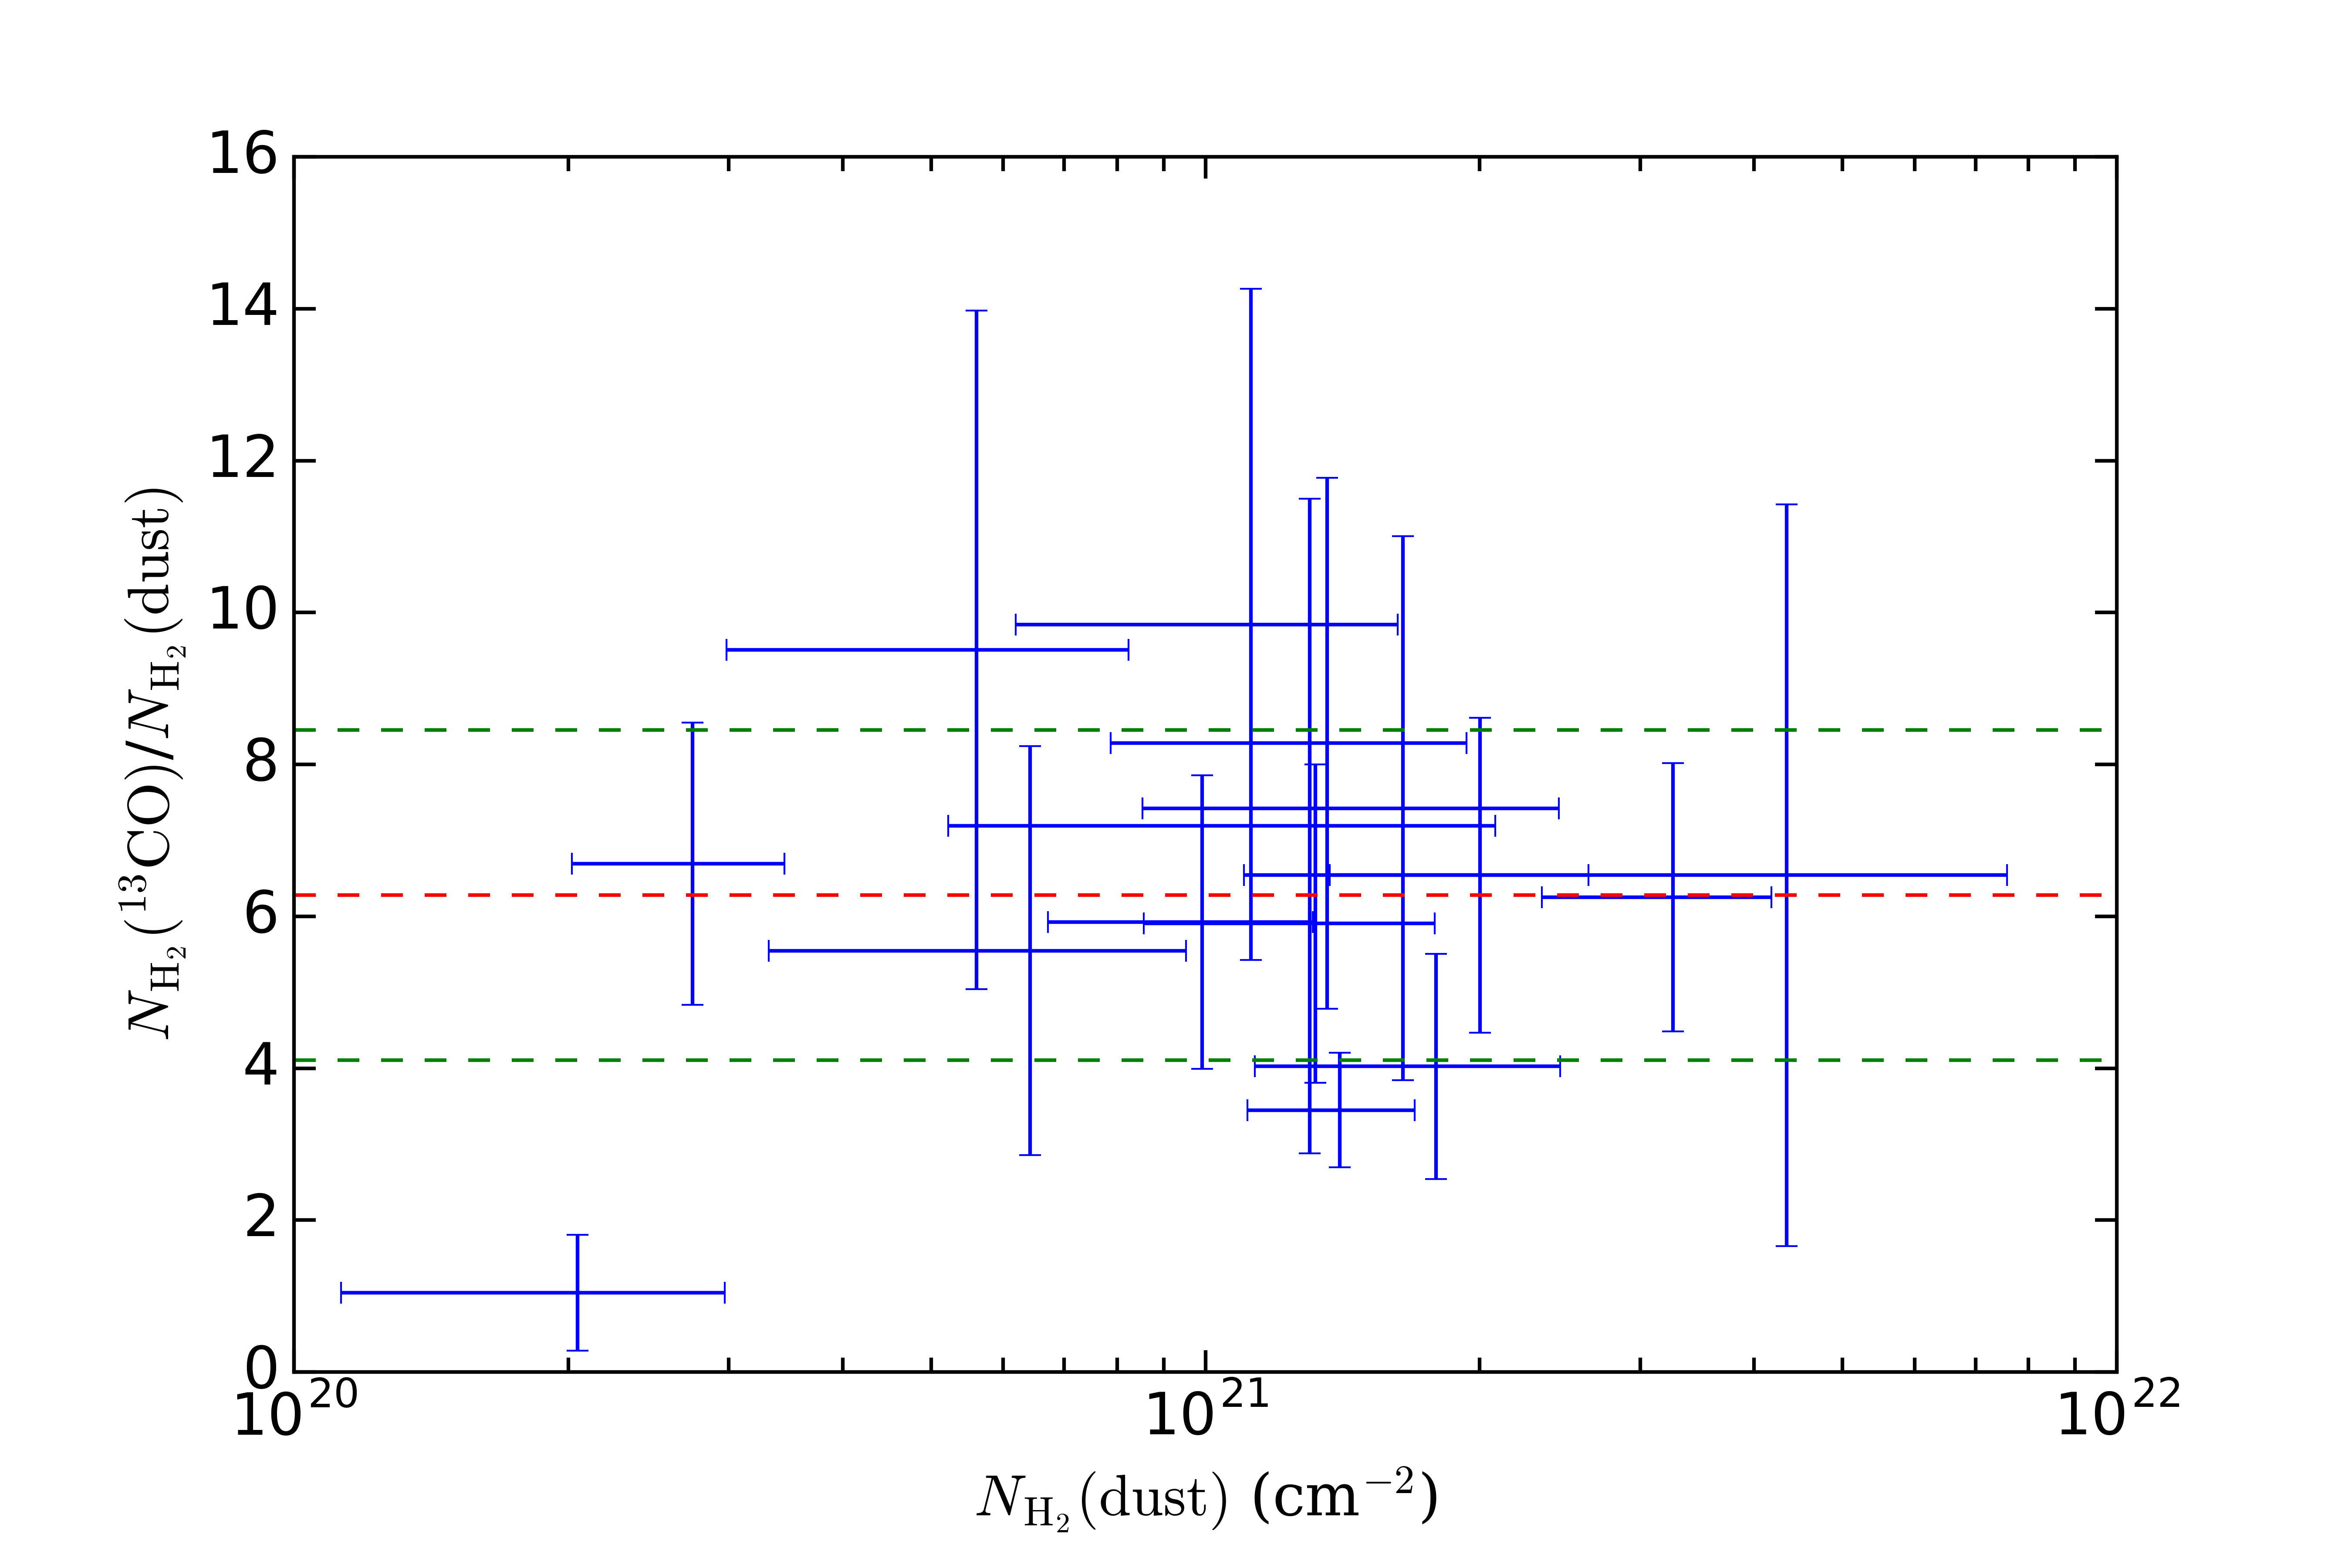
We compare validity of calculating by adopting for observed PGCCs with estimation from dust. As shown in Fig. 5, the adoption of would overestimate by a factor of 6.2. This discrepancy may origin from variation of 12C and 13C in ISM with different environment. We adopt for calculating in PGCCs G089.62+02.16 and G093.16+09.61.
4. Results and Discussion
A total of 17 PGCCs inside FAST sky coverage were surveyed. We have detected 13 HINSA components toward 10 PGCCs, implying a HINSA detection rate of 58% in PGCCs. This detection percentage is smaller than that of 77% in Taurus/Perseus region (Li & Goldsmith 2003, hereafter LG03) and 80% of 48 molecular clouds (Krčo & Goldsmith 2010, hereafter KG10). This deviation may arise from limited sample number and different strategy of sample selection.
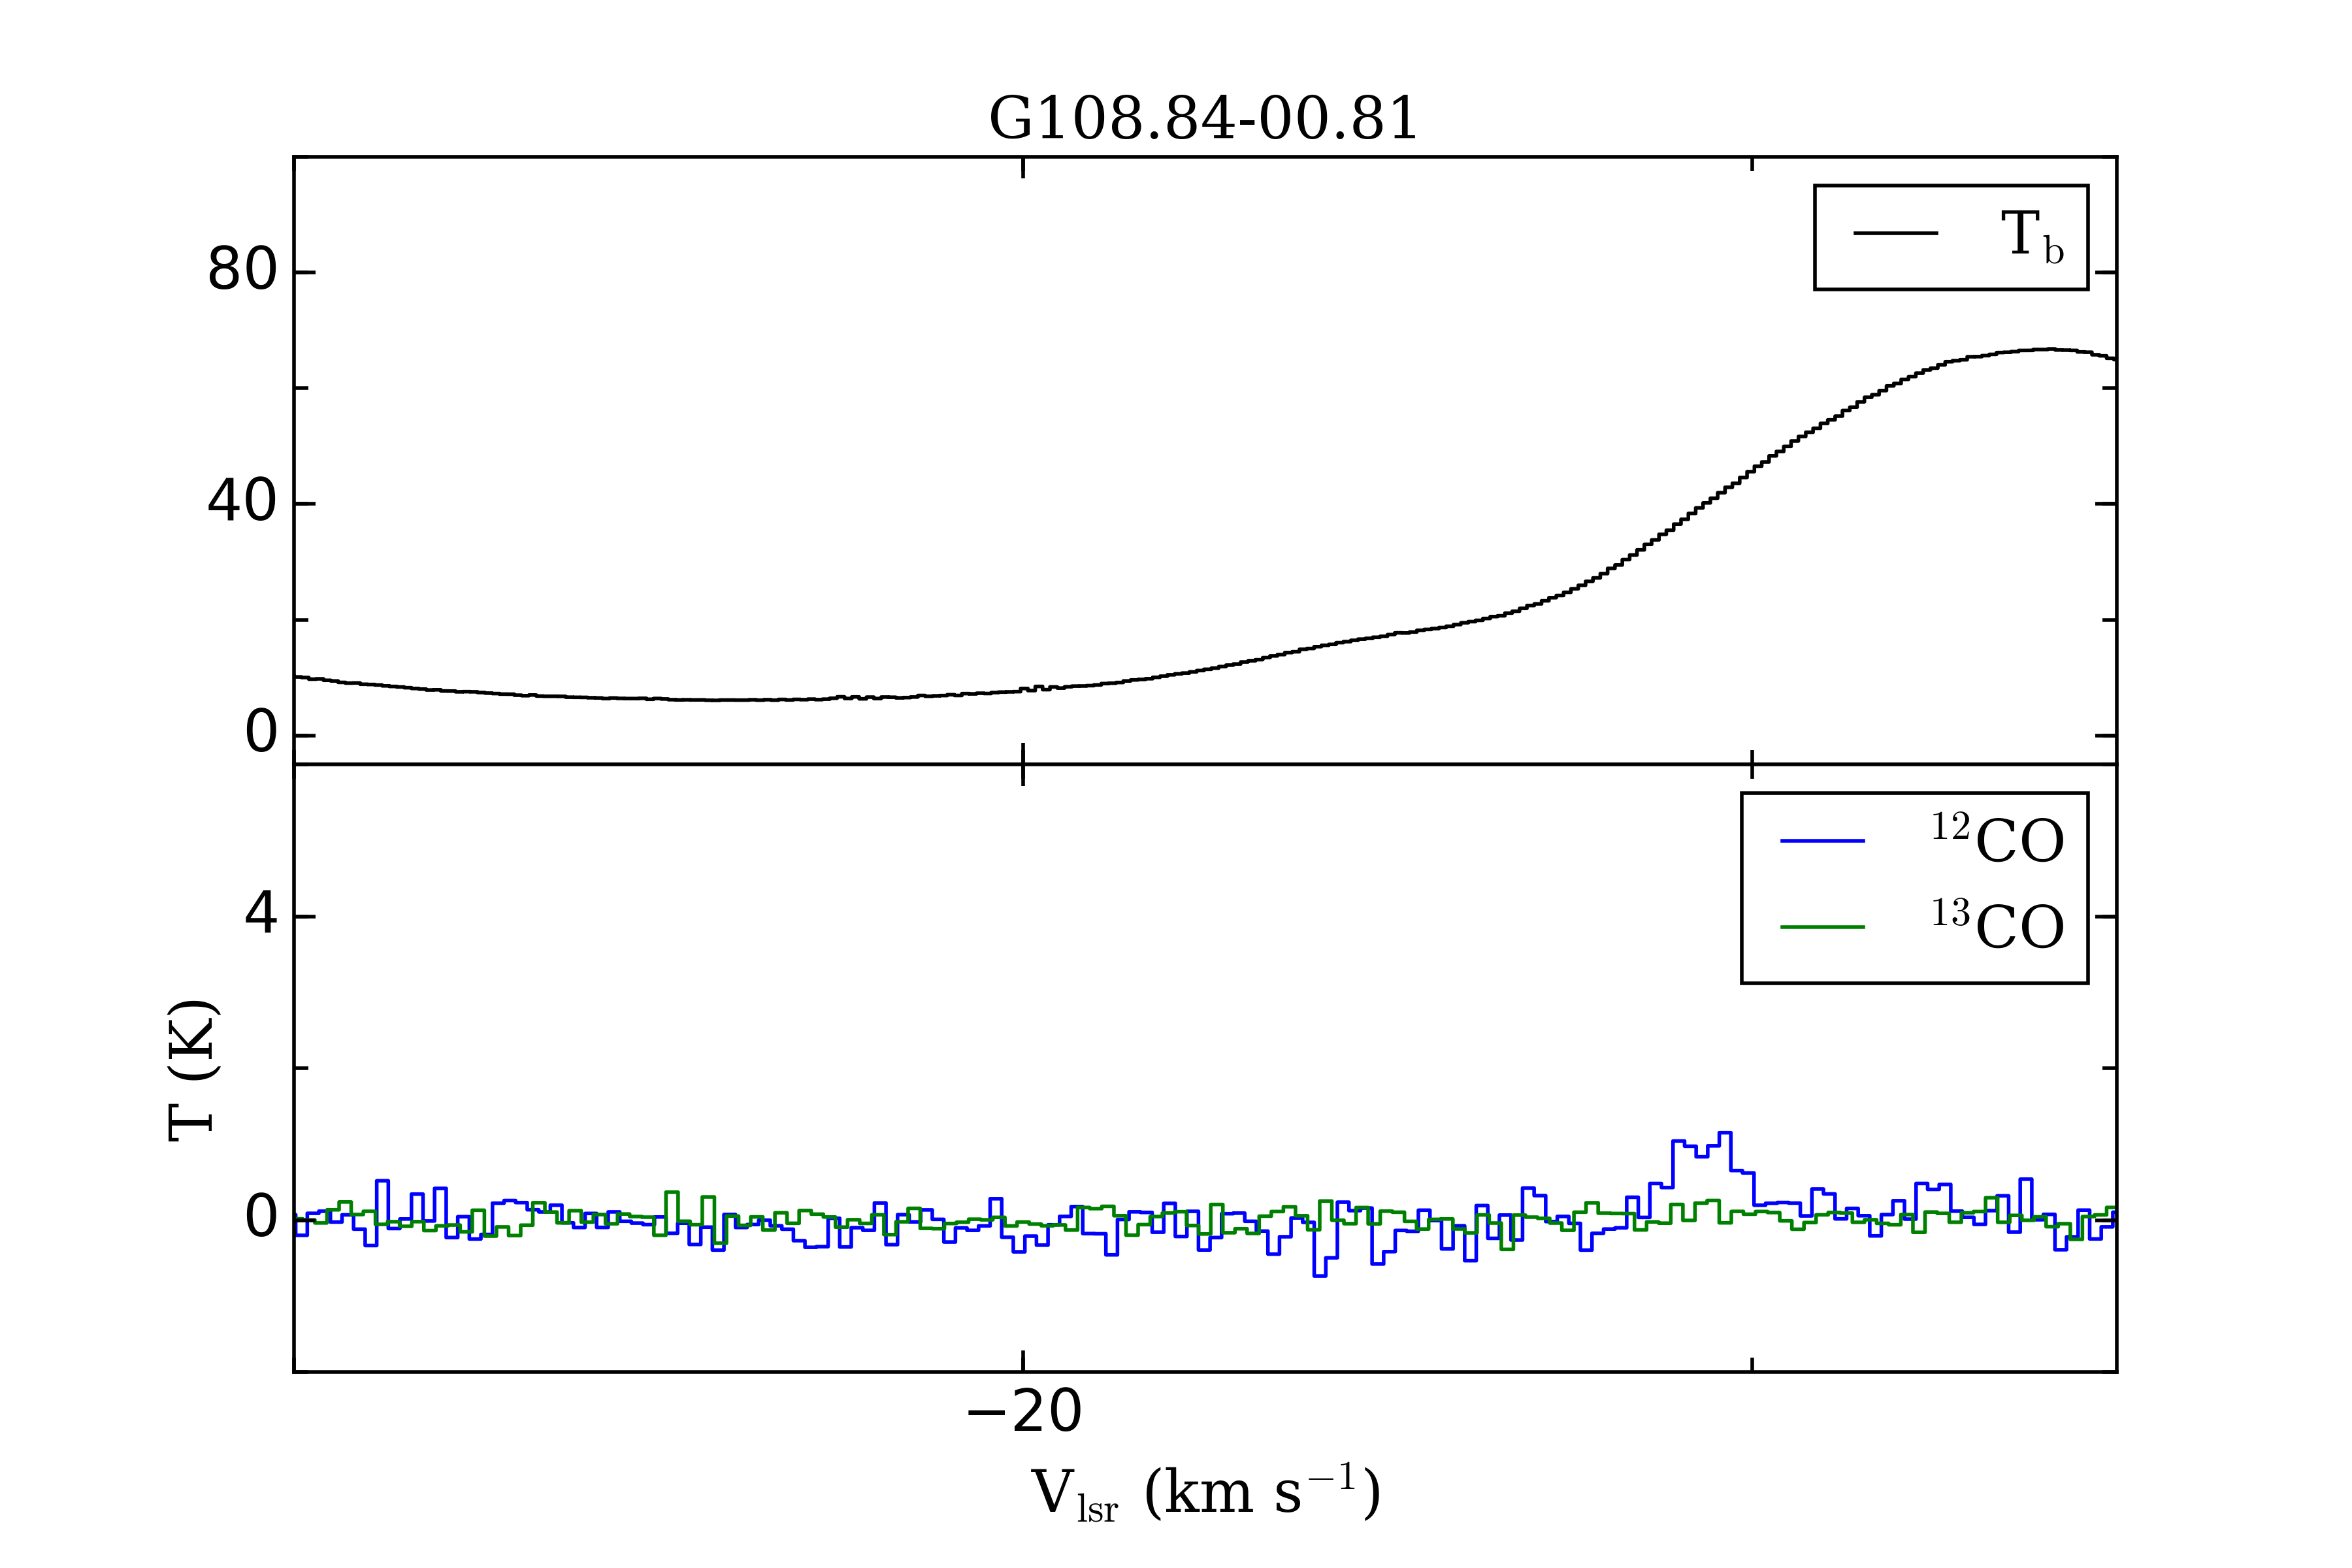
We unbiasedly selected PGCCs without constraint on visual extinction and presence of Young Stellar Objects (YSOs), which could prevent cold gas from external and internal heating. A embedded YSO is found to locate inside PGCCs G108.84-00.81. Though LG03 stated that the presence of YSOs would not significantly affect the detection rate of HINSA, the statement should be checked further by including molecular clouds with far distance. In KG10, they selected sample clouds with peak visual extinction 6 mag and without YSOs inside.
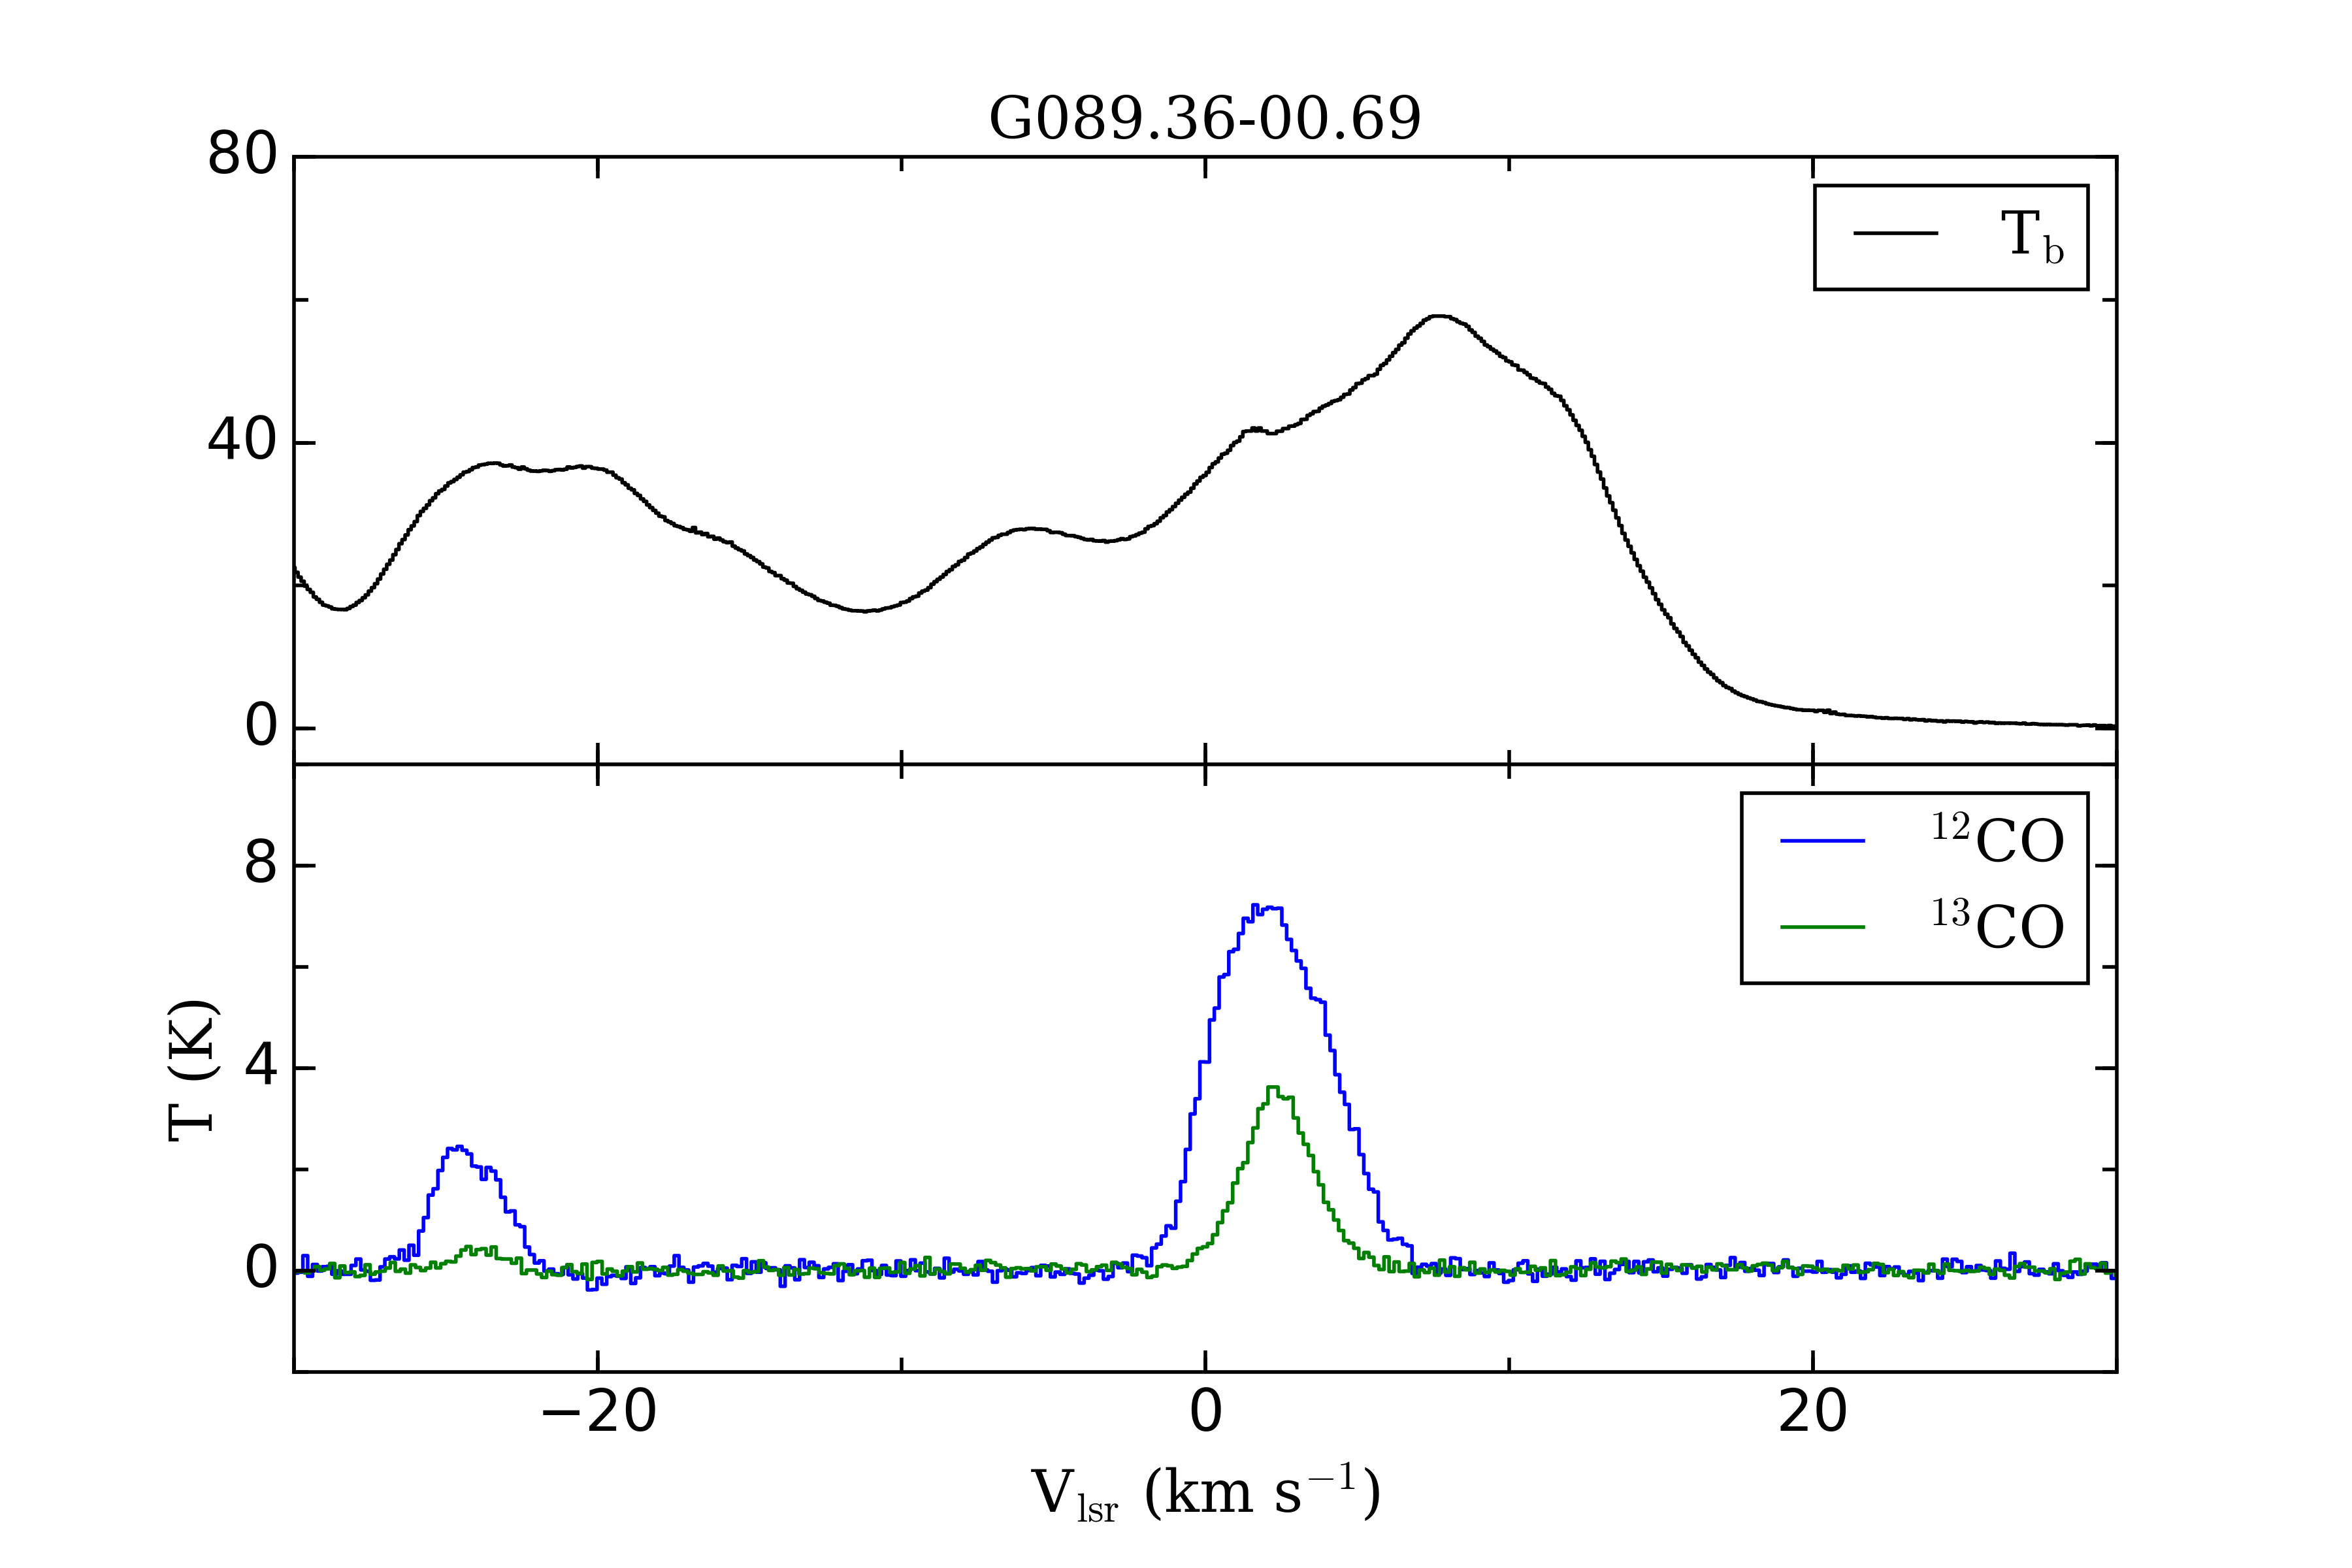
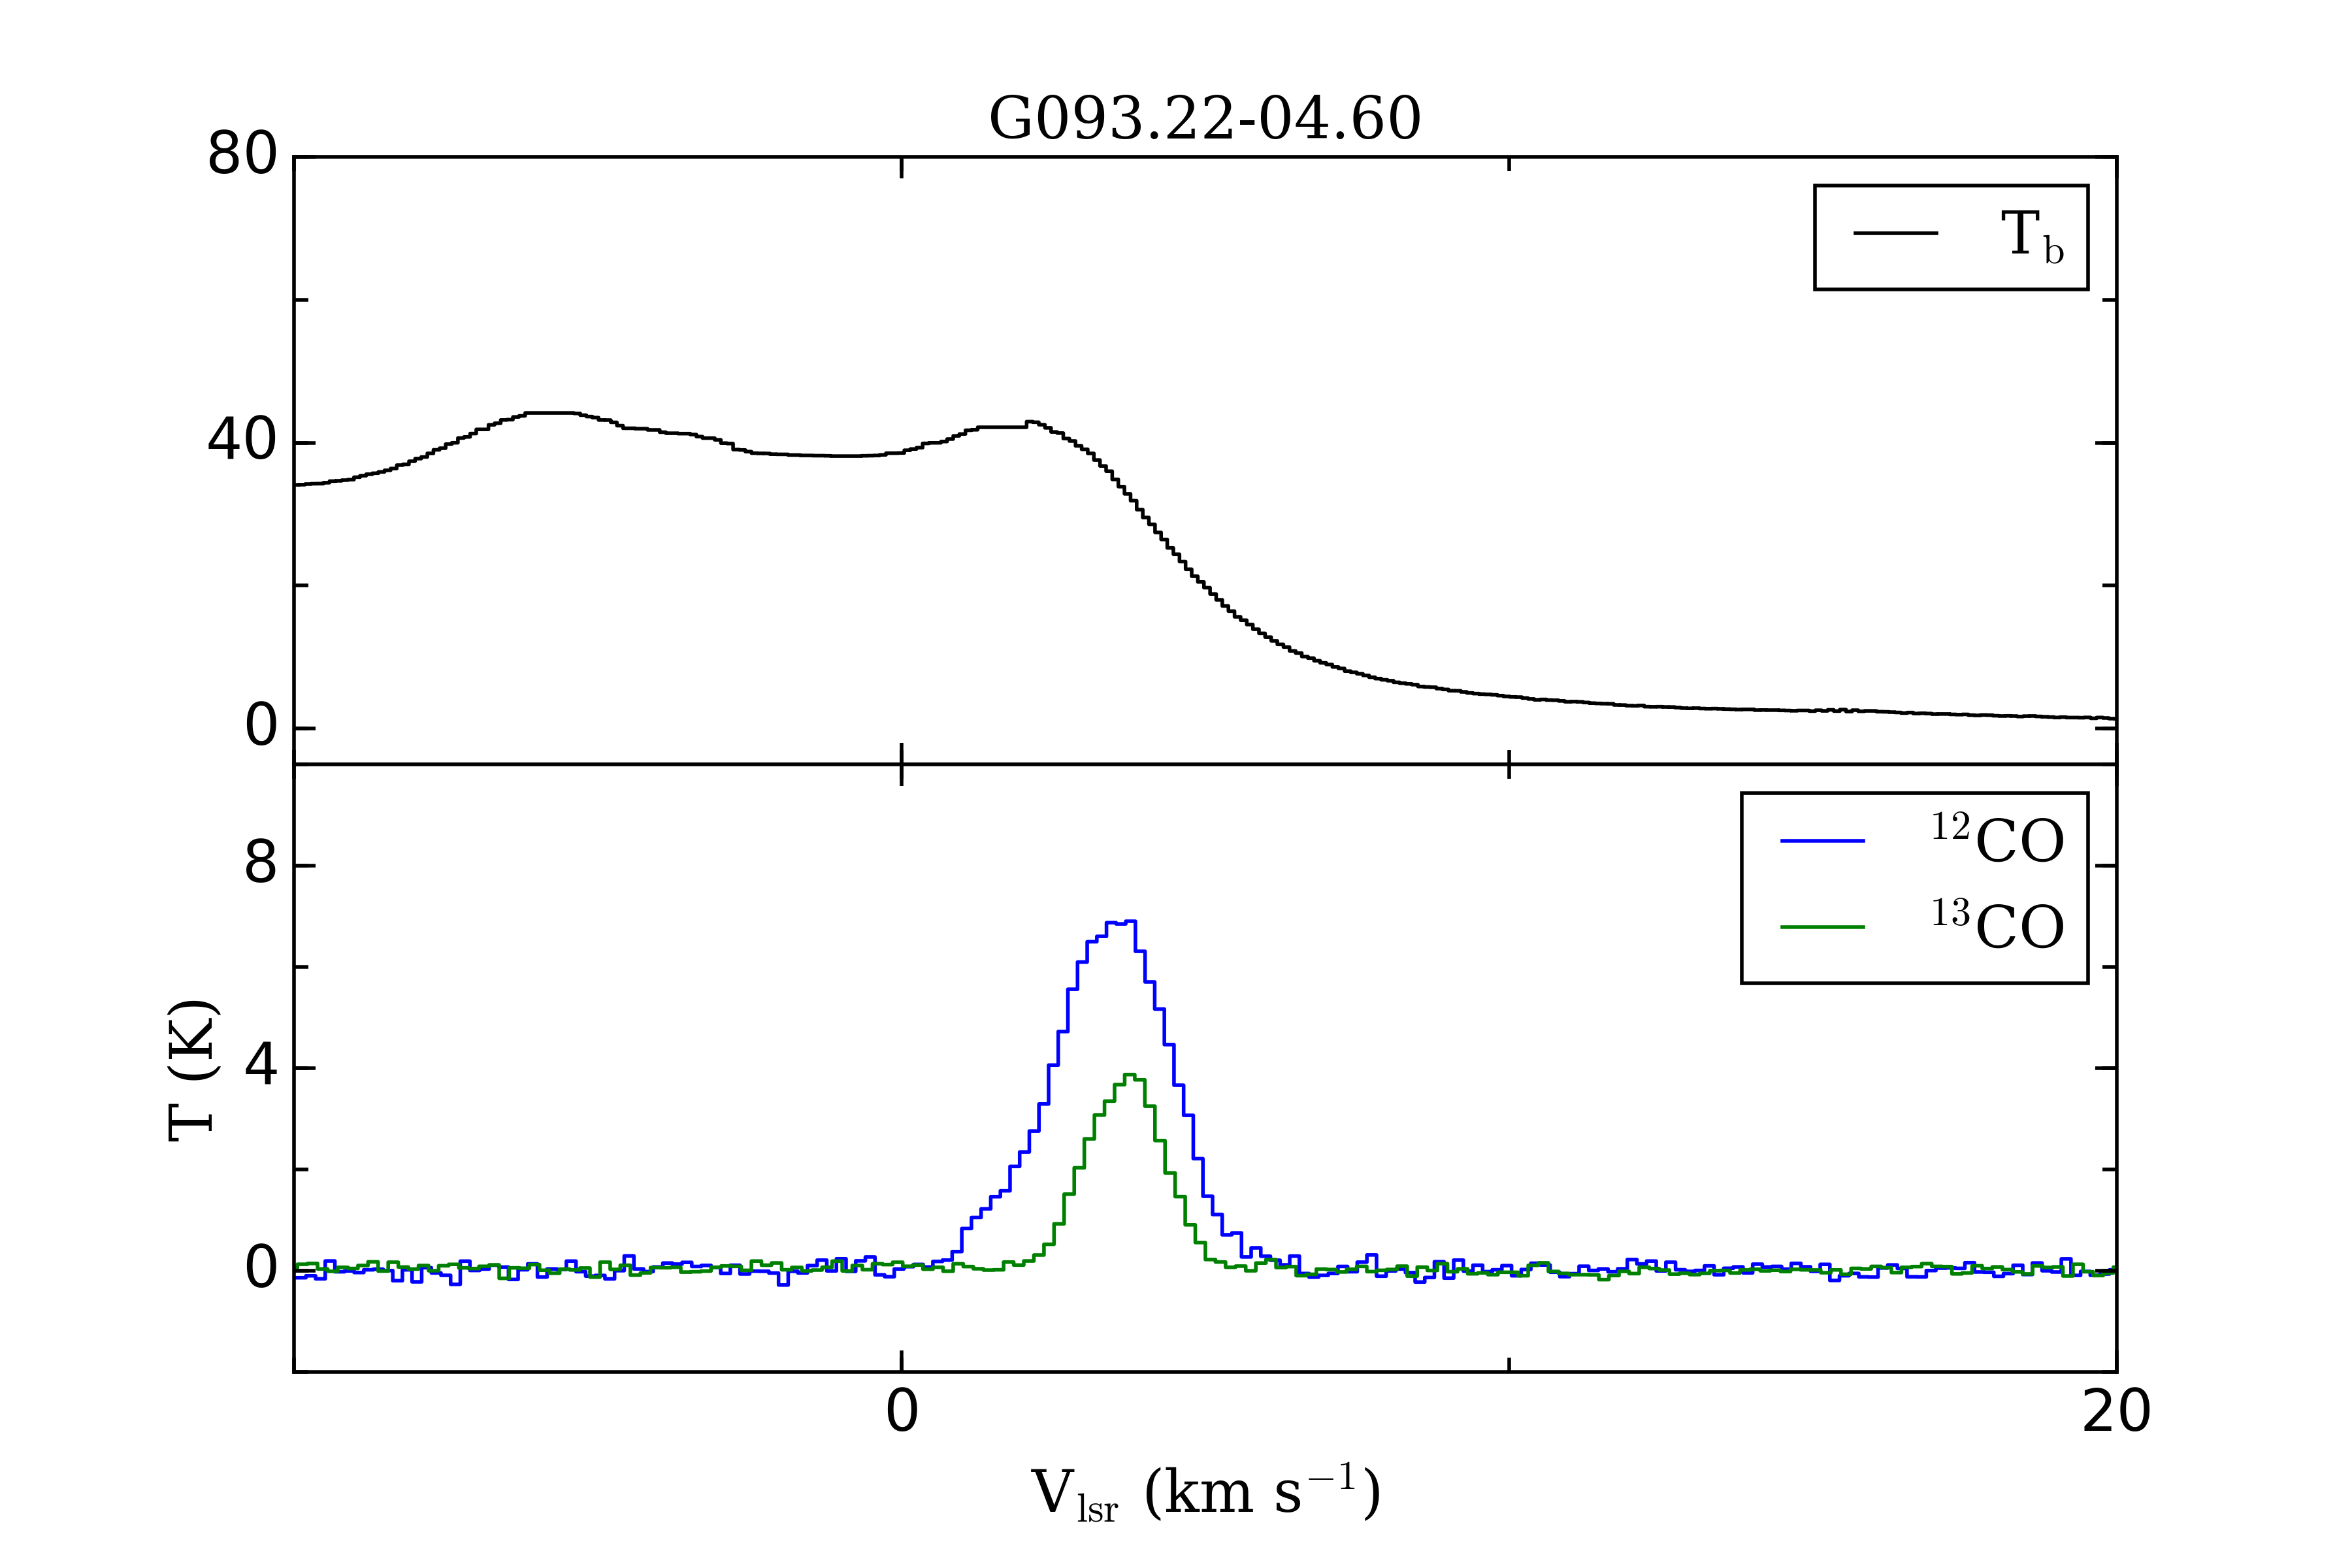
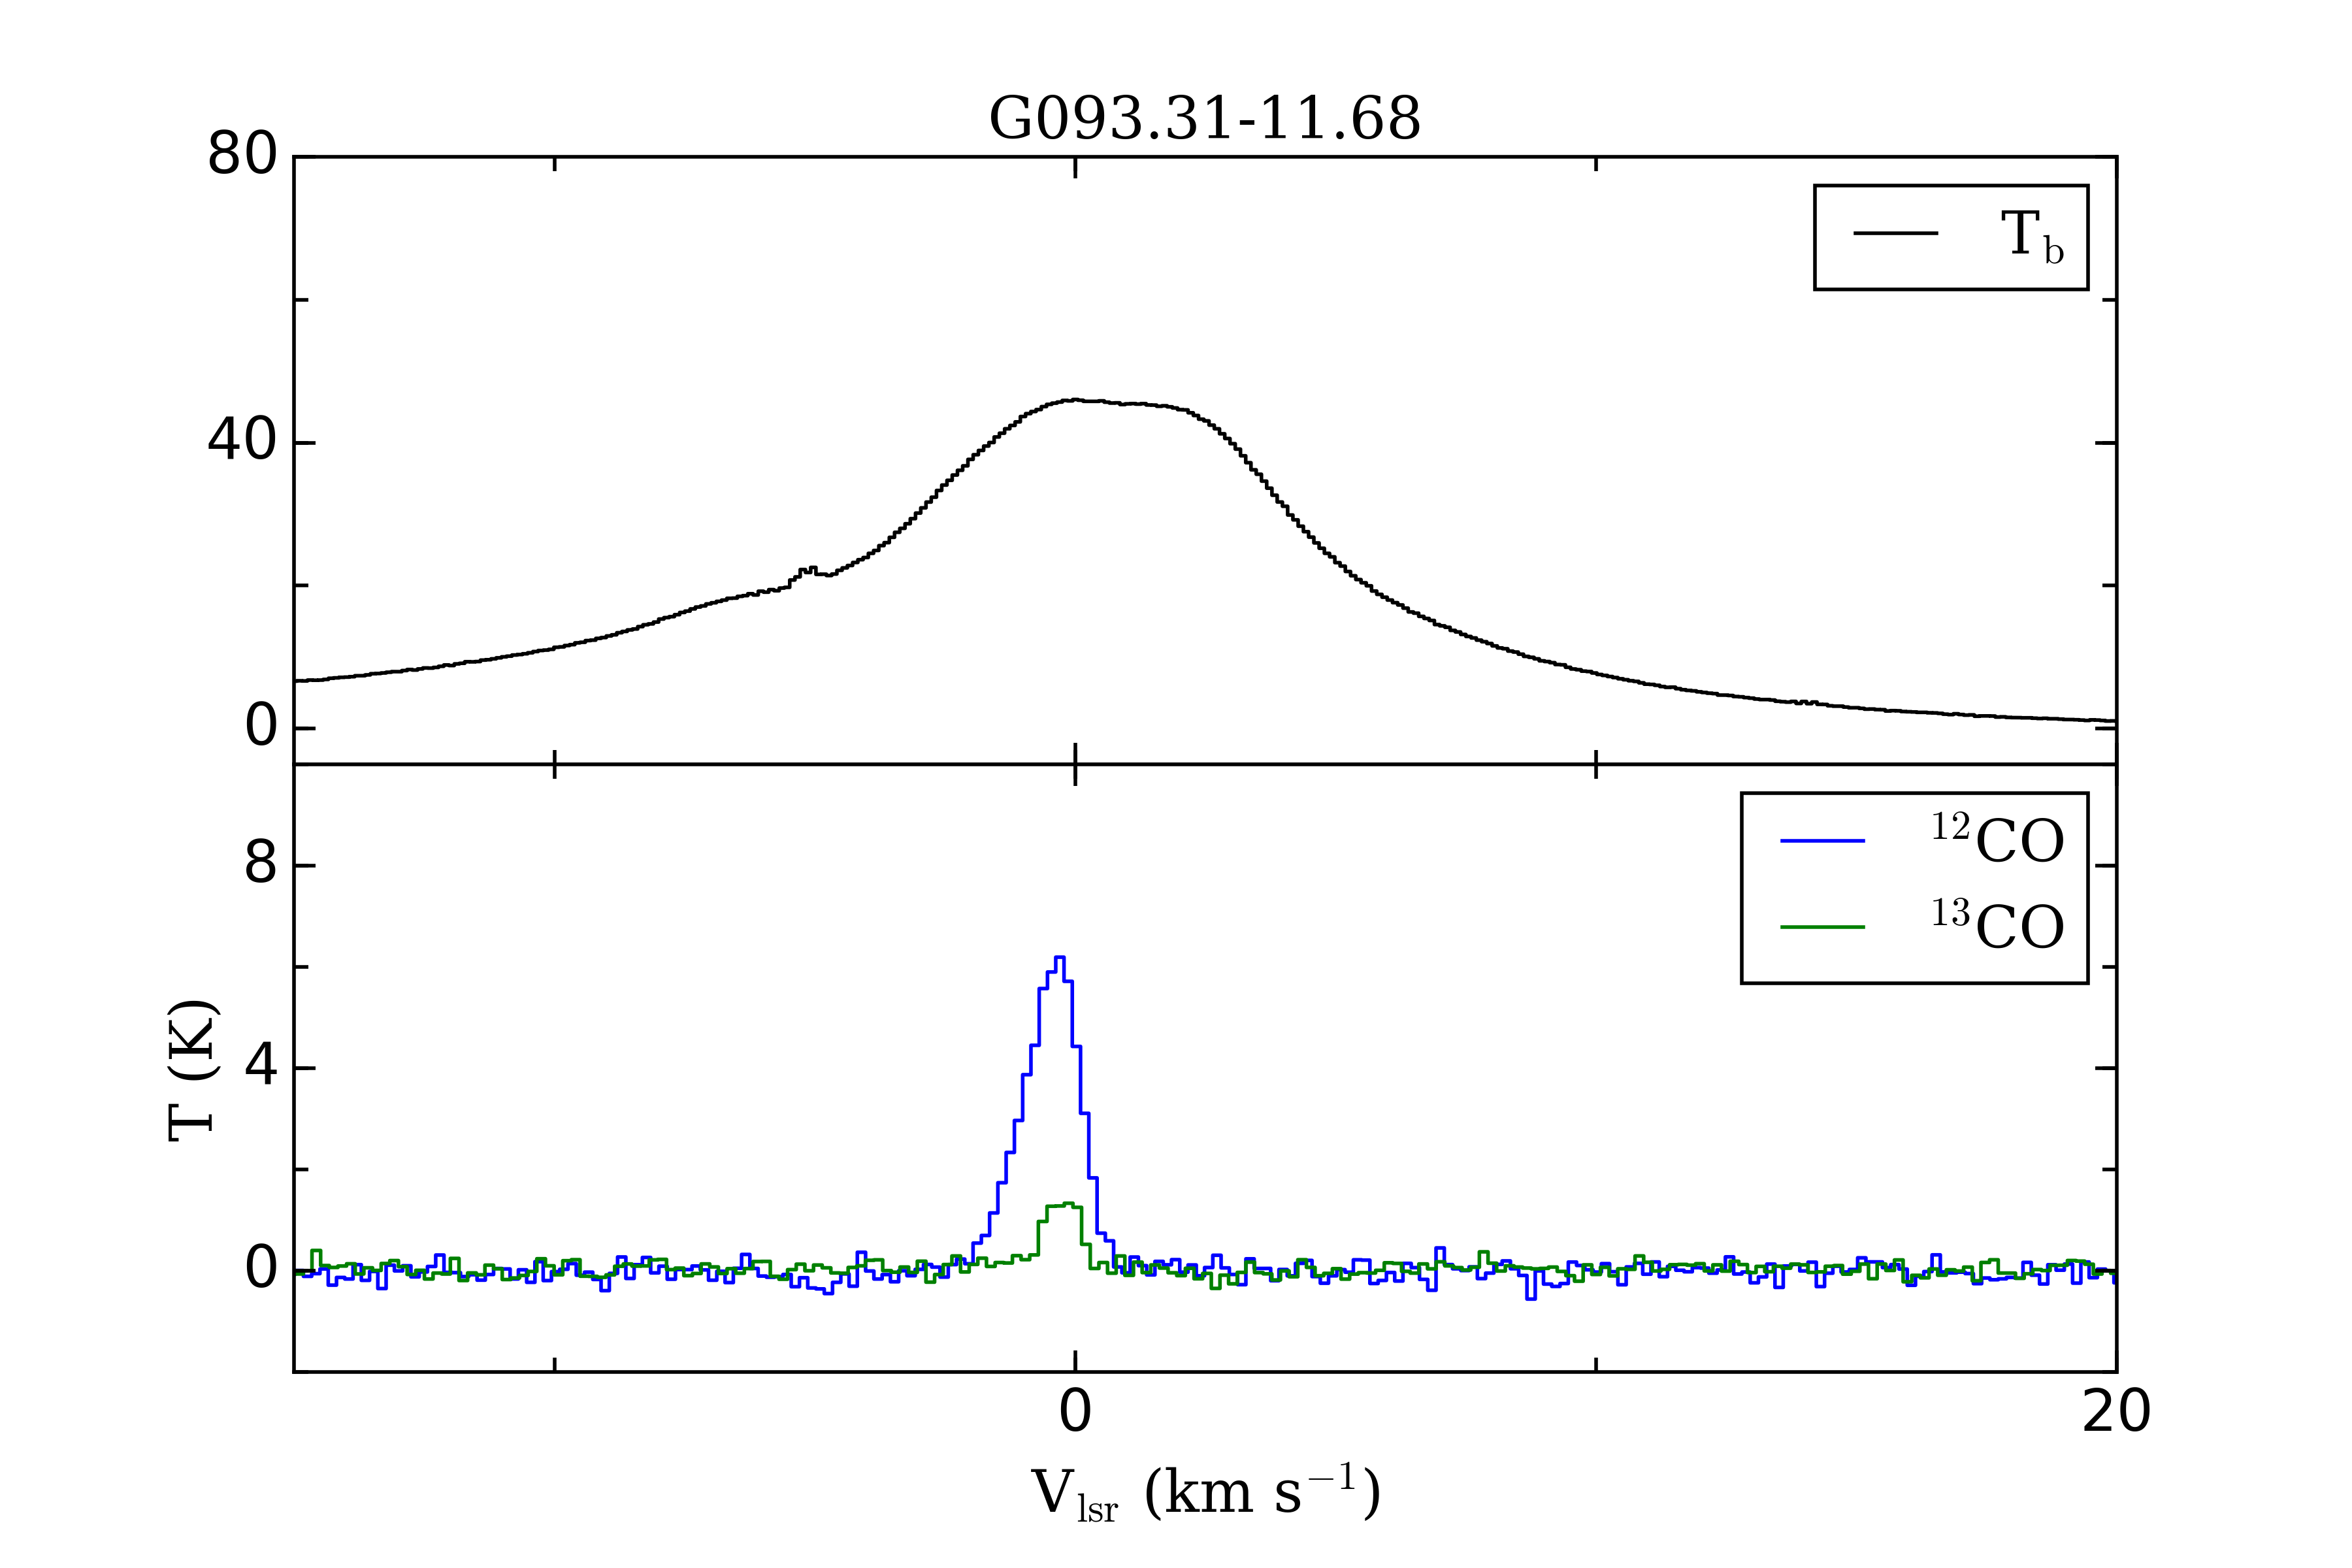
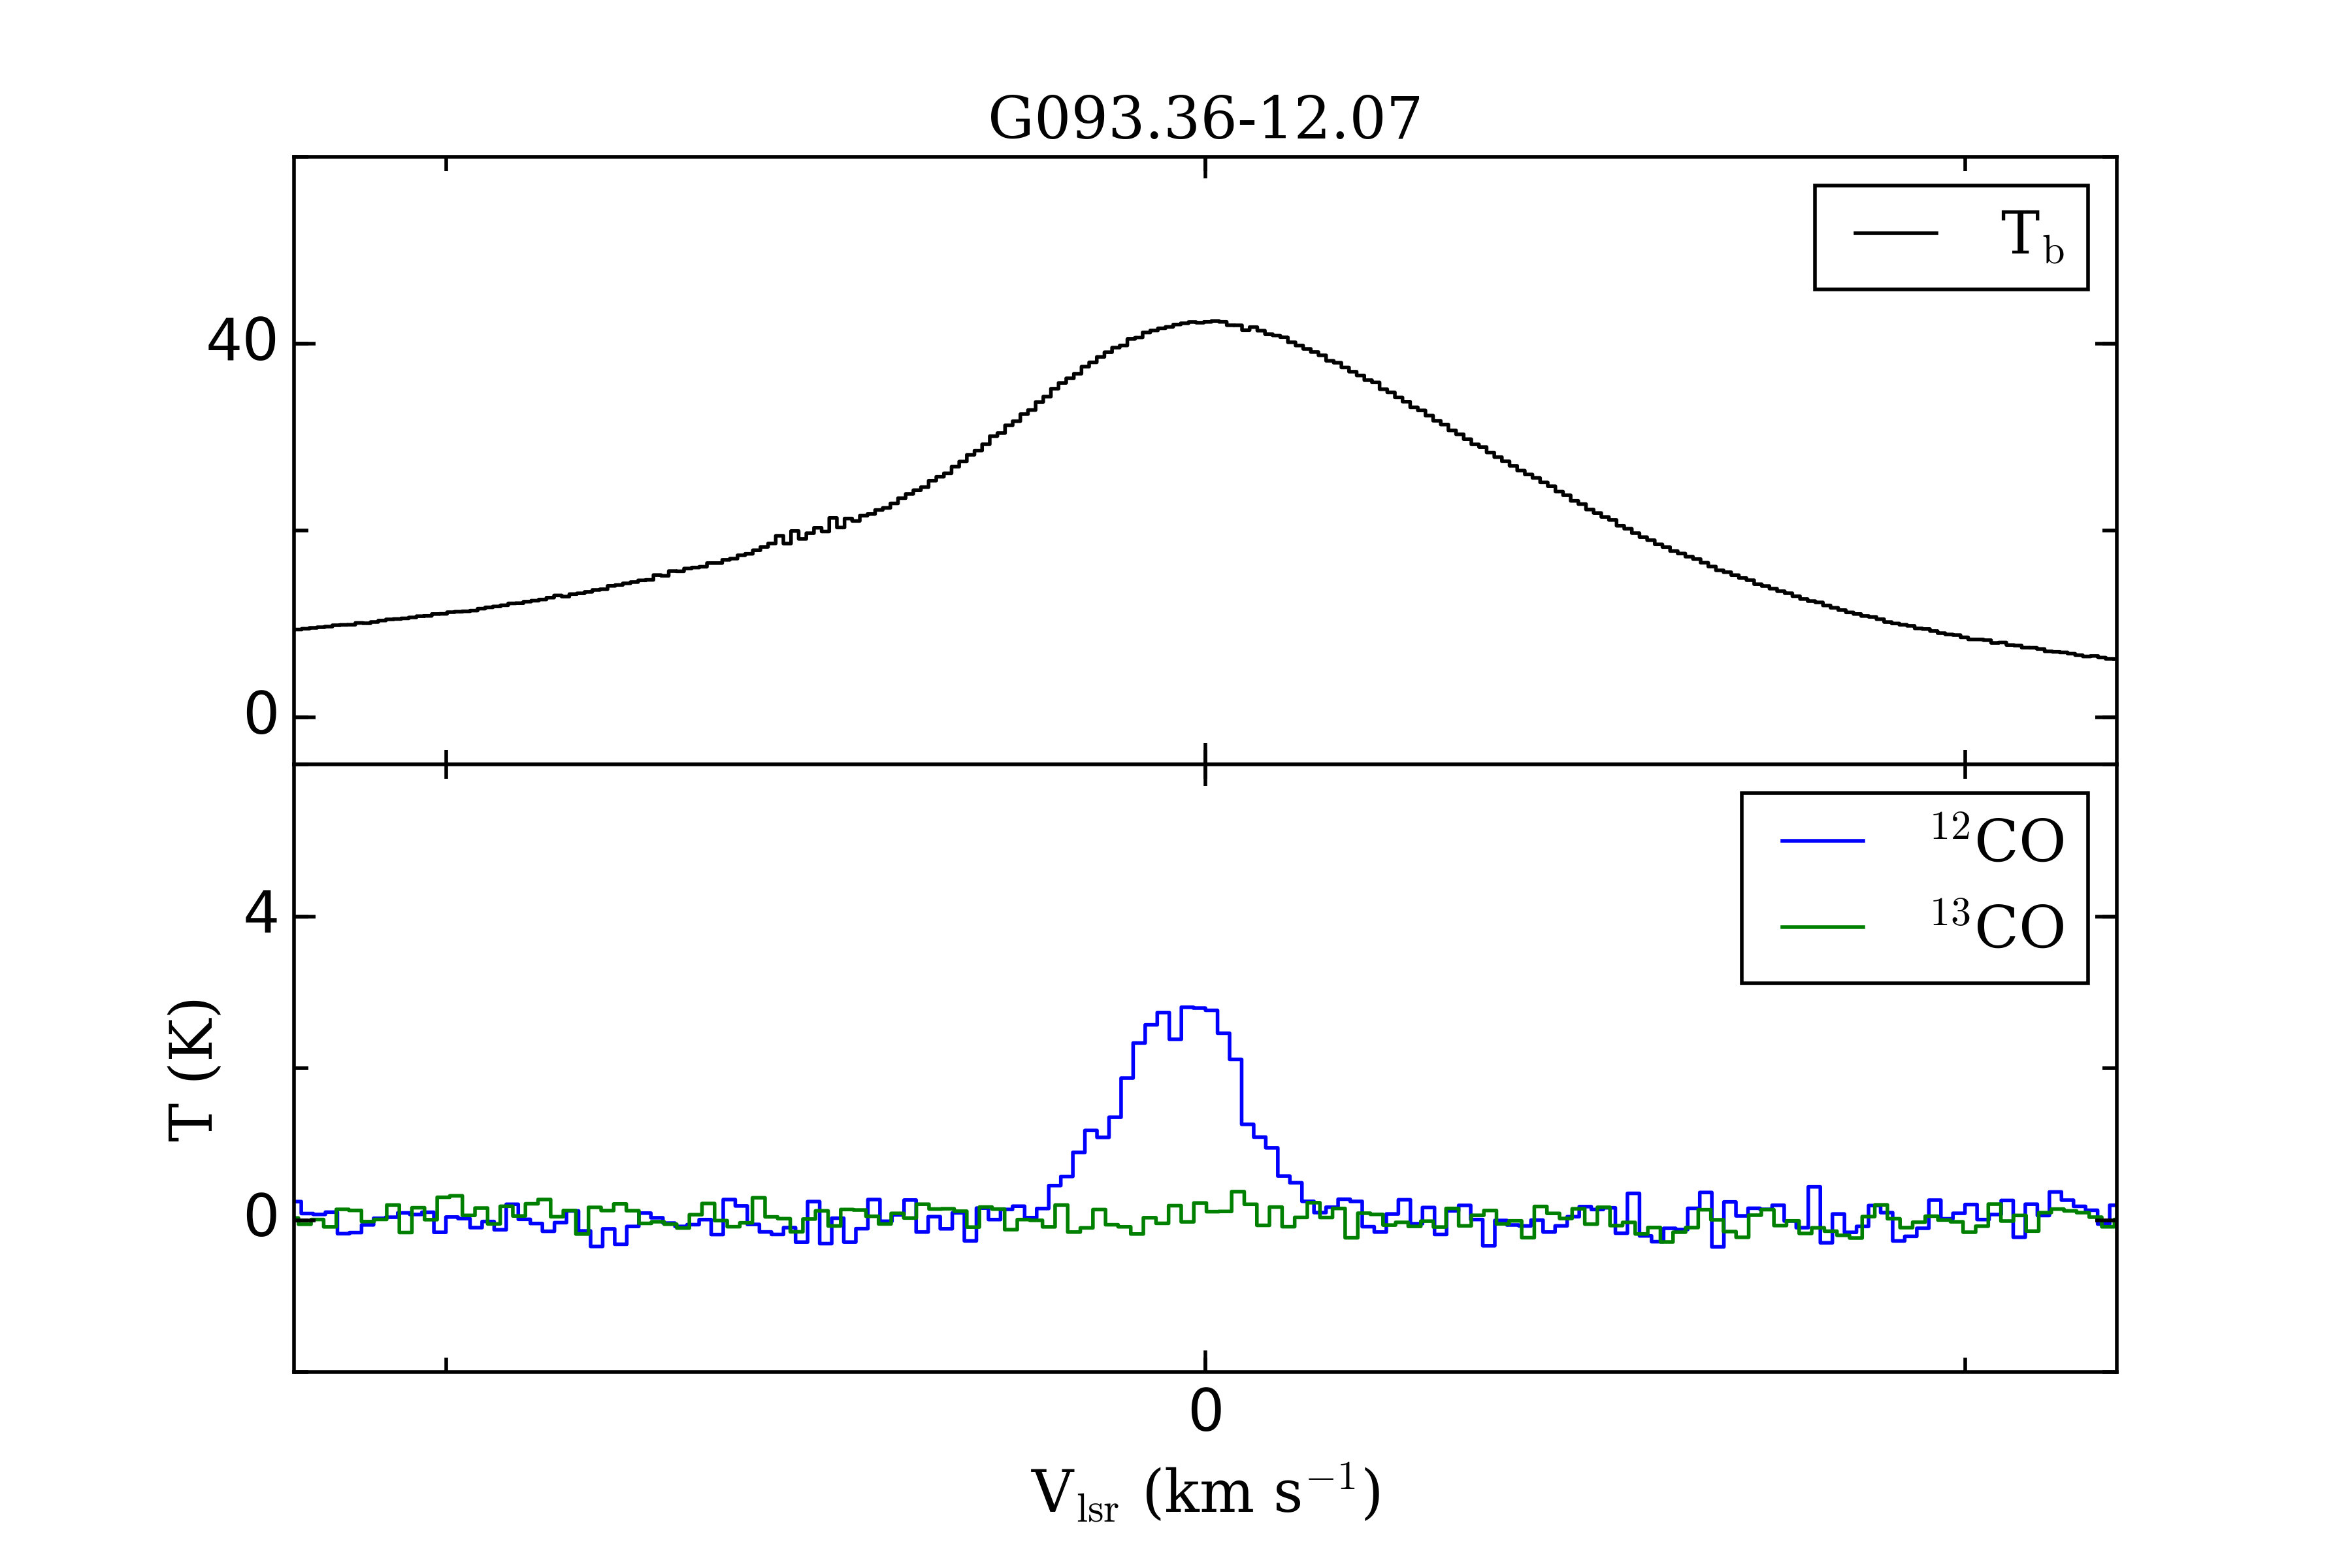
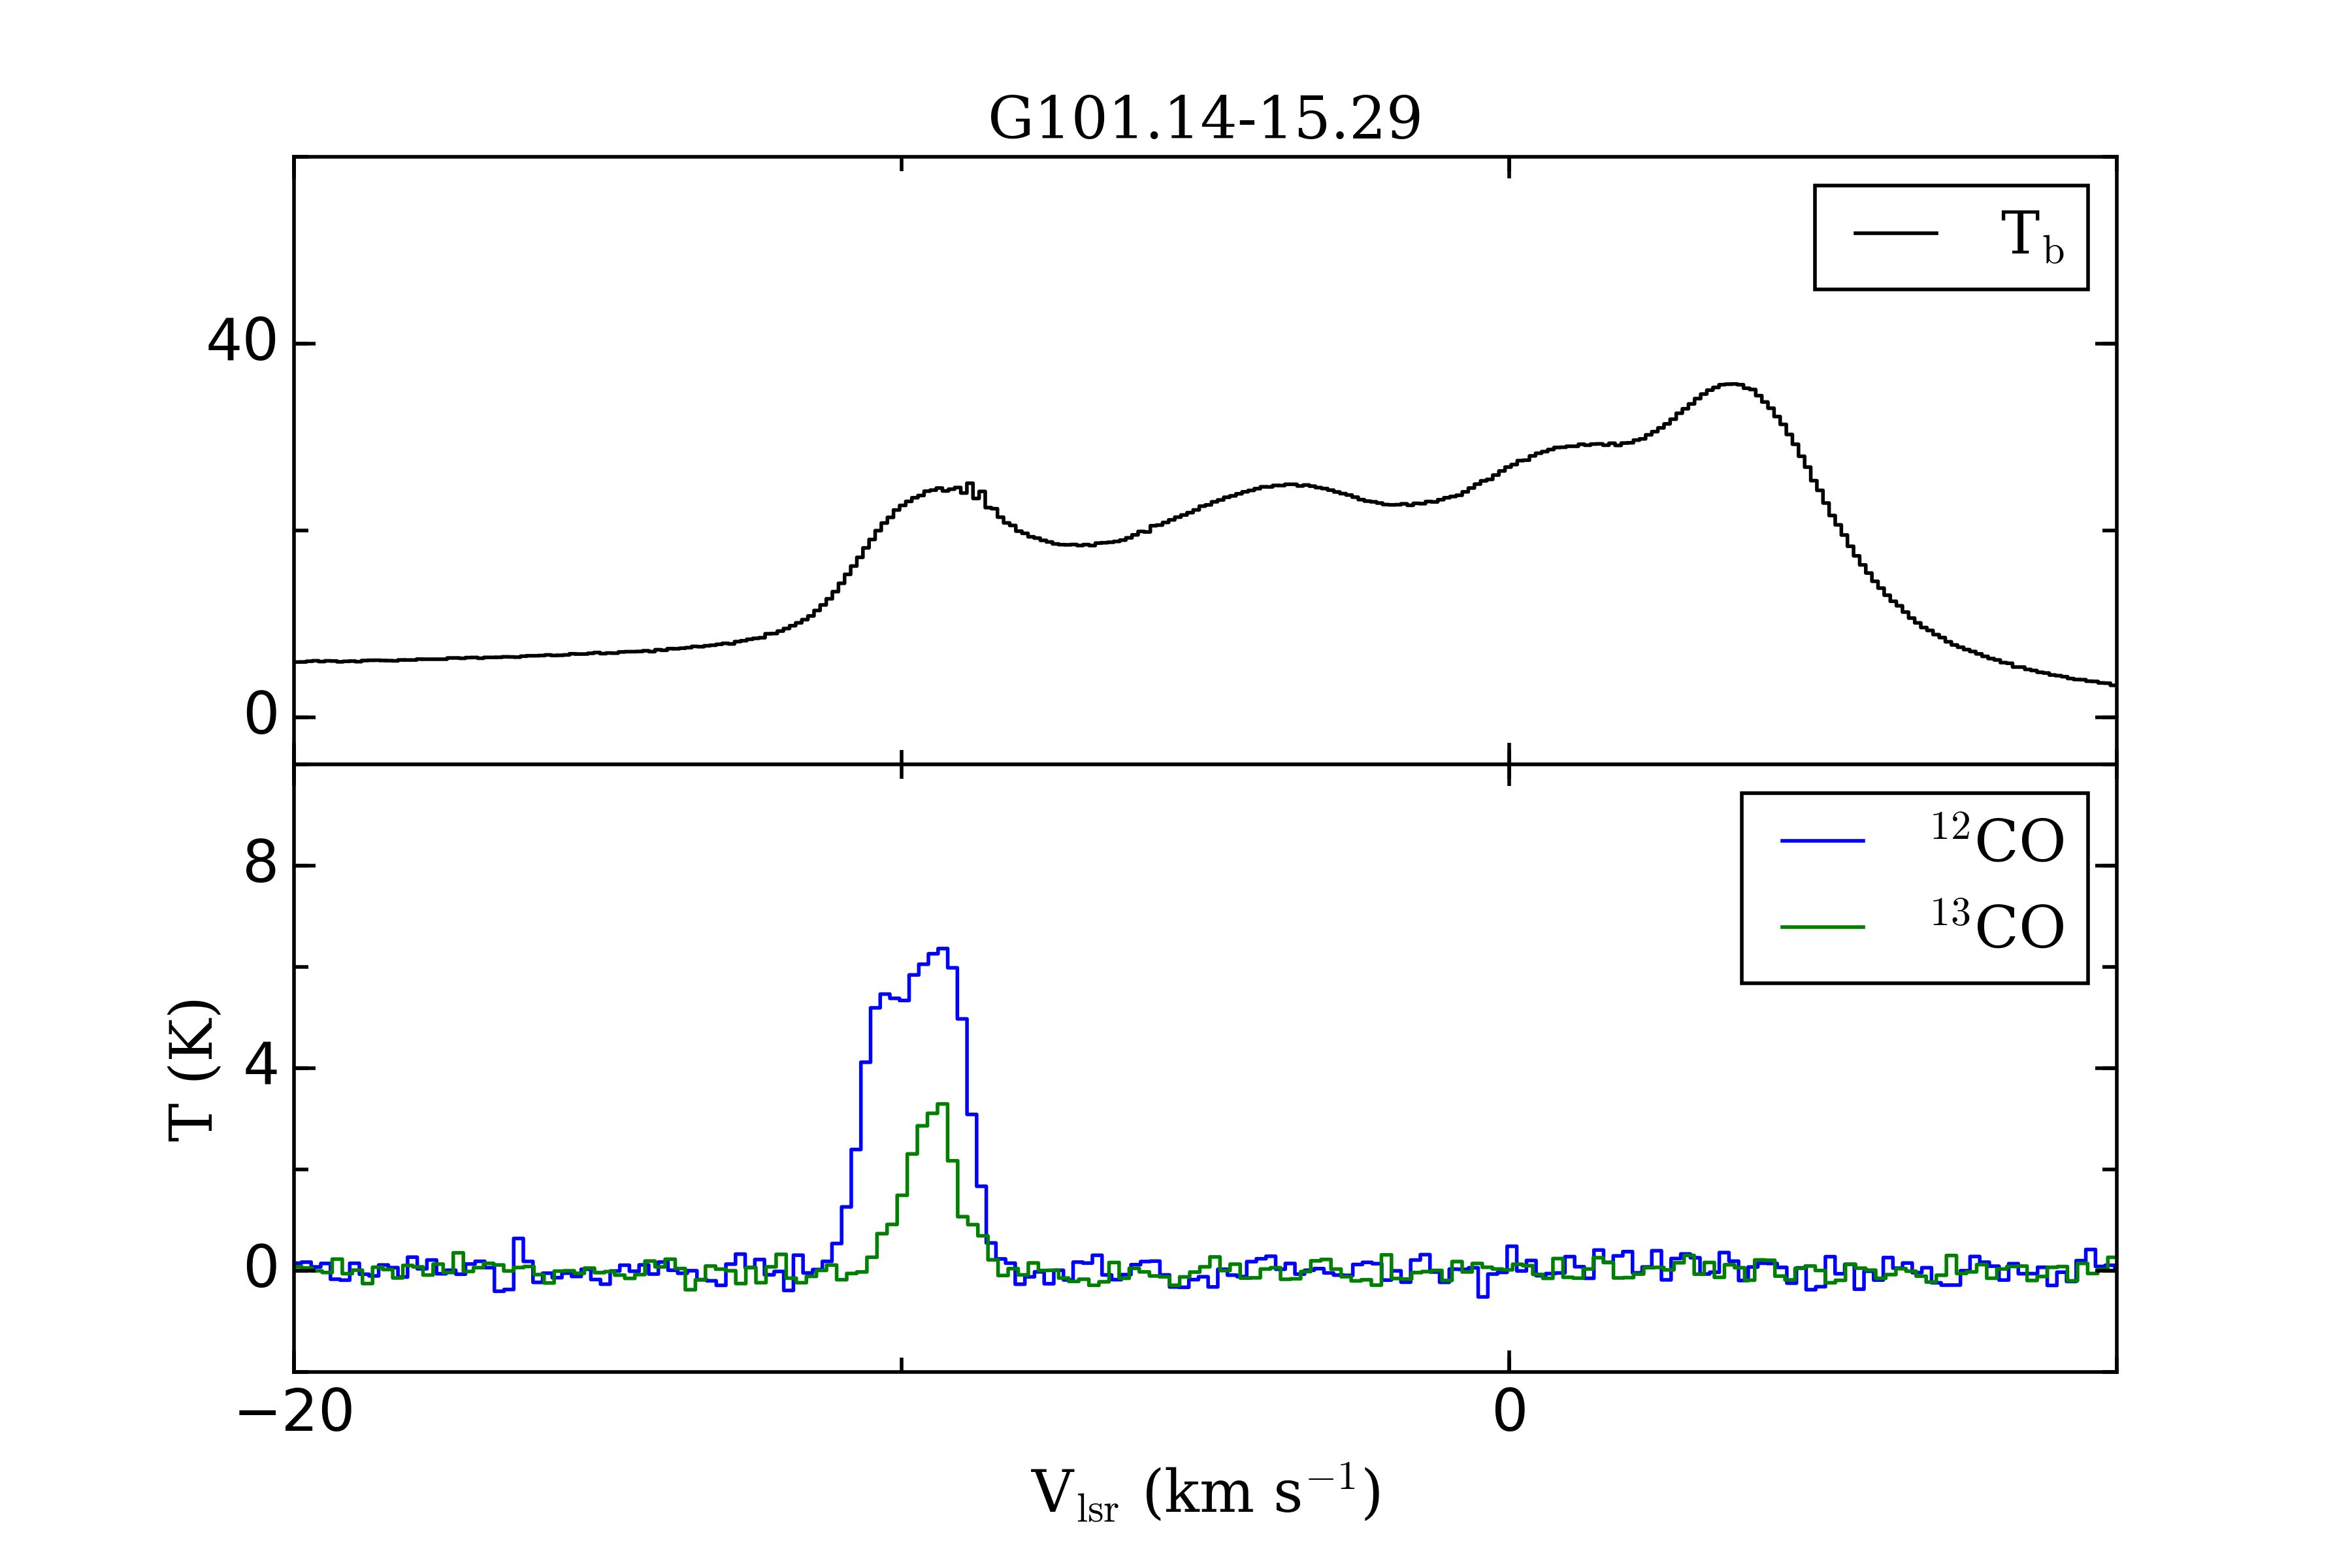
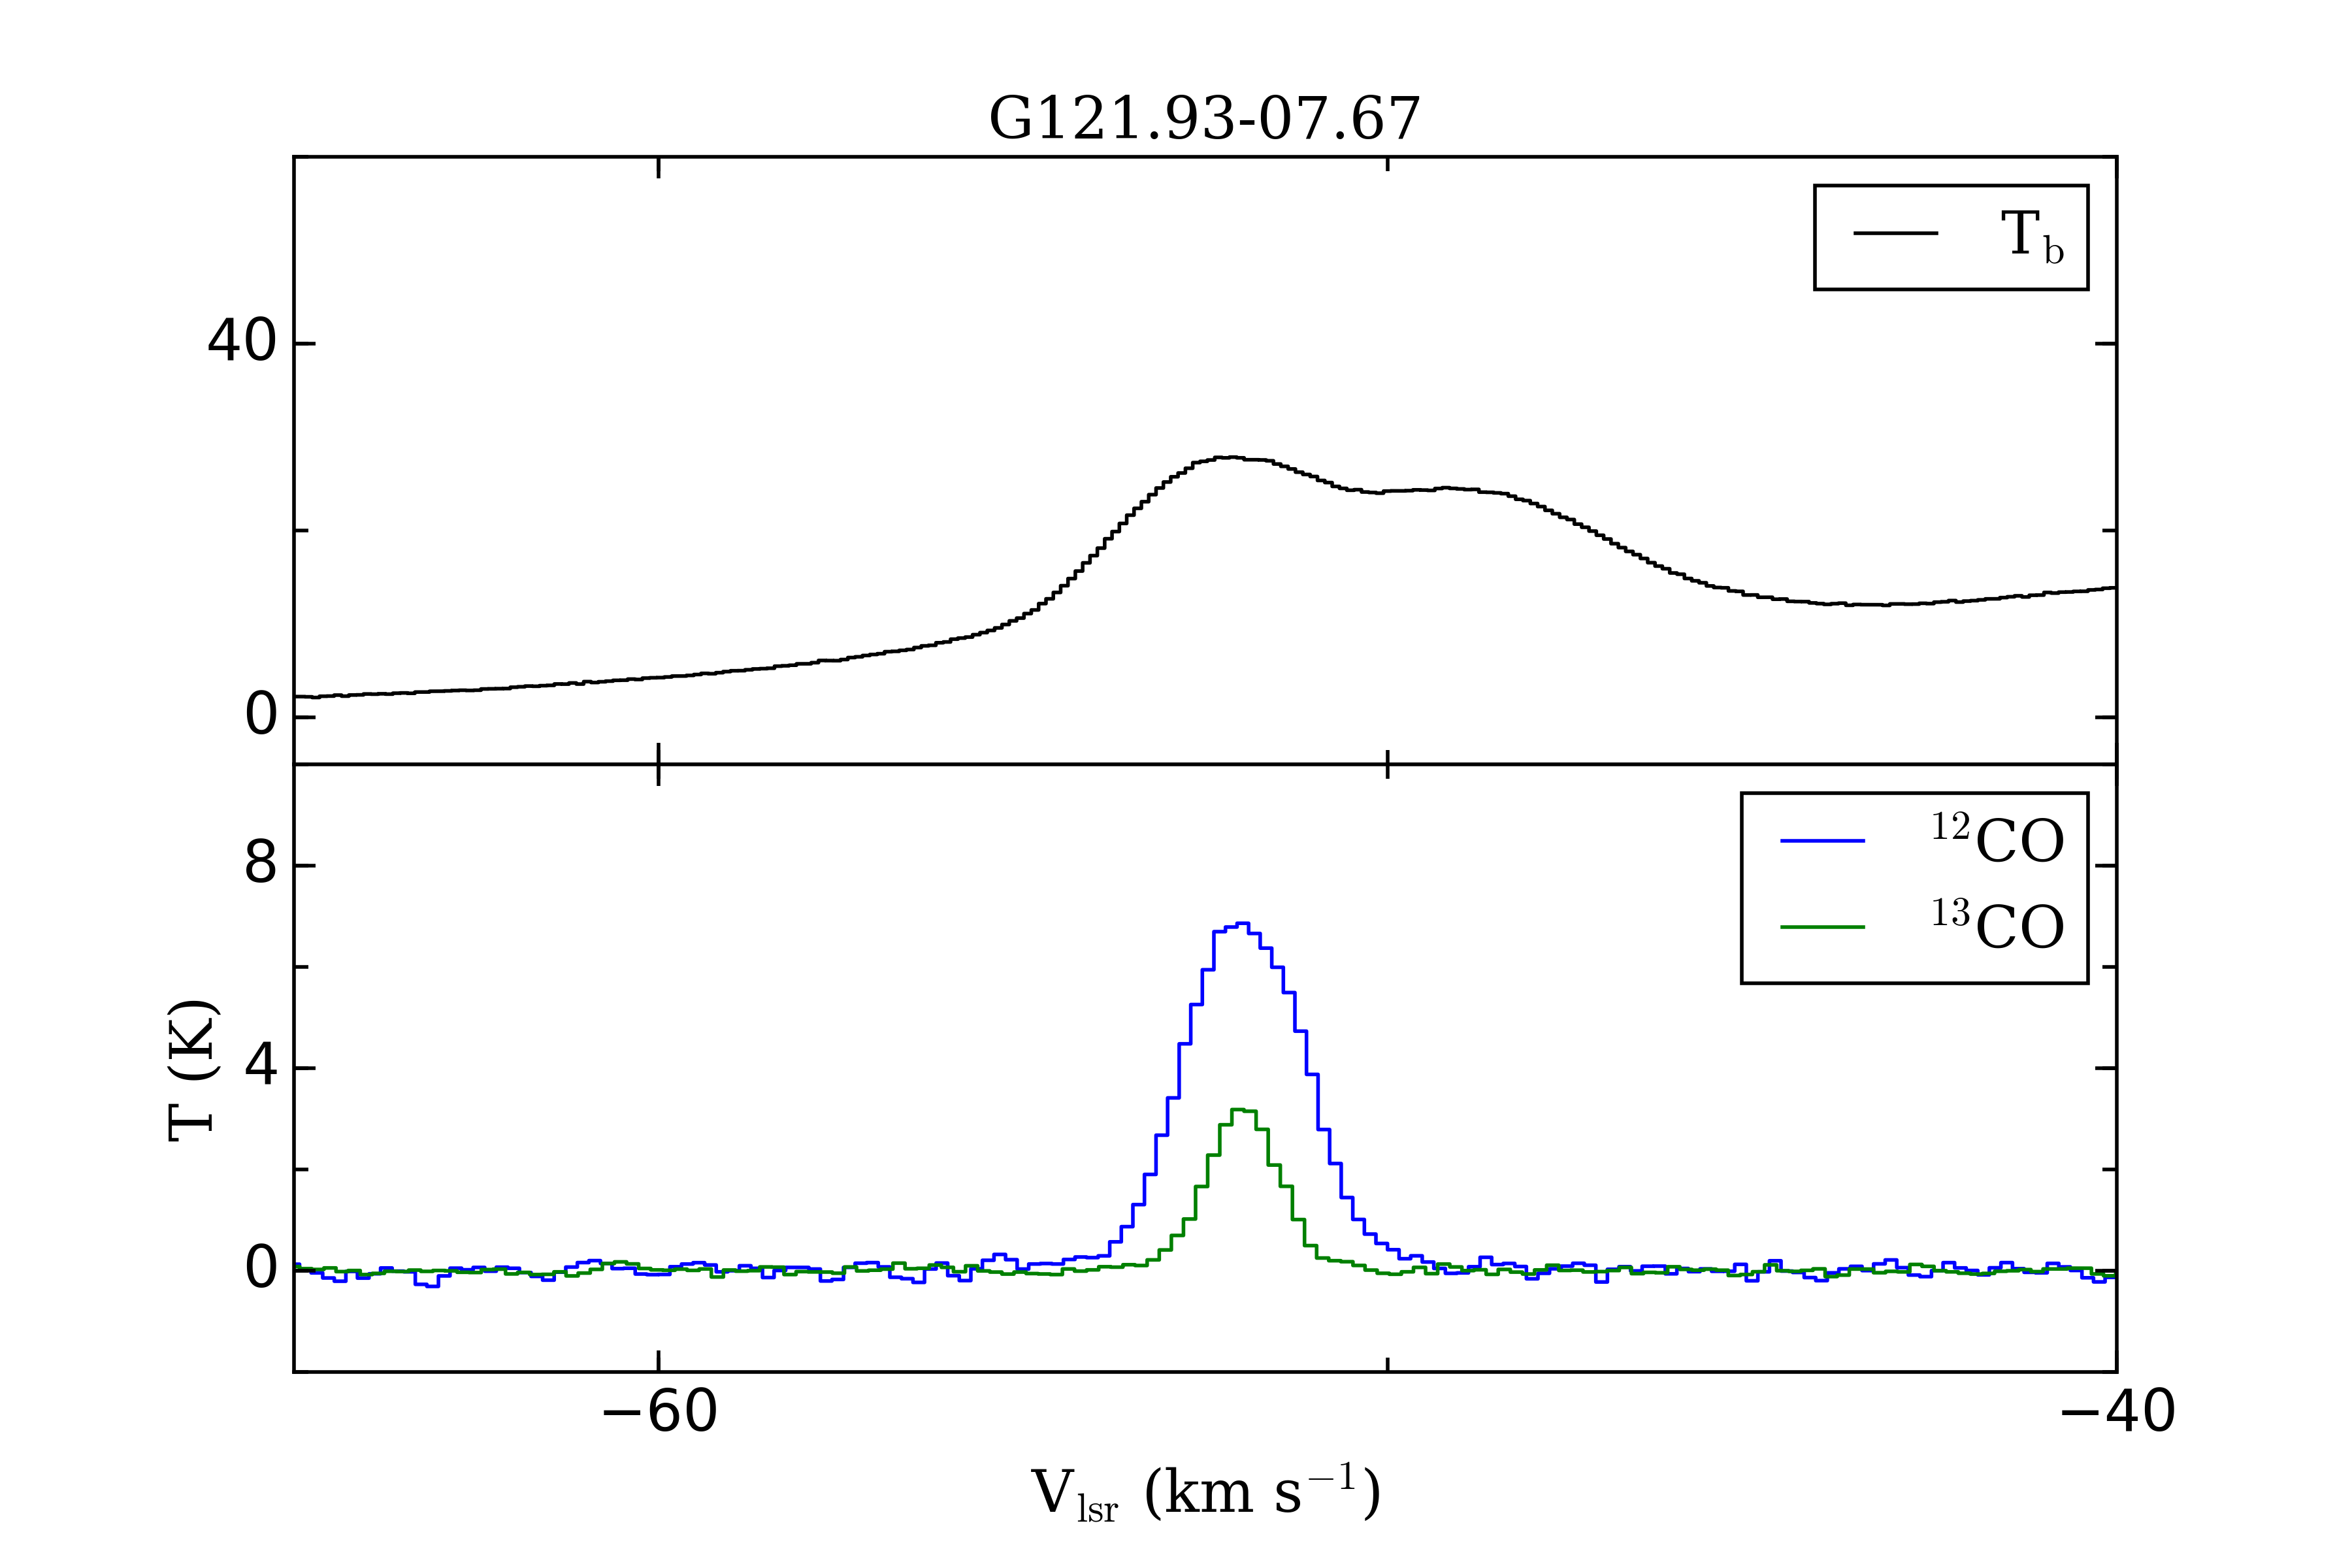
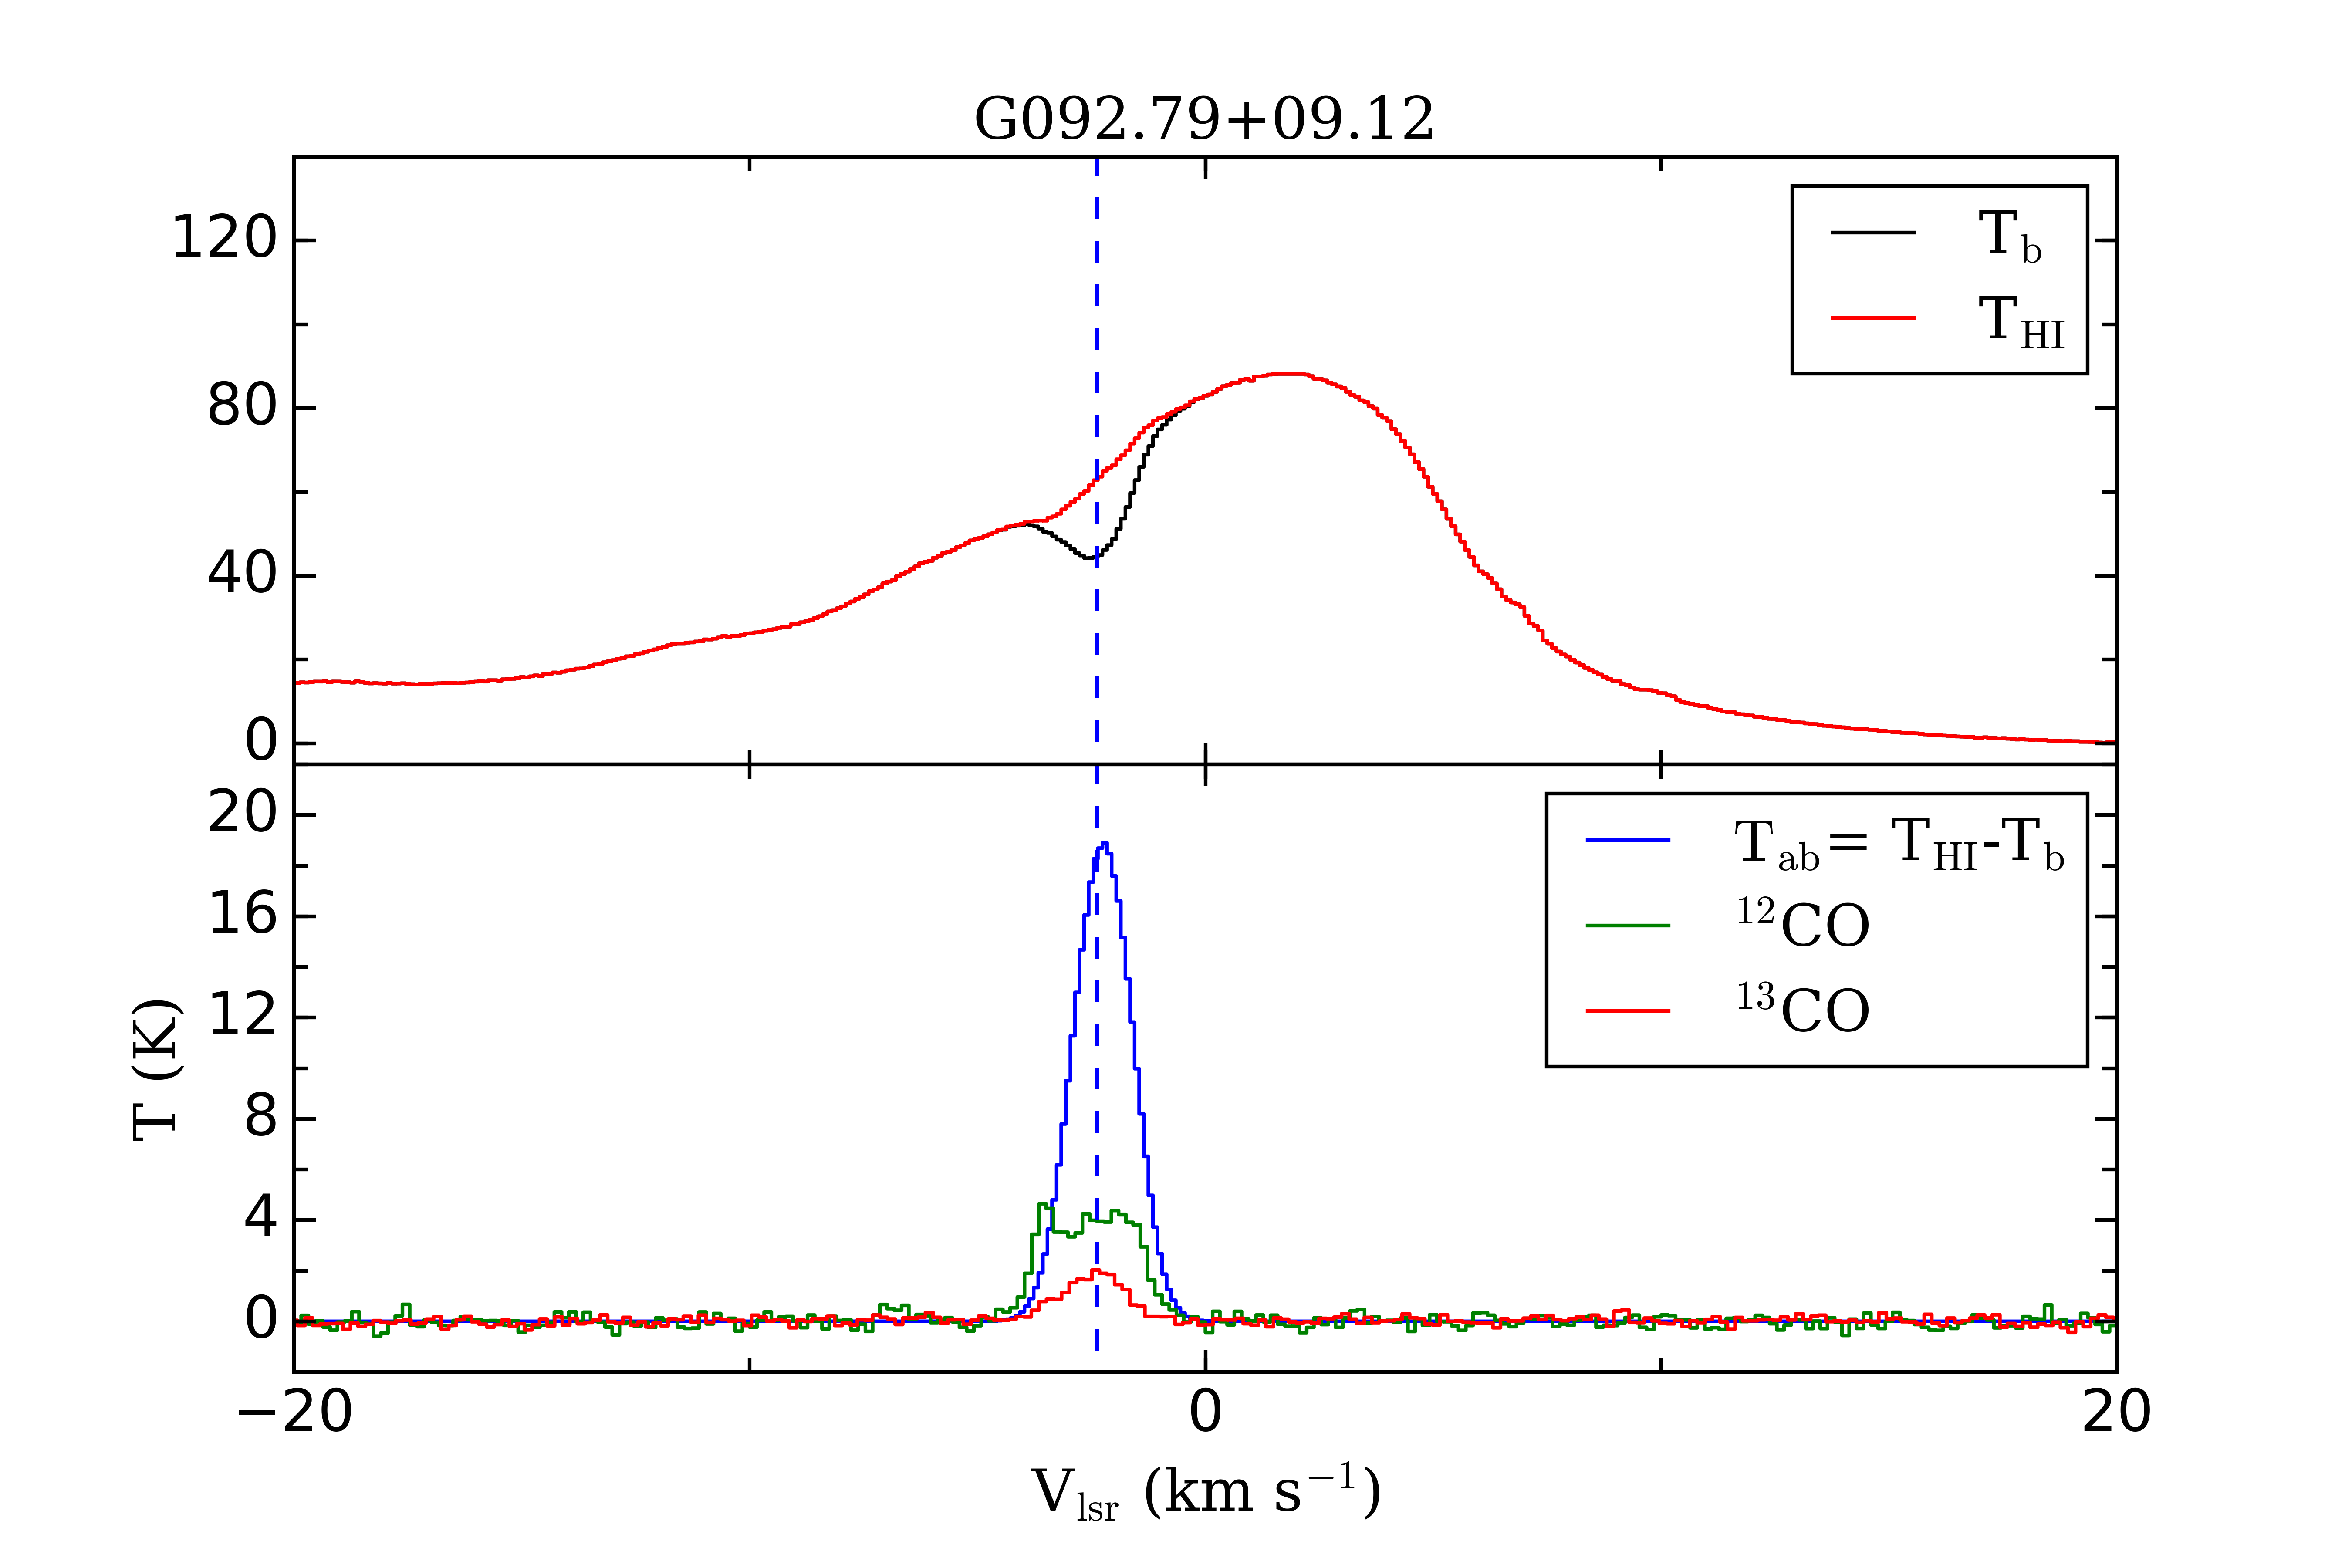
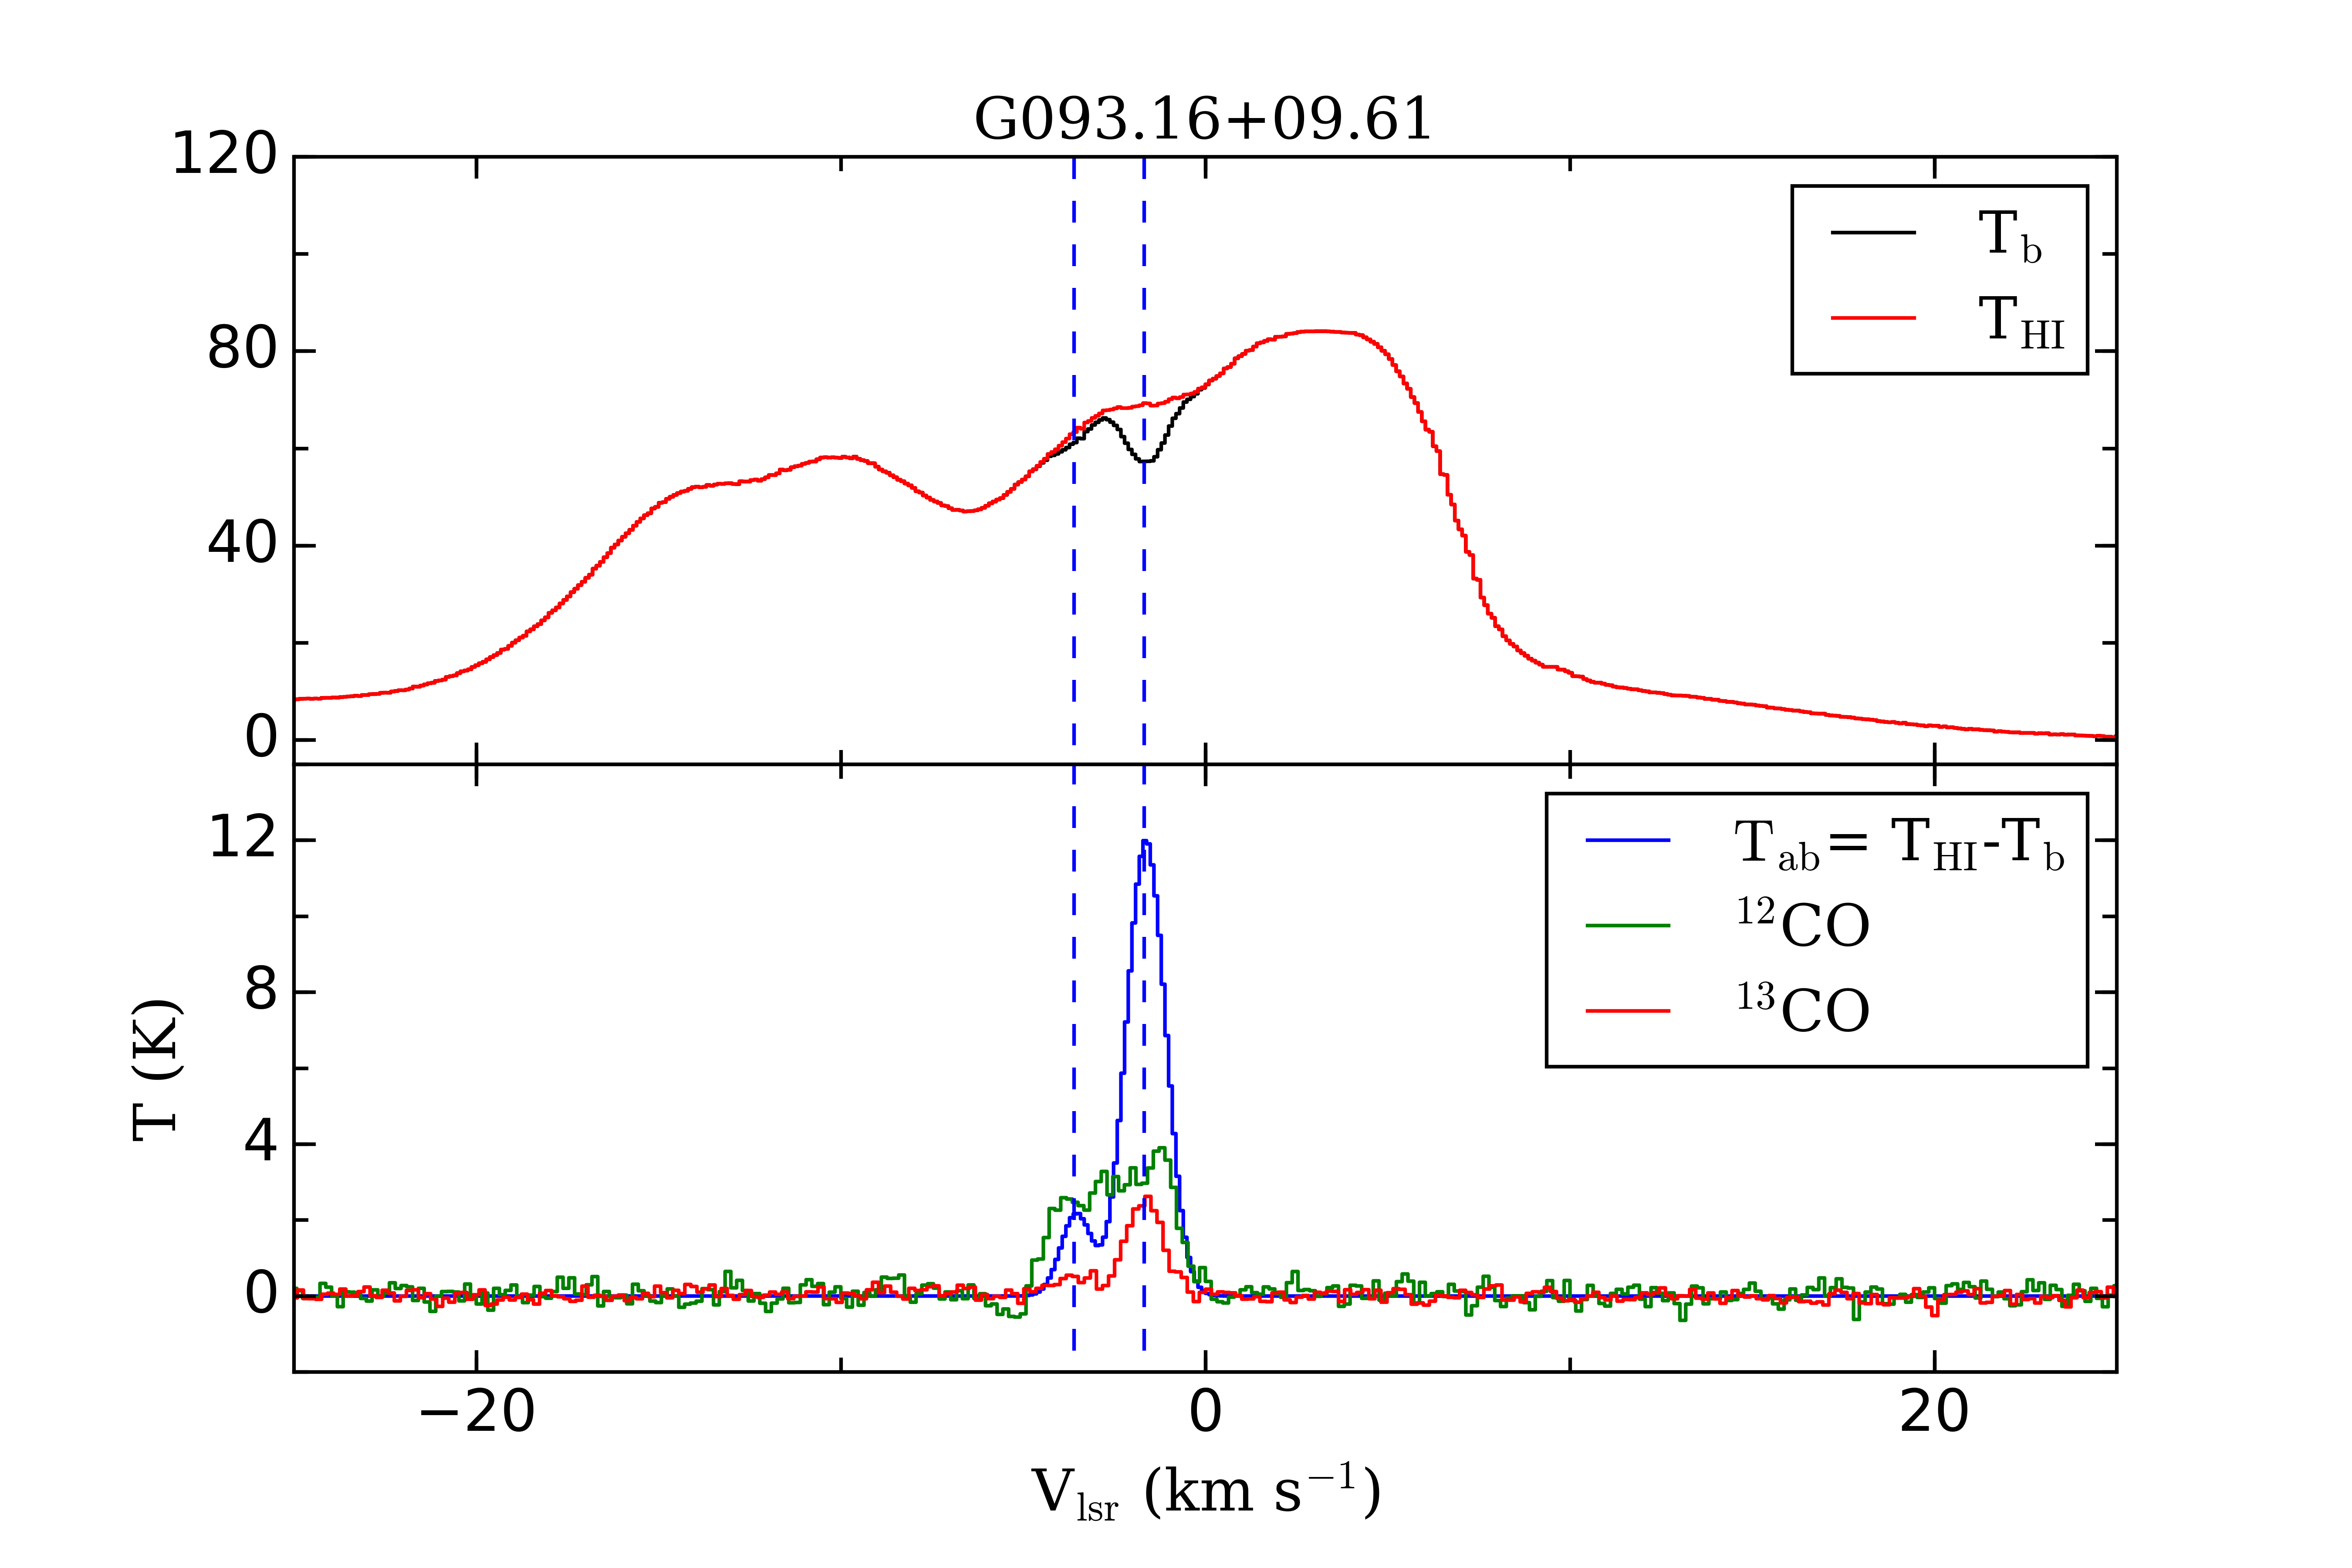
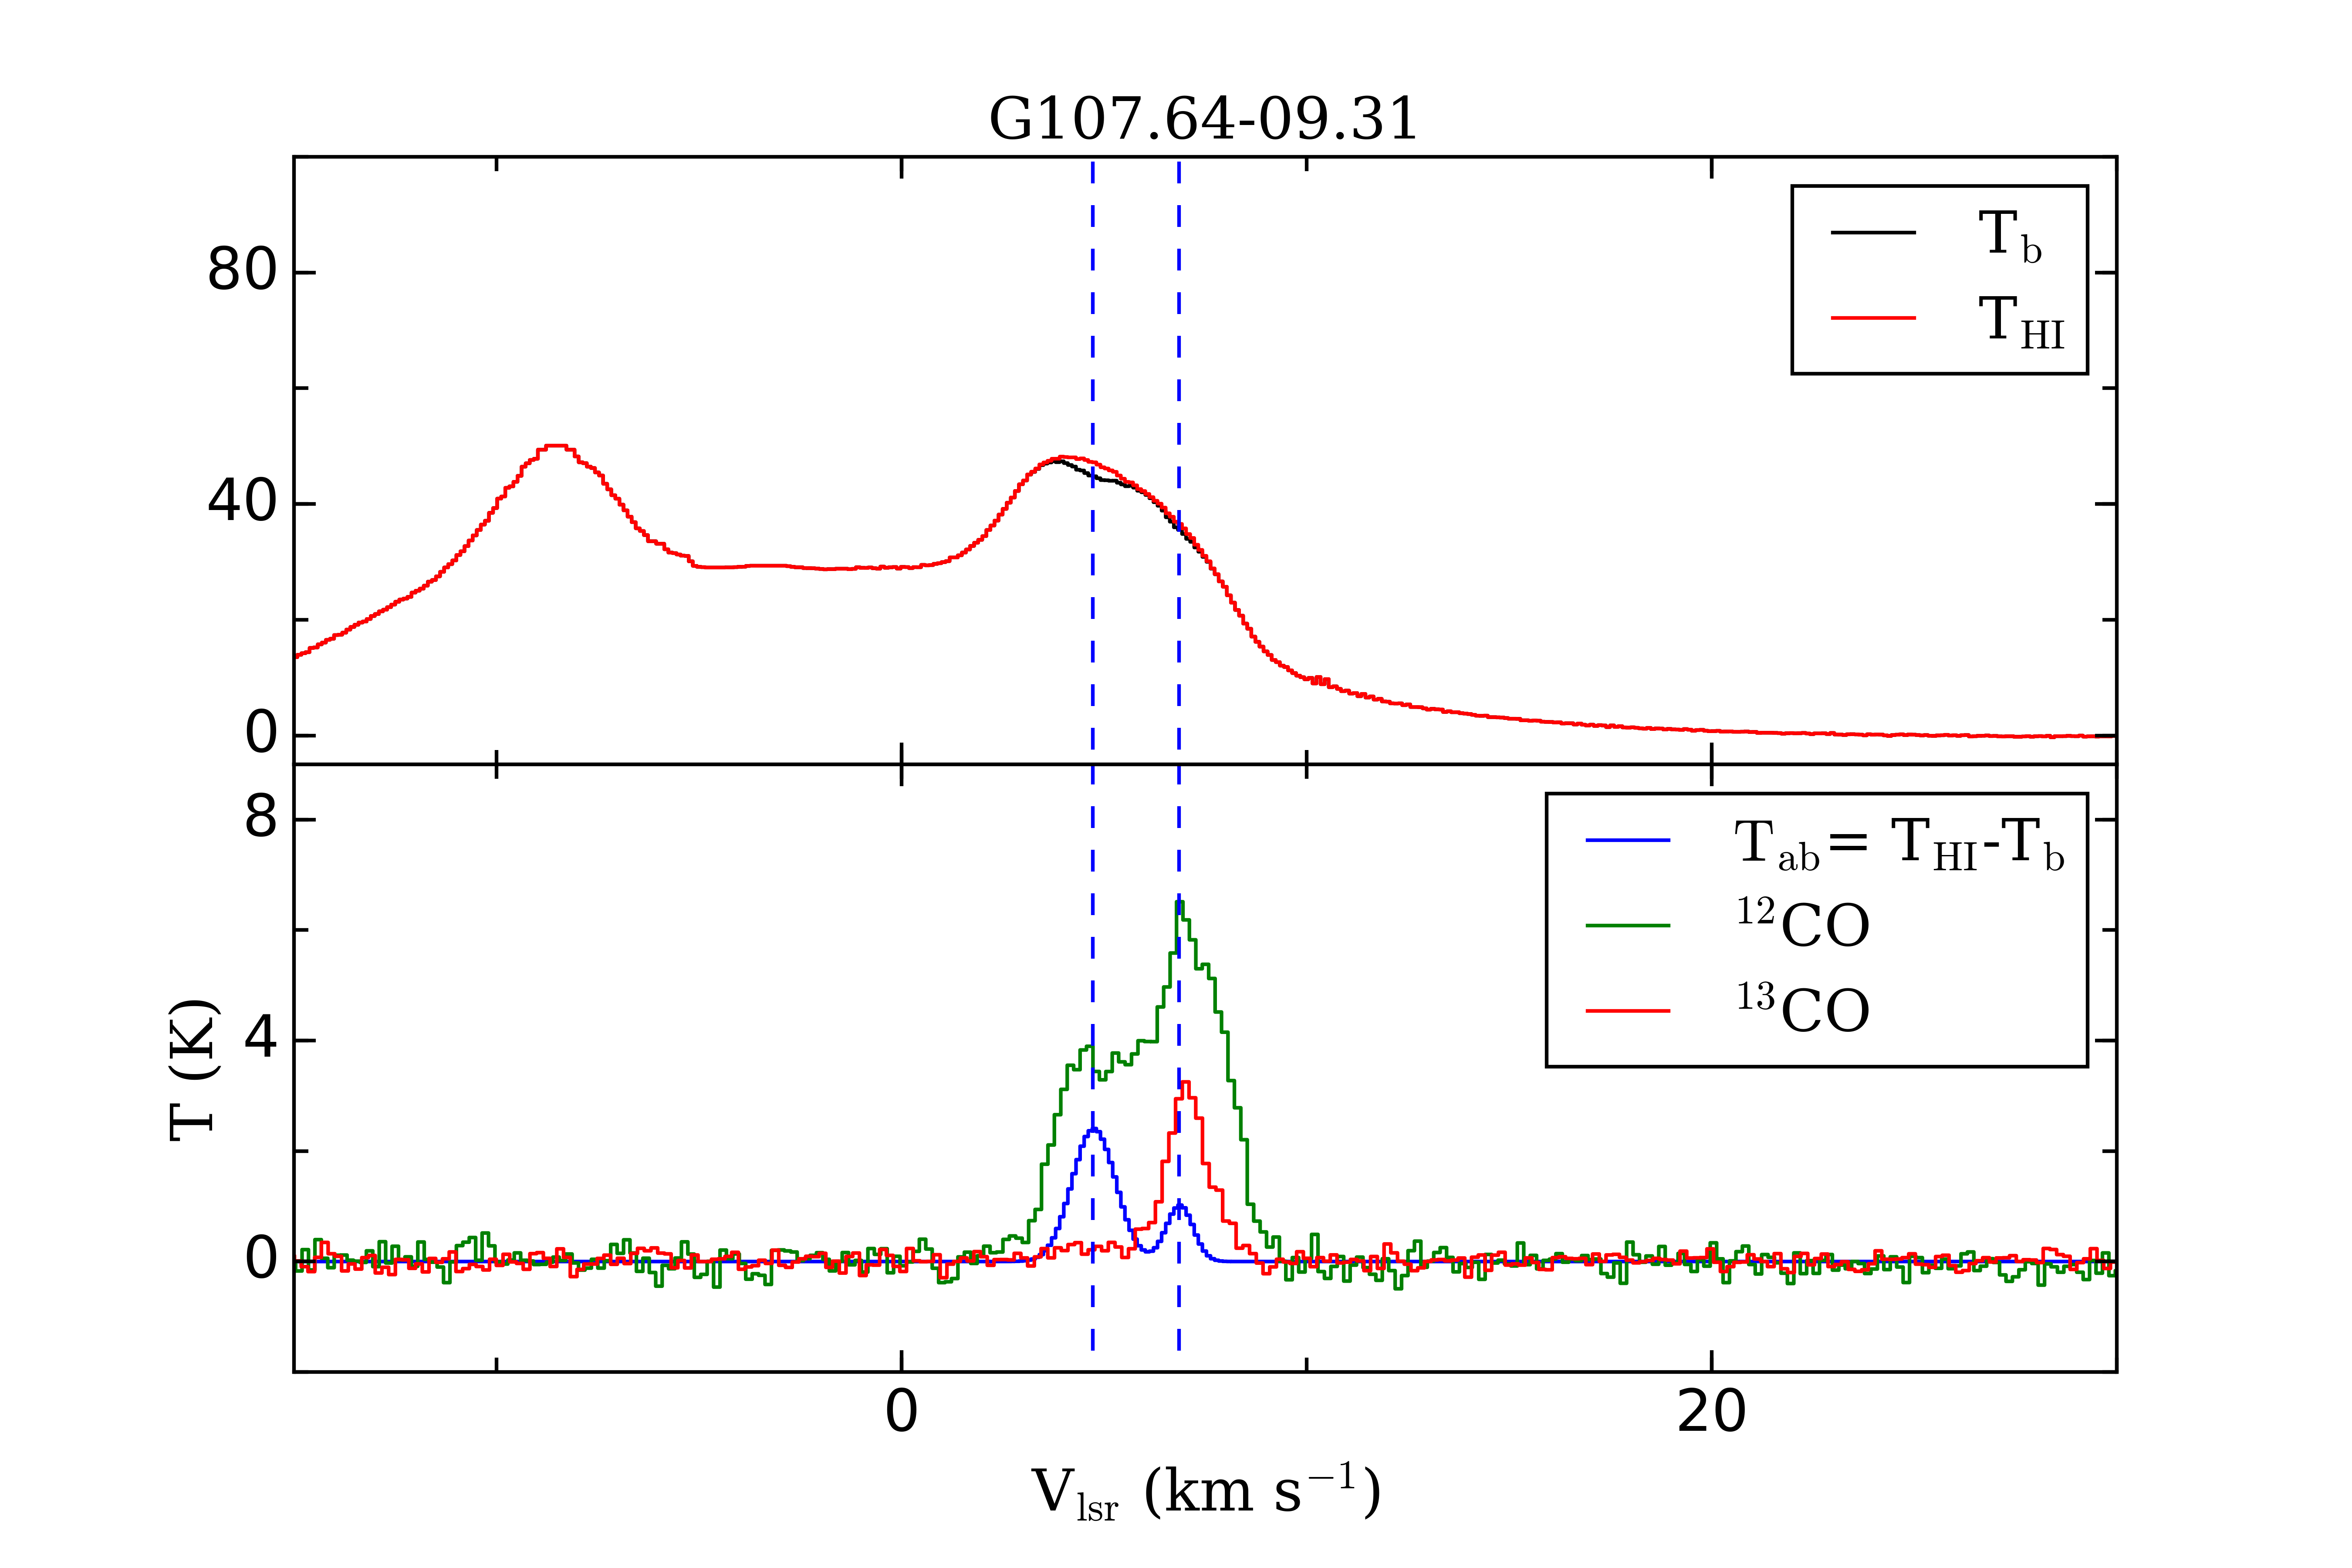
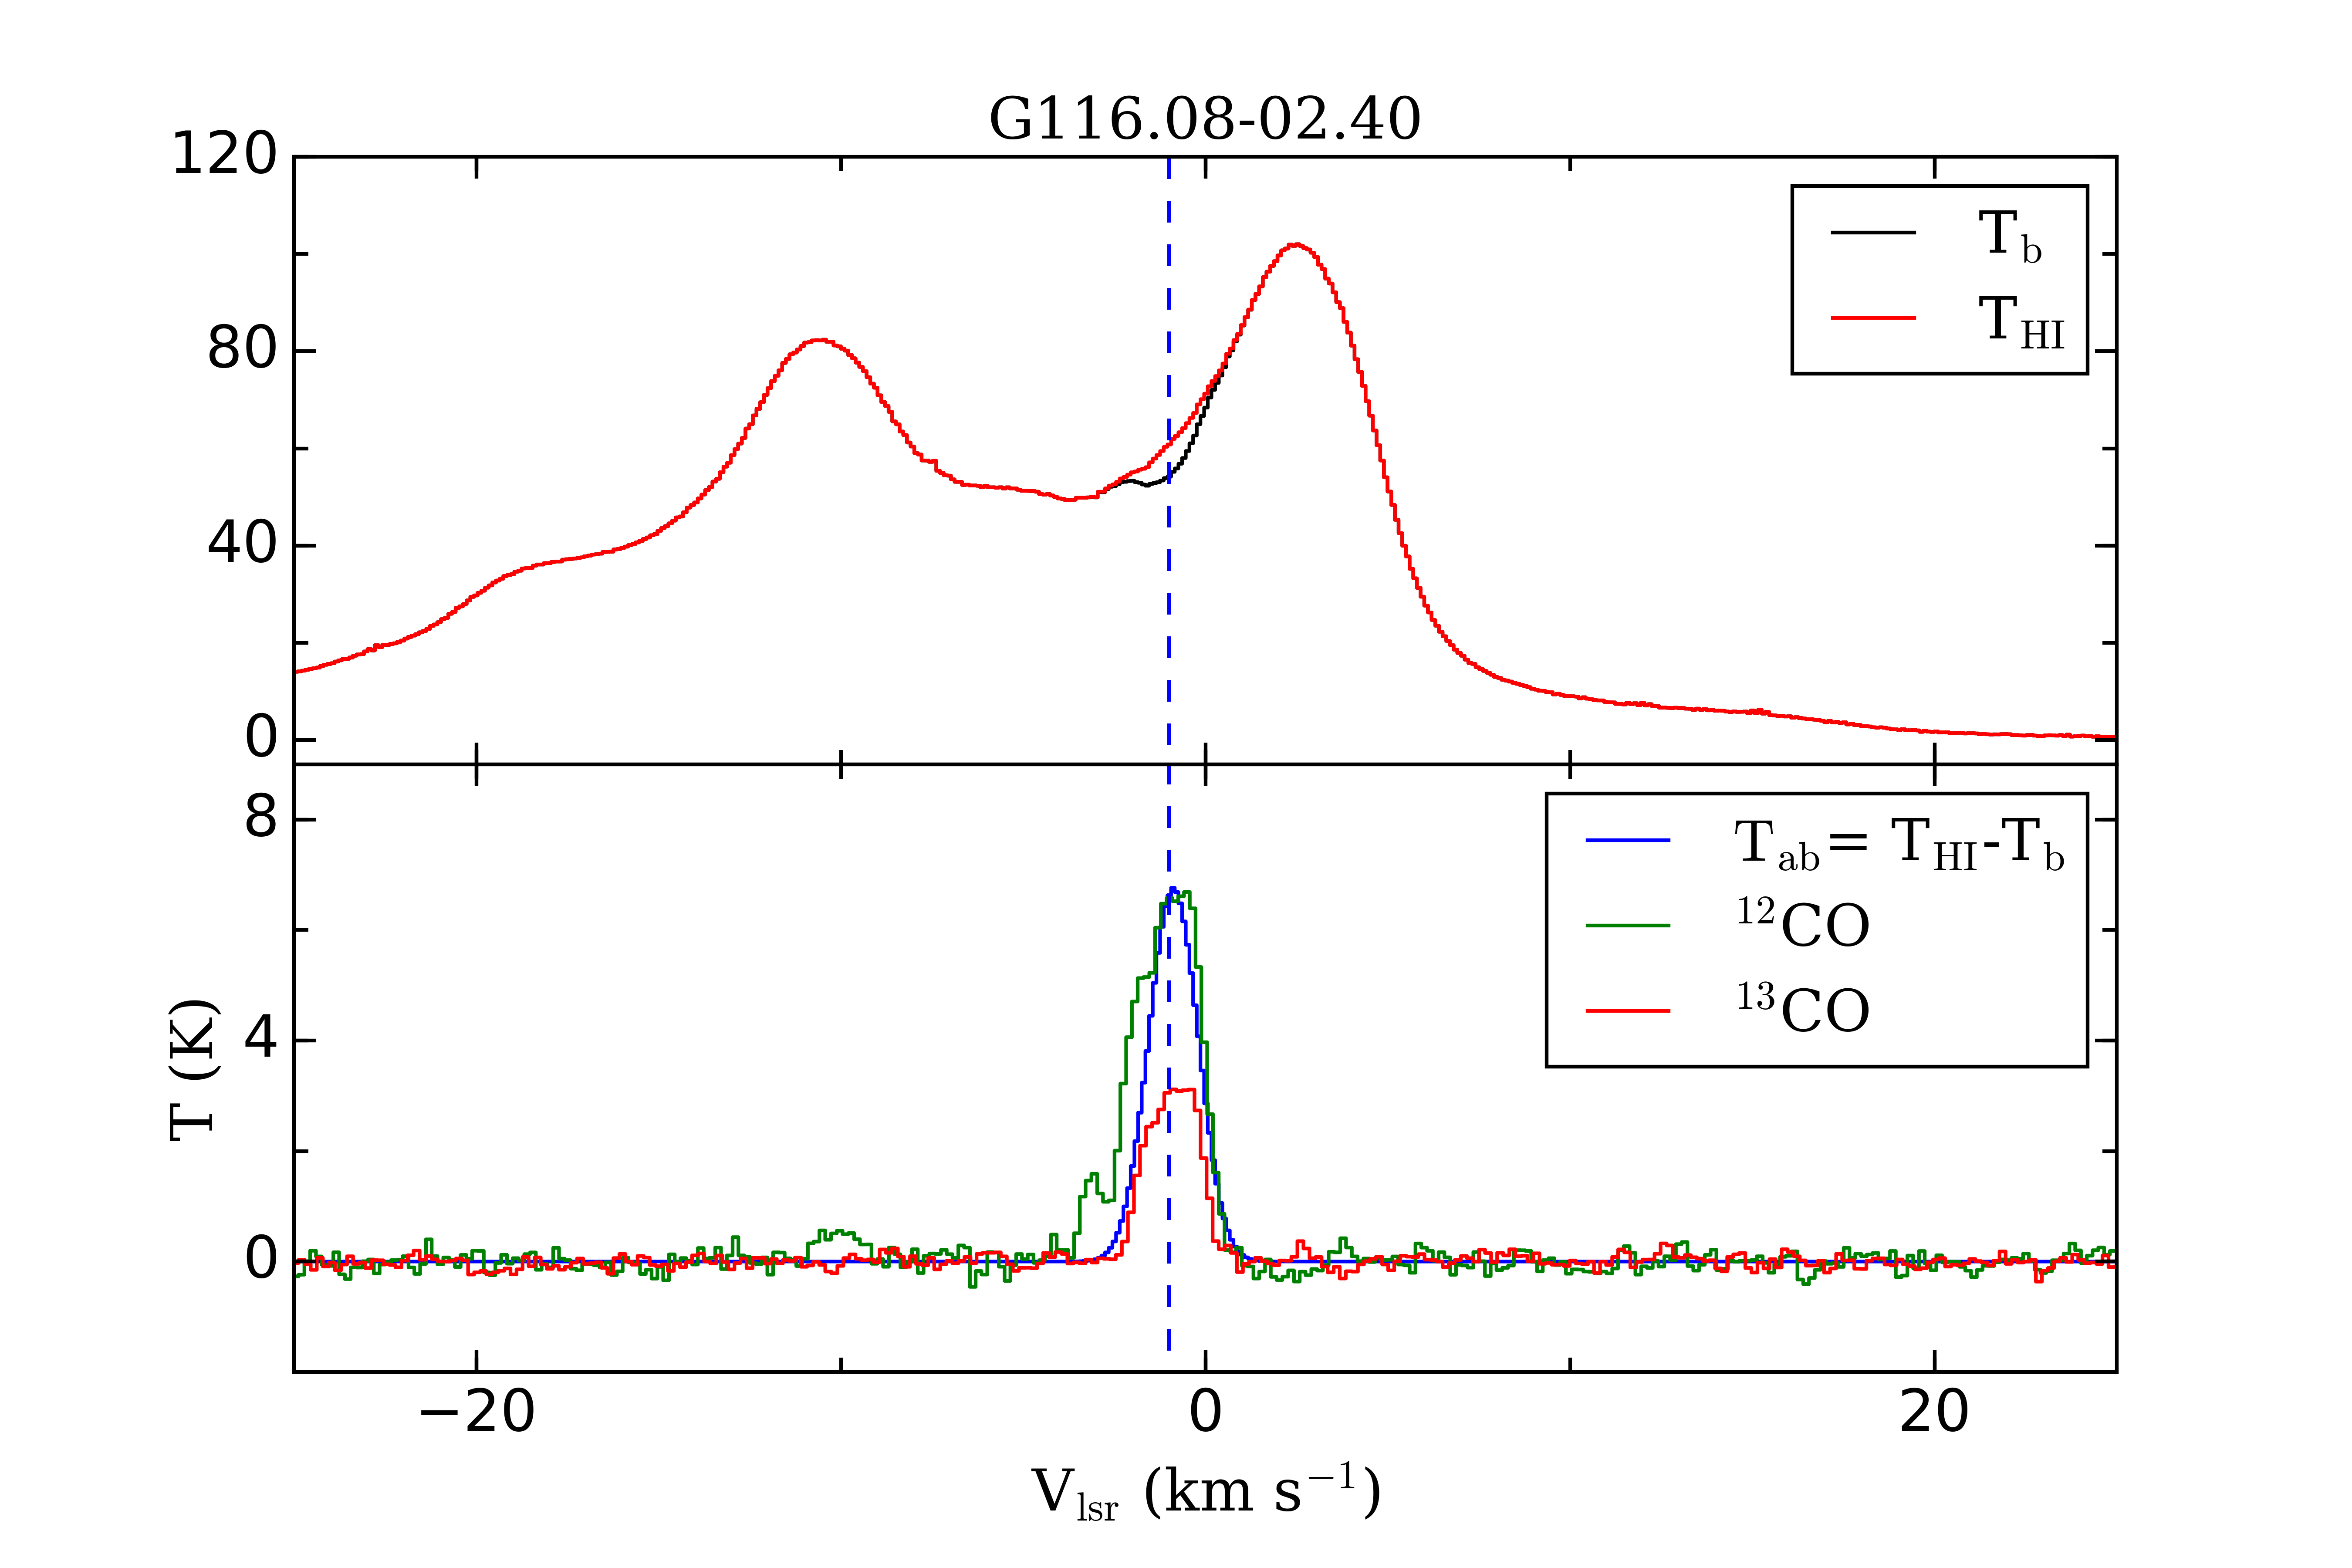
The spectra of sources with HINSA detection and without HINSA detection are shown in Appendix A and Appendix B, respectively. There are many reasons that may be responsible for non-HINSA detection. For example, the excitation temperature of the HI gas inside a molecular cloud is comparable to that of background continuum temperature. As shown in Fig. 1, there is no obvious spatial difference between HINSA and non-HINSA detection. The sample of 17 PGGCs are small. More samples are needed to further investigate this point.
4.1. HINSA Column Density and Abundance
N(HINSA) of PGCCs has an average of 6.3 1018 cm-2. As a comparision, average value of N(HINSA) in LG03 and KG10 are 7.2 and 6.3 1018 cm-2. These results are consistent though we focus on different category of molecular cloud.
HINSA abundance, N(HINSA)/NH represents abundance of cold Hi in a cloud. The average HINSA abundance in PGCCs is , which is about 3 times the value derived in both LG03 and KG10. We notice that is derived from Planck data with 5’ FWHM, which is larger than that of Hi (2.9’) and CO (1’) data we used. This would lead to overestimation of N(HINSA)/NH. As an estimation, the peak column density of PGCC would be 1.38 times the value of (Planck Collaboration et al. 2016). Considering this uncertainty, the lower limit of averaged N(HINSA)/NH would be .
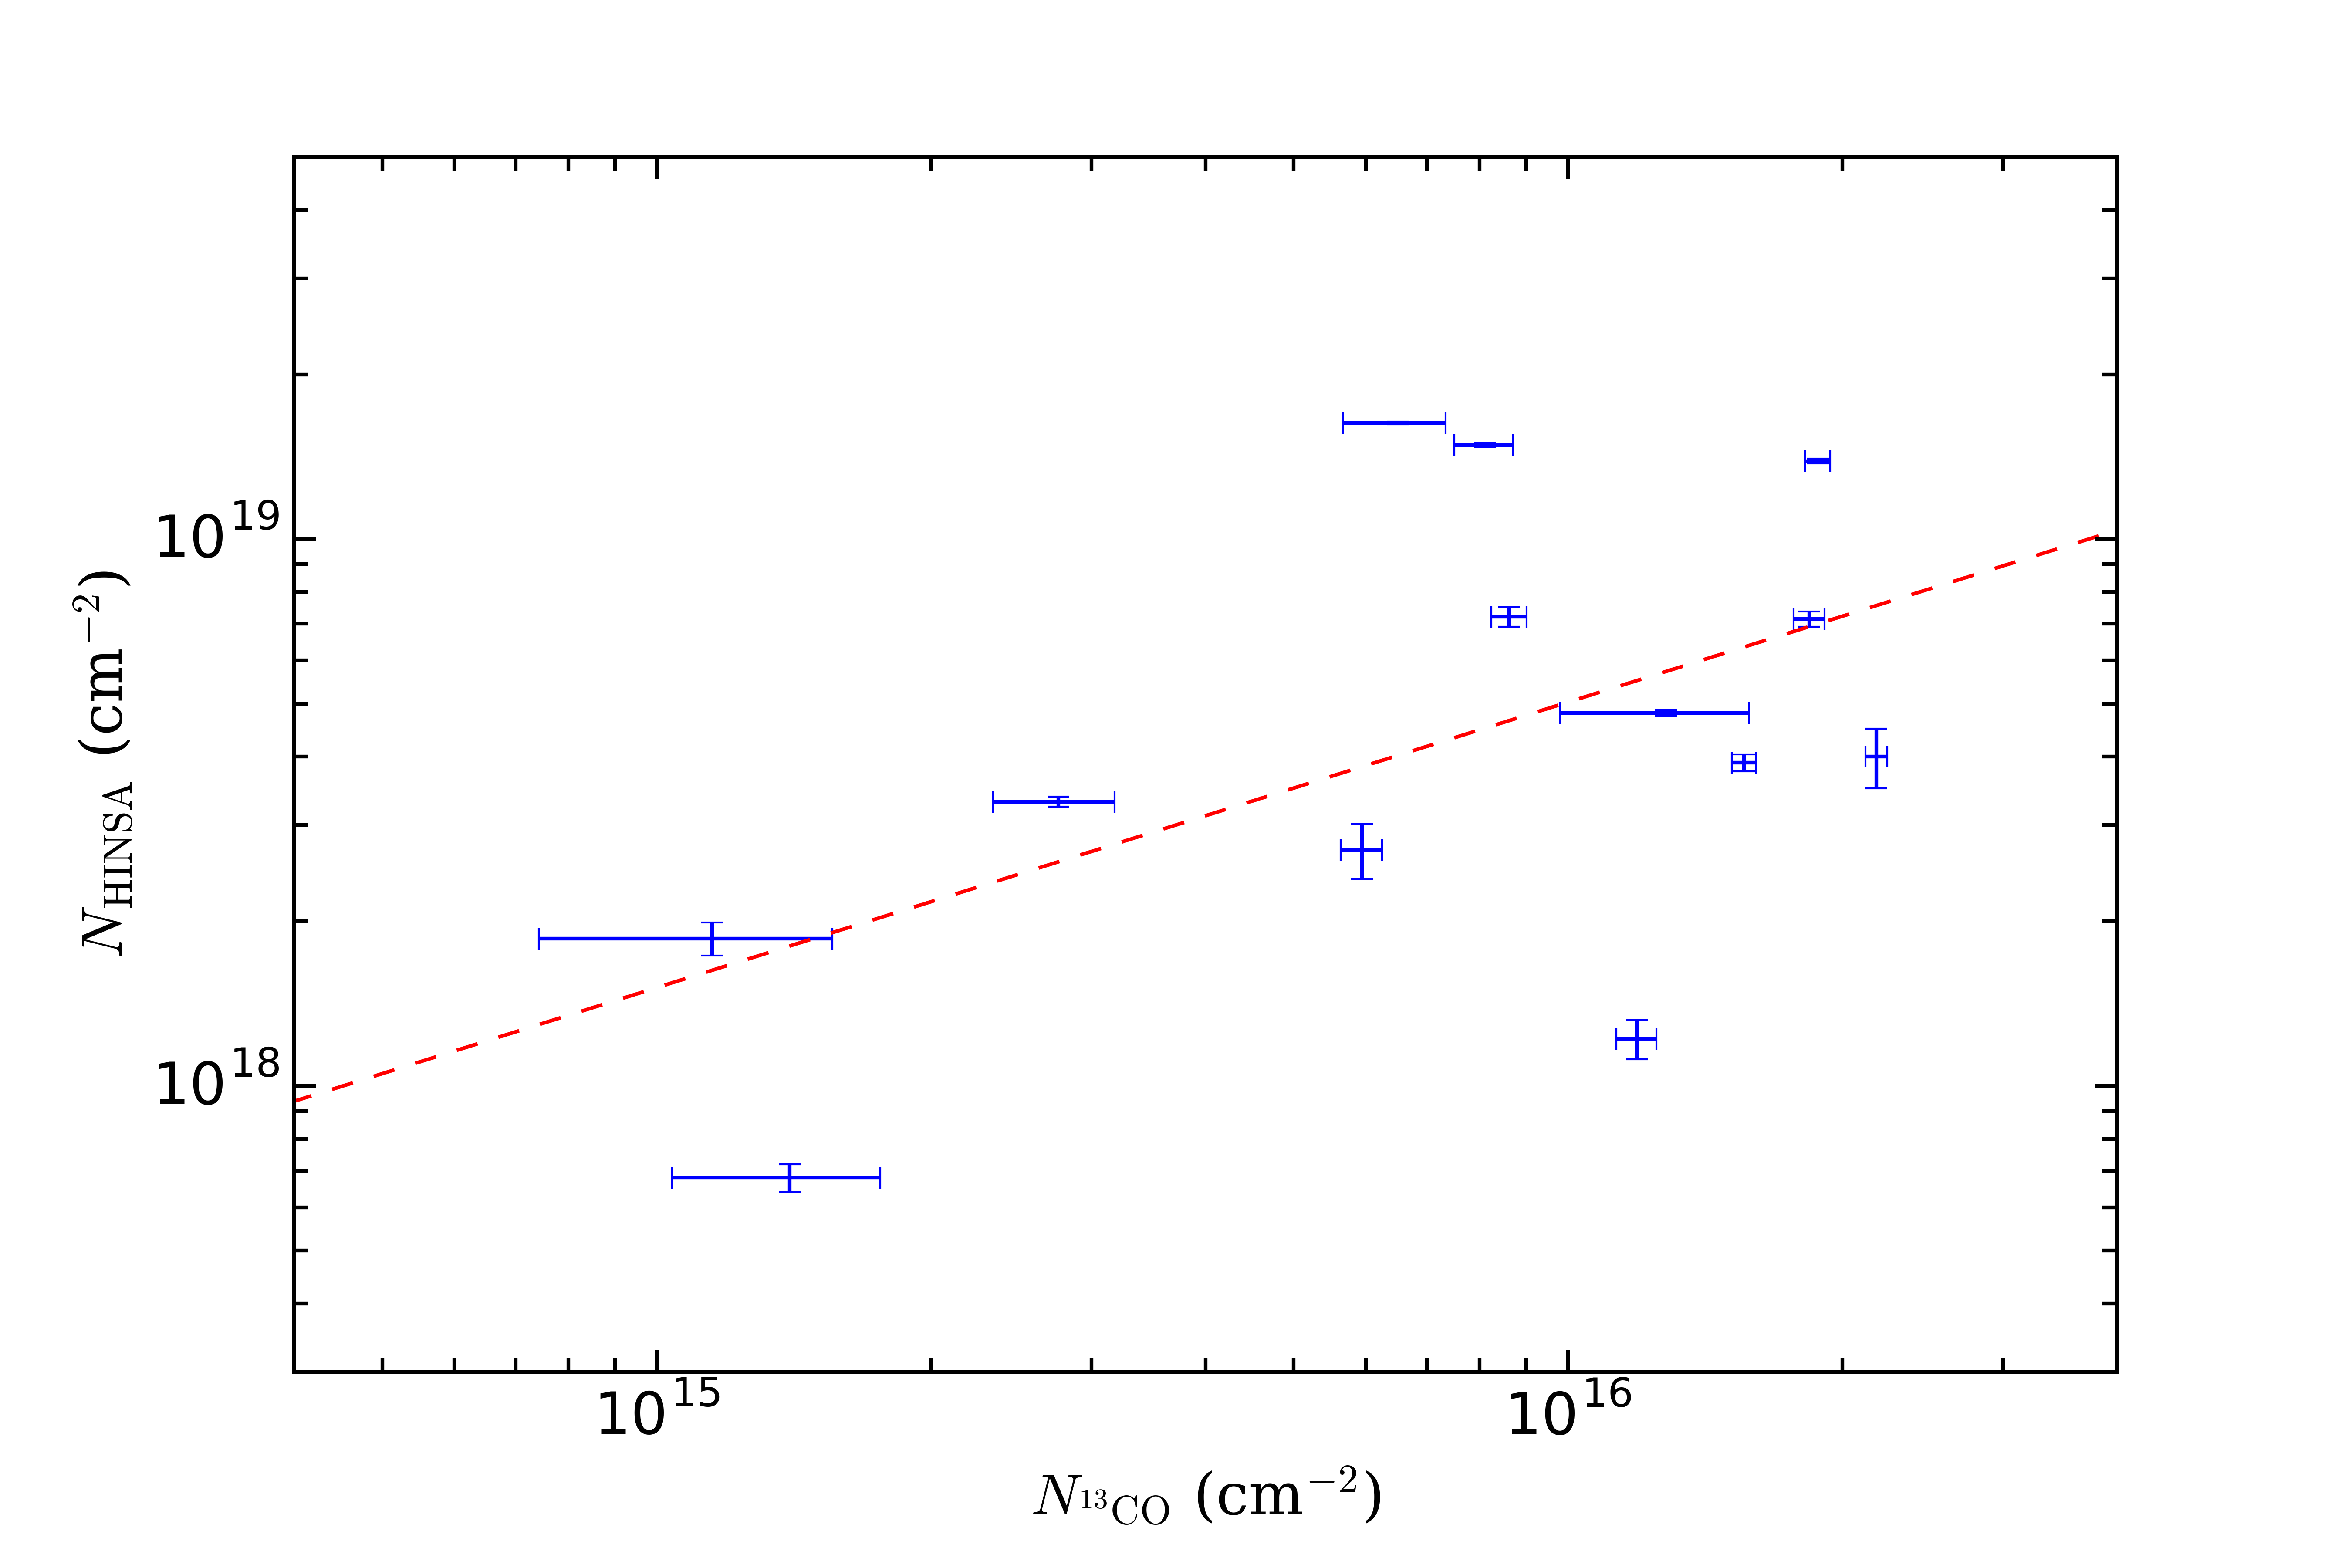
The correlation between log() and log() is investigated in Fig. 6. An extra uncertainty of 20% is considered due to flux calibration of 13CO. As described in section 3.2, the uncertainty of fitting complex spectrum is difficult to estimate quantitatively and is not included in the error bar of N(HINSA) of Fig. 6. The correlation can be expressed with
| (8) |
in which a= 0.520.26 and b=104.1. The Pearson correlation coefficient is 0.52, indicating an intermediate correlation between HINSA and 13CO.
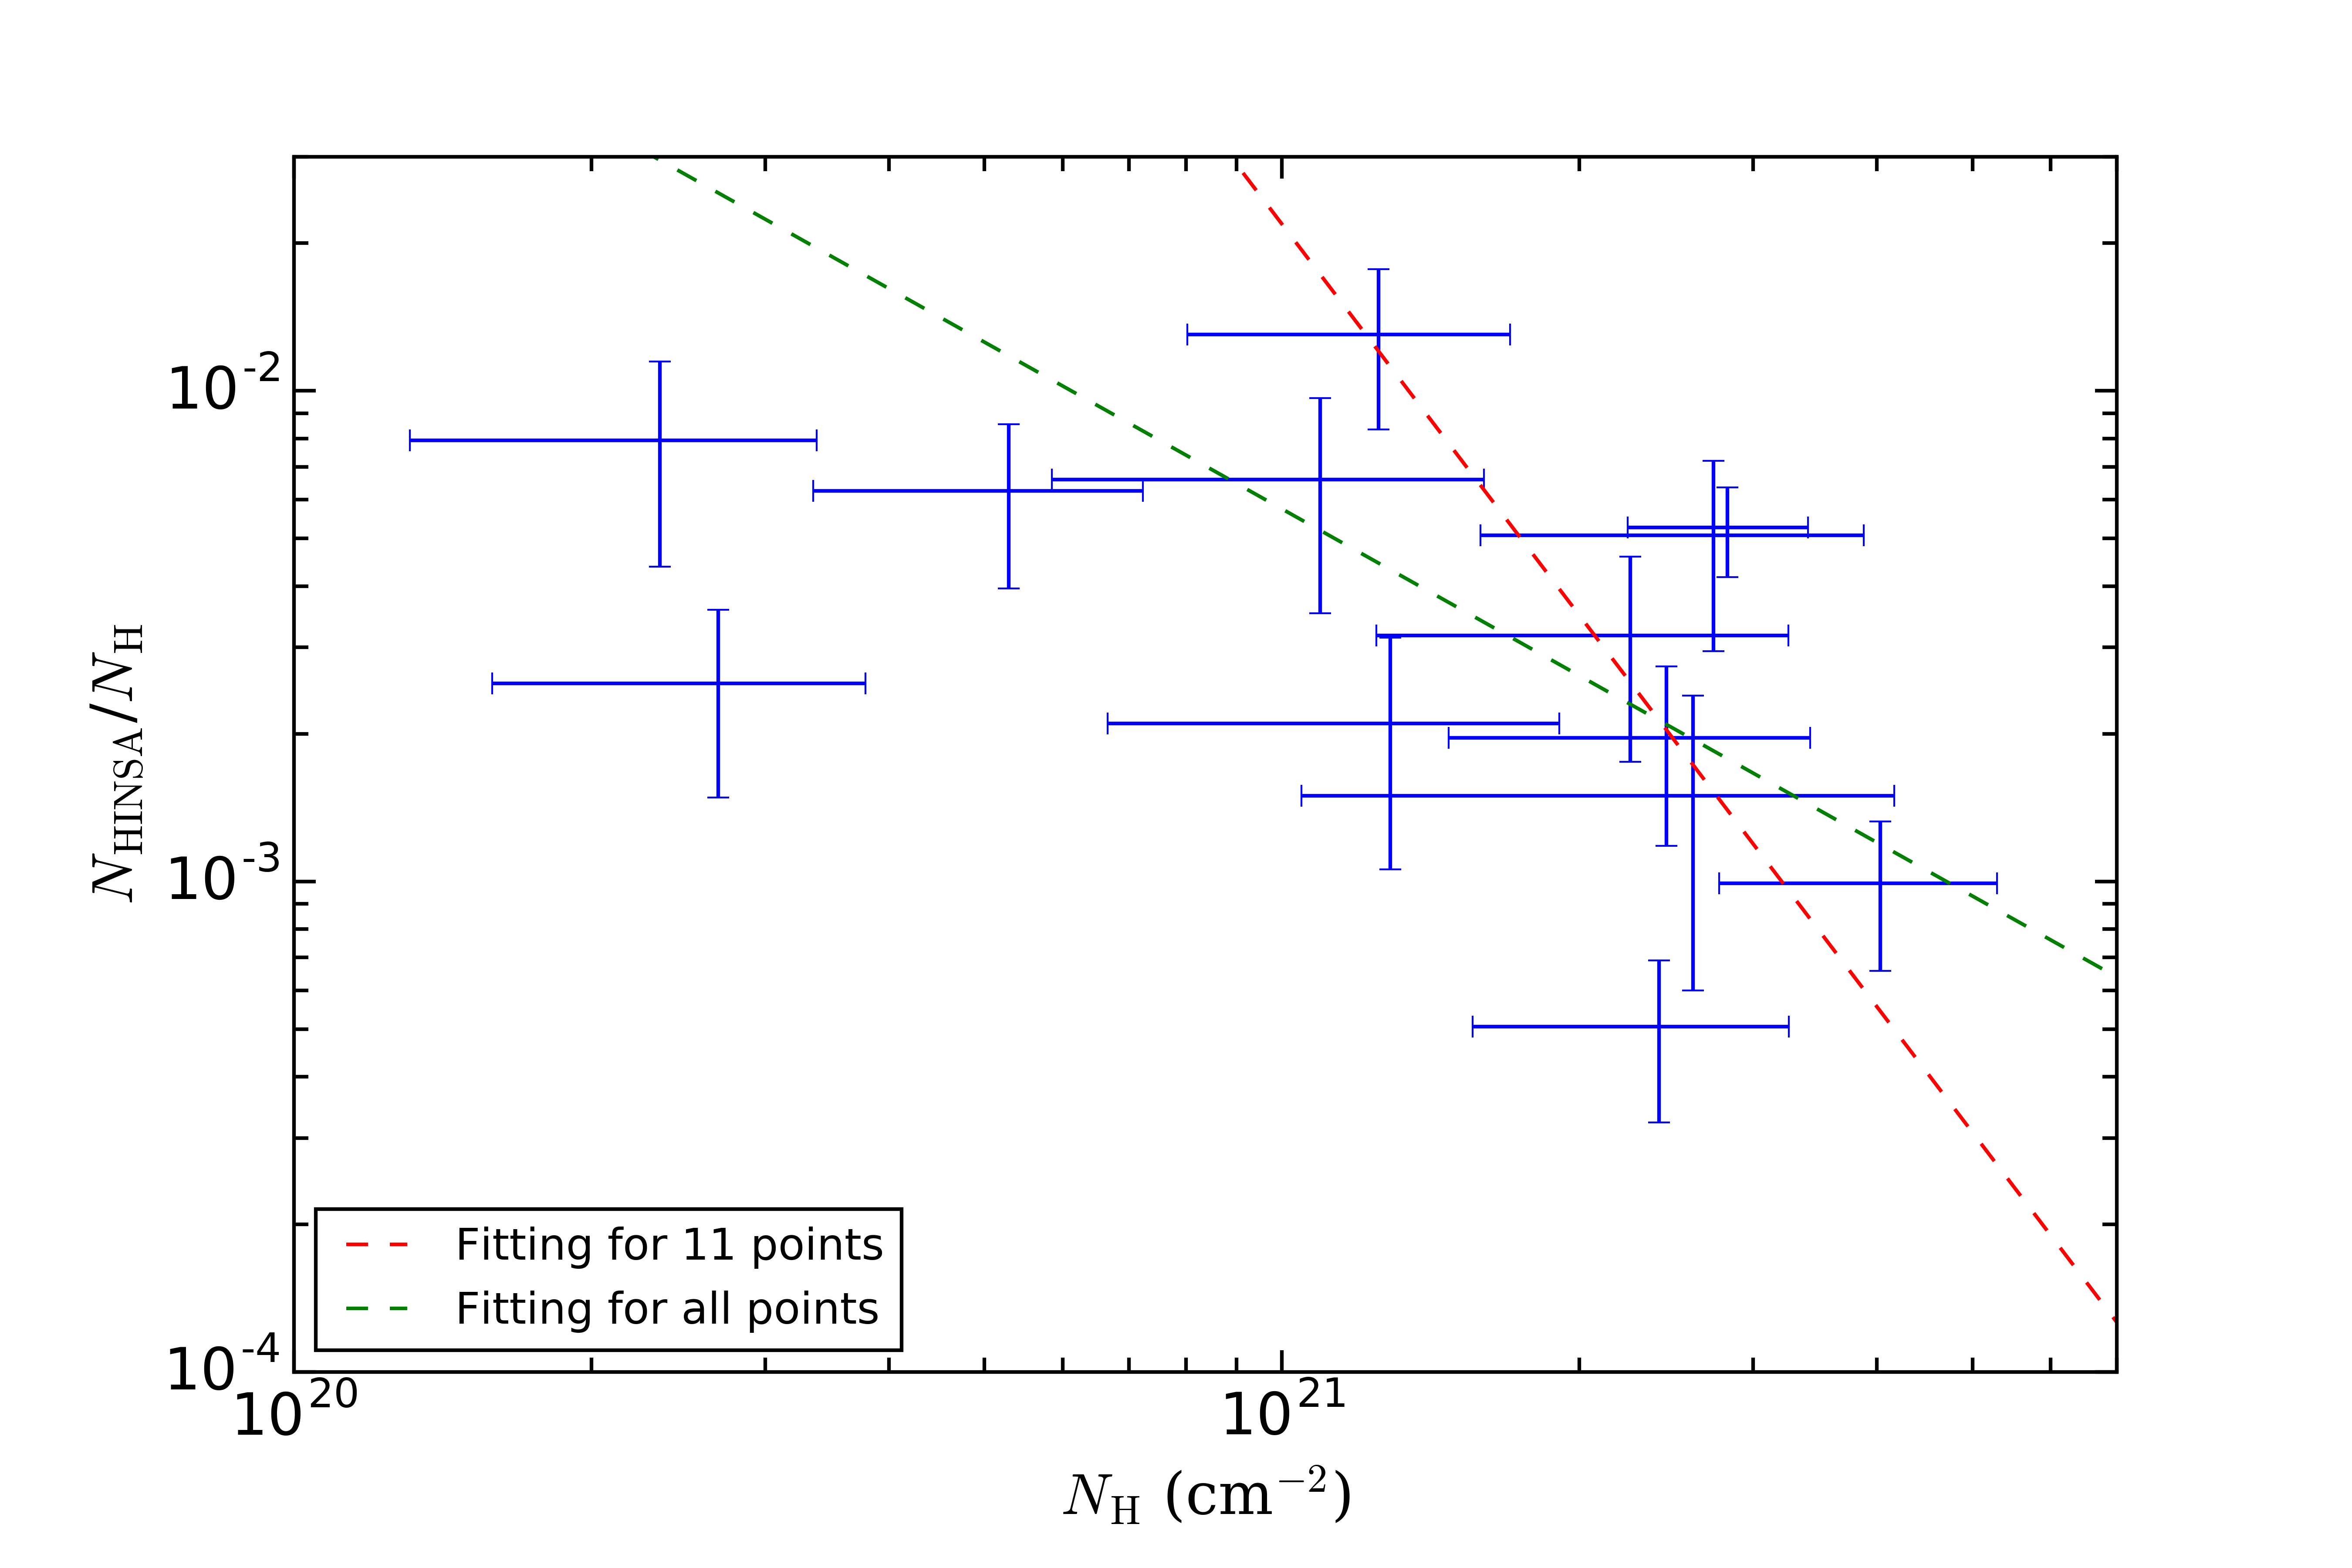
The uncertainty of from dust could reach 50% the value itself. It is larger than the uncertainty percent of N(HINSA) and . The uncertainties of HINSA abundance N(HINSA)/NH and total column density NH are significant and must be included during correlation analysis. When uncertainty in both X and Y axes are considered, the correlation between N(HINSA)/NH and NH are fitted with the following equation,
| (9) |
As shown in Fig. 7, there is a trend that HINSA abundance decreases along increasing hydrogen column density. The fitted parameter c = -1.1 0.32 and d=21 6.7 when all data points are included. The slope of -1.1 0.32 could not exclude the possibility that linear decrease of HINSA abundance is just due to division of NH. The two components, -3.73 km s-1 of G093.16+09.61 and 4.54 km s-1 of G107.64-09.31 show significant deviation. The 13CO intensity of these two components are low, which may lead to underestimation of (13CO), and thus underestimation of NH with the calculation method we used in this paper. When these two components are excluded, the fitted parameter c = -2.7 1.0 and d= 54 22. The slope of -2.7 1.0 indicates that the decreasing trend is physically meaningful. HINSA column density will decrease in increasing NH. This result implies that cold Hi would be depleted in denser molecular cloud. Since the two components with low 13CO emission would affect this analysis, more HINSA samples with accurate estimation of NH are needed to check this correlation.
4.2. Kinematic Environment
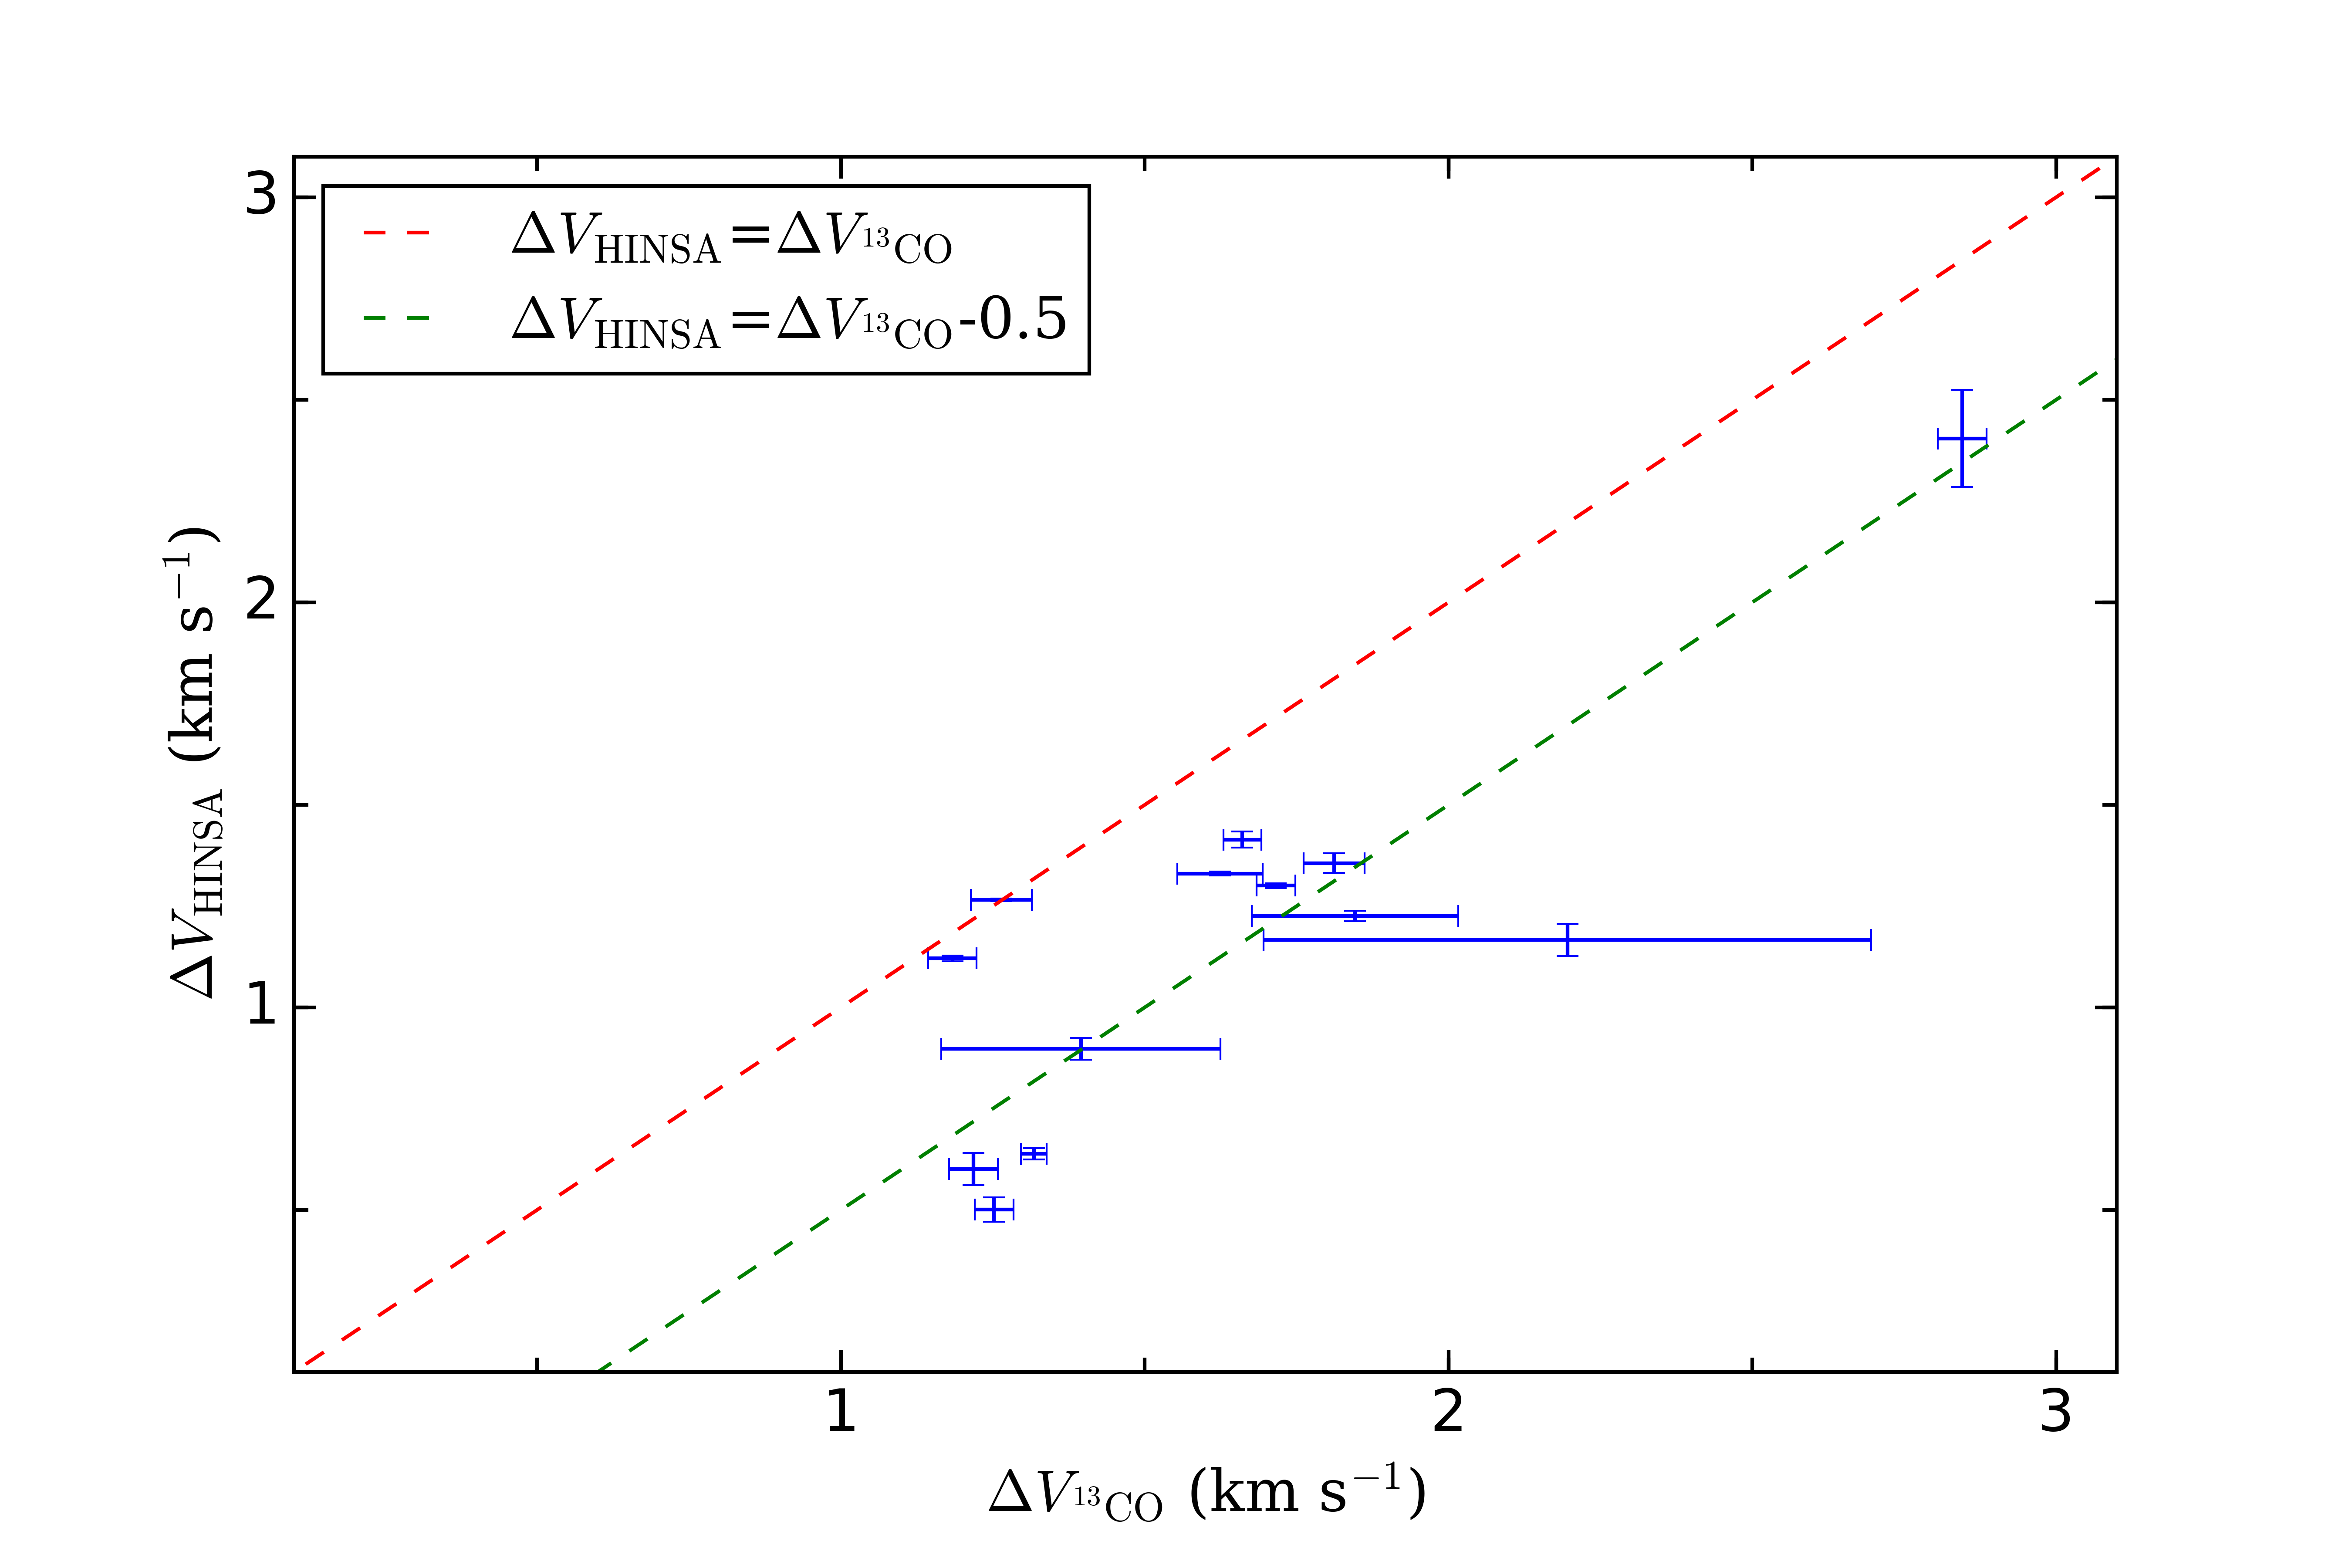
We investigated further about kinematic environment of PGCCs. Thermal and nonthermal effect (e.g., turbulence) are two main factors that lead to line broadening. Since PGCCs are cold ( 5-25 K), the thermal broadening width is small, 0.3 km s-1. Unlike thermal effect, nonthermal effect does not depend on kinetic temperature and particle mass. In order to check the turbulence effect on different species, We compare nonthermal width of HINSA and CO in Fig. 8. We found that nonthermal width of 13CO is about 0-0.5 km s-2 larger than that of HINSA though spatial resolution of CO ( 1 arcmin) is smaller than that of Hi ( 3 arcmin). The smoothing of CO data to same resolution of Hi is expect to result in larger linewidth of 13CO, enlarging disparity between CO and Hi linewidth.
In order to check if this result is due to applying constraints of non-thermal width while fitting HINSA in Section 3.2, a wider limitation was chosen. We adopted 100% deviation from fitting 13CO. Variation of fitted line width under new limitation is less than 0.5% compared to old one. Limitation of line width is used for deriving local extreme solution and does not affect fitting result.
Line broadening caused by turbulence () is found to connect with cloud size () through a relation , . The value of q is 0.38 when first proposed by Larson (1981). Further observations toward giant molecular clouds indicate a value of 0.5 (e.g., Solomon et al. 1987). This relation implies that smaller regions are less turbulent. The broader line width of 13CO than HINSA may indicate that HINSA lie in a smaller, interior region than 13CO.
4.3. Transition between Atomic and Molecular Phase
The existence of cold Hi in clumps is due to balance between H2 formation on dust grain and H2 dissociation by external environment, e.g., illumination from cosmic ray. HINSA abundance can be an effective indicator of cloud evolution (Goldsmith & Li 2005). In order to compare with analytic model, we have to identify volume density of total hydrogen. For PGCCs with both distance estimation (including kinematic distance derived rotation curve) and cloud size in angular resolution , the cloud size is estimated with . For other PGCCs, we adopt the fitting formula derived in Heyer & Brunt (2004), km s-1 to calculate the size of PGCCs. Average density is calculated with .
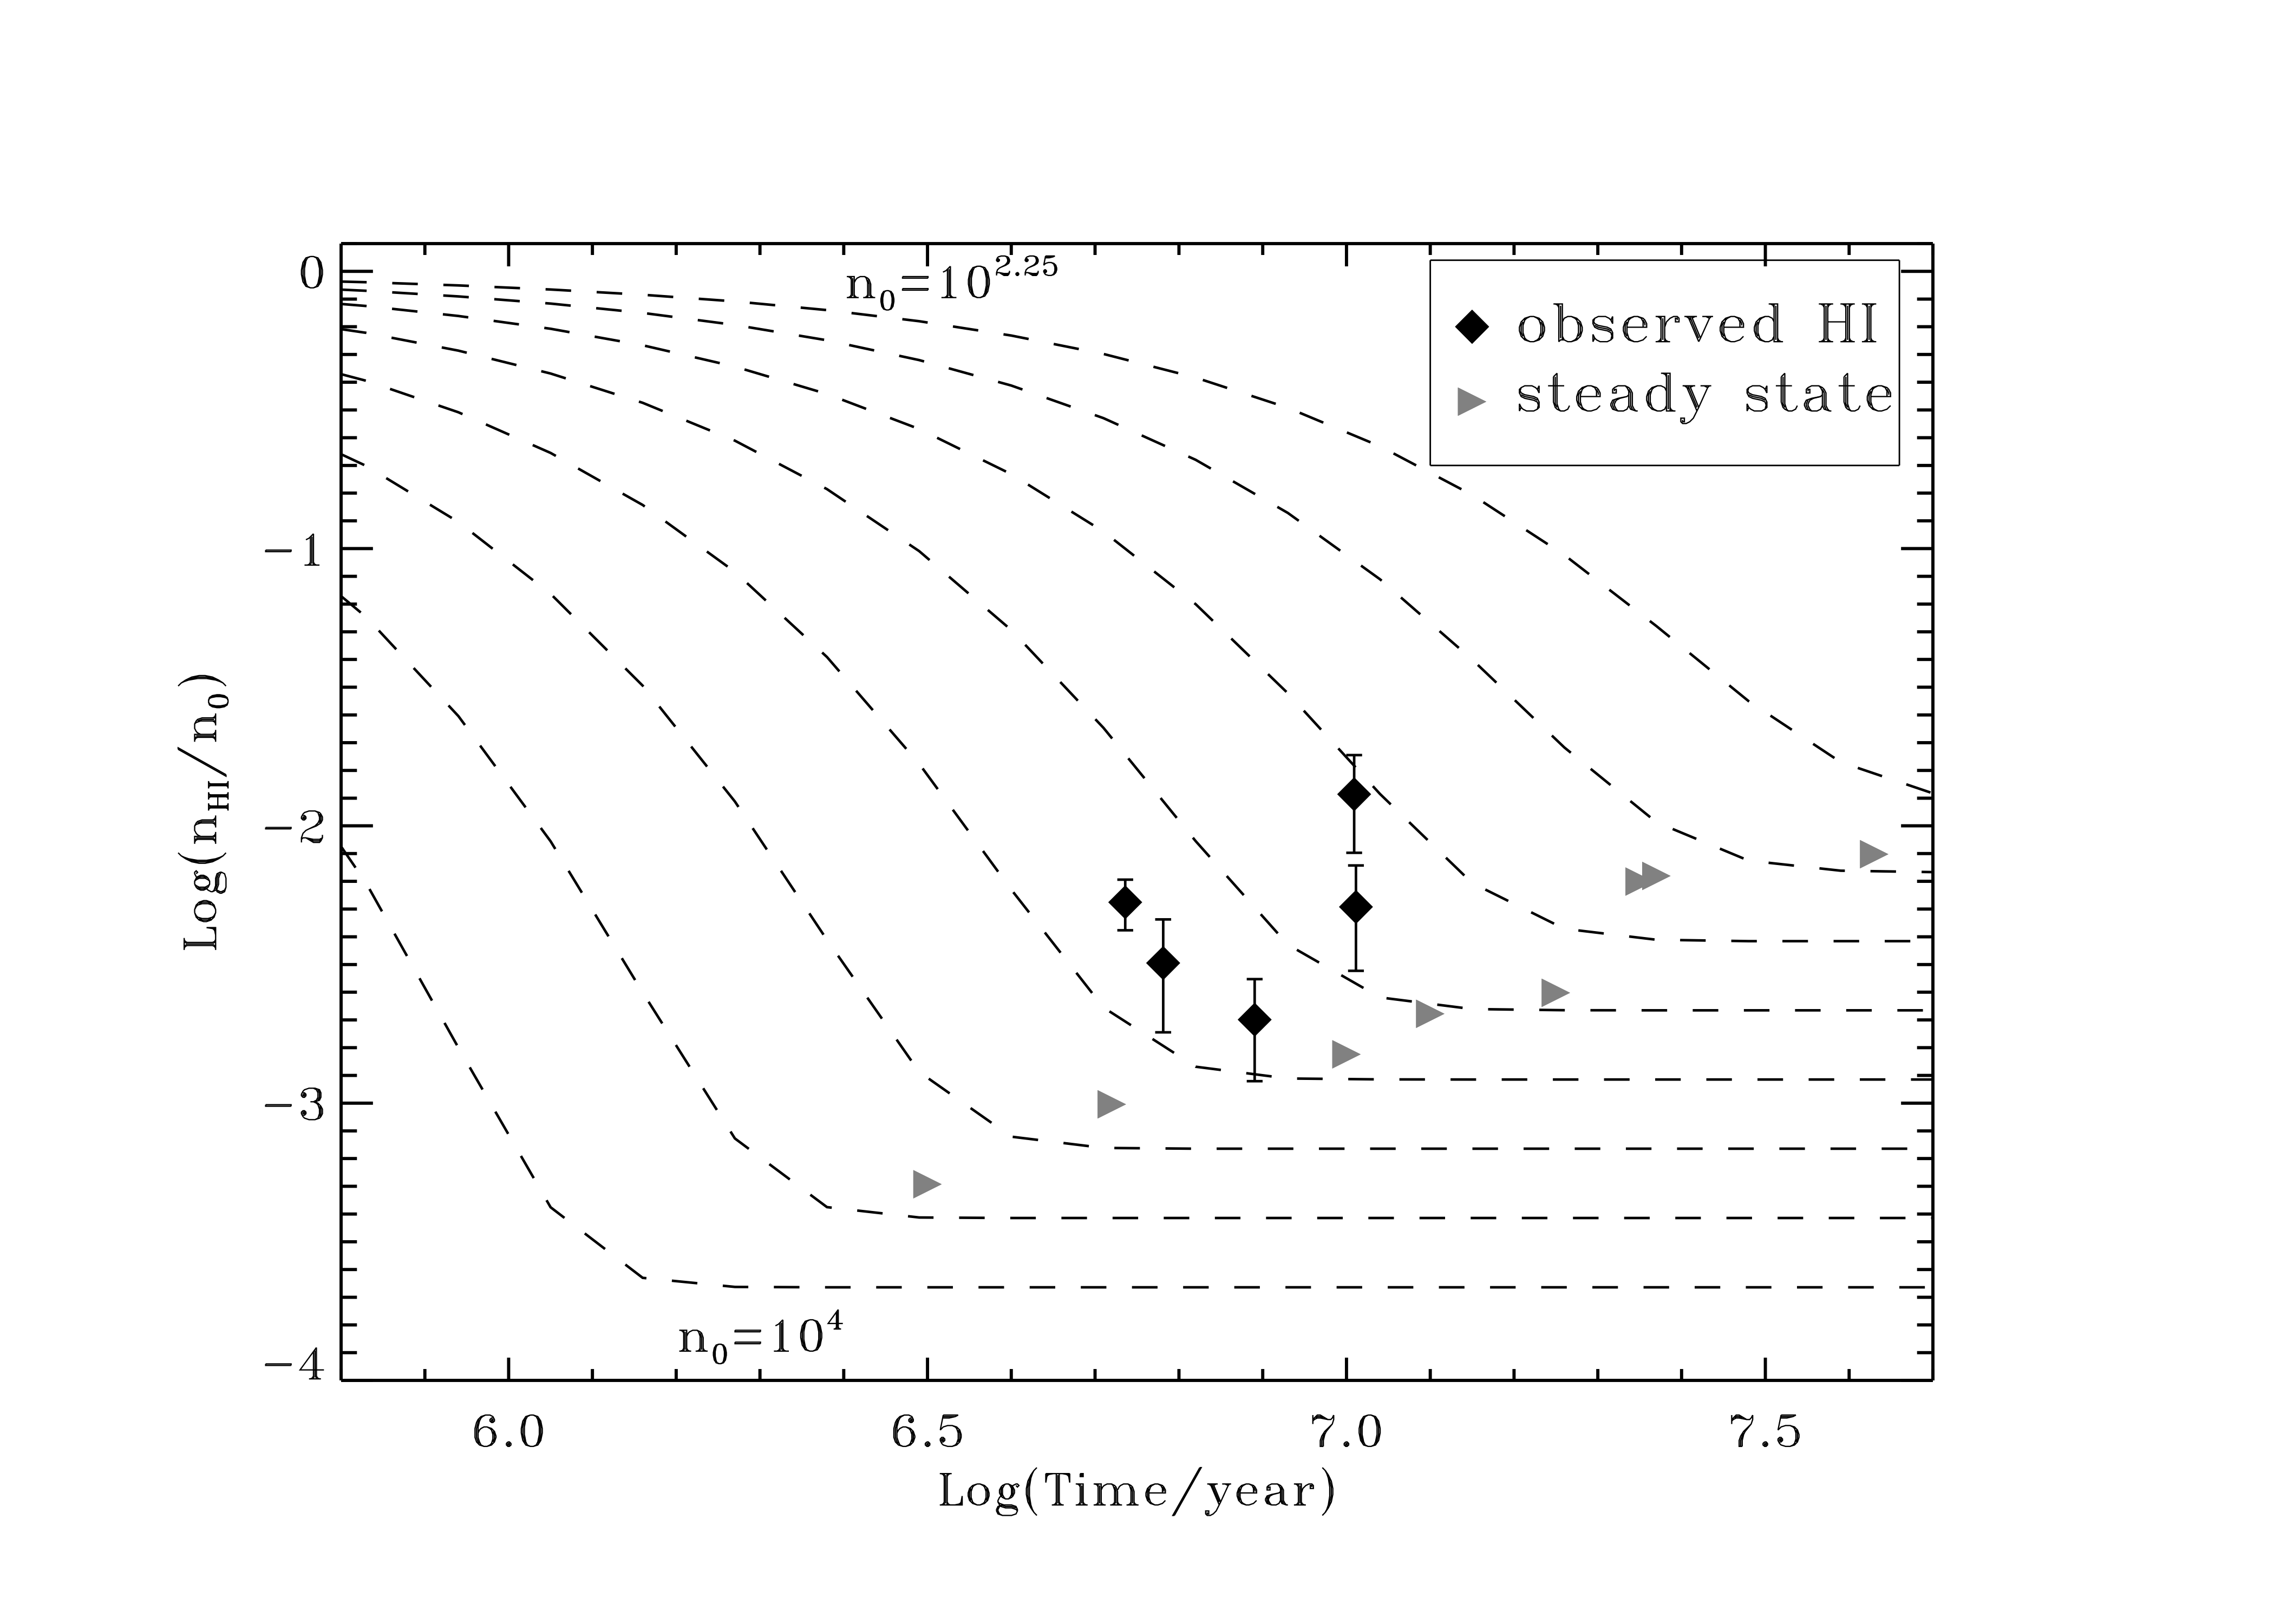
We follow the analytic model in Goldsmith & Li (2005). In a cloud with Hi density of and H2 density of , its Hi density fraction as a function of time is given by
| (10) |
in which is the formation rate coefficient of H2. is the ionization rate of H2 by cosmic-ray. The value of s-1 has been adopted (van der Tak, & van Dishoeck 2000). Time constant between atomic and molecular phase . By adopting and , cloud age could be calculated from Equation 10.
Solution can be derived for only 5 of 13 PGCC components. Fig. 9 shows the evolution age as a function of abundance of Hi and total proton density. Cloud age of these 5 clouds lies in the range yr yr. Besides, they locate in a transition phase between unstable and steady state.
Cloud has density profile distribution with cloud radius, e.g., power law density profile (Shu 1977), which results in a denser central region. The beam size of Hi ( 2.9 arcmin) and CO ( 1 arcmin) observations allows us to only cover the central dense region of a PGCC clump. The estimation of cloud density by simply dividing cloud size with column density would underestimate cloud density, leading to overestimate cloud age. As discussed in section 4.2, we adopt peak proton density, which is 1.38 times the current value to estimate a lower limit of cloud age. Lower limits of cloud age for 5 PGCC components is in the range yr yr. These value are about 23% smaller than that shown in Fig. 9.
We are not able to find available solution for the rest 8 components due to relatively low Hi abundance under its density. A possible reason is that cloud size was overestimated, resulting underestimation of total hydrogen density.
5. Summary
In this paper, we have observed Hi spectra toward 17 PGCCs with FAST. Thirteen HINSA components are found toward 10 sources. The abundance of cold Hi in these clouds varies from to with an average value of .
We found that HINSA column density in PGCCs has a intermediate correlation with 13CO column density at logarithmic scale. This correlation follows a relationship of .
When all date points are included, we could not exclude the possibility that decreasing HINSA abundance (N(HINSA)/NH) is due to division of NH. If we only consider HINSA components with > cm-2, decreasing HINSA abundance as a function of is physically meaningful. This confirms depletion of cold Hi for forming molecular gas in more massive PGCCs.
The nonthermal linewidths of 11 of 13 HINSA components are narrower than that of 13CO. This result may implicate that HINSA located in inner and smaller region than that of 13CO.
We compare our results with analytic model of cloud evolution. Five of 13 HINSA components satisfy cloud evolution at age range of 106.7- 107.0 yr.
Due to a limited sample of this pilot survey with FAST, there still exist some uncertainties in the above results. A larger survey of HINSA features are necessary for improving these results.
References
- Brand, & Blitz (1993) Brand, J., & Blitz, L. 1993, A&A, 275, 67
- Dickey et al. (2003) Dickey, J. M., McClure-Griffiths, N. M., Gaensler, B. M., & Green, A. J. 2003, ApJ, 585, 801
- Gibson et al. (2000) Gibson, S. J., Taylor, A. R., Higgs, L. A., & Dewdney, P. E. 2000, ApJ, 540, 851
- Goldsmith & Li (2005) Goldsmith, P. F., & Li, D. 2005, ApJ, 622, 938
- Haslam et al. (1982) Haslam, C. G. T., Salter, C. J., Stoffel, H., et al. 1982, A&AS, 47, 1
- Heyer & Brunt (2004) Heyer, M. H., & Brunt, C. M. 2004, ApJ, 615, L45
- Jiang et al. (2019) Jiang, P., Yue, Y., Gan, H., et al. 2019, Science China Physics, Mechanics, and Astronomy, 62, 959502
- Kalberla et al. (2005) Kalberla, P. M. W., Burton, W. B., Hartmann, D., et al. 2005, A&A, 440, 775
- Kavars et al. (2003) Kavars, D. W., Dickey, J. M., McClure-Griffiths, N. M., Gaensler, B. M., & Green, A. J. 2003, ApJ, 598, 1048
- Kavars et al. (2005) Kavars, D. W., Dickey, J. M., McClure-Griffiths, N. M., et al. 2005, ApJ, 626, 887
- Krčo & Goldsmith (2010) Krčo, M., & Goldsmith, P. F. 2010, ApJ, 724, 1402
- Krčo et al. (2008) Krčo, M., Goldsmith, P. F., Brown, R. L., & Li, D. 2008, ApJ, 689, 276
- Larson (1981) Larson, R. B. 1981, MNRAS, 194, 809
- Li (2002) Li, D. 2002, Ph.D. Thesis
- Li & Goldsmith (2003) Li, D., & Goldsmith, P. F. 2003, ApJ, 585, 823
- Liu et al. (2018) Liu, T., Kim, K.-T., Juvela, M., et al. 2018, ApJS, 234, 28
- Liu et al. (2012) Liu, T., Wu, Y., & Zhang, H. 2012, ApJS, 202, 4
- Liu et al. (2016) Liu, T., Zhang, Q., Kim, K.-T., et al. 2016, ApJS, 222, 7
- Liu et al. (2019) Liu, X.-C., Wu, Y., Zhang, C., et al. 2019, A&A, 622, A32
- Lucas & Liszt (1998) Lucas, R., & Liszt, H. 1998, A&A, 337, 246
- Nakanishi, & Sofue (2003) Nakanishi, H., & Sofue, Y. 2003, PASJ, 55, 191
- Nan et al. (2011) Nan, R., Li, D., Jin, C., et al. 2011, International Journal of Modern Physics D, 20, 989
- Pan et al. (2017) Pan, Z., Li, D., Chang, Q., et al. 2017, ApJ, 836, 194
- Peek et al. (2018) Peek, J. E. G., Babler, B. L., Zheng, Y., et al. 2018, ApJS, 234, 2
- Peek et al. (2011) Peek, J. E. G., Heiles, C., Douglas, K. A., et al. 2011, ApJS, 194, 20
- Planck Collaboration et al. (2016) Planck Collaboration, Ade, P. A. R., Aghanim, N., et al. 2016, A&A, 594, A28
- Qian et al. (2012) Qian, L., Li, D., & Goldsmith, P. F. 2012, ApJ, 760, 147
- Shu (1977) Shu, F. H. 1977, ApJ, 214, 488
- Solomon et al. (1987) Solomon, P. M., Rivolo, A. R., Barrett, J., & Yahil, A. 1987, ApJ, 319, 730
- Solomon & Werner (1971) Solomon, P. M., & Werner, M. W. 1971, ApJ, 165, 41
- Tang et al. (2016) Tang, N., Li, D., Heiles, C., et al. 2016, A&A, 593, A42
- van der Tak, & van Dishoeck (2000) van der Tak, F. F. S., & van Dishoeck, E. F. 2000, A&A, 358, L79
- Wu et al. (2012) Wu, Y., Liu, T., Meng, F., et al. 2012, ApJ, 756, 76
- Yuan et al. (2016) Yuan, J., Wu, Y., Liu, T., et al. 2016, ApJ, 820, 37
- Zuo et al. (2018) Zuo, P., Li, D., Peek, J. E. G., et al. 2018, ApJ, 867, 13
| Source | RA(J2000) | Dec(J2000) | Comp | 12CO | 13CO | HINSA | N(H) | ||||||
|---|---|---|---|---|---|---|---|---|---|---|---|---|---|
| Vcen | Vcen | ||||||||||||
| (K) | (km s-1) | (km s-1) | (cm-2) | (km s-1) | (km s-1) | (cm-2) | (cm-2) | ||||||
| G089.29+03.99 | 20:50:43.20 | 50:25:38.7 | 1 | 15.950.31 | -4.410.02 | 2.850.04 | 2.180.05 | -4.700.02 | 2.480.12 | 4.00.5 | 20.156.32 | ||
| G089.62+02.16 | 21:00:44.18 | 49:30:29.8 | 1 | 8.470.87 | -1.390.44 | 1.850.17 | 0.280.04 | -1.210.02 | 1.300.01 | 3.310.07 | 2.630.97 | ||
| 2 | 9.080.86 | -0.160.07 | 1.270.05 | 0.650.07 | -0.290.02 | 1.350.003 | 16.310.09 | 6.182.25 | |||||
| G089.64-06.84 | 21:37:58.08 | 43:11:7.8 | 1 | 18.070.27 | 12.860.01 | 1.330.02 | 1.560.04 | 12.770.01 | 0.910.01 | 3.900.14 | 13.017.79 | ||
| G089.75-02.16 | 21:20:11.99 | 46:38:41.3 | 1 | 20.990.39 | 1.860.02 | 1.730.03 | 1.880.05 | 1.790.01 | 1.480.01 | 13.880.14 | 13.615.73 | ||
| G090.76-04.57 | 21:34:00.72 | 45:36:504 | 1 | 17.810.24 | 10.130.02 | 1.820.05 | 0.860.03 | 10.210.01 | 1.500.02 | 7.210.30 | 5.432.54 | ||
| G092.79+09.12 | 20:37:48.71 | 56:19:27.1 | 1 | 11.80.5 | -2.530.03 | 1.630.07 | 0.810.05 | -2.370.01 | 1.430.01 | 14.860.13 | 14.042.93 | ||
| G093.16+09.61 | 20:36:31.44 | 56:54:48.6 | 1 | 8.430.49 | -3.730.10 | 1.400.23 | 0.1400.030 | -3.610.01 | 1.000.03 | 0.680.04 | 1.340.55 | ||
| 2 | 9.190.49 | -1.750.02 | 1.190.04 | 1.280.25 | -1.680.01 | 1.210.01 | 4.810.06 | 12.234.88 | |||||
| G107.64-09.31 | 23:14:26.40 | 50:39:44.6 | 1 | 10.90.4 | 4.540.22 | 2.200.50 | 0.1150.034 | 4.720.02 | 1.270.04 | 1.860.13 | 1.160.51 | ||
| 2 | 16.30.4 | 6.980.02 | 1.260.03 | 1.190.05 | 6.850.02 | 0.790.03 | 1.220.10 | 12.044.25 | |||||
| G116.08-02.40 | 23:56:45.11 | 59:44:20.0 | 1 | 16.520.32 | -0.960.01 | 1.670.03 | 1.840.06 | -1.000.01 | 1.540.02 | 7.140.23 | 11.225.02 | ||
| G122.01-07.47 | 00:45:00.02 | 55:23:18.6 | 1 | 17.170.22 | -52.180.02 | 1.230.04 | 0.590.03 | -52.210.02 | 0.870.04 | 2.70.3 | 6.423.10 | ||
| G089.36-00.69 | 21:12:24.00 | 47:23:32.3 | 1 | 7.430.28 | -24.010.07 | 1.850.17 | 0.1550.020 | - | - | - | 2.97 0.84 | ||
| 2 | 17.770.27 | 2.290.02 | 2.710.03 | 3.190.05 | - | - | - | 61.23 17.26 | |||||
| 3 | 8.890.28 | 4.940.41 | 1.930.56 | 0.0520.020 | - | - | - | 1.00 0.28 | |||||
| G090.76-04.57 | 21:34:00.72 | 45:36:504 | 2 | 7.310.25 | 12.640.06 | 0.470.14 | 0.0280.011 | - | - | - | 0.180.11 | ||
| G093.22-04.60 | 21:44:44.88 | 47:13:3.4 | 1 | 17.160.25 | 3.600.01 | 1.520.02 | 2.040.04 | - | - | - | 32.9 15.8 | ||
| G093.31-11.68 | 22:09:44.88 | 41:42:30.2 | 1 | 15.320.39 | -0.350.02 | 0.830.05 | 0.3050.028 | - | - | - | 5.471.43 | ||
| G093.36-12.07 | 22:11:11.52 | 41:25:35.8 | 1 | 8.520.37 | 0.240.16 | 0.860.37 | 0.0360.020 | - | - | - | 4.09 1.84 | ||
| G101.14-15.29 | 22:54:59.75 | 42:35:51.7 | 1 | 15.450.43 | -9.590.01 | 0.970.03 | 0.980.05 | - | - | - | 18.82 6.39 | ||
| G108.84-00.81 | 22:58:48.72 | 58:56:54.6 | 1 | 22.740.45 | -49.670.02 | 3.270.04 | 4.730.10 | - | - | - | 86.8 64.3 | ||
| G121.93-07.67 | 00:44:28.34 | 55:11:24.4 | 1 | 17.010.21 | -52.070.01 | 1.180.01 | 1.2020.024 | - | - | - | 35.8 13.2 | ||
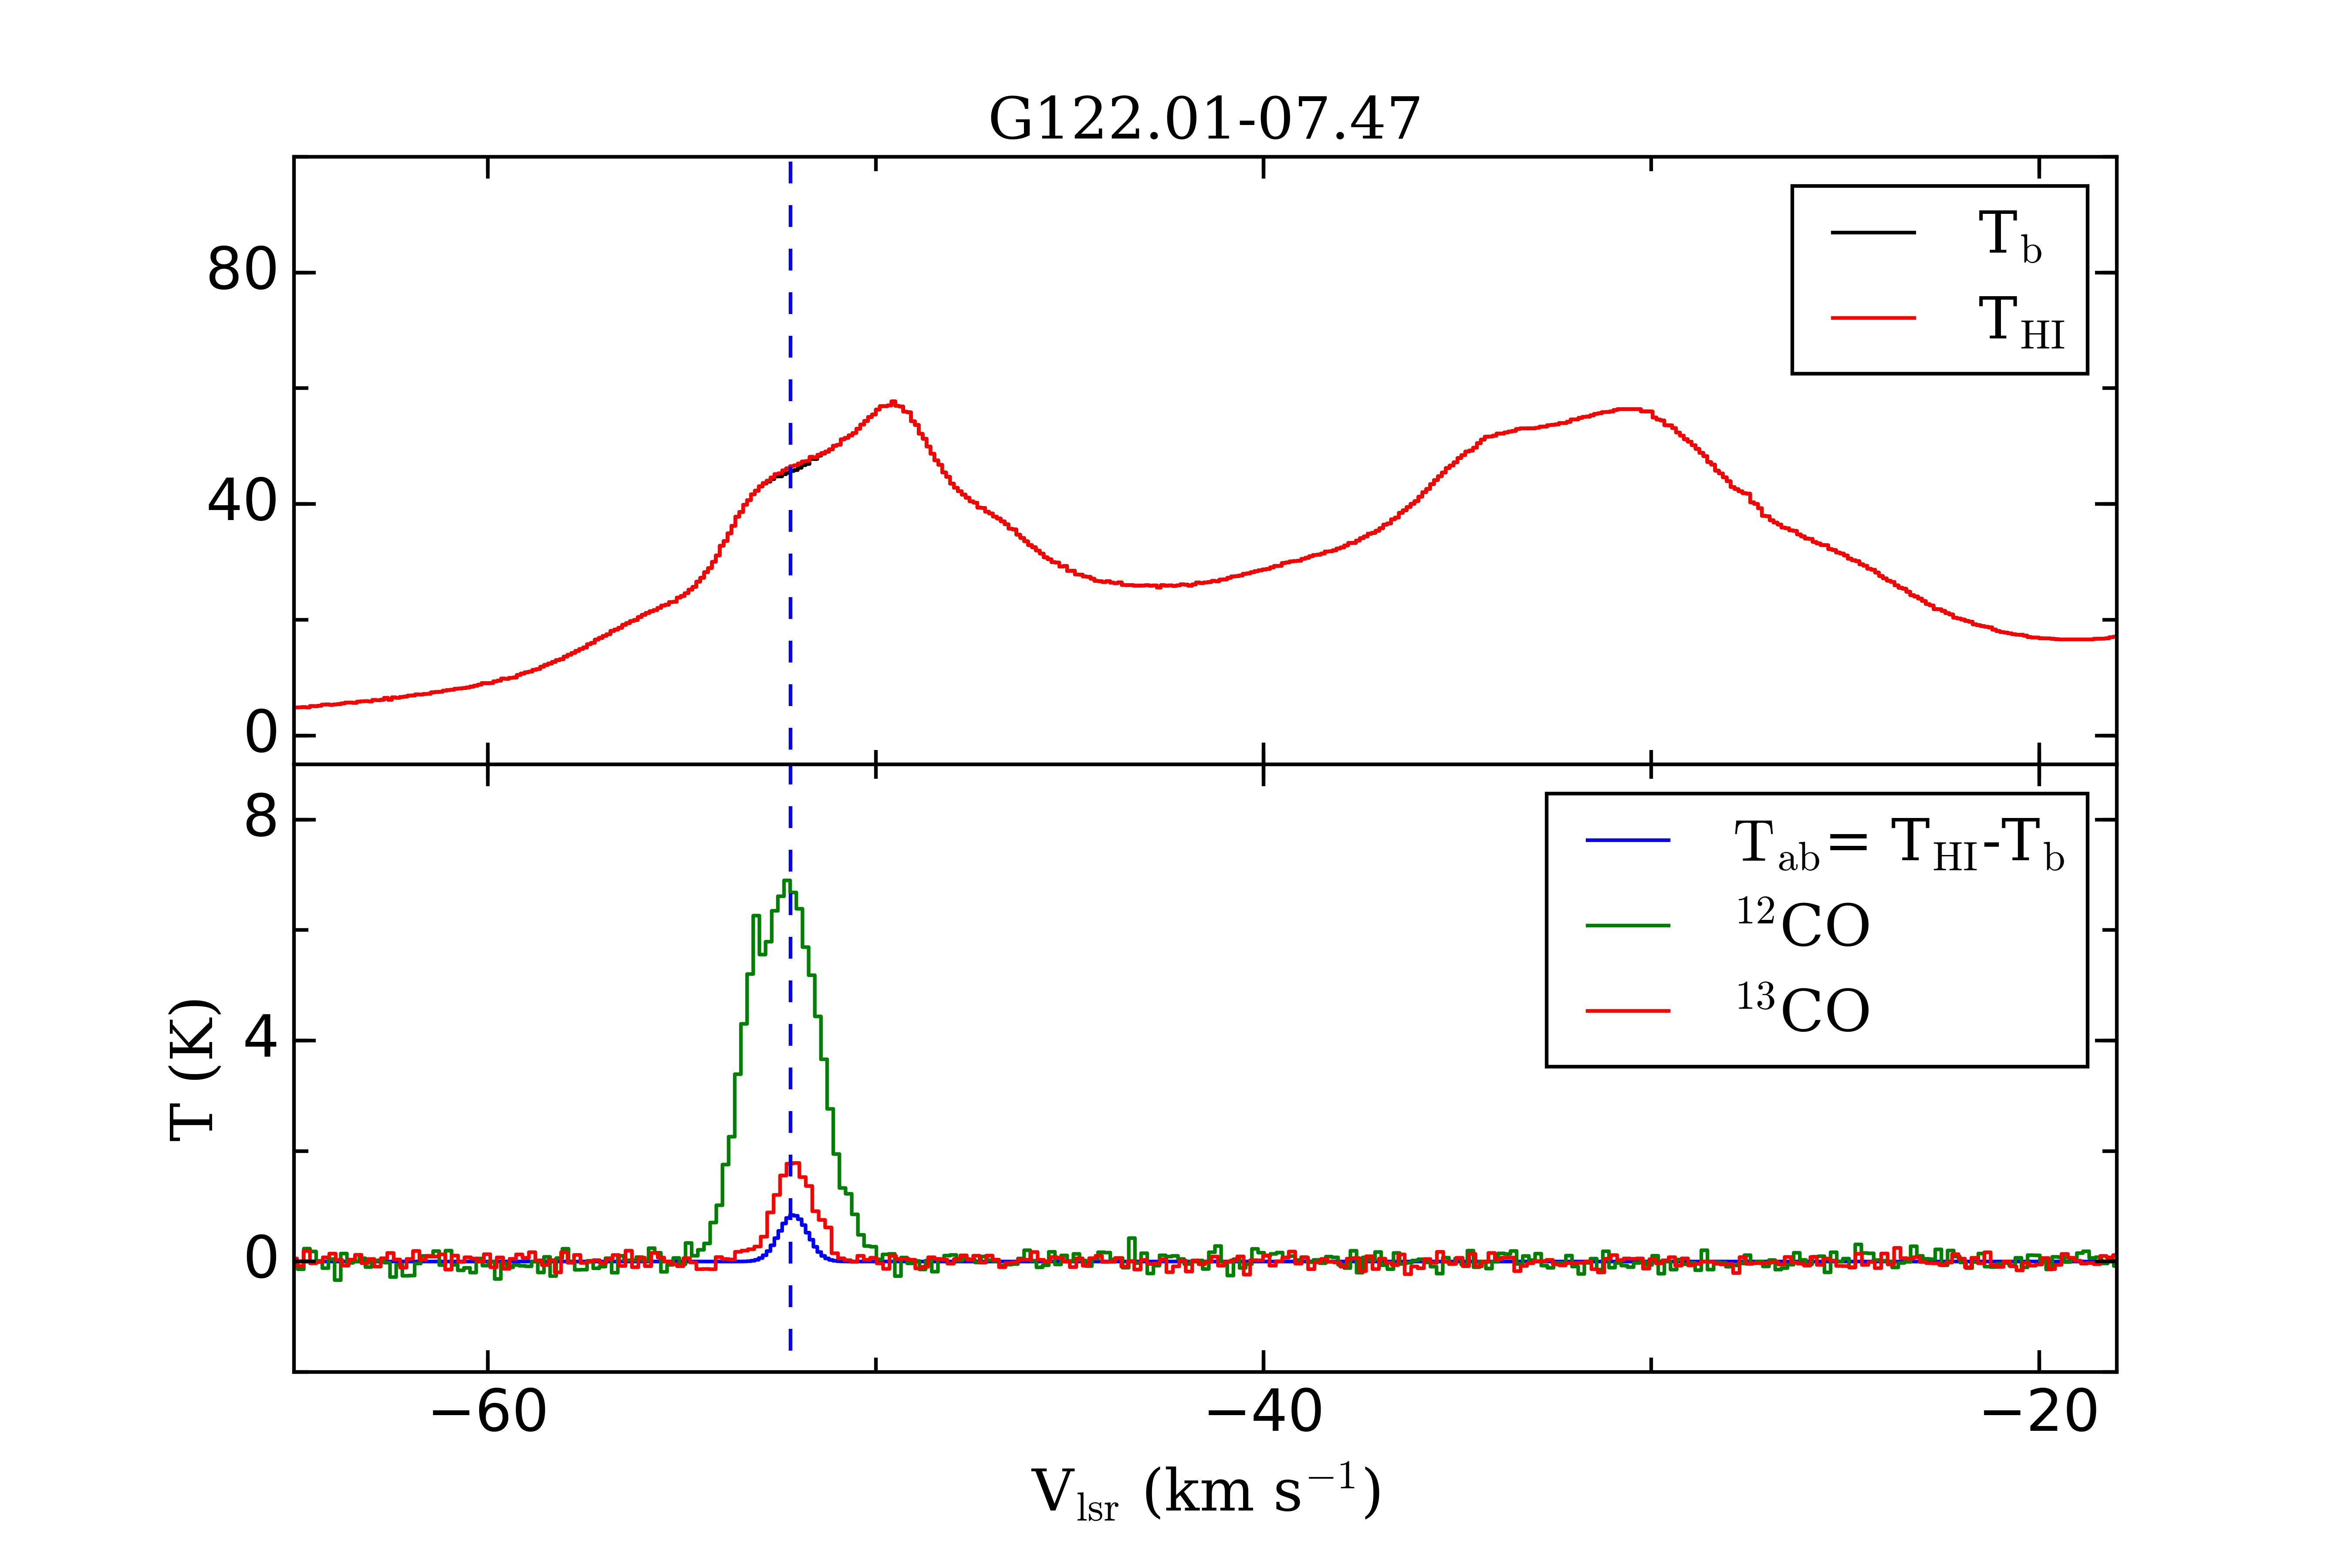
Appendix A Detected HINSA toward PGCCs
Appendix B Non-HINSA spectra toward PGCCs
