A lack of evolution in the very bright-end of the galaxy luminosity function from –
Abstract
We utilize deep near-infrared survey data from the UltraVISTA fourth data release (DR4) and the VIDEO survey, in combination with overlapping optical and Spitzer data, to search for bright star-forming galaxies at . Using a full photometric redshift fitting analysis applied to the of imaging searched, we find 27 Lyman-break galaxies (LBGs), including 20 new sources, with best-fitting photometric redshifts in the range . From this sample we derive the rest-frame UV luminosity function (LF) at and out to extremely bright UV magnitudes () for the first time. We find an excess in the number density of bright galaxies in comparison to the typically assumed Schechter functional form derived from fainter samples. Combined with previous studies at lower redshift, our results show that there is little evolution in the number density of very bright () LBGs between and . The tentative detection of an LBG with best-fit photometric redshift of in our data is consistent with the derived evolution. We show that a double power-law fit with a brightening characteristic magnitude () and a steadily steepening bright-end slope () provides a good description of the data over a wide range in absolute UV magnitude (). We postulate that the observed evolution can be explained by a lack of mass quenching at very high redshifts in combination with increasing dust obscuration within the first of galaxy evolution.
keywords:
galaxies: evolution – galaxies: formation – galaxies: high-redshift1 Introduction
The study of galaxies at ultra-high redshifts has the potential to answer fundamental questions in the field of galaxy formation and evolution. As probes of the Universe at less than a billion years after the Big Bang, galaxies at redshifts (as well as other probes such as quasars and gamma-ray bursts; e.g. Bañados et al., 2018; Tanvir et al., 2018) give an insight into the formation of the first stars, dust and super-massive black holes, as well as the process of reionization. Over the past decade the study of galaxies at these extreme redshifts has become possible with the advent of deep imaging in the near-infrared from the Hubble Space Telescope Wide Field Camera 3 (HST/WFC3) amongst other facilities. By combining optical and near-infrared imaging it is possible to select star-forming galaxies at by identifying the strong Lyman-break in the spectral-energy distribution (SED) as it is redshifted beyond . Galaxies discovered by applying this ‘Lyman-break technique’ to deep HST survey data now number many thousands at (e.g. Finkelstein et al., 2015; McLure et al., 2013) with tens at (e.g. Kawamata et al., 2018; Salmon et al., 2018; McLeod et al., 2016). These samples have allowed increasingly precise measurements of the rest-frame UV luminosity function (LF) back to Myrs after the Big Bang (e.g. Bouwens et al., 2019; Oesch et al., 2016). Using either an expanded colour-colour cut methodology (e.g. Ono et al., 2018; Bouwens et al., 2015) or a photometric redshift fitting analysis (e.g. Finkelstein et al., 2015; Bowler et al., 2015), the results of the past decade have revealed a rapid evolution in the LF of these galaxies at –. While the majority of previous studies agree within the errors at the binned level, the exact form of the evolution, for example whether the normalisation () or characteristic luminosity () is the key driver, remains debated (e.g. Bowler et al., 2015; Bouwens et al., 2015). A change in shape of the LF at these redshifts is postulated to signal a change in fundamental galaxy properties due to the young age of the Universe (Silk & Mamon, 2012). For example, a reduced AGN feedback efficiency, lack of dust content or inefficient star-formation (e.g. Bower et al., 2012; Paardekooper et al., 2013; Dayal et al., 2014; Clay et al., 2015) can lead to a change in the relative number of bright and faint galaxies compared to lower redshifts.
A key component in determining the form of any evolution is having sufficiently large samples of bright galaxies to accurately constrain the position of the knee in the LF. With HST alone this has been a challenge, even when a wide-area survey strategy is implemented, due to the small field-of-view of WFC3 (e.g. the Cosmic Assembly Near-infrared Deep Extragalactic Legacy Survey, CANDELS; Grogin et al., 2011; Koekemoer et al., 2011 covers only ). A powerful alternative approach has been to utilize the deep ground-based near-infrared data from the UK Infrared Telescope (UKIRT) and the Visible and Infrared Survey Telescope for Astronomy (VISTA). The imaging provided by these facilities has resulted in the first statistical samples of LBGs bright-ward of at (Bowler et al., 2014, 2017) and more recently the detection of similarly bright – galaxies (Stefanon et al., 2017, 2019). Selected over several square degrees, these samples probe the very bright-end of the LF and hence dramatically increase the dynamic range over which it can be constrained. Prior to these data, the high-redshift LF was typically fitted with a Schechter function (), which tends to a power-law with slope at faint luminosities, and has an exponential decline in the number of galaxies bright-ward of the characteristic luminosity at . Using a sample of extremely luminous galaxies at , Bowler et al. (2014) found evidence for an excess of galaxies compared to that expected from the previous best-fit Schechter function determined from fainter samples. The LF was found to be better described by a double power-law (DPL), potentially indicating a lack of quenching or dust obscuration at these redshifts (Bowler et al., 2015). This deviation from a Schechter form has also been found to continue to brighter magnitudes as demonstrated by samples derived from deep Hyper-SuprimeCam (HSC) -band photometry (Ono et al., 2018). The DPL form () removes the requirement for an exponential decline in the number of bright galaxies, and instead the slope of the bright-end is governed by the power-law index . If there is a change in shape of the LF at high-redshift as a consequence of fundamental changes in astrophysical effects, it holds that a shallower decline in the number of very bright galaxies should also be seen at . To-date however, it has not been possible to determine fully the shape of the function at due to a lack of dynamic range at the bright-end (Stefanon et al., 2019; hereafter S19).
What shape do we expect the rest-frame UV LF to take at high-redshift? The majority of cosmological hydrodynamic (e.g. Henriques et al., 2015; Genel et al., 2014) and analytic/semi-analytic models (e.g. Cai et al., 2014; Gonzalez-Perez et al., 2013) indeed show a power-law like decline at the bright-end, when galaxies are considered to be dust-free. In addition to showing a different shape, these models tend to over-predict the number density of the brightest galaxies by an order of magnitude in some cases (see comparison in Bowler et al., 2015). It is only after the inclusion of significant dust obscuration that these predictions are brought into agreement with the normalisation and the steeper decline in the bright-end of the observations. There is therefore considerable uncertainty in the expected rest-frame UV LF from simulations, as it depends sensitively on how dust attenuation is implemented. The underlying power-law like LF predicted by the dust-free simulations more closely follows the underlying dark matter halo mass function. As observations push to higher and higher redshifts, where galaxies are becoming progressively less dusty (e.g. as suggested by the rest-frame UV colours, e.g. Dunlop et al., 2013), it is to be expected that a power-law will better describe the observed rest-frame UV LF at the high-luminosity end.
Prior to the launch of Euclid and WFIRST, the premier near-infrared data on the degree-scale comes from surveys conducted with VISTA and UKIRT. While previously thought to be too shallow to find extremely high-redshift galaxies, the detection of very bright galaxies in UltraVISTA, in addition to the discovery of very bright LBGs in the small area HST/WFC3 surveys (e.g. Morishita et al., 2018; Roberts-Borsani et al., 2015), has highlighted the potential of this ground-based data in finding galaxies. In this work we present the results of the widest area search to-date for bright LBGs at –. We use a total of of ground-based near-infrared survey data from the UltraVISTA (McCracken et al., 2012), the UKIRT Infrared Deep Sky Survey Ultra Deep Survey (UKIDSS UDS; Lawrence et al., 2007) and the VISTA Deep Extragalactic Observations (VIDEO; Jarvis et al., 2013) surveys, in addition to deep optical and mid-infrared data from HSC and Spitzer, to search for high-redshift LBGs. The structure of this paper is as follows. In Section 2 we describe the ground-based datasets used in this analysis. In Section 3 and Section 4 we present the selection procedure and the resulting galaxy candidates. The new samples allow us to compute the bright-end of the rest-frame UV LF at – which we present in Section 5. We end with a discussion of these results in Section 6 and our conclusions in Section 7. Throughout this work we present magnitudes in the AB system (Oke, 1974; Oke & Gunn, 1983). The standard concordance cosmology is assumed, with , and .
2 Data
The two survey fields considered in this study are the COSMOS and the XMM-Newton - Large Scale Structure (XMM-LSS) fields. These fields were chosen as they contain the deepest near-infrared () photometric data on the degree-scale, in addition to other multi-wavelength data from the X-ray to the Radio. The near-infrared data is essential to detect LBGs as their rest-frame UV emission is redshifted beyond the red-optical bands. In addition, we require deep optical data to confirm the photometric redshift and to remove red contaminants such as cool brown dwarfs. Photometric data in the mid-infrared from Spitzer/Infrared Array Camera (IRAC) are also key in the removal of low-redshift dusty galaxy contaminants, which typically have much redder near-to-mid IR colours than galaxies. The overlap of these various datasets leads to a variety of regions analysed in this work. In Table 1 we summarise these regions and their area.
| Field | Region | Area | Primary Datasets |
|---|---|---|---|
| / | (near-infrared, optical) | ||
| XMM-LSS | UDS | 0.79 | UKIDSS UDS, HSC-UD |
| XMM-LSS | wide | 1.01 | VIDEO Tiles 1+2, HSC-UD |
| XMM-LSS | wide | 1.49 | VIDEO Tiles 2+3, HSC-D |
| XMM-LSS | wide/D1 | 0.97 | VIDEO Tile 3, CFHTLS |
| COSMOS | ultra-deep | 0.86 | UltraVISTA, HSC-UD |
| COSMOS | deep | 0.65 | UltraVISTA, HSC-UD |
| Total | 5.77 |
2.1 The XMM-LSS field
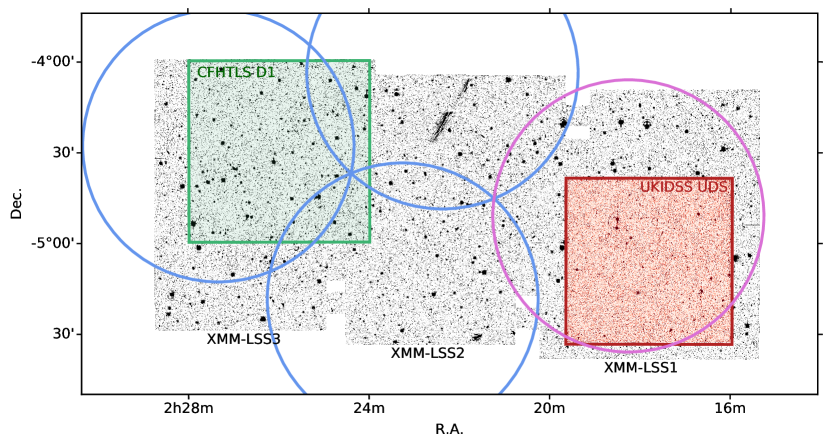
The full XMM-LSS field has been imaged in the bands as part of the VIDEO survey (Jarvis et al., 2013). As shown in Fig. 1, the full near-infrared mosaic is comprised of three completed tiles of the Visible and Infrared Camera (VIRCAM), and hence provides three times the area of the UltraVISTA data, albeit to shallower depths. The XMM-LSS field has optical data from both the ‘deep’ and ‘ultra-deep’ tier of the HSC Subaru Strategic Program (SSP; Aihara et al., 2017) in the filters. In total the field is covered by four pointings of HSC, and we use the DR1 release of the SSP. A sub-set of the XMM-LSS field has been imaged as part of the UKIDSS UDS (Lawrence et al., 2007). The UDS data, which sits within Tile 1 of the XMM-LSS VISTA imaging, reaches approximately mag deeper than VIDEO in the bands. The ‘ultra-deep’ HSC SSP imaging pointing coincides with the UDS deep near-infrared data. There exists deeper -band imaging from the Subaru/SuprimeCam (SC) in the UDS that we utilize in addition to the new HSC -band imaging (Furusawa et al., 2016). In addition, in ‘Tile 3’ of the XMM-LSS field there exists deeper optical data in the bands from the Canada-France-Hawaii Telescope Legacy Survey (CFHTLS) D1 field. Over the full XMM-LSS field there is Spitzer/IRAC imaging from the Spitzer Extragalactic Representative Volume Survey (SERVS; Mauduit et al., 2012). We also include deep IRAC imaging from the Spitzer Large-Area Survey with HSC (SPLASH; Steinhardt et al., 2014). and the Spitzer Extended Deep Survey (SEDS; Ashby et al., 2013) programs in XMM-LSS tile 1.
2.2 The COSMOS field
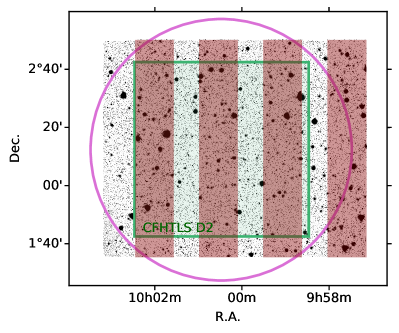
Deep near-infrared imaging of the COSMOS field has been acquired as part of the ongoing UltraVISTA survey (McCracken et al., 2012). UltraVISTA consists of deep imaging taken with the VISTA/VIRCAM over over the COSMOS field (Scoville et al., 2007). The UltraVISTA survey has two tiers. The ‘ultra-deep’ tier consists of four deeper stripes covering approximately half the full area. The remaining regions in the ‘deep’ tier are approximately shallower. We use the fourth data release (DR4) of UltraVISTA in this work. The footprints of the survey and the auxiliary optical data are shown in Fig. 2. The edges of the ‘ultra-deep’ region were defined using the local depth map. Optical data in the filters covering the majority of the field were provided by the ‘ultra-deep’ tier of the HSC SSP DR1, where we also utilize the deeper data provided in the incremental data release (Tanaka et al., 2017). In addition deeper optical imaging in the filters from the CFHT D2 field was used in the central . In this central region we also used deep -band imaging from Subaru/Suprime-Cam (Furusawa et al., 2016). This dataset reaches deeper than the HSC DR1 -band imaging. We use Spitzer/IRAC data from several different programmes. The shallowest imaging comes from SPLASH, which we supplement with deeper data from the Spitzer Matching Survey of the UltraVISTA ultra-deep Stripes survey (SMUVS; Ashby et al., 2018) and SEDS.
2.3 Image processing and catalogue creation
The imaging data presented above was matched to the astrometry and pixel scale of the VISTA near-infrared imaging. This common pixel scale was arcsec/pix in XMM-LSS and arcsec/pix in COSMOS. The astrometry of the UltraVISTA imaging in COSMOS is registered to the Gaia reference frame111http://www.eso.org/rm/api/v1/public/releaseDescriptions/132. The astrometry of the VIDEO imaging in the XMM-LSS field is registered to the Two Micron All Sky Survey (see Jarvis et al., 2013). Astrometric solutions and re-sampling of the data were performed using the SCAMP and SWARP packages respectively (Bertin, 2006; Bertin et al., 2002). We created inverse variance weighted stacks of the near-infrared data to increase our sensitivity to high-redshift sources. Catalogues were produced using SExtractor (Bertin & Arnouts, 1996) in ‘dual-image’ mode with the and stacked data as the detection images. We also created catalogues using the , and bands as the detection images, however in practice the resulting objects were all detected in the stacked images. The aperture photometry was measured in a 1.8 arcsec diameter circular aperture, and corrected to a total flux assuming a point-source correction derived from PSFEx (Bertin, 2013) in each band. This correction ranged from – in the optical bands, to – in the near-infrared and Spitzer/IRAC bands. Photometry in the Spitzer/IRAC and bands was obtained via a deconfusion analysis using the T-PHOT software (Merlin et al., 2015). The high-resolution image was taken as the VISTA -band (or -band in the UDS) and point-spread functions for this band and the IRAC dataset were derived using PSFEx. The convolution kernel for T-PHOT was obtained using a Richard-Lucy deconvolution algorithm. We used T-PHOT to fit and subtract the neighbouring galaxies around each high-redshift candidate. Aperture photometry was then obtained using a arcsec diameter aperture on this cleaned image, which was then corrected to total flux using a point-source correction.
2.4 Image depths
The limiting magnitudes for the imaging data utilized in this study are presented in Table 2. Depths were calculated using empty aperture measurements on background subtracted images. We use arcsec diameter circular apertures in this work as a compromise between optimising the signal-to-noise and the robustness of aperture measurements given the pixel size and seeing of the images (typically a full-width at half-maximum, FWHM, of ). Foreground objects were avoided using the segmentation map produced by SExtractor. Local depths across the images were calculated using the ‘median absolute deviation’ estimator from the closest 200 apertures to each point (where ). The global depths for each image or image region (e.g. ultra-deep/deep in UltraVISTA) were then derived by taking the median of the calculated local depths. The UltraVISTA ‘ultra-deep’ stripes and the UDS sub-field provide the deepest tiers of our search, while the VIDEO imaging provides a significantly wider area but at a shallower depth (Table 1). The combination of this range of data in our search enables us to probe a greater dynamic range in apparent and hence absolute magnitude than previous studies.
| COSMOS | XMM-LSS | ||||
|---|---|---|---|---|---|
| Filter | ultra-deep | deep | UDS | VIDEO | Source |
| – | – | CFHT | |||
| – | – | CFHT | |||
| – | – | CFHT | |||
| – | – | CFHT | |||
| – | – | CFHT | |||
| – | HSC | ||||
| – | HSC | ||||
| – | HSC | ||||
| – | – | – | Suprime-Cam | ||
| – | HSC | ||||
| – | HSC | ||||
| 26.2-26.3 | 25.1-25.2 | VISTA | |||
| 26.0-26.1 | 24.8-25.0 | VISTA/UKIRT | |||
| 25.6-25.7 | 24.5-24.6 | VISTA/UKIRT | |||
| 25.2-25.4 | 24.9-25.0 | VISTA/UKIRT | |||
| 24.9 | Spitzer/IRAC | ||||
| 24.8 | Spitzer/IRAC | ||||
3 Galaxy Selection
We searched for bright Lyman-break galaxy candidates in the XMM-LSS and COSMOS fields using a photometric redshift fitting analysis. Such an approach allows up to 17 bands of broad-band photometric data from the optical to mid-infrared to be utilized in the selection process. The initial candidates were extracted from the near-infrared selected catalogues described in Section 2.3 by requiring the object to be detected at significance according to the global depth in either the or -bands ( search) or or -bands ( search; -band in the UDS sub-field). We then required the object to be undetected at the level (according to the local depth) in all filters blue-ward of the expected Lyman-break for each redshift selection. For the search the reddest band where we required a non-detection was the -band, and for the – search we also required a non-detection up to and including the VISTA -band. These catalogues were visually inspected in the detection band to remove obvious artefacts such as diffraction spikes or halos around bright stars. The UKIRT imaging contains a strong ‘cross-talk’ artefact that results in repeating ghost images at 128 pixels from bright stars. Therefore in the case of UDS-detected objects, we also require a detection in the corresponding VISTA band at the level. During follow-up of LBG candidates with HST we also identified a cross-talk artefact in the VISTA data (Bowler et al., 2017). The cross-talk in the VISTA VIRCAM data is significantly fainter than that in the UDS for a given bright source, however it can mimic LBGs close to the detection limit of the data. To account for this possibility in both the UltraVISTA and VIDEO data we created a cross-talk mask by simulating the position of the cross-talk from all of the bright () stars in the image. This process was verified with visual inspection of the flagged cross-talk artefacts, where faint cross-talk has an extended, diffuse, appearance (Bowler et al., 2017) and the object in question is not detected in any other bands.
3.1 Photometric redshift analysis
The resulting catalogues, with errors derived from our local depth analysis, were then fitted with a range of galaxy and brown-dwarf templates to form the final high-redshift sample. We used the photometric redshift fitting code LePhare (Arnouts et al., 1999; Ilbert et al., 2006) with a wide-range of galaxy templates from the Bruzual & Charlot (2003) model library. A declining star-formation history was assumed, with characteristic time-scales of to approximate a burst and constant star formation at the extremes. Dust attenuation was applied assuming the Calzetti et al. (2000) dust law, with – (steps of ) to account for very dusty low-redshift interlopers (Dunlop et al., 2007). Metallicities of and were considered (Steidel et al., 2016). We performed the fitting with and without strong emission lines, which were included within LePhare following the prescription presented in Ilbert et al. (2009). We do not present the resulting best-fit galaxy physical properties such as the stellar mass, star-formation rate, the rest-frame UV slope, , or as the low number of photometric detections at these redshifts does not warrant such an analysis. Typically when over-fitting to data in this way, the resulting errors completely span the parameter space. This effect can be observed in the fitting presented in S19 (e.g. see their fig. 10).
The high-redshift candidates were first required to have a best fitting photometric redshift in the range for the preliminary sample, and for the preliminary – sample. The best-fit solution had to be formally acceptable given the number of available bands for that object in that sub-field. The lower redshift solution was required to be worse than the high-redshift fit at the level, corresponding to a . The initial selection was undertaken with the optical and near-infrared bands only (i.e. excluding the Spitzer/IRAC data) and with the results of the photometric redshift fitting without emission lines. We then calculated the photometric redshifts including the deconfused and data points, which formed the final photometric redshifts in this work. In this work we retained objects with best-fitting photometric redshifts without lines. The derived redshifts with nebular emission lines included were consistent with the line-free fits, with a small shift to higher redshifts up to due to the Lyman- and OIII + H emission lines occupying the near-infrared bands and respectively (see Table 5). The final candidates were then all carefully visually inspected in all filters to remove subtle artefacts and single-band detections. In particular visual checks in the deep Subaru -band imaging and in a stack of the optical bands was successful at removing low-redshift contaminants that appeared to be acceptable high-redshift LBG candidates. Prior to this final visual selection, the catalogues of sources that passed the automatic cuts on S/N and photometric redshift contained 495 objects.
3.2 Brown dwarf interlopers
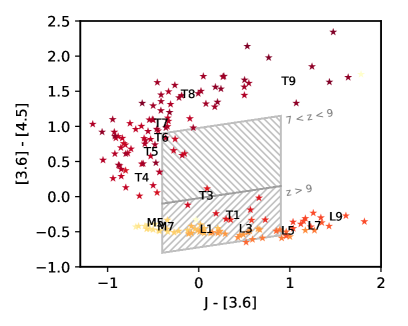
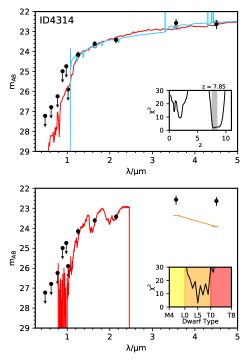
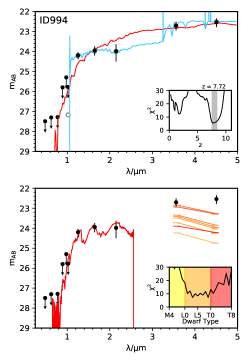
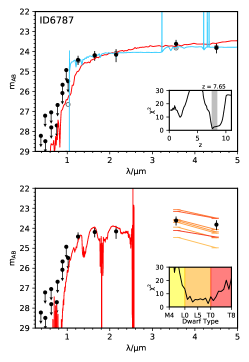
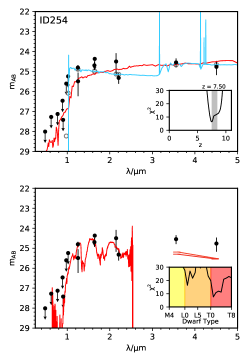
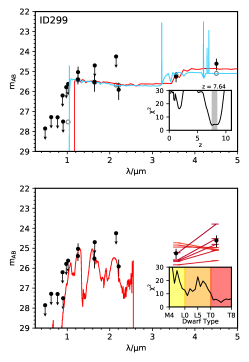
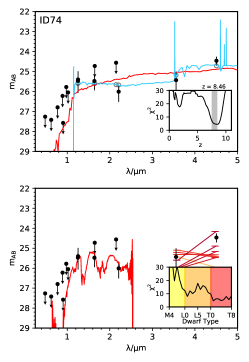
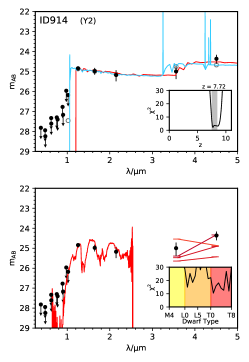
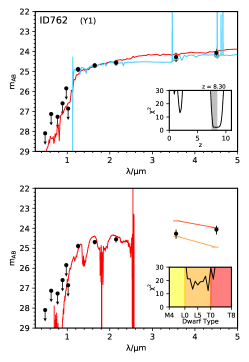
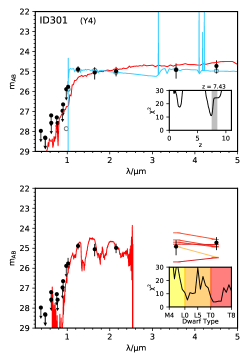
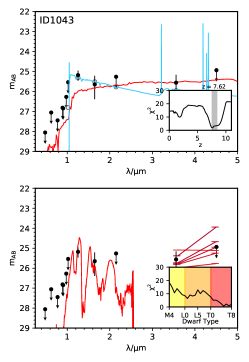
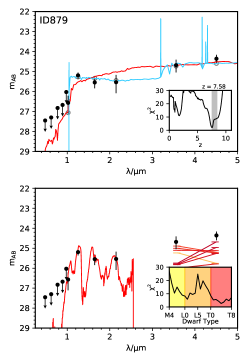
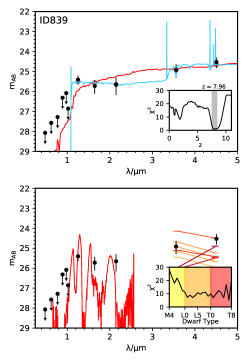
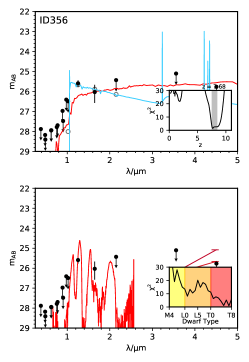
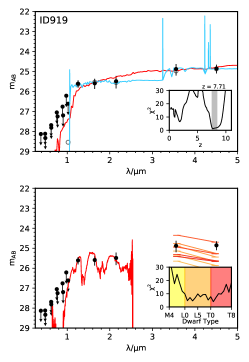
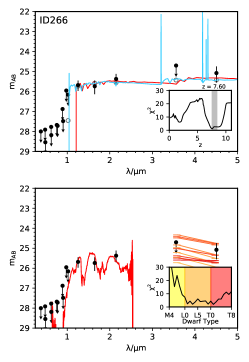
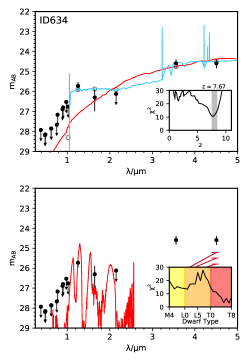
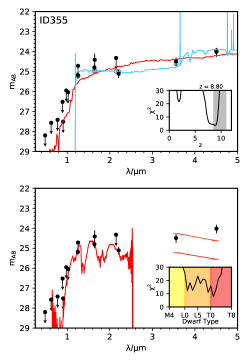
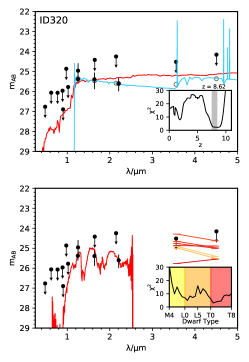
Cool Galactic brown dwarfs can mimic the colours of LBGs, as they are typically undetected in the optical bands but peak in the near-infrared. To identify brown dwarfs in our initial LBG sample we fit the photometry with reference stellar spectra from the SpeX prism library222http://pono.ucsd.edu/~adam/browndwarfs/spexprism/index.html. These templates extend from –. While brown-dwarf templates that extend into the mid-infrared do exist, these are derived from models (e.g. Burrows et al., 2006) and we found that these were unable to reproduce the observed colours of L and T-dwarfs beyond the -band (e.g. see fig 4 in Leggett et al., 2007; Leggett et al., 2019). We instead use empirical brown-dwarf colours in the Spitzer/IRAC and bands to inform our selection. We compiled observed Spitzer/IRAC photometry from Patten et al. (2006) and Kirkpatrick et al. (2011). These studies also had sub-typing of the brown dwarfs through spectroscopy. In Fig. 3 we show the and colours of brown-dwarfs from these studies, coloured and labelled by sub-type. We see that M- and L-dwarfs occupy a tight locus with and a range of colours. T-dwarfs instead occupy much redder colours. As shown in Fig. 5, the expected Spitzer/IRAC colour of sources is –. Hence, T-dwarfs, which also show a break in the -band, can mimic the colours of the high-redshift galaxies we are searching for and must be carefully considered and removed. At the expected IRAC colour of LBGs due to nebular line emission in these bands changes sign. The blue – can then be reproduced by both early L- and T-dwarfs. Our primary method for removal of this contaminant was through SED fitting of the red optical and near-infrared photometry using the SpeX templates. Using the best-fitting sub-type we were then able to predict the and magnitudes from the colours shown in Fig. 3 and the observed -band for each candidate. We show the predicted brown-dwarf magnitudes in the and bands in the SED figures presented in Appendix C. The predicted average colour (or colours, if multiple sub-types were acceptable brown dwarf fits) were then compared to the observed photometry and used to discriminate between the brown-dwarf and galaxy fits. M- and L-dwarf contaminants are expected to have detections in the red-optical or -band, and hence even if the IRAC colour is the same as that expected from a genuine high-redshift LBG, this type of contaminant can be clearly excluded from the sample according to the optical/NIR fitting. The removal of T-dwarf contaminants is more challenging, as they can reproduce the optical/NIR SED (i.e. a spectral break) and in some cases reproduce the and colours as shown in Fig. 3. While the average colour of the T-dwarfs sub-types are outside the region occupied by high-redshift sources, the T-dwarfs show a large intrinsic scatter in colour that means they can occasionally reproduce the expected colours of LBGs. Fig. 3 shows that this scatter is predominantly a problem at , while the majority of our sample show redder colours than this (see Table 3 and 4. Thus in combination with our optical/NIR fitting, we are confident that brown dwarf contamination is not significant in our sample.
| ID | R.A. | Dec. | ||||||||
|---|---|---|---|---|---|---|---|---|---|---|
| XMM3–5645 | 02:25:52.26 | -05:02:46.07 | ||||||||
| XMM2–3904 | 02:21:54.15 | -04:24:12.29 | ||||||||
| XMM2–4314 | 02:20:09.28 | -04:11:43.12 | ||||||||
| XMM1–994 | 02:16:33.48 | -04:30:07.91 | ||||||||
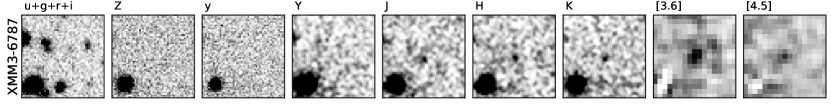
| XMM3–6787 | 02:26:16.52 | -04:07:04.07 | ||||||||
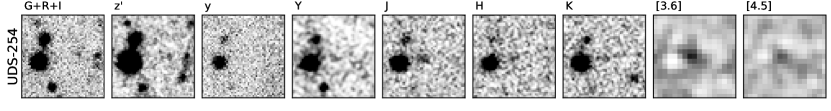
| UDS–254 | 02:16:12.56 | -04:59:28.99 | ||||||||
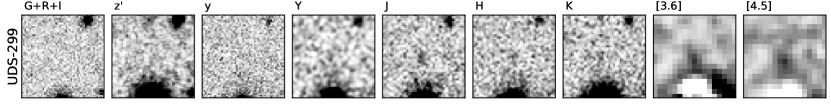
| UDS–299 | 02:17:18.55 | -04:54:58.50 | ||||||||
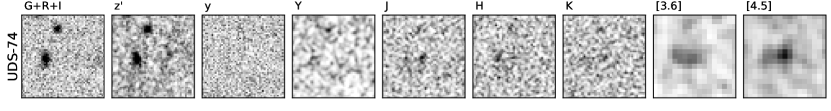
| UDS–74 | 02:16:45.78 | -05:23:33.32 | ||||||||
| UVISTA–914 | 10:02:12.55 | +02:30:45.74 | ||||||||
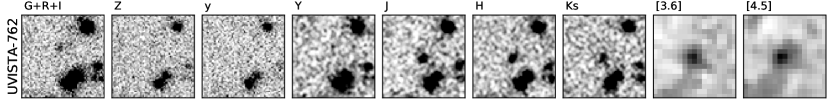
| UVISTA–762 | 09:57:47.90 | +02:20:43.55 | ||||||||
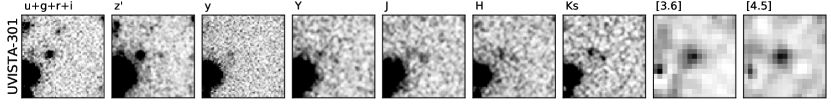
| UVISTA–301 | 10:00:58.48 | +01:49:56.00 | ||||||||
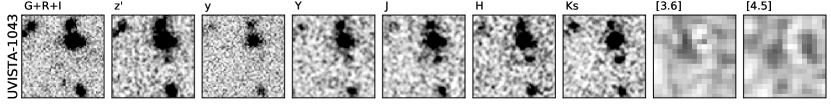
| UVISTA–1043 | 09:58:38.95 | +02:42:32.05 | ||||||||
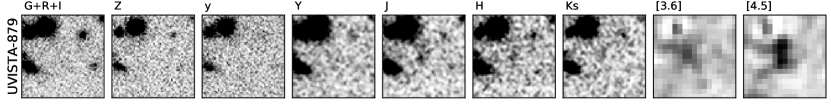
| UVISTA–879 | 09:57:54.69 | +02:27:54.90 | ||||||||
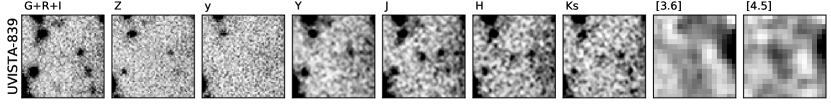
| UVISTA–839 | 09:57:54.26 | +02:25:08.41 | ||||||||
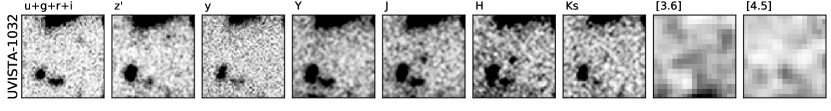
| UVISTA–1032 | 10:00:30.67 | +02:42:09.23 | ||||||||
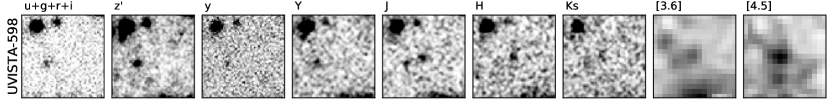
| UVISTA–598 | 10:01:47.49 | +02:10:15.39 | ||||||||
| UVISTA–213 | 10:00:32.32 | +01:44:31.21 | ||||||||
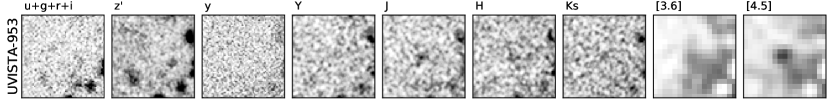
| UVISTA–953 | 10:01:56.33 | +02:34:16.21 | ||||||||
| UVISTA–356 | 10:00:17.89 | +01:53:14.35 | ||||||||
| UVISTA–919 | 10:00:22.93 | +02:31:24.36 | ||||||||
| UVISTA–266 | 10:01:45.05 | +01:48:28.53 | ||||||||
| UVISTA–634 | 10:00:41.18 | +02:12:23.95 |
| ID | R.A. | Dec. | ||||||||
| XMM3–3085 | 02:26:59.08 | -05:12:17.49 | ||||||||
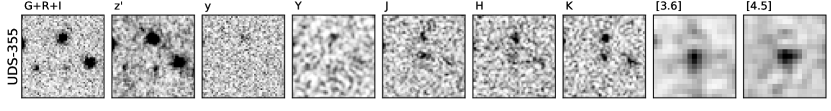
| UDS–355 | 02:17:42.47 | -04:58:57.80 | ||||||||
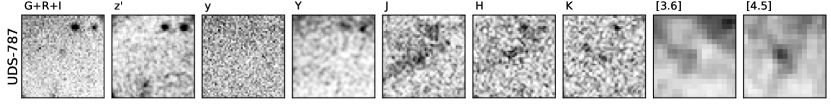
| UDS–787 | 02:16:27.92 | -04:42:29.21 | ||||||||
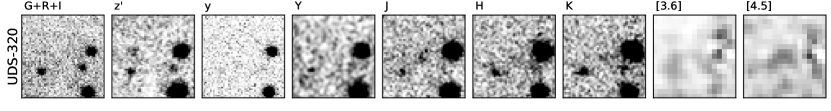
| UDS–320 | 02:18:38.44 | -04:52:59.16 | ||||||||
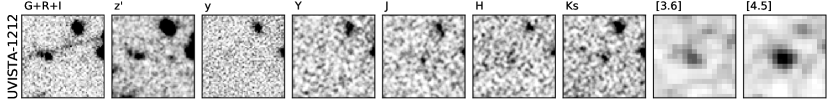
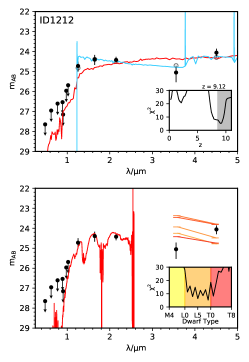
| UVISTA–1212* | 10:02:31.81 | +02:31:17.10 | ||||||||
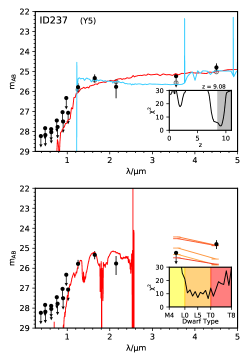
| UVISTA–237 | 10:00:31.88 | +01:57:50.04 |
4 The Sample
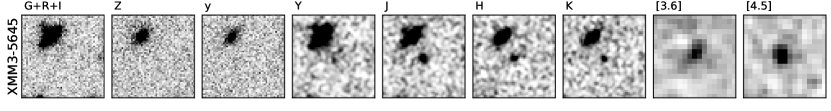
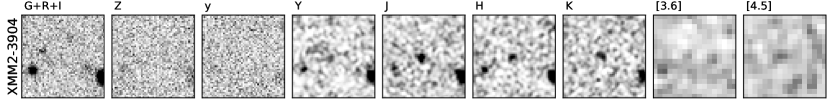
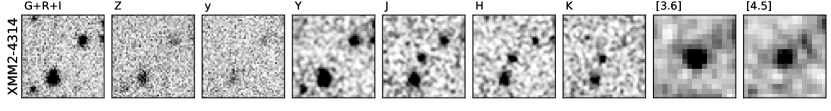
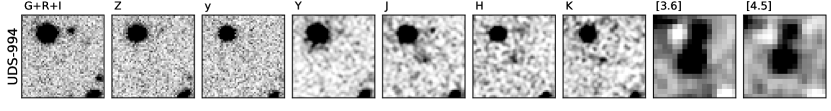
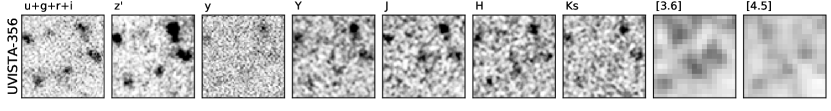
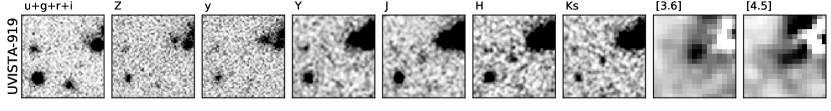
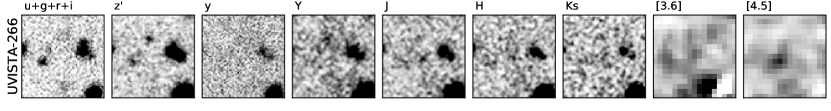
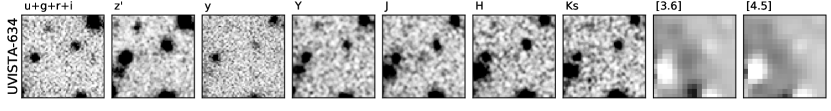
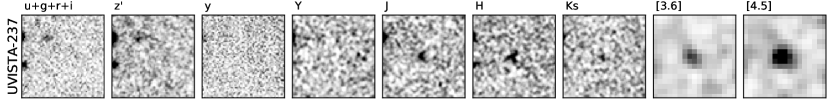
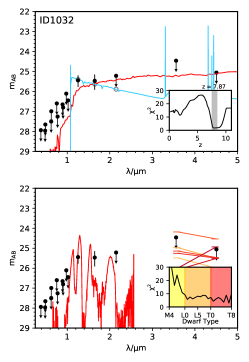
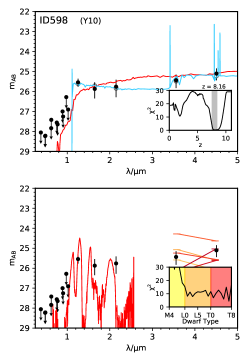
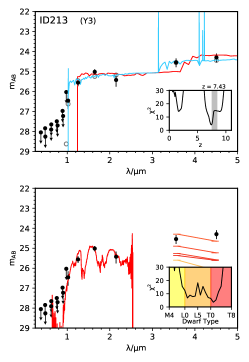
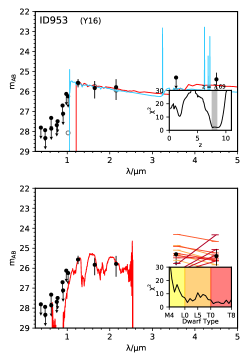
The result of our photometric redshift selection procedure was a sample of 28 candidate LBGs at from of optical/near-infrared imaging in the XMM-LSS and COSMOS fields. Of this full sample, five have photometric redshifts in the range and one object has a best-fit photometric redshift of . We present the observed photometry of the sample in Tables 3 and 4. Postage-stamp images of the candidates and the best-fitting galaxy and brown-dwarf templates are presented in Appendix C.
4.1 The XMM-LSS sample
The XMM-LSS field covers to shallower depths than COSMOS (except in the UDS sub-field), and hence the candidates found in these data contribute to the very bright-end of our sample. Within the XMM-LSS field we find eight candidate LBGs at , three at and one with a best-fit photometric redshift of . As shown in Table 3, these objects have typical near-infrared magnitudes of –. We find fewer objects over the UDS sub-field in comparison to the ‘ultra-deep’ part of COSMOS. This is to be expected as the UDS has shallower -band data and hence the selection of -dropout sources is less efficient here. The candidates were found within the deeper near-infrared data in the UKIRT UDS field. The shallower optical data over the wide XMM-LSS field makes selecting clean samples of high-redshift galaxies more challenging. We therefore view these six objects in the wide XMM-LSS field as the least secure high-redshift LBG candidates in our sample.
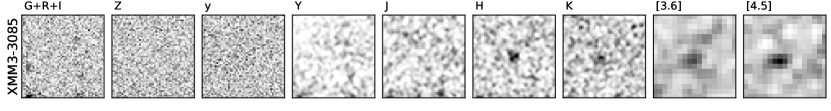
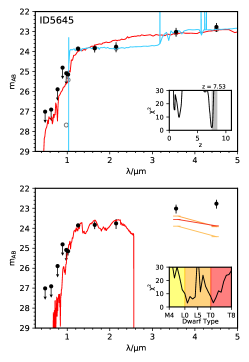
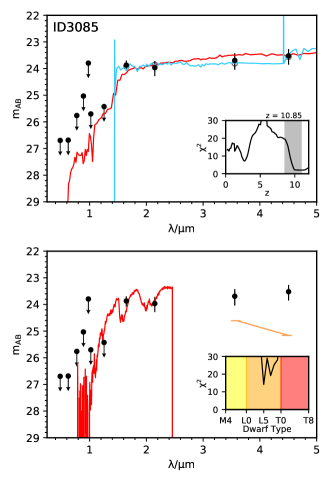
We find one candidate that passes all of our selection criterion in the wide part of our survey. As shown in Fig. 4, for XMM3-3085 the low-redshift fit is unable to reproduce the near-infrared photometry. The distribution shows that a solution is the next most probable, and this solution is formally acceptable in the SED fitting analysis. The object is excluded as a brown dwarf based on the poor in our brown dwarf fitting. If we take the best-fitting brown-dwarf sub-type, which is L5, we would expect to measure an IRAC colour of according to the measured brown dwarf colours shown in Fig. 3. This predicted IRAC colour is inconsistent with the observed photometry as shown in Fig. 4, further strengthening our conclusion that it is not a brown dwarf. This source, if confirmed, would be the brightest object known at . Deeper imaging or spectroscopy of this source will be required to determine robustly the redshift. However, as we show in Section 5, the existence of such a luminous source at this redshift is fully consistent with our derived evolution of the LF at the very bright-end.
4.2 The COSMOS sample
Within the COSMOS field we select 14 candidate LBGs at , and two at . The brightest object, UVISTA-1212, was found in the ‘deep’ part of the UltraVISTA data (see Fig. 2) whereas the remaining candidates were found within the ‘ultra-deep’ region. As the ‘ultra-deep’ stripes are the deepest near-infrared region analysed, the COSMOS candidates selected here form the faint end of our sample with –. It is to be expected that fewer candidates will be selected in the ‘deep’ component of UltraVISTA, as this imaging constitutes the shallowest -band data analysed in this study. The majority of the LBGs are detected in the Spitzer/IRAC data, with some objects visually showing the red colours expected from strong rest-frame optical emission lines (e.g. UVISTA-953). Three of the candidates were selected outside the region of very deep -band data from Subaru. UVISTA-1212 is the brightest object we find within COSMOS, and with a best-fitting photometric redshift of , it is one of the most luminous LBG candidates known with . The brown-dwarf fit can be strongly excluded based on the Spitzer/IRAC colour.
4.3 Comparison to Stefanon et al. (2017, 2019)
A search for LBGs in the COSMOS field was performed by Stefanon et al. (2017, 2019), who utilized a and -drop colour-colour cut methodology to find 16 galaxy candidates with photometric redshifts in the range . In our COSMOS sample we recover seven of this sample, predominantly the brightest objects, which are labelled in Table 5 and in the SED plots in the Appendix. Of the nine S19 LBG candidates that were not reselected in this study, all but one (Y7) were present in our initial catalogues but later excluded for being likely low-redshift galaxies in our analysis. The candidate Y7 was not detected as a distinct object in any of our initial catalogues due to being in the wings of a bright source. The sources we do not reselect are also the least secure objects in S19, where they determine that Y6, Y9, Y13, Y14, Y15 all have % likelihood of being at . We note that objects Y6 and Y11 are both detected at in the deep -band imaging from Furusawa et al. (2016) that was not utilized by S19, supporting the conclusion that they are at low-redshift. We find that the remaining objects that we fail to reselect are particularly faint in our catalogues, leading to poorly-constrained photometric redshifts. We compare the -band magnitudes from our work and S19, who used the UltraVISTA DR3 data, in Appendix A. We find evidence that the magnitudes of the fainter galaxies in the S19 sample, which were derived from the shallower UltraVISTA DR3 imaging, are too bright by mag. This could explain the down-weighting of the low-redshift solution in their analysis, as it would lead to an overestimated S/N in the near-infrared bands.
In Stefanon et al. (2017), two additional candidate were presented that appeared as -dropout sources in the ground-based photometry. When followed-up with HST/WFC3, both objects (J1 and J2) were subsequently found to be likely low-redshift interlopers when they included this new photometry in an SED fitting analysis. Stefanon et al. (2017) claim that the HST/WFC3 data was essential to determine an accurate photometric redshift, however we find that these objects are best-fit as low-redshift () galaxies using photometry derived from the same ground-based imaging utilized in their study (and also when using both the DR3 and DR4 releases of UltraVISTA). Furthermore, we find J2 to be detected at in the deeper -band imaging, which excludes it being a source. Our analysis suggests that in this case the particularly deep () -band imaging from Furusawa et al. (2016) is more valuable as a discriminator between competing low and high-redshift models than the shallower (–) near-infrared follow-up with WFC3.
4.4 Rest-frame optical colours
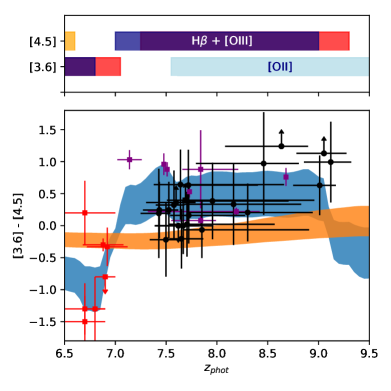
At the H and [OIII] rest-frame optical emission lines occupy the Spitzer/IRAC band, with the band only containing the weaker [OII] line. The result is that a red colour is expected if these emission lines are strong, as has been observed in samples of similarly luminous galaxies at (Bowler et al., 2017). We show the measured colours of our sample plotted against photometric redshift in Fig. 5, in comparison to other results derived from fainter sources in Smit et al. (2014) and a compilation of objects presented in Roberts-Borsani et al. (2015). We show the expected colours from a range of Bruzual & Charlot (2003) models with emission lines added according to a simple redshift dependent emission line strength model described in Bowler et al. (2014). We assume rest-frame equivalent widths in the range [OIII]Å (fixed at and allowed to evolve according to ; Fumagalli et al., 2012). While the error bars are large, we find a preference for red colours in our sample, which is in agreement with some line contamination. We find a wide distribution of colours within the sample spanning –. As shown in Fig. 5 these colours span the expected range from continuum only emission (orange shaded region) to significant contamination by extreme emission lines (blue shaded region). Our results therefore indicate that there is a distribution in rest-frame optical emission line strengths in bright () star-forming galaxies at , from no discernible emission to rest-frame equivalent widths exceeding [OIII]Å. This is consistent with previous measurements of the IRAC colours of bright LBGs, which also show a large spread in under a deconfusion analysis using HST/WFC3 imaging (Bowler et al., 2017). Hashimoto et al. (2018) find evidence for a strong Balmer break indicative of an evolved stellar population in a lensed LBG. The IRAC colour in this galaxy, MACS1149-JD1 was measured to be , which if interpreted as a Balmer break, suggests that this galaxy was forming stars only 250 Myrs after the Big Bang. The majority of our sample do not show such red colours, which suggests that either MACS1149-JD1 is not representative of the galaxy population at these redshifts or that the IRAC colour in this object is due to contamination by the [OIII] emission line.
5 Determination of the LF
In this section, we use the results of our search for – star-forming galaxies to determine the bright-end of the rest-frame UV luminosity function. The best-fitting photometric redshifts and absolute UV magnitudes for our sample of 28 LBGs are presented in Table 5. We calculate the absolute UV magnitude from the best-fitting SED model using a top-hat filter of width 100Å centred on 1500Å. Due to the wide-area imaging utilized by our study, we are able to select extremely luminous LBG candidates with absolute magnitudes as bright as . While the majority of the most luminous sources we detect were found in the XMM-LSS field, we also detect one particularly luminous source in the COSMOS field, as well as recovering the bright sub-sample of LBG candidates found by S19. At the faint-end of our sample the sources exclusively come from the COSMOS/UltraVISTA ‘ultra-deep’ tier of data, which crucially provides very deep -band imaging that allows the selection of sources down to an . Due to the lack of photometric filters around the Lyman-break region (e.g. as compared to where the break is bracket by multiple close - and -band filters) the photometric redshifts at – have a broader probability distribution and hence have larger errors. We nevertheless split our sample into and bins for the LF calculation with the expectation that once spectroscopically confirmed, the sources will span the expected range in photometric redshifts as derived from the fitting. We find one ultra-luminous candidate LBG with a photometric redshift of , leading to a derived absolute magnitude of . Given the large errors on the photometric redshift of this source, due to the putative Lyman-break from this candidate occupying the space between the and -bands, we estimate the number density associated with this candidate and compare it to previous results at . In Table 5 we present the photometric redshifts with and without nebular emission lines included in the fitting. For the LF analysis we utilize the photometric redshifts derived when fitting with nebular emission lines, as there is evidence from the Spitzer/IRAC colours that line emission is important in bright LBGs at high-redshift (Section 4.4). The line-free results are typically – lower, and hence our LF results are unchanged if we use these values.
| ID | S19 | |||
|---|---|---|---|---|
| (line free) | (with lines) | |||
| XMM3–3085 | ||||
| XMM3–5645 | ||||
| XMM2–4314 | ||||
| XMM2–3904 | ||||
| UVISTA–1212 | ||||
| XMM1–994 | ||||
| XMM3–6787 | ||||
| UDS–355 | ||||
| UDS–787 | ||||
| UVISTA–762 | Y1 | |||
| UVISTA–914 | Y2 | |||
| UDS–254 | ||||
| UVISTA–301 | Y4 | |||
| UVISTA–237 | Y5 | |||
| UDS–320 | ||||
| UVISTA–879 | ||||
| UVISTA–1043 | ||||
| UVISTA–1032 | ||||
| UDS–74 | ||||
| UDS–299 | ||||
| UVISTA–213 | Y3 | |||
| UVISTA–839 | ||||
| UVISTA–598 | Y10 | |||
| UVISTA–953 | Y16 | |||
| UVISTA–919 | ||||
| UVISTA–356 | ||||
| UVISTA–266 | ||||
| UVISTA–634 |
5.1 Completeness simulations
We perform a full simulation of our selection process by injecting and recovering fake high-redshift sources into the imaging data. This process allows an estimate of the incompleteness of our selection methodology. In this study we use predominantly optical and near-infrared imaging over the XMM-LSS and COSMOS extragalactic fields as shown in Figs. 1 and 2. To accurately derive the comoving number density of galaxies from our data it is necessary to take into account the differing image depths across the two fields. To do this we simulate six separate regions of the fields which are detailed in Table 1. Fake sources were created with a realistic rest-frame UV slope (mean ), with a Gaussian scatter of (Rogers et al., 2014). We injected these sources as point sources (Bowler et al., 2014) into all of the available ground-based images within each sub-field and recovered them following the steps undertaken for real sources. The proportion of fake galaxies that passed this selection procedure were then used to estimate the completeness as a function of and , which was then folded into the LF calculation. The absolute magnitude distribution of injected fake sources was calculated according to an assumed underlying LF. We ran simulations assuming both a DPL function form derived in Bowler et al. (2015), and a Schechter function form with the parameters and redshift evolution of Bouwens et al. (2015). As expected, the completeness derived from these two assumed LF functional forms were comparable for the faintest sources in our sample, where the DPL and Schechter forms converge. For the brightest sources (at ) the results differ due to the steep exponential slope of the Schechter function, which results in a larger contribution from up-scattered sources and the derived “completeness” typically exceeding one. If the underlying functional form was Schechter, then applying this correction would bring the observed excess down, and the data points would reflect the steep exponential decline. When we do this however, we still find an excess of sources bright-ward of the knee, suggestive of a deviation from this function form. Hence in our final LF, we calculate the binned points assuming the completeness derived from an underlying DPL function.
5.2 Binned results
We calculate the binned LF data points, , from our sample using the classic estimator (Schmidt, 1968). Here the fiducial volume that each galaxy could occupy is given by the shell between the limits of the redshift bin (e.g. ). The upper redshift limit is then modulated according to the point at which that object would be undetected in our selection, taken as when the redshifting of the galaxy SED causes it to drop below the limit of the detection band. Hence for the faintest objects in a given dataset the is lower than that for brighter objects, which typically could be recovered in the full redshift range of the selection. The incompleteness is taken into account by effectively reducing this volume by where is the completeness as a function of the absolute magnitude and redshift of each galaxy (and is determined from the simulations described previously).
| Redshift | |||
| /mag | /mag | ||
| 8 | |||
| 8 | |||
| 8 | |||
| 9 | |||
| 9 |
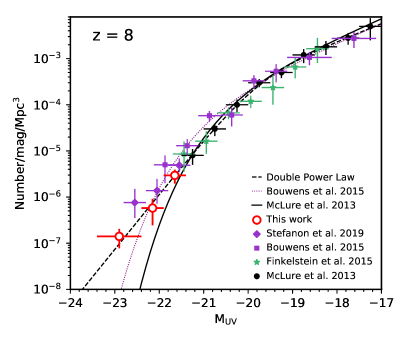
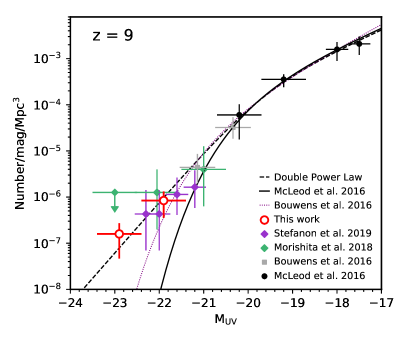
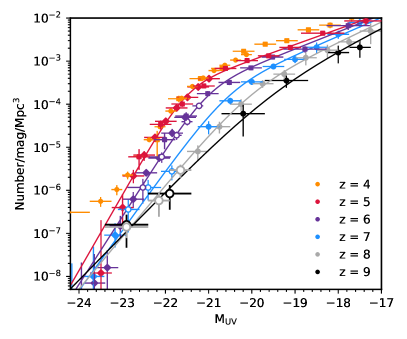
For our final rest-frame UV LF results we combine the XMM-LSS and COSMOS samples to span the full range in absolute UV magnitude probed by the different depths of data in the two fields. We calculate the and LF bright-ward of , as this is the magnitude at which our simulations demonstrate that we become more than 50 percent incomplete. At we compute the results in bins of width near to the faint cut-off. For the brightest bin at and for the two bins at , we use larger bin widths of to account for the smaller number of objects in these magnitude and redshift ranges. The resulting binned points are shown in Fig. 6 and are tabulated in Table 6. The wide area we probe using the ground-based XMM-LSS field in combination with COSMOS enables us to determine the number density of LBGs as bright as for the first time at these redshifts. At , where our three bins span in absolute UV magnitude, we see a clear decline in the number density of bright galaxies by more than a factor of ten. However, the decline we see is not as rapid as expected from the Schechter function fits of previous studies, extrapolated to brighter magnitudes. Our results at are significantly in excess of the Schechter fits from McLure et al. (2013) and McLeod et al. (2016) at and respectively. In comparison to the fits from Bouwens et al. (2015) and Bouwens et al. (2016), which find a brighter characteristic magnitude than the McLure et al. (2013) and McLeod et al. (2016) studies, we still find an excess of sources around . We also fit a DPL function to our results (combined with fainter studies as described in Section 5.3), and show this as the dashed line. This function appears to better reproduce the decline we see at the bright-end for these redshift bins. When comparing the binned results at and , we do not see strong evolution in the number densities at the absolute magnitudes probed by this study. We find fewer sources at than at but because the volume for selection is smaller at (due to the requirement for deep -band imaging which is only satisfied in the deeper COSMOS and UDS regions) the derived LF is similar between the two bins. We discuss the inferred number density of LBGs from our single candidate in this bin in Section 6.3.
5.2.1 Comparison to Previous Studies
Our derived LF points are consistent (within the errors) with previous results in the magnitude regime where they overlap. The most comparable work to this study was undertaken by S19, who searched for LBGs in the COSMOS field using the shallower UltraVISTA DR3 data. As described in Section 4.3 we reselect percent of their sample as high-redshift objects. When comparing our LF points at we find a number density that is approximately a factor of two lower, in agreement with the direct sample comparison. Note that when calculating the LF S19 use a subset of their full sample with . Hence the five objects which they assign to the bin are also included in the results. If instead their sample was split by best-fitting photometric redshift as we do in this study, the evolution they find in the number counts between – would be reduced. The HST pure-parallel program BoRG has provided wide-area NIR imaging for the selection of high-redshift galaxies over multiple sight-lines. With filter-sets especially designed for selection and sources, the BoRG and BoRG[z9] surveys have covered an area of approximately each, allowing constraints on the bright-end of the LF. At , Morishita et al. (2018) used the full BoRG[z9] survey to search for galaxy candidates, finding two sources consistent with being at this redshift. As shown in Fig. 6 their derived number density is consistent with our results, although the small number of objects (two sources in three magnitude bins) makes the errors on the binned points particularly large.
5.3 Schechter and DPL function fitting
| 8 | ||||
|---|---|---|---|---|
| 8 | – | |||
| 9 | – |
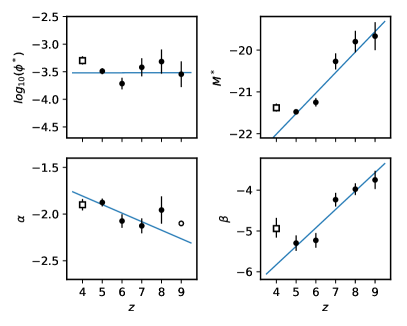
To determine the best-fit parameters for the DPL and Schechter functional forms we combine our results with data points at fainter magnitudes derived in previous studies. We include the results of McLure et al. (2013) and McLeod et al. (2016) for the fitting at and respectively. These studies used a similar photometric-redshift fitting methodology as that utilized in this work. We checked that our conclusions are unchanged if we include the other available studies over the same range in absolute magnitude. We determined the best-fitting parameters using least squares fitting, with the one dimensional errors on the parameters derived by minimising the over the other free parameters. We present the best-fitting DPL and Schechter function parameters and errors in Table 7, and show the best-fitting DPL fit as the dashed lines in Fig. 6. We also fit Schechter and DPL functions to a selection of data at – to derive the evolution of the fit parameters. Here we include the results of Ono et al. (2018) that probe predominantly bright-ward of the LF knee. At and we add our previous results from Bowler et al. (2015, 2014). For the faint-end of the LF we include the results of Bouwens et al. (2015) at and , and McLure et al. (2013) at . We stress that our results are not sensitively dependent on which studies we choose to fit. All parameters are allowed to be free in the fitting process, except for the faint-end slope of the DPL at , which we cannot constrain from our data. Here we fix the slope to the best-fitting value found for a DPL fit at and (; Bowler et al., 2015). Once the best-fit parameters and errors have been derived for each redshift bin and functional form, we combine these results to derive a simple linear evolution model. We fit the parameters derived for each redshift between to , and measure the gradient and intercept of , , and (for DPL) over this range. The results and the linear fits are shown in Fig. 7 for the DPL form. The evolution can be described by the following equations, with reference to :
| (1) |
The results of this simple analysis show that with a DPL form the LF evolution is dominated by changes in and , with and showing little change. In Fig. 7 we also show the best-fitting parameters at derived in an independent analysis by Adams et al. (2020). Their analysis show a similarly bright and steep bright-end slope () to our fitting results at . As we discuss in Section 6.2, at the impact of AGN on the bright-end of the LF becomes significant. However, even with this added complication, the fits of Adams et al. (2020) show best-fitting and values that are lower than our results, while the and values are comparable in agreement with our proposed evolution. We perform an identical analysis assuming a Schechter function. The evolution of the parameters are shown in Appendix B. The assumption of a Schechter function dramatically changes the derived form of the evolution, with the best-fitting absolute magnitude becoming nearly constant at while the and parameters strongly evolve. We discuss the implications of these different evolutionary scenarios in the next section.
6 Discussion
In this study we searched for LBGs within of optical, near and mid-infrared imaging in the XMM-LSS and COSMOS fields. The result was a sample of 27 candidate galaxies with best-fitting photometric redshifts in the range , and one extremely bright candidate LBG in the XMM-LSS field. With this sample we computed the rest-frame UV LF and used this, in combination with data at –, to derive the shape and evolution of the best-fitting function parameters in the range –.
6.1 Shape of the rest-frame UV LF at –
With the advent of sufficiently deep and wide-area surveys to select samples of luminous () galaxies at high redshifts, there has been an increased discussion on the functional form of the rest-frame UV LF. Prior to surveys from VISTA, UKIRT and HSC, the observed LFs at were derived almost exclusively from HST data covering at most (e.g from CANDELS). These results were well described by a Schechter functional form, as the lack of galaxies at bright magnitudes, in addition to the larger errors in these bins, permitted an exponential decline bright-ward of the knee in the number counts. The UltraVISTA survey has revolutionised the study of the very bright-end of the LF, as it crucially provided deep -band data that probes just red-ward the Lyman-break at these redshifts, on a degree-scale for the first time. In Bowler et al. (2012, 2014) we presented a sample of very bright LBGs selected predominantly from the UltraVISTA data, which provided the first evidence for an excess in the number density above that expected from the previously assumed Schechter function. In subsequent deeper data releases, the high-redshift nature of these sources has been confirmed with significantly deeper optical to near-infrared photometry (Bowler et al., 2018). Furthermore, several of these extremely luminous sources have now been spectroscopically confirmed with ALMA (e.g. Hashimoto et al., 2019, Schouws et al. in prep.), thus strengthening the conclusion that the rest-frame UV LF at this redshift deviates from a Schechter from. In this study we find evidence that a shallower functional form continues out to and (and potentially even , see Section 6.3). A number of the very bright LBG candidates we present in this work were selected from regions of shallower optical data, as a consequence of the wide-areas needed to find them. This could lead to a higher rate of contamination in these sub-samples. Even in a pessimistic case of high contamination, leading to the confirmation of only one or two sources in these bins, this would still significantly challenge a Schechter function decline. At lower redshifts there is now additional evidence for a deviation from a Schechter function. Using the HSC SSP data, Ono et al. (2018) found that the – LFs show an excess of very bright-galaxies and are preferentially fit with a DPL or lensed Schechter function. The excess of sources at from this study can be seen in Fig. 6, in comparison to our previous work at and .
In light of this evidence from previous studies, and our new results at , it is pertinent to discuss what functional form is to be expected for the rest-frame UV LF at very high redshift. In the local Universe, the mass and rest-frame optical luminosity functions of galaxies can be well described by single or double Schechter functions (e.g. Peng et al., 2010; Baldry et al., 2012; Loveday et al., 2012). However, when measurements have been made using a waveband that probes recent SF rather than mass, several studies have found a shallower decline than expected from a Schechter function at the high-luminosity end. For example, measurements of the far-IR LF (e.g. Soifer et al., 1987) and dust-corrected near-UV (Jurek et al., 2013) and H (Gunawardhana et al., 2013) LFs, have all shown deviations from a Schechter form. Scatter in the mass-to-light ratio of galaxies, for example due to stochastic star formation, can naturally explain this observed shallower decline for SFR-based LFs as opposed to mass functions (MFs) in these studies. Salim & Lee (2012) and more recently Ren et al. (2019) have theoretically demonstrated this effect, showing that scatter in SFR as a function of galaxy or halo mass causes a shallower decline in LF measurements that trace the galaxy SFR. Given this theoretical prediction, why is it that rest-frame UV LFs at intermediate redshifts (; Parsa et al., 2016; Shapley, 2011; van der Burg et al., 2010) show an apparent Schechter function form, despite tracing the recent SFR of the galaxies in question? An answer to this question may be found by inspecting the results of galaxy formation simulations and models. The majority of these models initially over-predict the number of luminous galaxies in the rest-frame UV LF, potentially due to the effect of scatter between SFR and mass (e.g. Cai et al., 2014; Genel et al., 2014; Henriques et al., 2015; Paardekooper et al., 2013). The models are then brought into agreement with the observed number densities with the addition of significant dust attenuation (see discussion in Bowler et al., 2015). Therefore from both theoretical arguments and the results of simulations, it is expected that without the effects of dust, the rest-frame UV LF should have a shallower decline at the bright-end, inconsistent with a Schechter function form. While the presence of dust in intermediate redshift LBGs is expected and has been comprehensively measured (e.g. Fudamoto et al., 2017; McLure et al., 2018), the same is not true at the very high-redshifts considered in this study. Depending on the dust formation mechanism, it is argued that early galaxies have limited dust (e.g. Michałowski, 2015). Indeed, low dust attenuation is often assumed for high-redshift galaxies and is what is expected from the evolution of the colour-magnitude relation (Rogers et al., 2014; Bouwens et al., 2015). We therefore would expect the observed rest-frame UV LF to approach a power-law like form at the bright-end as the effects of dust become less significant. While there have been direct observations of dust continuum emission from LBGs (e.g. Tamura et al., 2019; Bowler et al., 2018; Laporte et al., 2017), the derived dust masses in these sources are reduced compared to low-redshift observations, because of the higher assumed dust temperature (e.g. Hashimoto et al., 2019). In addition to the effect of reduced dust at the highest redshifts, there is reason to believe that the underlying MF of galaxies during this epoch is shallower than observed in the local Universe. In the phenomenological model presented in Peng et al. (2010), the exponential decline in the number of massive galaxies at low-redshift is a result of a characteristic quenching stellar mass () above which SF, and hence mass-growth, is halted. The expected stellar masses of the galaxies we find are significantly lower than this quenching mass (e.g. Bowler et al., 2014), and hence it is reasonable to assume that the stellar mass function at this time has a different form. The detection of the very bright star-forming galaxies in this work suggests that we may be observing this transition into an era before mass quenching and significant dust attenuation.
One other potentially important effect on the observed shape of the bright-end of the LF is the role of magnification bias. In the case of a steeply declining galaxy LF, gravitational lensing can have a significant effect on the number of very luminous sources detected. For example, if an underlying Schechter function is assumed for high-redshift galaxies, all sources detected bright-ward of are strongly lensed objects (Mason et al., 2015; Barone-Nugent et al., 2015). As in our previous works at and , we directly measured the gravitational lensing of our sources using a simple model of the magnification from foreground galaxies in our images (Bowler et al., 2014, 2015). We find no evidence that the brightest sources are preferentially lensed compared to a random sky position. The typical magnification due to foreground galaxies was a brightening of –, and this was found to be uncorrelated with the observed magnitude of the source. We therefore exclude strong lensing as a cause of the observed shape of the LF. Even when demagnifying the sources at , we still find an excess in the number of the brightest galaxies compared to the Schechter function prediction (Bowler et al., 2014). The importance of the magnification bias on the observed LF depends on the steepness of the underlying function. We have argued that the rest-frame UV LF at very high-redshifts is expected to be shallower than the typically assumed Schechter function. In the case of a DPL or power-law form, the effects of lensing will be significantly reduced, particularly in the magnitude ranges probed by this study (see figure 13 in Mason et al., 2015). The direct measurement of a low magnification for the brightest objects in our sample thus further supports a more gentle decline in the bright-end of the LF than expected from a Schechter function.
6.2 Form of the LF evolution from –
In Fig. 8 we show a comparison between the observed rest-frame UV LF data points from – and our evolving DPL model. Remarkably, the LF is now measured over six magnitudes even at . From the data alone, it is clear that there is a rapid change in the number density of star-forming galaxies over this epoch (–; ), and that this evolution predominantly happens around the knee of the function at . In this study we have focused on determining the bright-end of the very high-redshift LF. Between and we find no evidence for a change in the number density of the brightest galaxies (). It is clear from Fig. 8 however, that this lack of evolution is also observed down to , as seen in our previous studies (Bowler et al., 2014, 2015) and at brighter magnitudes in the study of Ono et al. (2018). The results of our DPL function fitting in Section 5.3 demonstrate that this observed lack of evolution at the very bright-end is a result of a change in shape in the rest-frame UV LF over this redshift interval. As we have argued in the previous sub-section, this conclusion is theoretically motivated by a change in the presence of dust in galaxies over this timescale, such that between and the rest-frame UV LF transitions from being a DPL-like function to being better described by a Schechter function. One added complication when considering the shape of the – LF is the presence of high-redshift AGN that have comparable number densities to LBGs at . These faint AGN show similar broad-band colours to LBGs and ‘contaminate’ the measurement of the galaxy UV LF, leading to a boost in the bright-end of the function that must be accounted for (Adams et al., 2020; Ono et al., 2018; Stevans et al., 2018; Bian et al., 2013)). At the quasar LF is observed to rapidly drop (, ; Jiang et al., 2016), making this effect insignificant at the magnitudes probes by this study (see Bowler et al., 2014 for further discussion). The presence of AGN at is clear visible in Fig. 8 at .
The lack of evolution we observe at the bright-end of the LF is a consequence of the general evolution we see at – in which the bright-end slope steepens and brightens with time. The additional freedom in the bright-end slope that is granted in the DPL formalism, and the addition of our bright LF points, results in a different evolutionary scenario than previous studies that have typically assumed a Schechter function form. In the last decade, there has been continued discussion on which parameters drive the LF evolution at high redshift, for example whether changes in (e.g. Bouwens et al., 2011; McLure et al., 2009) or (e.g. van der Burg et al., 2010) are dominant. Recent analyses by Bouwens et al. (2015) and Finkelstein et al. (2015), who used a compilation of HST data, concluded instead that the LF evolves predominantly by -evolution between – with the absolute UV magnitude appearing to remain constant at . In contrast, by allowing the functional form to change over the range –, we found evidence for changes in over this epoch (Bowler et al., 2015). Here we have extended this analysis and have shown that an evolving DPL formalism holds up to . We also exploited our function fitting framework to explore what evolution we would derive if we assumed a Schechter function when fitting our compilation of data. The results of this analysis are presented in Appendix B. Interestingly, the resulting evolution from this procedure is a predominantly -evolution, consistent with the previous results from Bouwens et al. (2015); Finkelstein et al. (2015). This comes about due to the approximately constant number density of sources, coupled with the hard exponential cut-off imposed in the Schechter function formalism. The results of this analysis do not adequately reproduce the observed LF points at at however, as can be seen in Fig. 13. In light of our new observations, and the compilation of other studies at bright-magnitudes at –, we argue that the previously derived -evolution was caused by the fitting of a different and possibly not correct function to the data. While the relatively steep bright-end slope at – can be equally well reproduced by a DPL or Schechter function (Bowler et al., 2015), at the DPL better describes the drop-off as demonstrated in Fig. 8. As we have discussed in Section 6.1, the observed change in the shape of the rest-frame UV LF can be explained as the combined effect of a lack of mass quenching and a lack of dust obscuration in star-forming galaxies.
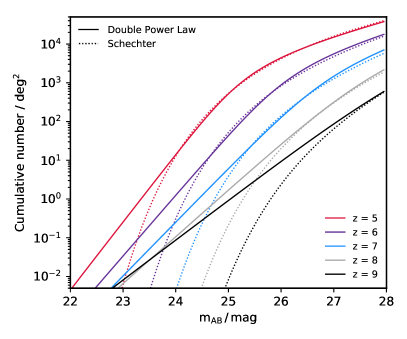
Our results have strong implications for the yield of upcoming wide-area near-infrared surveys from Euclid and WFIRST. In Fig. 9 we compute the cumulative number density of galaxies as a function of apparent magnitude with our evolving DPL and Schechter function parameterization. The DPL formalism dramatically increases the predicted number of very bright LBGs over the Schechter function predictions. For reference the Euclid satellite will provide of data to a depth of as part of the deep survey component, and to a depth of in the wide component. If our derived DPL formalism is an accurate representation of the galaxy number counts at , then we expect numerous detections (thousands) of very bright LBGs at these redshifts even in the wide survey from Euclid.
6.3 The existence of very bright LBGs
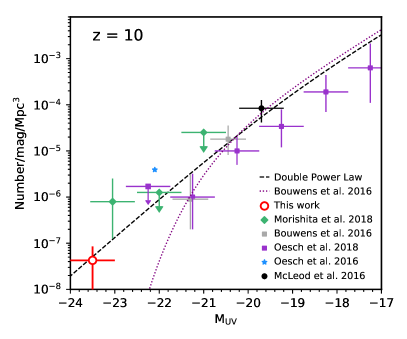
Using our formalism for the evolution of the rest-frame UV LF at we can speculate on the prevalence of very bright LBGs. The predicted DPL function at from our evolution parameterization is shown in Fig. 10, along with the results of previous studies. The extrapolated parameters are , , and . We estimate the number density of our single source using a LF bin at . The candidate LBG, XMM3-3085, has a photometric redshift of . If confirmed as a high-redshift source, this object would be the most luminous LBG known at with a . The detection of one such source over our survey area however, is not unexpected from our evolving DPL model. The extrapolated DPL almost exactly matches the derived number density of this single source. The expected number density of AGN at this and redshift is a factor of times lower than of this source assuming the evolving DPL model of Jiang et al. (2016). Morishita et al. (2018) also presented one surprisingly bright candidate found within the BoRG[z9] survey. The source, , has an apparent magnitude of and was found in only . The derived number density of LBGs from Morishita et al. (2018) is an order of magnitude higher than our extrapolated DPL prediction. In Fig. 10 we also plot the estimated number density derived from the source GN-z11 presented in Oesch et al. (2016). This object is fainter than the BoRG[z9] source, with , however the derived number density is also significantly in excess of our extrapolated DPL prediction. At the faint-end of the LF at , our extrapolated DPL LF and the Schechter function parameterization of Bouwens et al. (2016) are in excess of the binned LF points at this redshift derived by Oesch et al. (2018). Oesch et al. (2018) argue that there is an accelerated decline in the number of sources from –. If confirmed this would make the detection of extremely bright sources at these ultra-high redshifts even more unusual (see also McLeod et al., 2016). The detection of these ultra-high-redshift sources will continue to be extremely challenging prior to the launch of JWST, with contamination being more likely given the lack of detections redward of the Lyman-break. If any of these extremely bright sources are spectroscopically confirmed, it would lend significantly weight to our proposed model of the evolving LF, as current Schechter function parameterisations essentially do not predict any sources to exist brightward of at .
7 Conclusions
We have undertaken a search for bright Lyman-break galaxies over of ground-based data in the COSMOS and XMM-LSS fields. Using a full photometric redshift fitting method to the UltraVISTA DR4, VIDEO and UKIRT UDS near-infrared imaging combined with deep optical and Spitzer/IRAC data, we find 27 candidate LBGs in the redshift range . The galaxies are some of the most luminous galaxies known at ultra-high redshift, with absolute UV magnitudes in the range . We also find one candidate LBG with a best-fitting photometric redshift of in the XMM-LSS field. We carefully exclude brown-dwarf contaminants that can mimic the colours of high-redshift galaxies, by incorporating the expected Spitzer/IRAC colours using an empirical relation between the -, - and -band magnitudes and sub-type. We compute the rest-frame UV LF from our sample at and , extending the measurements to for the first time at these redshifts. When compared to the Schechter function predictions from previous studies based on fainter samples, we find an excess in the number density of very bright galaxies in our samples. We find instead that a double power law provides a good fit to the data. When comparing the derived number density of very bright LBGs from this study and previous works, we find a lack of evolution between and at . By fitting a simple linear evolution model to the data at , we find that a DPL model with a brightening characteristic magnitude () and a steepening bright-end slope () can reproduce the observed evolution in the rest-frame UV LF in the range . We argue that a shallower decline in the number density of the most luminous sources is to be expected at very high redshifts, due to the reduction in the dust obscuration that has been shown in both simulations and observations to shape the bright-end of the rest-frame UV LF at . The lack of mass quenching for galaxies at these very high redshifts further acts to soften the bright-end decline of the observed LF. Further insights into the interplay between these important astrophysical effects will be obtained from new larger samples derived from upcoming surveys (e.g. Euclid and WFIRST), robust measurements of the mass function at very high-redshifts from including deep Spitzer and JWST data, and detailed dust continuum measurements from ALMA.
Acknowledgements
This work was supported by the Glasstone Foundation and the Oxford Hintze Centre for Astrophysical Surveys which is funded through generous support from the Hintze Family Charitable Foundation. The Cosmic Dawn Center is funded by the Danish National Research Foundation. BMJ is supported in part by Independent Research Fund Denmark grant DFF - 7014-00017. This work is based on data products from observations made with ESO Telescopes at the La Silla Paranal Observatory under ESO programme ID 179.A-2005 and ID 179.A-2006 and on data products produced by CALET and the Cambridge Astronomy Survey Unit on behalf of the UltraVISTA and VIDEO consortia. The Hyper Suprime-Cam (HSC) collaboration includes the astronomical communities of Japan and Taiwan, and Princeton University. The HSC instrumentation and software were developed by the National Astronomical Observatory of Japan (NAOJ), the Kavli Institute for the Physics and Mathematics of the Universe (Kavli IPMU), the University of Tokyo, the High Energy Accelerator Research Organization (KEK), the Academia Sinica Institute for Astronomy and Astrophysics in Taiwan (ASIAA), and Princeton University. Funding was contributed by the FIRST program from Japanese Cabinet Office, the Ministry of Education, Culture, Sports, Science and Technology (MEXT), the Japan Society for the Promotion of Science (JSPS), Japan Science and Technology Agency (JST), the Toray Science Foundation, NAOJ, Kavli IPMU, KEK, ASIAA, and Princeton University. This paper makes use of software developed for the Large Synoptic Survey Telescope. We thank the LSST Project for making their code available as free software at http://dm.lsst.org. Based in part on data collected at the Subaru Telescope and retrieved from the HSC data archive system, which is operated by Subaru Telescope and Astronomy Data Center at National Astronomical Observatory of Japan. This study was based in part on observations obtained with MegaPrime/MegaCam, a joint project of CFHT and CEA/DAPNIA, at the Canada-France-Hawaii Telescope (CFHT) which is operated by the National Research Council (NRC) of Canada, the Institut National des Science de l’Univers of the Centre National de la Recherche Scientifique (CNRS) of France, and the University of Hawaii. This work is based in part on data products produced at TERAPIX and the Canadian Astronomy Data Centre as part of the CFHTLS, a collaborative project of NRC and CNRS. This work is based in part on observations made with the Spitzer Space Telescope, which is operated by the Jet Propulsion Laboratory, California Institute of Technology under NASA contract 1407. This research made use of Astropy, a community-developed core Python package for Astronomy (Astropy Collaboration, 2013). This research has benefitted from the SpeX Prism Spectral Libraries, maintained by Adam Burgasser at http://pono.ucsd.edu/~adam/browndwarfs/spexprism.
References
- Adams et al. (2020) Adams N. J., Bowler R. A. A., Jarvis M. J., Häußler B., McLure R. J., Bunker A., Dunlop J. S., Verma A., 2020, preprint (arXiv:1912.01626)
- Aihara et al. (2017) Aihara H., et al., 2017, PASJ, 70, S8
- Arnouts et al. (1999) Arnouts S., Cristiani S., Moscardini L., Matarrese S., Lucchin F., Fontana A., Giallongo E., 1999, MNRAS, 310, 540
- Ashby et al. (2013) Ashby M. L. N., et al., 2013, ApJ, 769, 80
- Ashby et al. (2018) Ashby M. L. N., et al., 2018, ApJSS, 237
- Baldry et al. (2012) Baldry I. K., et al., 2012, MNRAS, 421, 621
- Bañados et al. (2018) Bañados E., et al., 2018, Nat, 553, 473
- Barone-Nugent et al. (2015) Barone-Nugent R. L., Wyithe J. S. B., Trenti M., Treu T., Oesch P., Bouwens R., Illingworth G. D., Schmidt K. B., 2015, MNRAS, 450, 1224
- Bertin (2006) Bertin E., 2006, ASP Conf. Ser., 351
- Bertin (2013) Bertin E., 2013, ASCL, p. 1301.001
- Bertin & Arnouts (1996) Bertin E., Arnouts S., 1996, A&AS, 117, 393
- Bertin et al. (2002) Bertin E., Mellier Y., Radovich M., Missonnier G., Didelon P., Morin B., 2002, ASP Conf. Proc., 281
- Bian et al. (2013) Bian F., et al., 2013, ApJ, 774, 28
- Bouwens et al. (2011) Bouwens R. J., et al., 2011, Nat, 469, 504
- Bouwens et al. (2015) Bouwens R. J., et al., 2015, ApJ, 803, 34
- Bouwens et al. (2016) Bouwens R. J., et al., 2016, ApJ, 830, 67
- Bouwens et al. (2019) Bouwens R. J., Stefanon M., Oesch P. A., Illingworth G. D., Nanayakkara T., Roberts-Borsani G., Labbé I., Smit R., 2019, ApJ, 880, 25
- Bower et al. (2012) Bower R. G., Benson A. J., Crain R. A., 2012, MNRAS, 422, 2816
- Bowler et al. (2012) Bowler R. A. A., et al., 2012, MNRAS, 426, 2772
- Bowler et al. (2014) Bowler R. A. A., et al., 2014, MNRAS, 440, 2810
- Bowler et al. (2015) Bowler R. A. A., et al., 2015, MNRAS, 452, 1817
- Bowler et al. (2017) Bowler R. A. A., Dunlop J. S., McLure R. J., McLeod D. J., 2017, MNRAS, 466, 3612
- Bowler et al. (2018) Bowler R. A. A., Bourne N., Dunlop J. S., McLure R. J., McLeod D. J., 2018, MNRAS, 481, 1631
- Bruzual & Charlot (2003) Bruzual G., Charlot S., 2003, MNRAS, 344, 1000
- Burrows et al. (2006) Burrows A., Sudarsky D., Hubeny I., 2006, ApJ, 640, 1063
- Cai et al. (2014) Cai Z.-Y., Lapi A., Bressan A., De Zotti G., Negrello M., Danese L., 2014, ApJ, 785, 65
- Calzetti et al. (2000) Calzetti D., Armus L., Bohlin R. C., Kinney A. L., Koornneef J., Storchi-Bergmann T., 2000, ApJ, 533, 682
- Clay et al. (2015) Clay S., Thomas P., Wilkins S., Henriques B., 2015, MNRAS, 415, 2692
- Dayal et al. (2014) Dayal P., Ferrara A., Dunlop J. S., Pacucci F., 2014, MNRAS, 445, 2545
- Dunlop et al. (2007) Dunlop J. S., Cirasuolo M., McLure R. J., 2007, MNRAS, 376, 1054
- Dunlop et al. (2013) Dunlop J. S., et al., 2013, MNRAS, 432, 3520
- Finkelstein et al. (2015) Finkelstein S. L., et al., 2015, ApJ, 810, 71
- Fudamoto et al. (2017) Fudamoto Y., et al., 2017, MNRAS, 472, 483
- Fumagalli et al. (2012) Fumagalli M., et al., 2012, ApJ, 757, L22
- Furusawa et al. (2016) Furusawa H., et al., 2016, ApJ, 822, 46
- Genel et al. (2014) Genel S., et al., 2014, MNRAS, 445, 175
- Gonzalez-Perez et al. (2013) Gonzalez-Perez V., Lacey C. G., Baugh C. M., Frenk C. S., Wilkins S. M., 2013, MNRAS, 429, 1609
- Grogin et al. (2011) Grogin N. A., et al., 2011, ApJS, 197, 35
- Gunawardhana et al. (2013) Gunawardhana M. L. P., et al., 2013, MNRAS, 433, 2764
- Hashimoto et al. (2018) Hashimoto T., et al., 2018, Nat, 557, 392
- Hashimoto et al. (2019) Hashimoto T., et al., 2019, PASJ, 71, 1
- Henriques et al. (2015) Henriques B., White S., Thomas P., Angulo R., Guo Q., Lemson G., Springel V., Overzier R., 2015, MNRAS, 451, 2663
- Ilbert et al. (2006) Ilbert O., et al., 2006, A&A, 457, 841
- Ilbert et al. (2009) Ilbert O., et al., 2009, ApJ, 690, 1236
- Jarvis et al. (2013) Jarvis M. J., et al., 2013, MNRAS, 428, 1281
- Jiang et al. (2016) Jiang L., et al., 2016, ApJ, 833
- Jurek et al. (2013) Jurek R. J., et al., 2013, MNRAS, 434, 257
- Kawamata et al. (2018) Kawamata R., Ishigaki M., Shimasaku K., Oguri M., Ouchi M., Tanigawa S., 2018, ApJ, 855, 4
- Kirkpatrick et al. (2011) Kirkpatrick J. D., et al., 2011, ApJSS, 197, 19
- Koekemoer et al. (2011) Koekemoer A. M., et al., 2011, ApJS, 197, 36
- Laporte et al. (2017) Laporte N., et al., 2017, ApJ, 837, L21
- Lawrence et al. (2007) Lawrence A., et al., 2007, MNRAS, 379, 1599
- Leggett et al. (2007) Leggett S. K., Saumon D., Marley M. S., Geballe T. R., Golimowski D. A., Stephens D., Fan X., 2007, ApJ, 655, 1079
- Leggett et al. (2019) Leggett S. K., et al., 2019, ApJ, 882, 117
- Loveday et al. (2012) Loveday J., et al., 2012, MNRAS, 420, 1239
- Mason et al. (2015) Mason C. A., et al., 2015, ApJ, 805, 1
- Mauduit et al. (2012) Mauduit J. C., et al., 2012, PASP, 124, 714
- McCracken et al. (2012) McCracken H. J., et al., 2012, A&A, 544, A156
- McLeod et al. (2016) McLeod D. J., McLure R. J., Dunlop J. S., 2016, MNRAS, 459, 3812
- McLure et al. (2009) McLure R. J., Cirasuolo M., Dunlop J. S., Foucaud S., Almaini O., 2009, MNRAS, 395, 2196
- McLure et al. (2013) McLure R. J., et al., 2013, MNRAS, 432, 2696
- McLure et al. (2018) McLure R. J., et al., 2018, MNRAS, 476, 3991
- Merlin et al. (2015) Merlin E., et al., 2015, A&A, 582, A15
- Michałowski (2015) Michałowski M. J., 2015, A&A, 577, A80
- Morishita et al. (2018) Morishita T., et al., 2018, ApJ, 867, 150
- Oesch et al. (2016) Oesch P. A., et al., 2016, ApJ, 819, 129
- Oesch et al. (2018) Oesch P. A., Bouwens R. J., Illingworth G. D., Labbé I., Stefanon M., 2018, ApJ, 855, 105
- Oke (1974) Oke J. B., 1974, ApJS, 27, 21
- Oke & Gunn (1983) Oke J. B., Gunn J. E., 1983, ApJ, 266, 713
- Ono et al. (2018) Ono Y., et al., 2018, PASJ, 70, 1
- Paardekooper et al. (2013) Paardekooper J.-P., Khochfar S., Dalla C. V., 2013, MNRAS, 429, L94
- Parsa et al. (2016) Parsa S., Dunlop J. S., McLure R. J., Mortlock A., 2016, MNRAS, 456, 3194
- Patten et al. (2006) Patten B. M., et al., 2006, ApJ, 651, 502
- Peng et al. (2010) Peng Y., et al., 2010, ApJ, 721, 193
- Ren et al. (2019) Ren K., Trenti M., Mason C. A., 2019, ApJ, 878
- Roberts-Borsani et al. (2015) Roberts-Borsani G. W., et al., 2015, ApJ, 823, 143
- Rogers et al. (2014) Rogers A. B., et al., 2014, MNRAS, 440, 3714
- Salim & Lee (2012) Salim S., Lee J. C., 2012, ApJ, 758, 134
- Salmon et al. (2018) Salmon B., et al., 2018, ApJ, 864, L22
- Schmidt (1968) Schmidt M., 1968, ApJ, 151, 393
- Scoville et al. (2007) Scoville N., et al., 2007, ApJS, 172, 1
- Shapley (2011) Shapley A. E., 2011, ARA&A, 49, 525
- Silk & Mamon (2012) Silk J., Mamon G. A., 2012, RAA, 12, 917
- Smit et al. (2014) Smit R., et al., 2014, ApJ, 784, 58
- Soifer et al. (1987) Soifer B. T., Sanders D. B., Madore B. F., Neugebauer G., Danielson G. E., Elias J. H., Lonsdale C. J., Rice W. L., 1987, ApJ, 320, 238
- Stefanon et al. (2017) Stefanon M., et al., 2017, ApJ, 851, 43
- Stefanon et al. (2019) Stefanon M., et al., 2019, ApJ, 883, 99
- Steidel et al. (2016) Steidel C. C., Strom A. L., Pettini M., Rudie G. C., Reddy N. A., Trainor R. F., 2016, ApJ, 826, 159
- Steinhardt et al. (2014) Steinhardt C. L., et al., 2014, ApJ, 791, L25
- Stevans et al. (2018) Stevans M. L., et al., 2018, ApJ, 863, 63
- Tamura et al. (2019) Tamura Y., et al., 2019, ApJ, 874, 27
- Tanaka et al. (2017) Tanaka M., et al., 2017, preprint (arxiv:1706:00566)
- Tanvir et al. (2018) Tanvir N. R., et al., 2018, ApJ, 865, 107
- van der Burg et al. (2010) van der Burg R. F. J., Hildebrandt H., Erben T., 2010, A&A, 523, A74
Appendix A Comparison to photometry of S19
Here we present a comparison between the photometry in S19 and our catalogues, in an effort to understand why we do not recover their full sample of LBG candidates. At the bright-end of our samples we find good agreement within the errors (), however we find that for the fainter S19 candidates their photometry is systematically fainter than that measured in our catalogues as shown in Fig. 11. For objects Y5, Y8-Y11, Y14 and Y16 we find offsets exceeding , with offsets of for Y9 and Y11. S19 used the UltraVISTA DR3 photometry, whereas we use the more recent DR4 release. If we instead measure our photometry on the DR3 images, the offset is significantly reduced, demonstrating that the observed difference in magnitude is mainly due to a difference between the DR3 and DR4 data. There is no zeropoint offset between the two data releases. As the objects with the biggest discrepancy between DR3 and DR4 are close to the magnitude limit of the survey, it is likely that they were up-scattered by noise into the S19 sample (while other high-redshift candidates were down-scattered). S19 require a detection in a stack of five bands for selection, whereas we impose a more conservative cut of significance in a single band. The result is that our selection is less effected by noise, because we do not select as close to the limit of the data. To test this hypothesis we compared the photometry for a sample of sources that were first identified in the UltraVISTA DR1 to the resulting photometry from DR2, using our method of cutting at in a single band (Bowler et al., 2014). We find no systematic offset between these measurements, providing reassurance that our photometry is robust for the sample presented in this work. Stefanon et al. (2017) note that they find offsets between their HST/WFC3 data and the UltraVISTA imaging. For objects Y5, J1 and J2 they find that the UltraVISTA -band measurement was brighter than the WFC3 -band magnitude. Our photometry of these objects suggest that the UltraVISTA -band magnitudes should be fainter than those presented in Stefanon et al. (2017), somewhat reducing the observed discrepancy.
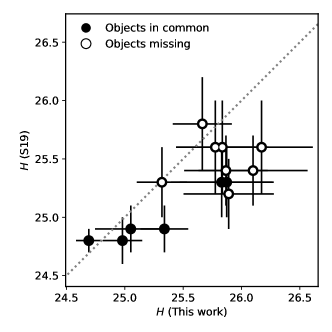
Appendix B Schechter function evolution
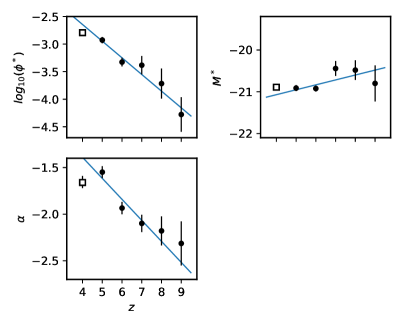
In addition to the DPL fitting, we ran an identical procedure assuming a Schechter function. The best-fitting Schechter function parameters and the linear fit to these results are shown in Fig 12. The evolution of the parameters according to the linear fit is given by the following equations for the characteristic magnitude, normalisation and faint-end slope respectively:
| (2) |
As can be seen in Fig. 12 we find that the assumption of a Schechter function changes dramatically the derived evolution, in comparison on our fiducial DPL fits. We find a strong evolution in and , while the characteristic magnitude staying approximately constant at . These evolving Schechter functions cannot reproduce the measured number density of very bright LBGs at . As shown in Fig. 13, at at –, the Schechter function fits dramatically under-predict the number of sources that have been observed, whereas it provides a good description of the decline at – (see Bowler et al., 2015 for further discussion).
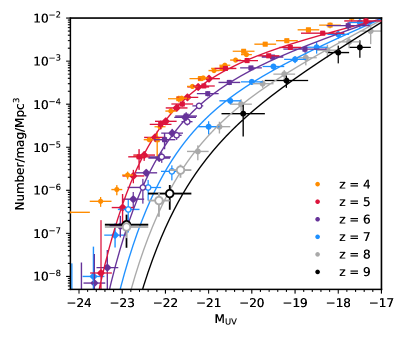
Appendix C Postage-stamps and SED fitting figures
The postage-stamp cutout images and SED fitting results for our sample of 28 high-redshift LBGs. In Fig. 14 and Fig. 15–16 we show the postage-stamps for the sample in the XMM-LSS and COSMOS fields respectively. In Fig. 17 we show the postage-stamps for the sample, and the images for the source are shown in Fig. 18. The SED plots for the sample in the XMM-LSS and COSMOS fields are shown in Fig. 19–20 and Fig. 21–22, respectively. The SED fitting results for the sample are shown in Fig. 23.