Recency predicts bursts
in the evolution of author citations
Abstract
The citations process for scientific papers has been studied extensively. But while the citations accrued by authors are the sum of the citations of their papers, translating the dynamics of citation accumulation from the paper to the author level is not trivial. Here we conduct a systematic study of the evolution of author citations, and in particular their bursty dynamics. We find empirical evidence of a correlation between the number of citations most recently accrued by an author and the number of citations they receive in the future. Using a simple model where the probability for an author to receive new citations depends only on the number of citations collected in the previous 12–24 months, we are able to reproduce both the citation and burst size distributions of authors across multiple decades.
1 Indiana University Network Science Institute, USA
2 Center for Complex Networks and Systems Research,
Luddy School of Informatics, Computing and Engineering,
Indiana University, Bloomington, USA
3 Institute of Mathematics and Computer Science,
University of São Paulo,
São Carlos, Brazil
Keywords— Citation dynamics, authors, recency, preferential attachment
1 Introduction
Citations are one of the most widely used indicators of academic impact and, as such, they have been studied extensively (Waltman, , 2016). Despite a lack of consensus about the relevance of citations as an indicator of quality (Leydesdorff et al., , 2016; Martin and Irvine, , 1983), papers and authors with a large number of citations are considered influential. Understanding the process of citation accumulation is one of the central questions in science of science (Fortunato et al., , 2018). The major challenge lies in delineating how the interplay between factors related to the quality and relevance of papers and factors related to author popularity contribute to the process of citation accumulation.
The first model of citation dynamics for papers was proposed by de Solla Price, (1976). It is based on the principle of cumulative advantage: the probability of a paper to be cited is proportional to the number of citations the paper already has, up to an additive constant. This principle leads to a broad distribution of citations: most papers have just a few citations, while a minority of top-cited papers accounts for a considerable fraction of all citations (de Solla Price, , 1965; Radicchi et al., , 2008; Thelwall, , 2016).
In network science (Newman, , 2010; Barabási et al., , 2016) the principle of cumulative advantage is called preferential attachment and it has been invoked to explain the broad degree distributions observed in many real networks (Barabási and Albert, , 1999). The phenomenon is also known as rich-get-richer or Matthew effect in the sociology of science, where certain psycho-social processes lead the community to give disproportionately large credit to individuals that already enjoy a high reputation (Merton, , 1968). These dynamics have been argued to lead to inequalities or stratification in science (Cole and Cole, , 1974; Zuckerman, , 1977; DiPrete and Eirich, , 2006) and the existence of star scientists (Moody, , 2004), though the process itself is not straightforward (Allison et al., , 1982).
In the simplest models of paper citation dynamics based on preferential attachment, every paper keeps accumulating citations forever, although at a slowing rate due to the increasing competition with newly published papers. It is well known, however, that most papers have a finite lifetime, so that most citations are accrued within the first few years after publication and the probability of being cited often dramatically decreases thereafter (Stringer et al., , 2008; Parolo et al., , 2015; Hajra and Sen, , 2005; Eom and Fortunato, , 2011; Wang et al., , 2013) — with some notable exceptions (Ke et al., , 2015). This reflects the obsolescence of knowledge, in that attention shifts from old findings to newer ones, which become the basis of future research. A related consequence is the recency effect, i.e., the fact that the probability of receiving new citations is somewhat dependent on the citations collected in recent times (Golosovsky and Solomon, , 2012; Wang et al., , 2008).
By including obsolescence and recency, as well as other ingredients, models can successfully describe the citation dynamics of papers (Eom and Fortunato, , 2011; Golosovsky and Solomon, , 2012), to the point that it is possible to predict the future citation trajectory of individual papers (Wang et al., , 2013).
Despite all these advances in our understanding of paper citation dynamics, author citation dynamics have received little attention in the literature. On the empirical side, this is mostly due to the challenges related to author name disambiguation (Ferreira et al., , 2012). On the theoretical side, in principle, our understanding of citation accumulation for papers could be leveraged to characterize and model the citation dynamics of authors: the citation count of an author, after all, is the sum of the citation counts of their papers. Nevertheless, models based on publication portfolios would involve many parameters and assumptions, including paper lifetimes, author productivity, and how productivity is related to author success and number of citations.
In this paper, we characterize and model the process of citation accumulation for authors. We focus on two quantitative signatures: the distributions of the number of citations and of the size of citation bursts. As it happens for papers (Eom and Fortunato, , 2011), both distributions are broad. The fact that the burst size distribution is heavy-tailed is incompatible with a dynamics driven by preferential attachment alone. We find that both distributions can be well described by a simple model whose sole driver is the number of recent citations.
2 Results
Our analysis is based on a data set of 577,870 papers published in 15 journals of the American Physical Society (APS, journals.aps.org/datasets), from 1893 until 2015 (see Table S1 in Supplementary Information).
When considering the list of authors of each paper in the dataset, a major hurdle is that author names can be ambiguous — multiple authors can have the same name and multiple names can be used by the same author. The recently created Microsoft Academic Graph (MAG) is a large publications database encompassing all scientific disciplines, which uses sophisticated machine learning algorithms to disambiguate author names (Sinha et al., , 2015). By mapping APS papers onto the MAG we were able to assign all papers to a set of by 732,965 disambiguated authors.
2.1 Author Citations
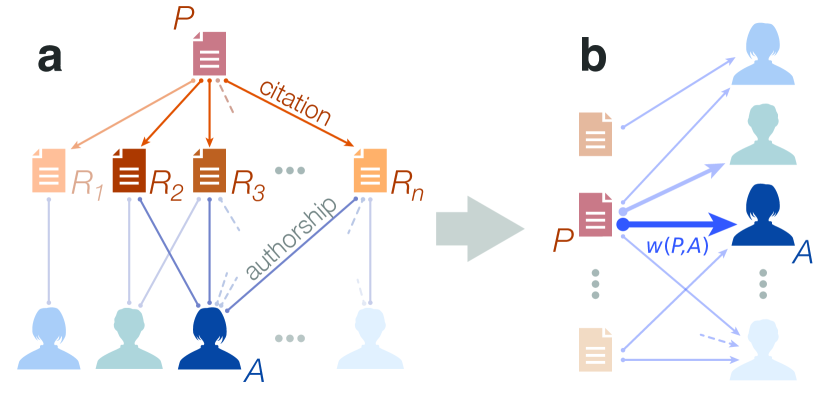
We use the APS data set to build a bipartite paper-author citation network (BPAN). For each citation from a paper to a paper , we set a direct link going from to each author of . The weight of each link corresponds to the number of articles coauthored by that are cited by . The number of citations of author is the sum of over all papers citing . Fig. 1 illustrates the process of generating a BPAN from the paper citation network.
We studied the evolution of the number of citations received by authors over a long time span, between 1930 and 2010. When we refer to a specific year we mean the set of all authors publishing papers from the beginning of the APS history (1893) along with all their mutual citations until year .
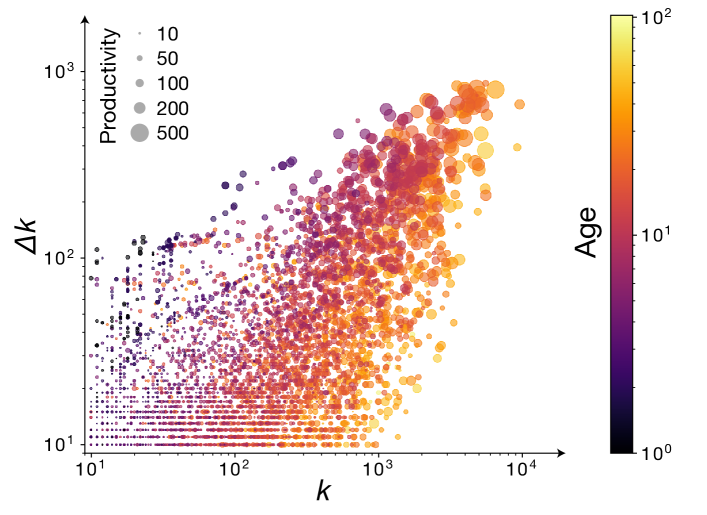
In Fig. 2 we show the relation between the number of citations received by an author in 2010 and the number of citations received in all previous years. The diagram shows that author citation dynamics are bursty: the increment can vary by orders of magnitude among authors having the same total number of citations. We observe a clear correlation between and but also a large dispersion. Large values of tend to be associated to authors with higher career age and productivity, but they are not unusual among early-career scholars. Such a bursty character of author citation dynamics is the main focus of this paper.
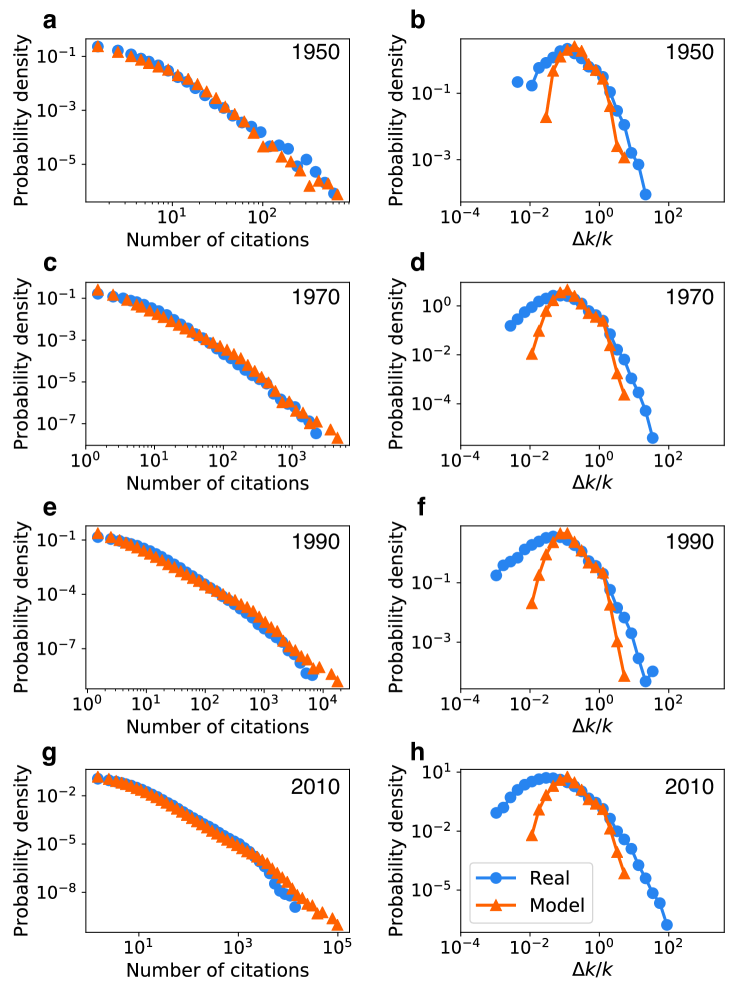
Let us consider the distributions of two variables. The first variable is the number of citations of an author. In Fig. 3(a,c,e,g) we see that the distribution is broad, as expected: most authors are poorly cited, whereas a few receive many citations. The second variable is the citation burst size, which is computed as follows. Given some reference year , for each author we compute the number of their citations until years and , which we indicate as and . The burst size at year is then defined as the ratio between the number of citations collected in year and the number of citations until the year before:
| (1) |
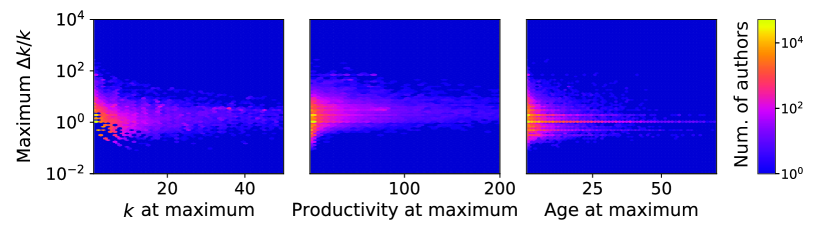
The distribution of citation burst sizes is shown in Fig. 3(b,d,f,h). This distribution is broad as well, as already observed in paper citation dynamics (Eom and Fortunato, , 2011). With very low probability, authors may receive in a single year up to 100 times the number of citations they received in their entire career up to the beginning of that year. This is the same trend observed at the paper level (Eom and Fortunato, , 2011) and also in the dynamics of popularity (Ratkiewicz et al., , 2010). While the largest bursts occur more often in the initial phase of a scholar’s career, when the number of papers and the corresponding citation counts are relatively low, large bursts can also occur at later times (Fig. 4).
Abrupt increments in the number of citations might signal a sudden increase in the productivity of the author, the beginning of a “hot streak” with the publication of papers of significantly higher impact than earlier output (Liu et al., , 2018), or a “sleeping beauty” paper that starts receiving a lot of credit from the author’s peers (Ke et al., , 2015). The shapes of the burst size distributions are robust across the years and, as such, deserve a general explanation.
2.2 Model Implementation
Our model of author evolution starts in a reference year and consider the following one-month periods until a final year . For each month, we add new papers published in that month and their authors, together with their citations to existing authors. We track the number of citations received by each author in each month .
For each paper published in a given month , we consider all authors of . New authors are added to the system. The number of authors cited by includes multiple citations to the same author that originate from distinct references. We add citations from to existing authors according to some rule specific to the particular model.
At each stage of the evolution, the model system has the same number of authors and total number of citations as the actual system. We measure empirical distributions of citations and burstiness for each year. We would like to explain the shapes of the empirical distribution by reproducing them via simple citation rules.
2.3 Preferential Attachment
First, we consider a simple preferential attachment rule. The probability that author receives a citation in an interval of time starting at depends linearly on the number of citations they have received until that time:
| (2) |
The constant attributes a non-zero probability to receive citations to authors that have received none so far. Eq. 2 defines Price’s model of citation dynamics (de Solla Price, , 1976). In Fig. 3 we compare the empirical distributions with those produced by this model (see Methods). The model uses , a value that was chosen by fitting the distribution of the number of citations. The model reproduces the profiles of the citation distributions, which exhibit progressively broader support the longer the simulation runs. For 2010 the model curve stretches one order of magnitude further than the empirical curve. This is because the model ignores any factor related to obsolescence: authors never stop receiving citations according to preferential attachment and their total can become arbitrarily large if one waits sufficiently long.
The burst size distribution generated by the model is much narrower than the empirical one. According to preferential attachment (Eq. 2), the increment in the number of citations of an author in a given (small) time window should be approximately proportional to the number of citations collected before, so the ratio should be roughly constant. In fact, the bell-shaped model distribution for the burst size represents random Poissonian fluctuations about the mean. The discrepancy between model and data becomes more pronounced the longer the dynamics run. It is thus apparent that preferential attachment alone cannot account for the bursty citation dynamics we observe for authors, as already seen for papers (Eom and Fortunato, , 2011).
2.4 Recency
The success of an author is the success of their papers. Papers have a finite lifetime (Stringer et al., , 2008; Parolo et al., , 2015; Hajra and Sen, , 2005; Eom and Fortunato, , 2011; Wang et al., , 2013) and collect a significant fraction of all their citations in a limited interval of time, although rare exceptions of evergreen papers exist (Zhang et al., , 2017).
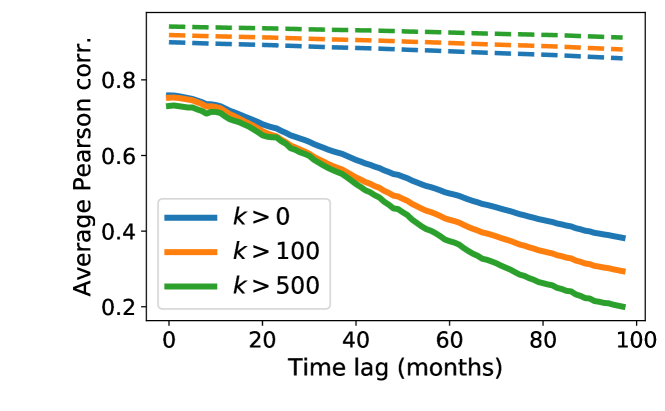
In most cases, the number of citations collected by a paper in a given interval varies smoothly over time, so there is a sizeable correlation between the number of citations in nearby intervals (Golosovsky and Solomon, , 2012; Wang et al., , 2008). Such recency effect occurs for authors as well. One can only speculate on the reasons behind this. For example, according to Liu et al., (2018), this could be due to hot streaks, the ability to produce papers with sustained impact within short periods of time. It is therefore plausible to assume recency because of the inertia in the citation increments of individual papers and because impactful papers are likely to appear in sequence. In Fig. 5 we show the correlation between the numbers of monthly citations received by an author months apart. We see that the correlation is important and slowly decreases with . For highly cited authors the correlation decreases faster. We conclude that recency plays an important role in author citation dynamics.
2.5 Recency Model
We test a rule originally introduced by Wang et al., (2008), which, although inspired by preferential attachment, gives more weight to citations received recently in the determination of the probability to receive new citations in the future. The probability that author receives a new citation at time is proportional to
| (3) |
where is an additive constant and is the number of citations that has accrued in the previous months. The model has thus two parameters: and .
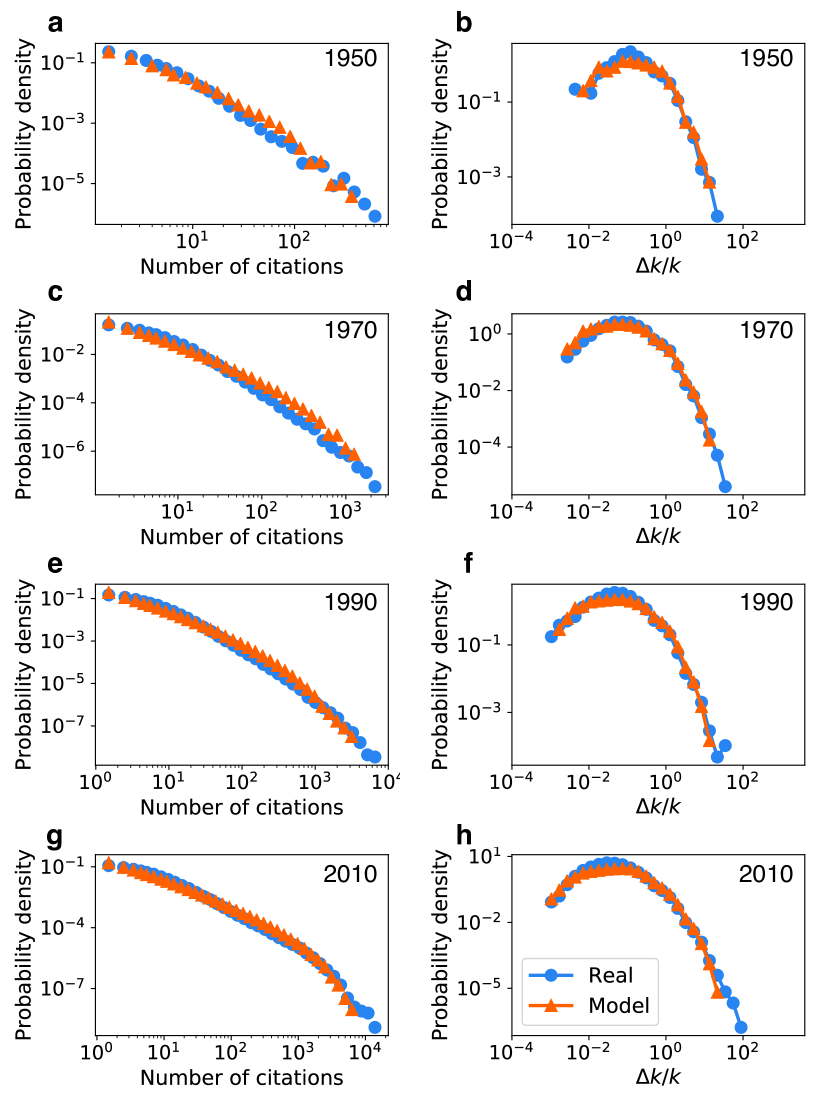
Fig. 6 compares the empirical distributions of Fig. 3 with those obtained from the recency model, with best-fit values for the parameters and . We see that the recency model describes both distributions well throughout the period (1950–2010). In Supplementary Information (Fig. S1) we show the comparison between model and data when the dynamics start from the actual configuration of APS authors as of 1970, with all actual citations each author collected until then.
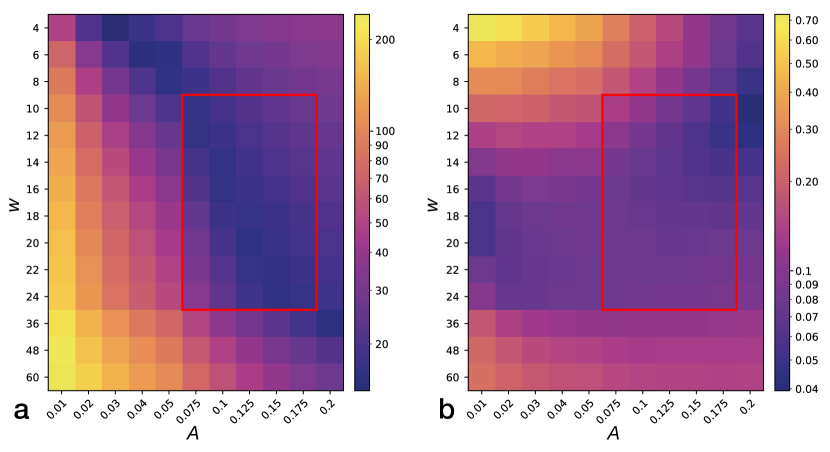
In Fig. 7 we show the goodness of fit of both distributions for different parameter choices, using the Wasserstein distance. The parameter ranges leading to the best fits is highlighted. Remarkably, all model curves shown in Fig. 6 correspond to the same pair of values of the parameters: and . But values of ranging from 12 to 24 months lead to fits of comparable quality. Therefore, we conclude that the number of citations accrued by an author in the last one-two years is an important driver of the dynamics. In fact, this ingredient alone is capable of providing a good description of both citation and burst size distributions for 80 years of APS author citation evolution.
3 Discussion
We have studied the evolution of the citation dynamics of APS authors. As observed for papers, the citation distribution is broad and the dynamics are bursty, in that the number of citations collected by an author in a given interval can have sharp fluctuations. Also, we find a strong correlation between the numbers of citations accrued in nearby time intervals, confirming that recency is an important factor in the dynamics. Indeed, a model based on recency alone suffices to account for both the citation distribution and the burstiness of the dynamics, over eight decades of evolution. The best match between the model and empirical curves suggests that the key driver is the number of citations received by an author over the last 12–24 months. We could thus claim that an author is as “hot” as they have been in the last one-two years.
We stress that our work focuses on the outcomes of the dynamics at the author population level. Moving to the more ambitious goal of describing and even predicting citation trajectories for individual authors remains an open challenge that will likely require the introduction of additional ingredients into the model (Liu et al., , 2018).
Acknowledgments.
We thank Xiaoran Yan for precious assistance with author disambiguation. This work uses publication data from the American Physical Society and Microsoft Academic Graph data by Microsoft Research provided by the Indiana University Network Science Institute. We gratefully acknowledge support from the US Navy (award N00174-17-1-0007), US AFOSR (Minerva awards FA9550-19-1-0391 and FA9550-19-1-0354), FAPESP (grants 2015/08003-4, 2017/09280-7 and 2017/13464-6), and CNPq-Brazil (grant 304026/2018-2).
References
- Allison et al., (1982) Allison, P. D., Long, J. S., and Krauze, T. K. (1982). Cumulative advantage and inequality in science. American Sociological Review, pages 615–625.
- Barabási and Albert, (1999) Barabási, A.-L. and Albert, R. (1999). Emergence of scaling in random networks. Science, 286:509–512.
- Barabási et al., (2016) Barabási, A.-L. et al. (2016). Network Science. Cambridge University Press.
- Cole and Cole, (1974) Cole, J. R. and Cole, S. (1974). Social stratification in science. The University of Chicago Press.
- de Solla Price, (1965) de Solla Price, D. J. (1965). Networks of scientific papers. Science, 169:510–515.
- de Solla Price, (1976) de Solla Price, D. J. (1976). A general theory of bibliometric and other cumulative advantage processes. J. Am. Soc. Inform. Sci., 27(5):292–306.
- DiPrete and Eirich, (2006) DiPrete, T. A. and Eirich, G. M. (2006). Cumulative advantage as a mechanism for inequality: A review of theoretical and empirical developments. Annu. Rev. Sociol., 32:271–297.
- Eom and Fortunato, (2011) Eom, Y.-H. and Fortunato, S. (2011). Characterizing and modeling citation dynamics. PLOS ONE, 6(9):e24926.
- Ferreira et al., (2012) Ferreira, A. A., Gonçalves, M. A., and Laender, A. H. (2012). A brief survey of automatic methods for author name disambiguation. SIGMOD Rec., 41(2):15–26.
- Fortunato et al., (2018) Fortunato, S., Bergstrom, C. T., Börner, K., Evans, J. A., Helbing, D., Milojević, S., Petersen, A. M., Radicchi, F., Sinatra, R., Uzzi, B., et al. (2018). Science of science. Science, 359(6379):eaao0185.
- Golosovsky and Solomon, (2012) Golosovsky, M. and Solomon, S. (2012). Stochastic dynamical model of a growing citation network based on a self-exciting point process. Physical Review Letters, 109(9):098701.
- Hajra and Sen, (2005) Hajra, K. B. and Sen, P. (2005). Aging in citation networks. Physica A: Statistical Mechanics and its Applications, 346(1-2):44–48.
- Ke et al., (2015) Ke, Q., Ferrara, E., Radicchi, F., and Flammini, A. (2015). Defining and identifying sleeping beauties in science. Proceedings of the National Academy of Sciences, 112(24):7426–7431.
- Leydesdorff et al., (2016) Leydesdorff, L., Bornmann, L., Comins, J. A., and Milojević, S. (2016). Citations: Indicators of quality? the impact fallacy. Frontiers in Research Metrics and Analytics, 1:1.
- Liu et al., (2018) Liu, L., Wang, Y., Sinatra, R., Giles, C. L., Song, C., and Wang, D. (2018). Hot streaks in artistic, cultural, and scientific careers. Nature, 559(7714):396.
- Martin and Irvine, (1983) Martin, B. R. and Irvine, J. (1983). Assessing basic research: some partial indicators of scientific progress in radio astronomy. Research policy, 12(2):61–90.
- Merton, (1968) Merton, R. K. (1968). The Matthew Effect in Science. Science, 159:56–63.
- Moody, (2004) Moody, J. (2004). The structure of a social science collaboration network: Disciplinary cohesion from 1963 to 1999. American sociological review, 69(2):213–238.
- Newman, (2010) Newman, M. (2010). Networks: An Introduction. Oxford University Press, Inc., New York, NY, USA.
- Parolo et al., (2015) Parolo, P. D. B., Pan, R. K., Ghosh, R., Huberman, B. A., Kaski, K., and Fortunato, S. (2015). Attention decay in science. Journal of Informetrics, 9(4):734–745.
- Radicchi et al., (2008) Radicchi, F., Fortunato, S., and Castellano, C. (2008). Universality of citation distributions: Toward an objective measure of scientific impact. Proceedings of the National Academy of Sciences, 105(45):17268–17272.
- Ratkiewicz et al., (2010) Ratkiewicz, J., Fortunato, S., Flammini, A., Menczer, F., and Vespignani, A. (2010). Characterizing and modeling the dynamics of online popularity. Physical Review Letters, 105(15):158701.
- Sinha et al., (2015) Sinha, A., Shen, Z., Song, Y., Ma, H., Eide, D., Hsu, B.-j. P., and Wang, K. (2015). An overview of microsoft academic service (mas) and applications. In Proceedings of the 24th international conference on world wide web, pages 243–246. ACM.
- Stringer et al., (2008) Stringer, M. J., Sales-Pardo, M., and Amaral, L. A. N. (2008). Effectiveness of journal ranking schemes as a tool for locating information. PLOS ONE, 3(2):e1683.
- Thelwall, (2016) Thelwall, M. (2016). The discretised lognormal and hooked power law distributions for complete citation data: Best options for modelling and regression. Journal of Informetrics, 10(2):336–346.
- Waltman, (2016) Waltman, L. (2016). A review of the literature on citation impact indicators. Journal of Informetrics, 10(2):365 – 391.
- Wang et al., (2013) Wang, D., Song, C., and Barabási, A.-L. (2013). Quantifying long-term scientific impact. Science, 342(6154):127–132.
- Wang et al., (2008) Wang, M., Yu, G., and Yu, D. (2008). Measuring the preferential attachment mechanism in citation networks. Physica A: Statistical Mechanics and its Applications, 387(18):4692–4698.
- Zhang et al., (2017) Zhang, R., Wang, J., and Mei, Y. (2017). Search for evergreens in science: A functional data analysis. Journal of Informetrics, 11(3):629 – 644.
- Zuckerman, (1977) Zuckerman, H. (1977). Scientific elite: Nobel laureates in the United States. Transaction Publishers.