Magnetic and electronic phase transitions probed by nanomechanical resonance
Abstract
Two-dimensional (2D) materials enable new types of magnetic and electronic phases mediated by their reduced dimensionality like magic-angle induced phase transitions Cao2018 ; Sharpe2019 , 2D Ising antiferromagnets Lee2016 and ferromagnetism in 2D atomic layers Huang2017 ; Gong2017 and heterostructures Gibertini2019 . However, only a few methods are available to study these phase transitions Lee2016 ; McGuire2015 ; Huang2017 ; Novoselov2016 ; Gibertini2019 , which for example is particularly challenging for antiferromagnetic materials Gibertini2019 . Here, we demonstrate that these phases can be probed by the mechanical motion: the temperature dependent resonance frequency and quality factor of multilayer 2D material membranes show clear anomalies near the phase transition temperature, which are correlated to anomalies in the specific heat of the materials. The observed coupling of mechanical degrees of freedom to magnetic and electronic order is attributed to thermodynamic relations that are not restricted to van der Waals materials. Nanomechanical resonators, therefore, offer the potential to characterize phase transitions in a wide variety of materials, including those that are antiferromagnetic, insulating or so thin that conventional bulk characterization methods become unsuitable.
A universal method to characterize phase transitions in bulk crystals is via anomalies in the specific heat, that are present at the transition temperature according to Landau’s theory Landau1984 . However, specific heat is difficult to measure in thin micron-sized samples with a mass of less than a picogram Morell2019 ; Dolleman2018 . Although coupling between mechanical and electronic/magnetic degrees of freedom might not seem obvious, the intuitive picture behind this coupling is that changes in the electronic/magnetic order and entropy in a material are reflected in its specific heat, which in turn results in variations in the thermal expansion coefficient that affect the tension and resonance frequency. As the specific heat near a phase transition is expected to exhibit a discontinuity Landau1984 , the temperature dependent resonance frequency of a suspended membrane can thus be used to probe this transition. Here, we use nanomechanical motion to investigate magnetic order in membranes of semiconducting FePS3, NiPS3 and insulating MnPS3 - antiferromagnetic members of the transition-metal phosphor trisulphides (MPS3) Joy1992 , and subsequently discuss results on metallic 2H-TaS2, which exhibits a transition to a charge density wave state AbdelHafiez2016 .
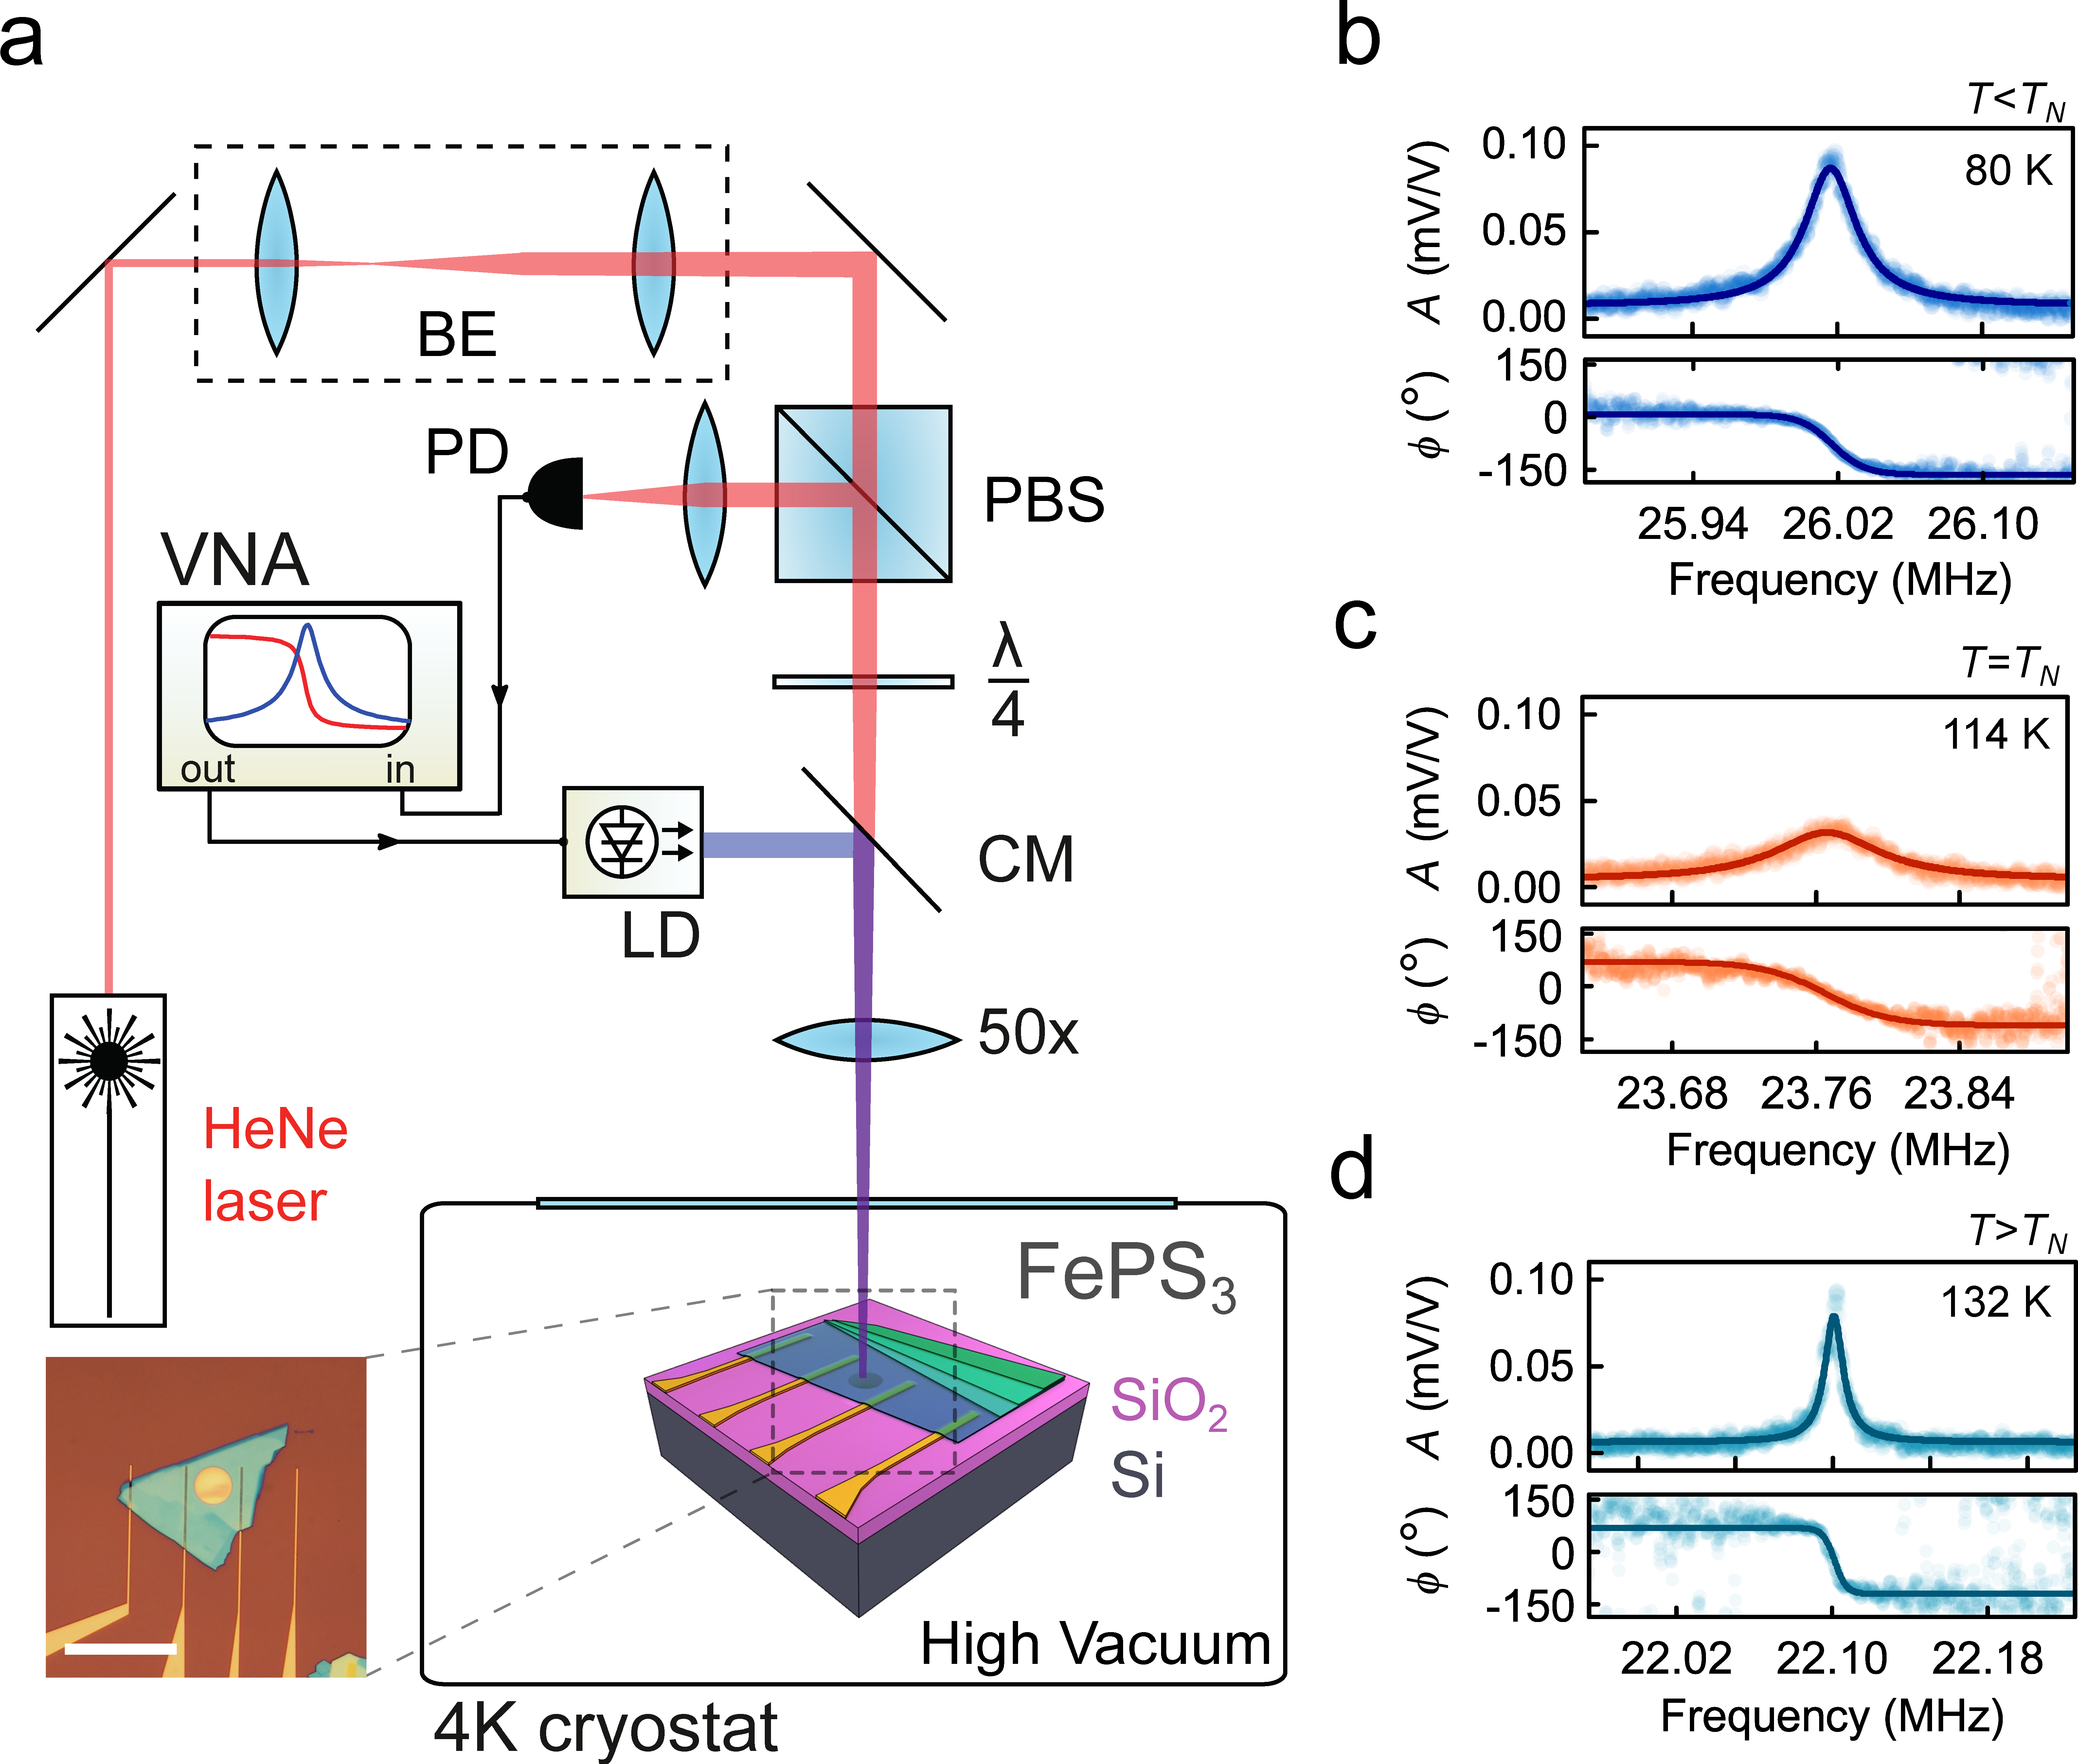
FePS3 is an Ising-type antiferromagnet with a Nèel temperature in bulk in the range of K Lee2016 ; Joy1992 ; Takano2004 , exhibiting a distinct feature in its specific heat near Takano2004 . Ionic layers in FePS3 are stacked in van der Waals planes, that can be exfoliated to thin the crystal down with atomic precision Lee2016 . Using mechanical exfoliation and all-dry viscoelastic stamping CastellanosGomez2014 , we transfer thin flakes of FePS3 over circular cavities etched in an oxidised Si wafer, to form membranes (see the inset in Fig. 1a). Suspended FePS3 devices with thicknesses ranging from to nm are placed in a cryostat and cooled down to a temperature of K. The resonance frequency of the nanodrums is then characterized using a laser interferometry technique CastellanosGomez2013 (see Fig. 1a and Methods).
The resonance frequency of the fundamental membrane mode, , is measured in the temperature range from to K. Typical resonances are shown in Fig. 1b-d in the antiferromagnetic phase ( K), near the transition ( K) and in the paramagnetic phase ( K), respectively. Figure 2a shows of the same FePS3 membrane (solid blue curve). Near the phase transition, significant changes in amplitude, resonance frequency and quality factor are observed.
To analyze the data further, we first analyze the relation between and the specific heat. The decrease in resonance frequency with increasing temperature in Fig. 2a is indicative of a reduction in strain due to thermal expansion of the membrane. The observed changes can be understood by considering the resonance frequency of a bi-axially tensile strained circular membrane:
| (1) |
where is the Young’s modulus of the material, its Poisson’s ratio, its mass density, the strain and the temperature. The linear thermal expansion coefficient of the membrane, , and silicon substrate, , are related to the strain in the membrane Morell2016 ; Singh2010 as , using the approximation (see Supplementary Section 1). By combining the given expression for with equation (1) and by using the thermodynamic relation Sanditov2011 between and the specific heat (molar heat capacity) at constant volume, , we obtain:
| (2) |
Here, is the bulk modulus, the Grüneisen parameter, the molar volume of the membrane and , that are assumed to be only weakly temperature dependent. The small effect of non-constant volume () on is neglected.
We use the equation (2) to analyze and compare it to the calculated specific heat for FePS3 from literature Takano2004 . In doing so, we estimate the Grüneisen parameter following the BelomestnykhTesleva relation Belomestnykh2004 ; Sanditov2011 . This is an approximation to Leont’ev’s formula Leontiev1981 , which is a good estimation of for bulk isotropic crystalline solids within of uncertainty Sanditov2011 . Furthermore, we use literature values for the elastic parameters of FePS3 as obtained from first-principles theoretical calculations Hashemi2017 to derive GPa, and kg/m3 (see Supplementary Section 2).
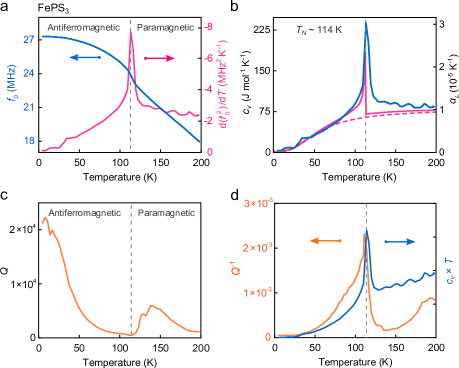
In Fig. 2a, the steepest part of the negative slope of (solid blue curve) leads to a large peak in (solid magenta curve) near K, the temperature which we define as and indicate by the vertical dashed lines. In Fig. 2b the specific heat curve of FePS3 (blue solid line) as estimated from the data in Fig. 2a and equation (2) is displayed. The results are compared to a theoretical model for the specific heat of FePS3 (magenta solid line in Fig. 2b), which is the sum of a phononic contribution from the Debye model (magenta dashed line) and a magnetic contribution as calculated by Takano, et al. Takano2004 . It is noted that other, e.g. electronic contributions to are small and can be neglected in this comparison, as is supported by experiments on the specific heat in bulk FePS3 crystals Takano2004 . The close correspondence in Fig. 2b between the experimental and theoretical data for supports the applicability of equation (2). It also indicates that changes in the Young’s modulus near the phase transition, that can be of the order of a couple of percent Barmatz1975 , are insignificant and that it is the anomaly in of FePS3 which produces the observed changes in resonance frequency and the large peak in visible in Fig. 2a.
The abrupt change in of the membrane can be understood from Landau’s theory of phase transitions Landau1984 . To illustrate this, we consider a simplified model for an antiferromagnetic system, like FePS3, with free energy, , which includes a strain-dependent magnetostriction contribution (see Supplementary Section 3). Near the transition temperature and in the absence of a magnetic field it holds that:
| (3) |
Here, and are phenomenological positive constants, is the order parameter in the out-of-plane direction and , a strain-dependent parameter with a material-dependent tensor, that includes the strain and distance dependent magnetic exchange interactions between neighbouring magnetic moments. By minimizing equation (3) with respect to , the equilibrium free energy, , and order parameter are obtained (see Supplementary Section 3). Two important observations can be made. Firstly, strain shifts the transition temperature according to:
| (4) |
where is the Neél temperature, below which free energy minima with finite order () appear. Secondly, since close to the transition the specific heat follows , this general model predicts a discontinuity in of magnitude at the transition temperature , in accordance with the experimental jump in and observed in Fig. 2a and b.
We now analyze the quality factor data shown in Fig. 2c,d. Just above , the quality factor of the resonance (Fig. 2c) shows a significant increase as the temperature is increased from to K. The observed minimum in the quality factor near the phase transition, suggests that dissipation in the material is linked to the thermodynamics and can be related to thermoelastic damping. We model the thermoelastic damping according to Zener Zener1937 and Lifshitz-Roukes Lifshitz2000 that report dissipation of the form , where is the thermomechanical term (see Supplementary Section 4). Since we have obtained an estimate of from the resonance frequency analysis (Fig. 2b), we use this relation to compare the experimental dissipation (orange solid line) to a curve proportional to (blue solid line) in Fig. 2d. Both the measured dissipation and the thermoelastic term display a peak near K. The close qualitative correspondence between the two quantities is an indication that the thermoelastic damping related term indeed can account for the temperature dependence of near the phase transition. We note that the temperature dependent dissipation in thin membranes is still not well understood, and that more intricate effects might play a role in the observed temperature dependence.
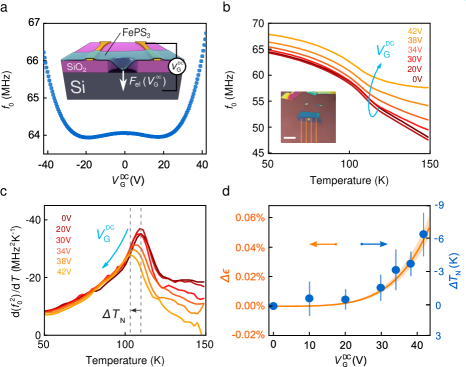
Equation (4) predicts that the transition temperature is strain-dependent due to the distance dependent interaction coefficient between magnetic moments. To verify this effect, we use an nm thin sample of FePS3 suspended over a cavity of m in diameter. A gate voltage is applied between the flake and the doped bottom Si substrate to introduce an electrostatic force that pulls the membrane down and thus strains it (see Supplementary Section 5). As shown in Fig. 3a, the resonance frequency of the membrane follows a W-shaped curve as a function of gate voltage. This is due to two counteracting effects Lee2018 : at small gate voltages capacitive softening of the membrane occurs, while at higher voltages the membrane tension increases due to the applied electrostatic force, which causes the resonance frequency to increase.
Figure 3b shows for six different gate voltages. The shift of the point of steepest slope of with increasing is well visible in Fig. 3b and even more clear in Fig. 3c, where the peak in shifts K downward by electrostatic force induced strain. The observed reduction in as determined by the peak position in qualitatively agrees with the presented model and its strain dependence from equation (4), as shown in Fig. 3d indicative of a reduced coupling of magnetic moments with increasing distance between them due to tensile strain.
Since the coupling between specific heat and the order parameter in materials is of a general thermodynamic nature, the presented methodology is applicable to a wide variety of materials provided that elastic properties of the material and Grüneisen parameter are weakly temperature dependent, the substrate satisfies the condition and that the frequency shifts and changes in are large enough to be resolved. We further demonstrate the method by detecting magnetic phase transitions in NiPS3 and MnPS3. Compared to FePS3, the effect of the phase transitions in MnPS3 and NiPS3 on the resonances is more gradual (see Supplementary Section 2) with both materials showing broader maxima in near their at K and K, respectively, which is consistent with measurements of bulk crystals Takano2004 ; Joy1992 .
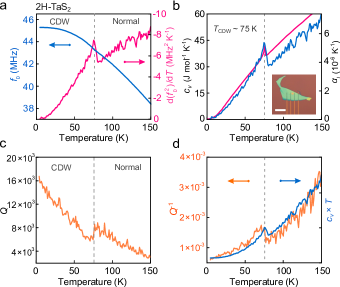
In order to demonstrate the detection of an electronic phase transition, we now discuss results for 2H-TaS2 that in bulk exhibits a charge density wave (CDW) transition at K AbdelHafiez2016 . Figure 4a shows a transition-related anomaly in both (solid blue line) and the temperature derivative of (solid magenta line) that peaks at K. We convert to the corresponding using the same approach as discussed before (see Supplementary Section 6). Figure 4b shows a downward step in the specific heat at K (solid blue line), indicative of a phase transition from the CDW to the disordered high-temperature state Landau1984 ; SaintPaul2019 with a close quantitative correspondence to measured in a bulk crystal AbdelHafiez2016 (drawn magenta line). This anomaly occurs near the electrically determined phase transition temperature of K on the same flake (see Supplementary Section 6) and is also consistent with the CDW transition temperature previously reported in 2H-TaS2 AbdelHafiez2016 . The Q-factor also shows a local minimum with a drop next to the transition temperature (see Fig. 4c). As discussed before Zener1937 ; Lifshitz2000 , is expected to follow the same trend as . Both quantities are displayed in Fig. 4d and indeed show a good qualitative correspondence.
In conclusion, we have demonstrated a method for identifying phase transitions in ultrathin membranes of 2D materials via their mechanical resonance. An analytical equation for the relation between the specific heat of the material and the temperature dependent resonance frequency is derived and shown to be in good agreement with experimental results. The presented methodology thus shows that mechanical motion of suspended membranes can be used to probe magnetic and electronic order in membranes. Since the materials are characterised in a suspended state, substrate effects on the electronic and magnetic properties of the thin materials are excluded. The technique is particularly appealing for the characterisation of ultrathin membranes of antiferromagnetic and insulating materials that are difficult to characterize otherwise. It is anticipated that it can be applied to a large range of van der Waals materials Novoselov2016 ; Gibertini2019 , thin 2D complex oxide sheets Ji2019 ; davidovikj2019ultrathin and organic antiferromagnets LpezCabrelles2018 , contributing to a better understanding of fundamental models of magnetism and other ordering mechanisms in two dimensions.
Methods
Sample fabrication
To realize electrical contact to the samples for electrostatic experiments, Ti/Au electrodes are pre-patterned by a lift-off technique. Cavities are defined by reactive ion etching of circular holes with a diameter of m in oxidized doped silicon wafers with an SiO2 thickness of nm. Flakes of van der Waals crystals are exfoliated from high quality synthetically grown crystals with known stoichiometry (see Supplementary Section 7). All flakes are transferred on a pre-patterned chip by an all-dry viscoelastic stamping directly after exfoliation. Subsequently, samples are kept in an oxygen free environment to avoid degradation.
Controlled measurement environment
The samples are mounted on a piezo-based nanopositioning stage inside a chamber of a closed-cycle cryostat with optical access. A closed feedback loop controlled local sample heater is used to perform temperature sweeps at a rate of K/min, while keeping the pressure in the chamber below 10-6 mbar. During the data acquisition temperature is kept constant with mK stability.
Laser interferometry
A blue diode laser ( nm), which is power-modulated by a Vector Network Analyzer (VNA), is used to excite the membrane and optothermally drive it into motion. Displacements are detected by focusing a red He-Ne laser beam ( nm) on the cavity formed by the membrane and Si substrate. The reflected light, which is modulated by the position-dependent membrane motion, is recorded by a photodiode and processed by a phase-sensitive VNA. All measurements are performed at incident laser powers of W and W. It is checked for all membranes that the resonance frequency changes due to laser heating are insignificant. Laser spot size is on the order of m. The uncertainty in measured transition temperatures is estimated from determining the peak position in within accuracy in the measured maximum.
Atomic Force Microscopy
AFM inspections to determine sample thickness are performed in tapping mode on a Bruker Dimension FastScan AFM. We use cantilevers with spring constants of N/m. Error bars on reported thickness values are determined by measuring three to five profile scans of the same flake.
Acknowledgements.
M.Š., M.L., H.S.J.v.d.Z. and P.G.S. acknowledge funding from the European Union’s Horizon research and innovation program under grant agreement number . H.S.J.v.d.Z., E.C. and S.M.-V. thank COST Action MOLSPIN CA; E.C. and S.M.-V. thank ERC AdG Mol-2D , the Spanish MINECO (Project MAT--R co-financed by FEDER and the Unit of Excellence “Maria de Maeztu” MDM--) and the Generalitat Valenciana (Prometeo Programme).Author contributions
M.Š., M.L., E.C., H.S.J.v.d.Z. and P.G.S. conceived the experiments. M.Š. performed the laser interferometry measurements. M.L. fabricated and inspected the samples. S.M.-V. and E.C. synthesized and characterized the FePS3, MnPS3, NiPS3 and 2H-TaS2 crystals. M.Š., Y.M.B., and P.G.S. analysed and modeled the experimental data. H.S.J.v.d.Z. and P.G.S. supervised the project. The manuscript was jointly written by all authors with a main contribution from M.Š. All authors discussed the results and commented on the manuscript.
References
- (1) Cao, Y. et al. Unconventional superconductivity in magic-angle graphene superlattices. Nature 556, 43–50 (2018).
- (2) Sharpe, A. L. et al. Emergent ferromagnetism near three-quarters filling in twisted bilayer graphene. Science 365, 605–608 (2019).
- (3) Lee, J.-U. et al. Ising-type magnetic ordering in atomically thin FePS3. Nano Lett. 16, 7433–7438 (2016).
- (4) Huang, B. et al. Layer-dependent ferromagnetism in a van der Waals crystal down to the monolayer limit. Nature 546, 270–273 (2017).
- (5) Gong, C. et al. Discovery of intrinsic ferromagnetism in two-dimensional van der Waals crystals. Nature 546, 265–269 (2017).
- (6) Gibertini, M., Koperski, M., Morpurgo, A. F. & Novoselov, K. S. Magnetic 2D materials and heterostructures. Nat. Nanotechnol. 14, 408–419 (2019).
- (7) McGuire, M. A., Dixit, H., Cooper, V. R. & Sales, B. C. Coupling of crystal structure and magnetism in the layered, ferromagnetic insulator CrI3. Chem. Mater. 27, 612–620 (2015).
- (8) Novoselov, K. S., Mishchenko, A., Carvalho, A. & Neto, A. H. C. 2D materials and van der Waals heterostructures. Science 353, aac9439 (2016).
- (9) Landau, L. D., Pitaevskii, L. P. & Lifshitz, E. M. Electrodynamics of continuous media, vol. 8 (Butterworth, New York, 1984), 2 edn.
- (10) Morell, N. et al. Optomechanical measurement of thermal transport in two-dimensional MoSe2 lattices. Nano Lett. 19, 3143–3150 (2019).
- (11) Dolleman, R. J. et al. Transient thermal characterization of suspended monolayer MoS2. Phys. Rev. Mater. 2, 114008 (2018).
- (12) Joy, P. A. & Vasudevan, S. Magnetism in the layered transition-metal thiophosphates MPS3 (M=Mn, Fe, and Ni). Phys. Rev. B 46, 5425–5433 (1992).
- (13) Abdel-Hafiez, M. et al. Enhancement of superconductivity under pressure and the magnetic phase diagram of tantalum disulfide single crystals. Sci. Rep. 6 (2016).
- (14) Takano, Y. et al. Magnetic properties and specific heat of MPS3 (M=Mn, Fe, Zn). J. Magn. Magn. Mat. 272-276, E593–E595 (2004).
- (15) Castellanos-Gomez, A. et al. Deterministic transfer of two-dimensional materials by all-dry viscoelastic stamping. 2D Mater. 1, 011002 (2014).
- (16) Castellanos-Gomez, A. et al. Single-layer MoS2 mechanical resonators. Adv. Mater. 25, 6719–6723 (2013).
- (17) Morell, N. et al. High quality factor mechanical resonators based on WSe2 monolayers. Nano Lett. 16, 5102–5108 (2016).
- (18) Singh, V. et al. Probing thermal expansion of graphene and modal dispersion at low-temperature using graphene nanoelectromechanical systems resonators. Nanotechnology 21, 165204 (2010).
- (19) Sanditov, D. S. & Belomestnykh, V. N. Relation between the parameters of the elasticity theory and averaged bulk modulus of solids. Tech. Phys. 56, 1619–1623 (2011).
- (20) Belomestnykh, V. N. & Tesleva, E. P. Interrelation between anharmonicity and lateral strain in quasi-isotropic polycrystalline solids. Tech. Phys. 49, 1098–1100 (2004).
- (21) Leont’ev, K. On connection between elastic and thermal properties of substances. Akusticheskij Zhurnal 27, 554–561 (1981).
- (22) Hashemi, A., Komsa, H.-P., Puska, M. & Krasheninnikov, A. V. Vibrational properties of metal phosphorus trichalcogenides from first-principles calculations. J. Phys. Chem. C 121, 27207–27217 (2017).
- (23) Zener, C. Internal friction in solids I. Theory of internal friction in reeds. Phys. Rev. 52, 230–235 (1937).
- (24) Lifshitz, R. & Roukes, M. L. Thermoelastic damping in micro- and nanomechanical systems. Phys. Rev. B 61, 5600–5609 (2000).
- (25) Barmatz, M., Testardi, L. R. & Salvo, F. J. D. Elasticity measurements in the layered dichalcogenides TaSe2 and NbSe2. Phys. Rev. B 12, 4367–4376 (1975).
- (26) Lee, J. et al. Electrically tunable single- and few-layer MoS2 nanoelectromechanical systems with broad dynamic range. Sci. Adv. 4, eaao6653 (2018).
- (27) Saint-Paul, M. & Monceau, P. Survey of the thermodynamic properties of the charge density wave systems. Adv. Condens. Matter Phys. 2019, 1–14 (2019).
- (28) Ji, D. et al. Freestanding crystalline oxide perovskites down to the monolayer limit. Nature 570, 87–90 (2019).
- (29) Davidovikj, D. et al. Ultrathin complex oxide nanomechanical resonators (2019). Preprint at https://arxiv.org/abs/1905.00056v1.
- (30) López-Cabrelles, J. et al. Isoreticular two-dimensional magnetic coordination polymers prepared through pre-synthetic ligand functionalization. Nat. Chem. 10, 1001–1007 (2018).