Strong excess Faraday rotation on the inside of the Sagittarius spiral arm
Abstract
We present first results for Faraday rotation of compact polarized sources (1 to 2 GHz continuum) in The HI/OH/Recombination line (THOR) survey of the inner Galaxy. In the Galactic longitude range , we find rotation measures in the range , with the highest values concentrated within a degree of at the Sagittarius arm tangent. Most of the high s arise in diffuse plasma, along lines of sight that do not intersect H II regions. For , drops off rapidly, while at , the mean is higher with a larger standard deviation than at . We attribute the structure to the compressed diffuse Warm Ionized Medium in the spiral arm, upstream of the major star formation regions. The Sagittarius arm acts as a significant Faraday screen inside the Galaxy. This has implications for models of the Galactic magnetic field and the expected amount of Faraday rotation of Fast Radio Bursts from their host galaxies. We emphasize the importance of sensitivity to high Faraday depth in future polarization surveys.
=5
1 Introduction
Magnetic fields play an important role in the physics of the interstellar medium on a wide range of scales (e.g. Beck, 2015). Plasma ejected by stellar winds and supernova explosions expands into the surrounding magnetized interstellar medium to form magnetized super bubbles (e.g. Ferrière et al., 1991; Tomisaka, 1998; Stil et al., 2009), driving a complex feedback cycle between star formation and the magnetic field. The strength and structure of the magnetic field are important for understanding its origin and effect on the interstellar medium (Klessen & Glover, 2016). On a Galactic scale the magnetic field is best observed through Faraday rotation of radio waves, by which the polarization angle of a linearly polarized source changes with wavelength, , according to . The Faraday depth is defined as
| (1) |
with in , the speed of light, the density of free electrons (mass , charge ), the component of the magnetic field along the line of sight, and the distance along the line of sight (Klein & Fletcher, 2015). The integral is evaluated from the source to the observer such that positive corresponds to toward the observer. Rotation measure is the slope of the relation between and . In its simplest form, , but superposition of waves that experience different amounts of Faraday rotation can make a function of wavelength and different from (e.g. Sokoloff et al., 1998).
Most Galactic Faraday rotation is believed to originate in the Warm Ionized Medium (WIM) (Heiles & Haverkorn, 2012). Observable Faraday rotation can arise from a plasma whose free-free continuum and spectral line emission are undetectable (Uyaniker et al., 2003), yet inversion of the integral in Equation 1 requires assumptions about the geometry, electron density and the magnetic field configuration in the object. In case of the Galactic magnetic field, this inversion benefits from a unique combination of measurements along diverging lines of sight, and information about from pulsar dispersion measure ,
| (2) |
with measured in , and and in the same units as in Equation 1. Pulsar s indicate a higher plasma density in the spiral arms, but the sampling is not yet dense enough to map structures on smaller scales consistently (Taylor & Cordes, 1993; Cordes & Lazio, 2002).
Large sections of the Milky Way disk have been surveyed for polarization of extragalactic sources and pulsars to map the Galactic magnetic field (e.g. Broten et al., 1988; Clegg et al., 1992; Brown & Taylor, 2001; Brown et al., 2003, 2007; Taylor et al., 2009; Han et al., 2018; Schnitzeler et al., 2019), and converted into complete maps of Galactic Faraday rotation by Oppermann et al. (2012), Oppermann et al. (2015), and Hutschenreuter & Ensslin (2019). The inner first Galactic quadrant is covered relatively sparsely by the survey of Van Eck et al. (2011) that targeted polarized sources selected from the NVSS (Condon et al., 1998). Jansson & Farrar (2012) combined Faraday rotation through the disk and the halo with polarization of diffuse emission into a coherent model of the large-scale Galactic magnetic field. This large-scale field has a strength of a few and a direction that varies with distance from the Galactic centre. The number of reversals and the precise geometry of the Galactic magnetic field is still a matter of debate (e.g. Brown et al., 2007; Han et al., 2018).
The contribution of spiral arms to the Faraday depth of the Galaxy affects the geometry and field strength in the remainder of the disk. Brown & Taylor (2001) discussed deviations in in the direction of H II regions along the local Orion-Cygnus arm. Vallée et al. (1988) reported excess Faraday rotation of in the region of the Scutum arm tangent. In this paper we present the first results of Faraday rotation of compact polarized sources from the THOR survey in the region of the Sagittarius (Sgr) arm tangent.
2 Observations and methods
The THOR survey (Beuther et al., 2016) covers the inner Galaxy in the longitude range and latitude with the Karl G. Jansky Very Large Array (VLA) in C configuration in L band (1 - 2 GHz). The survey includes the 21-cm line of atomic hydrogen, OH lines, several radio recombination lines and the continuum in 512 channels from 1 to 2 GHz. The 21-cm line and total intensity continuum were combined with archival data from the VLA Galactic Plane Survey (VGPS; Stil et al., 2006) and the Effelsberg continuum survey by Reich et al. (1990) at 1.4 GHz only. For the other spectral lines and continuum polarization, only the C-configuration data exist, sampling the continuum at on angular scales from to .
Radio Frequency Interference (RFI) flagging and standard flux and phase calibration of the continuum data were described by Beuther et al. (2016). Polarization calibration and imaging was done in CASA following standard procedures. The single phase calibrator observed during an observing session was used for polarization calibration, with 3C286 used for polarization angle calibration. The visibilities were averaged into 8 MHz channels before imaging of Stokes , , and to reduce data volume and improve the signal to noise ratio per channel for cleaning. The noise is approximately mJy beam-1 per 8 MHz channel. Bihr et al. (2016) and Wang et al. (2018) compiled a list of compact continuum sources in the THOR survey. Sources with peak brightness more than 10 mJy beam-1 were selected for polarization analysis. The input catalog is essentially complete at 10 mJy, but detection of the polarized signal depends on the local noise level, which can be raised by nearby bright diffuse emission. Our sample includes additional polarized components of resolved sources, but excludes occasional entries that were considered a part of bright diffuse sources after visual inspection. No other selection was made, but we follow the common implicit assumption that compact sources detected in polarization are extragalactic. Pulsars are rarely detectable in cm continuum imaging surveys such as the THOR continuum catalog (e.g. Dai et al., 2016).
Analysis of the THOR polarization image cubes begins with Faraday Rotation Measure Synthesis (RM synthesis, Brentjens & De Bruyn, 2005). The complex polarization as a function of wavelength is expressed in terms of the normalized Stokes parameters and as . The dimensionless Faraday depth spectrum is obtained by the Fourier transform
| (3) |
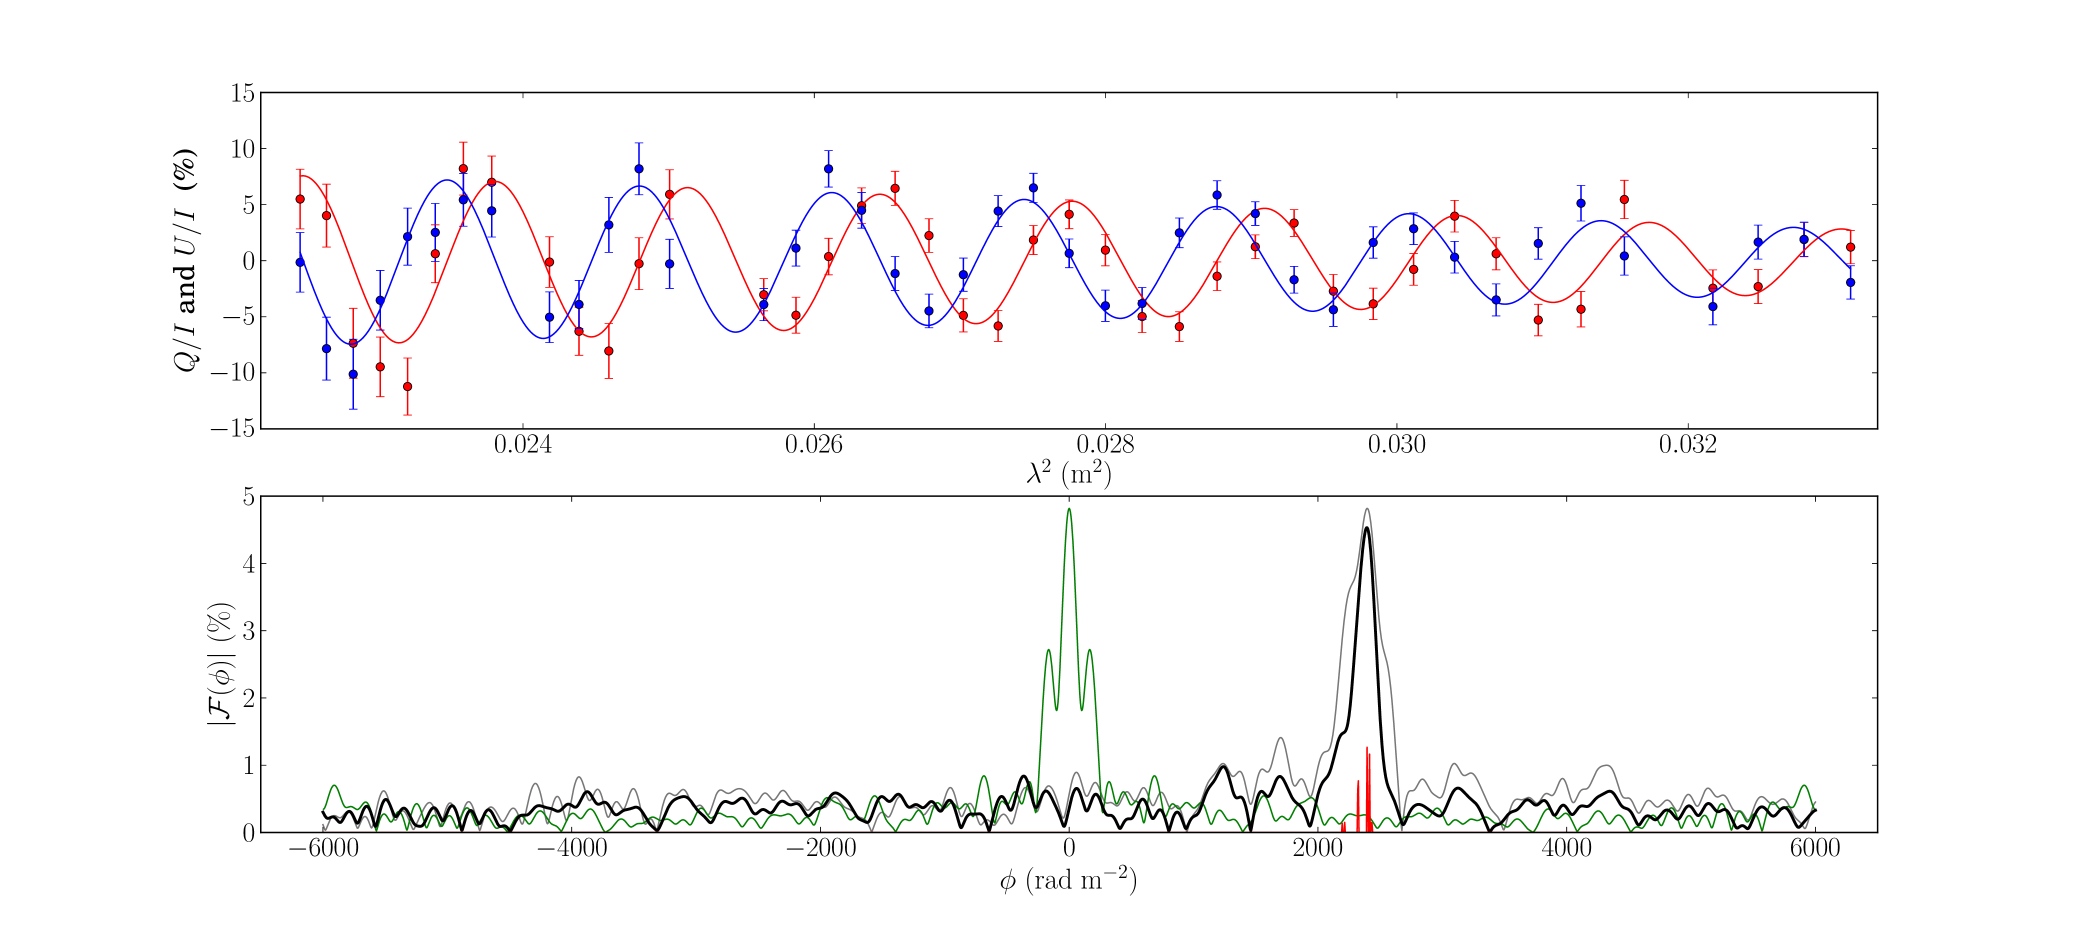
where for and the weight function where no measurements exist, including . Multiple values of can arise from blending different rates of Faraday rotation, by integrating over frequency, solid angle, or different emission regions along the line of sight. This is referred to as Faraday complexity. It gives rise to fractional polarization changing with wavelength, and a non-linear relation between polarization angle and . The Rotation Measure Transfer Function (RMTF) serves as the point spread function in Faraday depth. It is the Fourier transform of the function . RFI flagging reduces Faraday depth resolution to in the median and raises the side lobes of the , as shown in Figure 1.
Significant Faraday rotation within a single frequency channel leads to depolarization. If the width of a channel in is expressed as , the maximum observable Faraday depth is (Brentjens & De Bruyn, 2005),
| (4) |
For 8 MHz channels at 1.5 GHz this amounts to , and at 1.8 GHz to , so we have sensitivity to somewhat higher Faraday depth from the highest observed frequencies, with reduced sensitivity because of the smaller effective bandwidth (cf. Pratley & Johnston-Hollitt, 2019).
In this first exploration of the polarization survey, we present Faraday rotation of compact polarized extragalactic sources in the longitude range , and Faraday depth in the range . In view of the high s encountered for , this region was also analyzed at full spectral resolution (2 MHz channels between 1.6 and 1.9 GHz) up to . No detections were found outside the initial search range, but three more high sources were added to the sample. Sources detected in polarization were analyzed with the RM Clean algorithm (Heald, 2009) and QU fitting (Law et al., 2011), using the RMtools111https://github.com/CIRADA-tools/RM package of C. Purcell. Conceptually, RM synthesis resembles imaging of the visibilities in radio interferometry followed by a Clean deconvolution, while QU fitting resembles fitting a source in the visibility plane.
3 Results
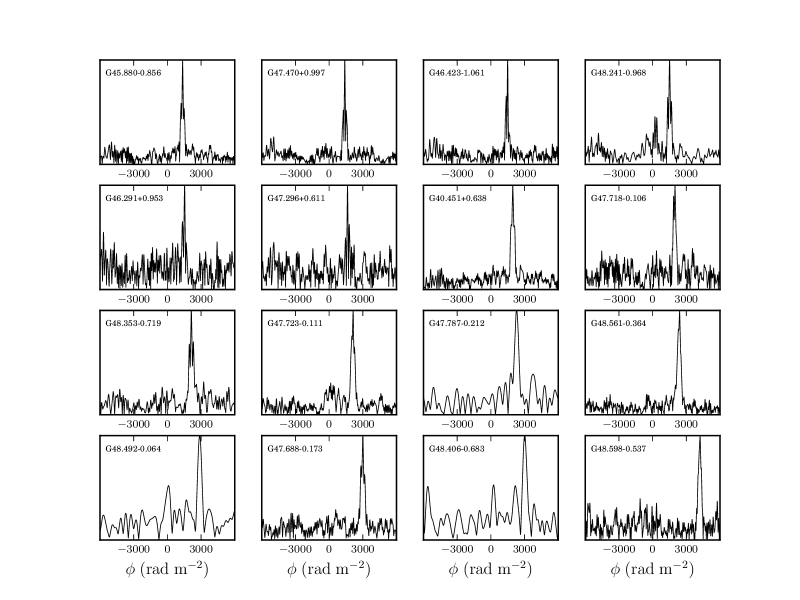
We present s for 127 compact polarized sources detected in the longitude range . Figure 1 shows Faraday rotation of the source G48.5610.364 with . The Stokes and spectra are well fitted by a model that depolarizes gradually to zero on the long-wavelength side of the band. RM Synthesis shows a distinct peak and RM Clean components spread in a range that reflects the gradual depolarization at longer wavelengths. Complex Faraday rotation and occasional high s in extragalactic sources are seen across the sky and believed intrinsic to the source (e.g. O’Sullivan et al., 2017). We adopt the location of the peak of as the Rotation Measure (), and identify it with the Faraday depth of the Galaxy (Equation 1). The value of the peak is the polarization degree of the source expressed as a percentage of Stokes . This is consistent with previous surveys that had a smaller bandwidth. The s derived from RM synthesis are in general closely consistent with those derived from QU fitting. Figure 2 shows Faraday depth spectra before RM Clean for the 16 sources with the highest . Table 1 lists all detections that have . The complete sample is available in the on-line material.
Figure 3 shows as a function of Galactic longitude. We see a spike in Faraday rotation near , in the longitude range of the Sgr arm tangent (Georgelin & Georgelin, 1976; Beuermann et al., 1985; Beuther et al., 2012; Vallée, 2014). In the range , the mean is with standard deviation (23 sources). For we find only one and a mean and (29 sources), while we find many times for with a mean and (75 sources). Subtracting the mean for as an estimate of the Faraday depth of the remainder of the Galaxy (c.f. models in Van Eck et al., 2011), the Sgr arm tangent contributes , with standard deviation . Several degrees from the tangent, the Sgr arm still adds in the mean and significant scatter to the total Galactic Faraday depth. The ratio for each of the three regions. This may indicate anisotropy in the random component of the magnetic field (e.g. Brown & Taylor, 2001; Beck, 2015).
We find good agreement for the sources measured by Van Eck et al. (2011) that lie within the THOR survey (large red dots in Figure 3). Many of our s are significantly higher than the range in Van Eck et al. (2011). The highest s in THOR are well above the threshold for bandwidth depolarization in the NVSS (Condon et al., 1998) from which their sample was selected. The green curve in Figure 3 shows the prediction of Galactic Faraday depth from Oppermann et al. (2015), and the cyan curve shows the prediction from Hutschenreuter & Ensslin (2019) that includes free-free emission as a prior for Faraday depth amplitude. The THOR s indicate that the Galactic Faraday depth is significantly higher than previously realized. This part of the Galactic plane is outside the survey of Schnitzeler et al. (2019), but these authors also applied a threshold in their sample selection.
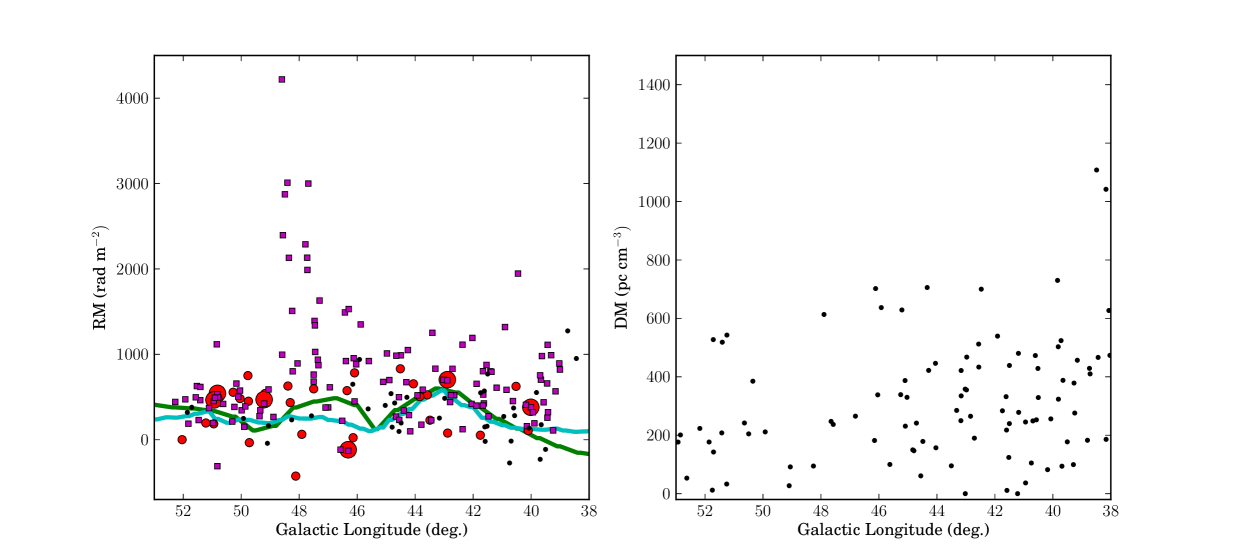
Figure 3 (right) shows the distribution of pulsar s in our range. There appears to be a discontinuity in between the highest pulsars and the remainder of the sample, up to around , although the number of pulsars is small. If the two are related, the mean and the suggest a mean magnetic field . The statistical error assumes uncertainty in both and . A higher density of low-latitude pulsars is required for further investigation. Han et al. (2018) analysed pulsars with and . These pulsars show a more continuous distribution of , and a mean field .
Our highest values exceed those published for sources behind Galactic H II regions. Vallée & Bignell (1983), Purcell et al. (2015), and Ma et al. (2019) reported up to 633 behind the Gum nebula. Harvey-Smith et al. (2011) found behind a sample of large-diameter, high-latitude, H II regions. Savage et al. (2013) and Costa et al. (2016) found up to behind the Rosette Nebula. The massive star formation region W4 (Gray et al., 1999; Costa & Spangler, 2018) and the Cygnus X region (Brown et al., 2003) have up to . Some of these studies are directly or indirectly subject to the effects of bandwidth depolarization in the NVSS, which is known to list fewer polarized sources behind H II regions (Stil & Taylor, 2007). Still, observations of Galactic H II regions to date show , with the high confined to regions outlined by the thermal radio emission. Very strong Faraday rotation has been detected from pulsars near the Galactic centre, with up to (Eatough et al., 2013; Schnitzeler et al., 2016), and up to from the non-thermal filaments (Lang et al., 1999; Paré et al., 2019). In the Galactic disk, two pulsars, PSR J18410500 (Camilo et al., 2012) and PSR J18390643 (Han et al., 2018) have , and the magnetar PSR J15505418 has .
In order to test whether the high s result from H II regions along the line of sight, their positions were cross matched with the catalog of Galactic H II regions of Anderson et al. (2014). This catalog is based on the mid-infrared WISE all sky survey, which provides a more sensitive census of H II regions than the available radio continuum surveys. The emission of stochastically heated small dust grains is spatially correlated with the ionized gas in an H II region (Anderson et al., 2011). The catalog is complete in the first quadrant for H II regions around a single star of spectral type O9.5 or earlier (W. Armentrout et al. 2019, in preparation). Table 1 lists the H II region nearest to the line of sight selected by two criteria from the catalog of Anderson et al. (2014). The first listed H II region is the nearest considering the angular distance expressed in units of the H II region radius (), and the second H II region is the nearest selected by angular distance only (). For each case, the angular distance and the separation in terms of the H II region radius () is listed. We excluded the H II region G49.0480.886, because it is not in the most recent version (2.2) of the on-line catalog222http://astro.phys.wvu.edu/wise/.
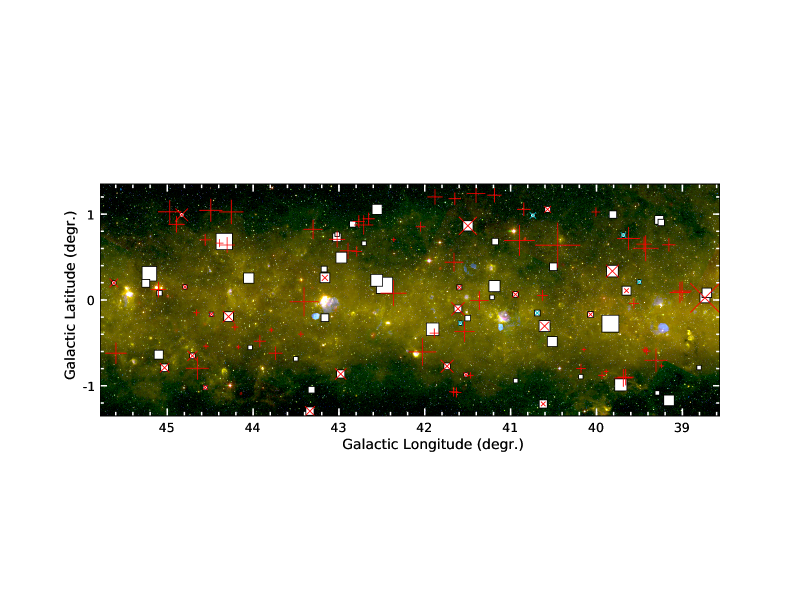
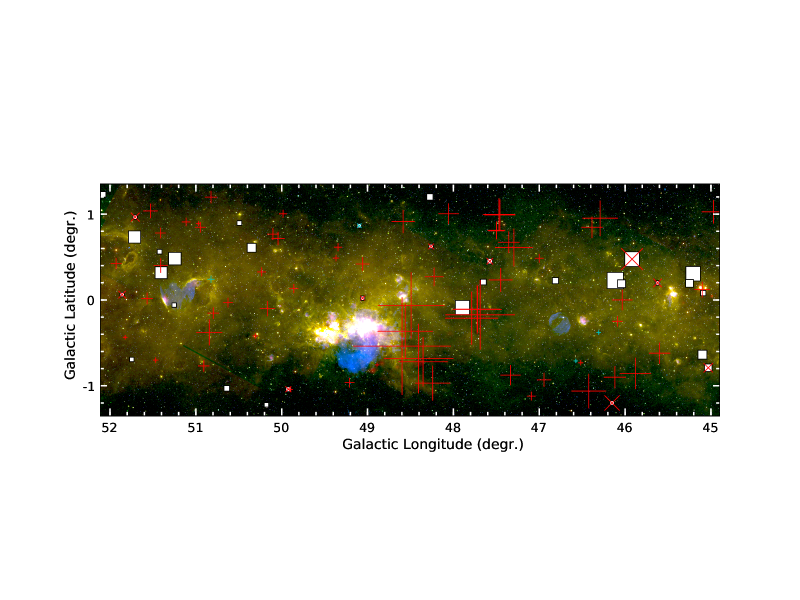
Most high s are found away from detectable H II regions. Figure 4 shows s of extragalactic sources (), pulsars (), and pulsar s (white squares) on a color-composite image of the Galactic plane that combines WISE 4.6 , 12 , and 22 , MSX 8, and THOR radio continuum images. H II regions appear as pink or bright yellow nebulae, while supernova remnants appear as blue nebulae. The highest is found on a line of sight that passes within from the star formation region W51, which is the 9th most luminous source of free-free emission in the Galaxy (Rahman & Murray, 2010) at a distance of 5.4 kpc (Sato et al., 2010). The median for 79 sources whose line of sight passes more than 2 times the radius from the nearest H II region is . This includes most of the high sources listed in Table 1. The median for 14 sources whose line of sight passes within the radius of an H II region () is . The difference is hardly significant considering the sample size and the large scatter in . The spike is about a degree () from W51, on the inside of the spiral arm. This is upstream when considering the motion of gas and stars through the spiral arm.
4 Discussion
The lack of correlation of high s with the H II region catalog of Anderson et al. (2014) indicates the high s arise in the more diffuse WIM. The excess s are all positive, indicating a mean magnetic field component toward the observer in the region in which they arise. Several of our s are significantly higher than s from star formation regions with strong thermal radio continuum emission. Emission from a Faraday rotating plasma may be unobservable if the plasma is spread out over a long distance along the line of sight, but a large from a region with small line-of-sight depth must result in a high emission measure unless the magnetic field strength is elevated. We consider two options: associate the spike at with a confined region, e.g. the wall of a super bubble or an extended ionized halo around W51, with line-of-sight dimension , or with the diffuse WIM in the spiral arm, with line-of-sight dimension . Within we assume a filling factor of unity. A smaller filling factor would be equivalent to reducing . As an order of magnitude estimate, we write for . We focus the discussion on , which includes several sources far from W51, noting that the extreme near , may be affected by W51 (compare Figure 4 with the radio recombination line map of W51 presented by Liu et al., 2019).
The case then implies a mean . For a mean line-of-sight magnetic field , this implies , and emission measure . The free-free emission from such a region would have a brightness temperature of 0.6 K at 1.4 GHz, for plasma temperature . The implied emission measure for the highest is an order of magnitude higher. We see structures on scales of with a contrast K in the THOR continuum image, but no excess that traces the higher s. On the other hand, free-free emission from super bubble walls is clearly detected around W4 (Costa & Spangler, 2018) and W47 (Beuther et al., 2016). The high RM sources of Costa & Spangler (2018), including O10, are enclosed by the contour , while the Galactic background is in the range to . Also, Gray et al. (1999) found that depolarization of diffuse emission is closely correlated with total intensity. A stronger mean magnetic field ( for ) would reduce the implied emission measure beyond detection in the radio continuum image. Although the mean at is comparable to model predictions for super bubbles (Stil et al., 2009; Costa et al., 2016; Costa & Spangler, 2018), the highest s are significantly larger.
If, however, the spike arises in the WIM of the Sgr arm with , the product . For mean , the implied electron density is . This is an order of magnitude higher than the volume-average density of the WIM in the midplane (Gaensler et al., 2008), but less than reported by Langer et al. (2018) for compressed WIM in the Scutum spiral arm. Compression of the WIM in the spiral arm will also increase the magnetic field strength, so it is fair to say that . The emission measure of this plasma would be undetectable in the THOR continuum images. Association of the spike with compressed WIM in the Sgr arm also explains the difference in and between , and where the line of sight intersects the spiral arm. The line-of-sight component of the large-scale magnetic field may also be larger as a result of the compression of the plasma.
The Sgr arm passes inside the solar circle and is known in the southern sky as the Carina arm (e.g. Georgelin & Georgelin, 1976). Association of the spike with the spiral arm would be confirmed if a similar structure, with the sign of inverted, was found near the tangent of the Carina spiral arm around (Vallée, 2014). This area was previously covered by the Southern Galactic Plane Survey (SGPS, Haverkorn et al., 2006; Brown et al., 2007). The average SGPS at these longitudes is positive but close to zero (Brown et al., 2007), with a large range, . It is possible that a narrow region () with excessive has eluded detection. The SGPS was observed with twelve 8 MHz channels between 1336 MHz and 1432 MHz (Haverkorn et al., 2006), frequencies where our high- sources depolarize in 8 MHz channels. The SGPS was also sensitive to diffuse Galactic emission that may have interfered with the detection of faint compact sources. Han et al. (2018) show pulsars for near the Carina arm tangent with . A denser rotation measure grid is required to confirm or reject the presence of a negative spike near the Carina arm tangent.
We find that is (54%) higher and is (63%) higher for than for . Such a sudden, substantial increase is not seen in current models of the magnetic field (e.g. Van Eck et al., 2011), but it is far too extended to ascribe to a single H II region. If the Sgr arm raises the mean and the dispersion of for , we expect its effect to peak at the arm tangent (), where the line of sight through the arm is longest, and presumably aligned with the magnetic field. Association of the spike with an extended halo or bubble around W51 leaves unexplained why the is enhanced only on one side of W51, why we detect no excess thermal radio continuum from the direction of high s, and why and are higher for . For these reasons, we favour association of the observed structure with the Sgr arm. This interpretation is consistent with the observation of polarized emission from the inside of spiral arms in galaxies with a strong spiral shock (Beck, 2015, for a review), although these structures may be dominated by compressed turbulent field with little Faraday rotation (Fletcher et al., 2011).
This implies that Faraday rotation from spiral arms may be much stronger than previously thought, depending on the angle between the line of sight and the spiral arm. In particular, departures of the actual spiral arm from a perfect logarithmic spiral on kpc scales may impose systematic structure on scales of several degrees in Galactic longitude. The impact of the new data on the currently favoured model for the Galactic magnetic field by Jansson & Farrar (2012) cannot be determined without detailed modelling. The high Faraday depth of the arm suggests it needs to be known accurately to model the magnetic field in the remainder of the disk.
These results emphasize the importance of sensitivity to high . The initial polarization data product from the VLA Sky Survey (VLASS)333https://science.nrao.edu/science/surveys/vlass is envisioned to be coarse cubes with 128 MHz channels. These cubes will have at mid-band (3 GHz). Another consequence of high associated with spiral arms is the potential effect on Faraday rotation of Fast Radio Bursts (FRBs, Lorimer, 2018). An FRB was recently identified 4 kpc from the center of a luminous early type or lenticular spiral galaxy by Bannister et al. (2019). If these bursts are associated with neutron stars in young supernova remnants (e.g. Piro & Gaensler, 2018), they may well be embedded in spiral arms. The results presented here suggest that some FRBs could have in the thousands from their host galaxy without the need to invoke an extreme environment.
5 Conclusions
We present first results from the THOR polarization survey of Faraday rotation of compact radio sources. The THOR data reveal a strong spike in up to at the Sgr arm tangent, with several sources exceeding . On the low-longitude side, where the line of sight intersects the Sgr arm, the mean is higher by (54%), and the standard deviation is (63%) larger than at higher longitude, where the line of sight does not intersect the Sgr arm. The combined pattern supports association of the spike with the large-scale structure of the spiral arm.
The strong Faraday rotation arises along lines of sight that do not intersect H II regions detected by WISE at . If the plasma is confined to any structure that has line-of-sight depth , e.g. the magnetized wall of a super bubble, its free-free emission should have been detected in the THOR continuum image unless the mean line-of-sight magnetic field . We hypothesize that the spike arises from compressed magnetized WIM in the spiral arm, upstream from the major star forming regions. This hypothesis can be tested in the future because it implies a similar structure, with the sign of inverted, at the Carina arm tangent () that may have eluded detection in existing surveys.
The excess Faraday depth of the Sgr arm tangent is several times the total Faraday depth of the remainder of the Milky Way disk. The arm acts as a very significant and structured Faraday screen inside the Galaxy. By inference, spiral arms in other galaxies may have similarly large Faraday depth. Some Fast Radio Bursts may have in the thousands without the need to invoke an extreme environment if these bursts are associated with neutron stars in spiral arms.
References
- Anderson et al. (2011) Anderson, L. D., Bania, T. M., Balser, D. S., et al. 2011, ApJS, 194, 32
- Anderson et al. (2014) Anderson, L. D., Bania, T. M., Balser, D. S., et al. 2014, ApJS, 212, 1
- Bannister et al. (2019) Bannister, K. W., Deller, A. T., Phillips, C. et al. 2019, Science, 365, 565
- Beck (2015) Beck, R. 2015, A&A Rev., 24, 4
- Beuermann et al. (1985) Beuermann, K., Kanbach, G., & Berkhuijsen, E. M. 1985, A&A153, 17
- Beuther et al. (2012) Beuther, H., Tackenberg, J., Linz, H., et al. 2012, ApJ, 747, 43
- Beuther et al. (2016) Beuther, H., Bihr, S., Rugel, M., et al. 2016, A&A, 595, A32
- Bihr et al. (2016) Bihr, S., Johnston, K. G., Beuther, H., et al. 2016, A&A, 588, A97
- Brentjens & De Bruyn (2005) Brentjens, M. A., & De Bruyn, A. G. 2005, A&A, 441, 1217
- Broten et al. (1988) Broten, N. W., MacLeod, J. M., & Vallee, J. P. 1988, Ap&SS, 141, 303
- Brown & Taylor (2001) Brown, J. C., & Taylor, A. R. 2001, ApJ, 563, L31
- Brown et al. (2003) Brown, J. C., Taylor, A. R., & Jackel, B. J. 2003, ApJS, 213, 223
- Brown et al. (2007) Brown, J. C., Haverkorn, M., Gaensler B. M., et al. 2007, ApJ, 663, 258
- Camilo et al. (2012) Camilo, F., Ransom, S. M., Chatterjee, S., et al. 2012, ApJ, 746, 63
- Clegg et al. (1992) Clegg, A. W., Cordes, J. M., Simonetti, J. H. et al. 1992, ApJ, 368, 143
- Condon et al. (1998) Condon, J. J., Cotton, W. D., Greisen, E. W., Yin, Q. F., Perley, R. A., Taylor, G. B., & Broderick, J. J. 1998, AJ, 115, 1693
- Cordes & Lazio (2002) Cordes, J. M., Lazio, T. J. W. 2002, arXiv:astro-ph/0207156
- Costa et al. (2016) Costa, A. H., Spangler, S. R., Sink, J. R., et al. 2016, ApJ, 821, 92
- Costa & Spangler (2018) Costa, A. H., & Spangler, S. R. 2018, ApJ, 865, 65
- Dai et al. (2016) Dai, S., Johnston, S., Bell, M. E., et al. 2016, MNRAS, 462, 3115
- Eatough et al. (2013) Eatough, R. P., Falcke, H., Karuppusamy, R., et al. 2013, Nature, 501, 391
- Ferrière et al. (1991) Ferrière, K. M., Mac Low, M.-M., Zweibel, E. G. 1991, ApJ, 375, 239
- Fletcher et al. (2011) Fletcher, A., Beck, R., Shukurov, A. et al. 2011, MNRAS, 412, 2396
- Gaensler et al. (2008) Gaensler, B. M., Madsen, G. J., Chatterjee, S., et al. 2008, PASA, 25, 184
- Georgelin & Georgelin (1976) Georgelin, Y. M. & Georgelin, Y. P. 1976, A&A, 49, 57
- Gray et al. (1999) Gray, A. D., Landecker, T. L., Dewdney, P. E. et al. 1999, ApJ, 514, 221
- Harvey-Smith et al. (2011) Harvey-Smith, L., Madsen, G. J., & Gaensler, B. M. 2011, ApJ, 736, 83
- Haverkorn et al. (2006) Haverkorn, M., Gaensler, B. M., McClure-Griffiths, N. M., et al. 2006, ApJS, 167, 230
- Han et al. (2018) Han, J. L., Manchester, R. N., Van Straten, W., et al. 2018, ApJS, 234, 11
- Heald (2009) Heald, G. 2009, IAUS, 259, 591
- Heiles & Haverkorn (2012) Heiles, C. & Haverkorn, M. 2012, Space Sci. Rev., 166, 293
- Hutschenreuter & Ensslin (2019) Hutschenreuter, S., & Ensslin, T. A. 2019, arXiv:1903.06735
- Jansson & Farrar (2012) Jansson, R. & Farrar, G. R. 2012, ApJ, 757, 14
- Klein & Fletcher (2015) Klein, U. & Fletcher A. 2015, Galactic and Intergalactic Magnetic Fields, (Heidelberg:Springer)
- Klessen & Glover (2016) Klessen, R. S., & Glover, S. C. O. 2016, Saas Fee Lecture Notes, 43, 85
- Lang et al. (1999) Lang, C. C. , Morris M., & Echevarria, L. 1999, ApJ, 526, 727
- Langer et al. (2018) Langer, W. D., Velusamy, T., Goldsmith, P. F. et al. 2018, A&A, 607, A59
- Law et al. (2011) Law, C. J. , Gaensler B. M., Bower, G. C., et al. 2011, ApJ, 728, 57
- Liu et al. (2019) Liu, B., Anderson, L. D., McIntyre, T. et al. 2019, ApJS, 240, 14
- Lorimer (2018) Lorimer, D. R., Nature Astronomy, 2, 860
- Ma et al. (2019) Ma, Y. K., Mao, S. A., Stil, J. M., et al. 2019, MNRAS, 487, 3432
- Manchester et al. (2005) Manchester, R. N., Hobbs, G. B., Teoh, A. et al. 2005, AJ, 129, 1993
- Oppermann et al. (2012) Oppermann, N. Junklewitz, H., Robbers, G., Bell, M. R., Ensslin, T. A., et al. 2012, A&A, 542, A93
- Oppermann et al. (2015) Oppermann, N., Junklewitz, H., Greiner, M. et al., 2015, A&A, 575, A118
- O’Sullivan et al. (2017) O’Sullivan, S. P., Purcell, C. R., Anderson, C. S. et al. 2017, MNRAS, 469, 4034
- Paré et al. (2019) Paré, D. M., Lang, C. C., Morris, M. R. et al. 2019, arXiv:1909.08268
- Piro & Gaensler (2018) Piro, A. L., & Gaensler, B. M. 2018, ApJ, 861, 150
- Purcell et al. (2015) Purcell, C. R., Gaensler, B. M., Sun, X. H. et al. 2015, ApJ, 804, 22
- Pratley & Johnston-Hollitt (2019) Pratley, L. & Johnston-Hollitt, M. 2019, arXiv:1906.00866
- Reich et al. (1990) Reich, W., Reich, P., & Fürst 1990, A&AS, 83, 539
- Rahman & Murray (2010) Rahman, M., & Murray, N. 2010, ApJ, 719, 1104
- Sato et al. (2010) Sato, M., Reid, M. J., Brunthaler, A., et al. 2010, ApJ, 720, 1055
- Savage et al. (2013) Savage, A. H., Spangler, S. R., & Fisher, P D. 2013, ApJ, 765, 42
- Schnitzeler et al. (2016) Schnitzeler, D. H. F. M., Eatough, R. P., Ferrière, K., et al. 2016, MNRAS, 459, 3005
- Schnitzeler et al. (2019) Schitzeler, D. H. F. M., Carretti, E., Wieringa, M. H., et al. 2019, MNRAS, 485, 1293
- Sokoloff et al. (1998) Sokoloff, D. D., Bykov, A. A., Shukurov, A., et al. 1998, MNRAS, 299, 189
- Stil et al. (2006) Stil, J. M., Taylor, A. R., Dickey, J. M., et al. 2006, AJ, 132, 1158
- Stil & Taylor (2007) Stil, J. M., & Taylor, A. R. 2007, ApJ, 663, 21
- Stil et al. (2009) Stil, J. M., Wityk, N., Ouyed, R., et al. 2009, ApJ, 701, 330
- Taylor & Cordes (1993) Taylor, J. H., & Cordes, J. M. 1993, ApJ, 411, 674
- Taylor et al. (2009) Taylor, A. R., Stil, J. M., & Sunstrum, C. 2009, ApJ, 702, 1230
- Tomisaka (1998) Tomisaka, K. 1998, MNRAS, 298, 797
- Uyaniker et al. (2003) Uyaniker, B., Landecker, T. L., Gray, A. D., et al. 2003, ApJ, 585, 785
- Vallée & Bignell (1983) Vallée, J. P., & Bignell, R. C. 1983, ApJ, 272, 131
- Vallée et al. (1988) Vallée, J. P., Simard-Normandin M., & Bignell, R. C. 1988, ApJ, 331,321
- Vallée (2014) Vallée, J. P. 2014, ApJS, 215, 1
- Van Eck et al. (2011) Van Eck, C., Brown, J. C., Stil, J. M., et al. 2011, ApJ, 728, 97
- Wang et al. (2018) Wang, Y., Bihr, S., Rugel, M. et al. 2018, A&A, 619, A124
| Name | Nearest H II | Nearest H II | ||||||||
|---|---|---|---|---|---|---|---|---|---|---|
| (mJy) | (%) | () | (relative to size) | () | (absolute) | () | ||||
| G39.4270.603 | 43.6 | 3.98 | 1111 4 | G39.5150.511 | 7.6 | 0.9 | G39.4910.676 | 5.9 | 11.4 | |
| G40.4510.638 | 20.1 | 7.98 | 1946 6 | G40.1540.648 | 17.8 | 1.1 | G40.4300.697 | 3.8 | 4.1 | |
| G40.8980.694 | 90.3 | 2.09 | 1320 10 | G40.1540.648 | 44.7 | 2.7 | G41.0420.306 | 24.8 | 12.8 | |
| G42.0280.605 | 424.7 | 3.29 | 1192 2 | G42.0060.500 | 6.4 | 0.7 | G42.1030.623 | 4.7 | 1.4 | |
| G42.3650.079 | 144.7 | 2.05 | 1113 2 | G42.5620.107 | 16.3 | 2.5 | G42.2040.038 | 10.0 | 2.5 | |
| G43.4070.021 | 64.0 | 5.45 | 1252 4 | G43.6170.059 | 13.5 | 3.8 | G43.5160.018 | 7.0 | 46.4 | |
| G44.2531.026 | 38.7 | 3.82 | 1050 4 | G43.9990.978 | 15.4 | 6.7 | G43.9990.978 | 15.4 | 6.7 | |
| G44.9711.027 | 129.2 | 3.00 | 1010 2 | G6.40422.865a | 2600 | 8.4 | G45.1970.740 | 21.9 | 16.4 | |
| G45.8800.856 | 38.6 | 10.61 | 1350 2 | G46.2530.585 | 27.7 | 4.7 | G45.9920.511 | 21.8 | 21.4 | |
| G46.2910.953 | 22.1 | 3.07 | 1530 13 | G46.3920.861 | 8.2 | 2.9 | G46.3750.896 | 6.1 | 15.1 | |
| G46.4231.061 | 111.8 | 3.23 | 1491 5 | G46.2530.585 | 30.3 | 5.1 | G46.3250.790 | 17.3 | 16.7 | |
| G47.2960.611 | 48.2 | 2.82 | 1630 9 | G46.7920.284 | 36.0 | 2.9 | G47.0940.492 | 14.0 | 14.0 | |
| G47.4490.234 | 110.9 | 1.67 | 1028 7 | G47.4580.225 | 0.8 | 0.4 | G47.4580.225 | 0.8 | 0.4 | |
| G47.4580.990 | 57.4 | 6.90 | 1339 1 | G46.7920.284 | 58.2 | 4.7 | G47.7651.424 | 31.9 | 30.9 | |
| G47.4700.997 | 52.9 | 11.94 | 1392 1 | G46.7920.284 | 59.0 | 4.8 | G47.7651.424 | 31.1 | 30.1 | |
| G47.6880.173 | 38.8 | 3.01 | 3000 9 | G49.7750.951 | 133.6 | 4.4 | G47.5800.075 | 8.8 | 6.9 | |
| G47.7180.106b | 52 | … | 2.31 | 1989 19 | G49.7750.951 | 133.4 | 4.4 | G47.5800.075 | 8.5 | 6.7 |
| G47.7230.111 | 207.6 | 4.12 | 2132 5 | G49.7750.951 | 133.0 | 4.4 | G47.5800.075 | 8.8 | 7.0 | |
| G47.7870.212c | 32.8 | 5.40 | 2289 18 | G49.7750.951 | 127.2 | 4.2 | G47.5800.075 | 14.9 | 11.8 | |
| G48.2410.968 | 460.9 | 1.10 | 1508 2 | G49.7750.951 | 92.0 | 3.1 | G47.8670.854 | 23.5 | 24.3 | |
| G48.3530.719 | 90.2 | 3.09 | 2130 6 | G49.7750.951 | 86.4 | 2.9 | G48.5910.658 | 14.8 | 24.7 | |
| G48.4060.683c | 35.2 | 5.75 | 3011 95 | G49.7750.951 | 83.7 | 2.8 | G48.5910.658 | 11.3 | 18.8 | |
| G48.4920.064c | 44.7 | 2.03 | 2874 84 | G48.5990.044 | 9.2 | 2.3 | G48.5470.005 | 4.9 | 3.1 | |
| G48.5610.364 | 126.2 | 4.20 | 2396 8 | G48.8710.383 | 18.7 | 2.1 | G48.6300.139 | 14.2 | 29.3 | |
| G48.5980.537 | 92.0 | 1.62 | 4219 15 | G48.8710.383 | 18.9 | 2.2 | G48.5910.658 | 7.2 | 12.0 | |
| G50.8440.377 | 64.5 | 4.04 | 1118 6 | G51.0100.060 | 28.0 | 1.7 | G50.8480.170 | 12.4 | 12.6 |
Note. — Table 1 is published in its entirety in the machine-readable format. The sub-set of sources with is shown here to support the discussion in the text. Column description: THOR name from the compact source catalog, flux density, spectral index, percent polarization at reference frequency 1.6 GHz unless noted otherwise, , name of nearest H II region, selected by angular distance in units of its radius, angular distance in arcminutes, angular distance in units of H II region radius, name of the nearest H II region selected by angular distance, angular distance in arcminutes, and angular distance in units of H II region radius.