Star Formation in Isolated Dwarf Galaxies Hosting Tidal Debris:
Extending the Dwarf-Dwarf Merger Sequence
Abstract
Like massive galaxies, dwarf galaxies are expected to undergo major mergers with other dwarfs. However, the end state of these mergers and the role that merging plays in regulating dwarf star formation is uncertain. Using imaging from the Hyper Suprime-Cam Subaru Strategic program, we construct a sample of dwarf-dwarf mergers and examine the star formation and host properties of the merging systems. These galaxies are selected via an automated detection algorithm from a sample of 6875 spectroscopically selected isolated dwarf galaxies at and from the Galaxy and Mass Assembly (GAMA) and Sloan Digital Sky Survey (SDSS) spectroscopic campaigns. We find a total tidal feature detection fraction of 3.29% (6.1% when considering only galaxies at ). The tidal feature detection fraction rises strongly as a function of star formation activity; 15%-20% of galaxies with extremely high H equivalent width (H EW 250Å) show signs of tidal debris. Galaxies that host tidal debris are also systematically bluer than the average galaxy at fixed stellar mass. These findings extend the observed dwarf-dwarf merger sequence with a significant sample of dwarf galaxies, indicating that star formation triggered in mergers between dwarf galaxies continues after coalescence.
1 Introduction
Dwarf galaxies are the most abundant subset of galaxies in the universe (Binggeli et al., 1988). Though hierarchical structure formation should also proceed for these systems, there are very few examples of extragalactic dwarf-dwarf mergers in the literature. A number of individual cases have been examined in great detail (Martinez-Delgado et al., 2012; Annibali et al., 2016; Privon et al., 2017), and a small number of systematic searches for dwarfs undergoing interactions with other low-mass systems have been performed either by searching for dwarf companions (Stierwalt et al., 2017), or by searching for low surface brightness (LSB) merger signatures (Paudel et al., 2018).
Such studies show evidence for hierarchical merging at low galaxy mass – Annibali et al. (2019) finds evidence for ongoing accretion events around the dwarf galaxy DD0 68 with mass ratios of 10:1 and 100:1. Though these focused studies reveal in great detail the accretion histories of individual systems, the question of the commonality of merger features around dwarf galaxies is still poorly understood.
From matching SDSS to Millenium-II, of dwarf galaxies () should have a companion of at least its mass (Sales et al., 2013; Besla et al., 2018). Moreover, of dwarf galaxies and of dwarfs located far from a massive neighbor are expected to have undergone a major merger since (Deason et al., 2014). It is thus of interest to characterize the frequency and characteristics of dwarf galaxies that show signs of a recent dwarf-dwarf merger.
The star formation activity during and after the merger of two dwarf galaxies is also a largely unconstrained realm. Less than 2% of dwarf galaxies in the field are observed to be quiescent (Geha et al., 2012). If dwarf galaxies are indeed undergoing major mergers, this suggests that mergers between dwarfs do not succeed in quenching star formation, in contrast to the expectation of major merger outcomes for more massive galaxies (Bekki, 1998; Hopkins et al., 2008; Ellison et al., 2018).
Furthermore, such dwarf-dwarf mergers have been proposed as a mechanism to create Blue Compact Dwarfs (hereafter BCDs). These starbursting dwarfs are at , have physical sizes of less than 1 kpc, and show a strongly starbursting spectrum (Bekki, 2008). BCDs tend to show a more centrally concentrated mass profile than a typical dwarf irregular galaxy, as well as higher central surface brightnesses (Janowiecki & Salzer, 2014). However, in deeper observations, BCDs are also found to host old stellar populations of Gyr (Aloisi et al., 2007; Annibali et al., 2013).
Previous searches for tidal features around low mass galaxies have found a depressed tidal feature detection fraction relative to samples of more massive galaxies. A study of SDSS and CFHT Legacy Survey data found that approximately 0.68% of the low mass galaxies in their sample host tidal features (Paudel et al., 2018). Though the tidal feature fraction should increase as the effective surface brightness limit improves (see, e.g. Annibali et al., 2019), it is possible that tidal features around dwarf galaxies at low- are intrinsically rare features. Thus, in this work we search for LSB tidal debris around a sample of isolated dwarf galaxies identified in the GAMA and SDSS spectroscopic surveys at in imaging from the Wide layer of the Hyper Suprime-Cam Subaru Strategic Program (HSC-SSP; Aihara et al., 2018a, b; Miyazaki et al., 2018; Komiyama et al., 2018; Kawanomoto et al., 2018; Furusawa et al., 2018; Bosch et al., 2018a; Huang et al., 2018b; Coupon et al., 2018).
In Section 2 we establish the parent sample of spectroscopically confirmed dwarfs with imaging in HSC-SSP. In Section 3 we outline the automated detection algorithm employed to search for tidal debris around dwarf galaxies. We present the dependence of the frequency of detectable features around a host galaxy as a function of the host properties and star formation activity in Section 4. Finally, we discuss the implications for the observational dwarf galaxy merging sequence in Section 5.
Throughout this paper we adopt a standard flat CDM model in which H km s-1 Mpc-1 and .
2 Sample Selection
For the purposes of this study, we follow Stierwalt et al. (2015) in defining a dwarf galaxy as a galaxy with stellar mass of . The stellar masses reported here are for individual dwarfs. We find only one case in which both galaxies in an interacting pair host tidal features. The dwarfs are sufficiently separated such that their individual stellar masses may be estimated. We note that this is somewhat lower than the value used by other studies (for example, Paudel et al. (2018) uses a cutoff of in combined stellar mass for the dwarf and its companion, if applicable).
We additionally exclude galaxies at , as we are in practice unable to find LSB tidal debris around galaxies at this mass range above this redshift cutoff (for a discussion of the completeness of our tidal feature detection method, see Figure 4).
2.1 HSC-SSP Imaging
The detection of tidal debris resulting from low mass mergers requires imaging that covers a large enough area to find a sizable number of galaxies that host such features while simultaneously probing the relevant low surface brightness universe. HSC-SSP is particularly well-suited towards this aim; HSC-SSP will cover over 1400 square degrees on the sky to a limiting magnitude of i mag for point sources (Bosch et al., 2018b). Detection of low surface brightness features is a function of both the detection algorithm and the imaging sensitivity. We find that HSC-SSP reaches surface brightness limit of 27 mag arcsec-2 when detecting isolated LSB structure (Greco et al., 2018; Kado-Fong et al., 2018). When the morphology of the LSB structure is known (e.g. for measurements of smooth stellar halos), measurements of individual galaxies reach mag arcsec-2 (massive ellipticals, Huang et al., 2018a), and measurements on stacked images reach mag arcsec-2 (isolated central galaxies, on the order of one thousand objects stacked, Wang et al., 2019).
For this work, we use the HSC S18A data release, which covers over 300 square degrees on the sky in , , and . We do not use and imaging because the surface brightness limits and seeing of these bands are significantly worse than the bluer bands, and including these bands would decrease the usable area of this work without contributing significantly to the detection of LSB structure. This data release is equivalent to the second public data release (hereafter PDR2) presented in Aihara et al. (2019). The area covered by our search is somewhat smaller than the total area released in PDR2, as we require imaging in , , and bands for each target galaxy. We also briefly note that the background subtraction method implemented in this release has been updated from that which was used for the first HSC-SSP public data release. This new background subtraction method reduces oversubtraction of the halos around bright galaxies, allowing us to target galaxies at lower redshifts than were possible in Kado-Fong et al. (2018).
2.2 Spectroscopic sample
To generate a sample of isolated dwarfs, we consider only galaxies with spectra from either the Sloan Digital Sky Survey (SDSS) spectroscopic surveys (both legacy and BOSS surveys, Strauss et al., 2002; Dawson et al., 2013; Reid et al., 2016) or from the Galaxy and Mass Assembly (GAMA) spectroscopic survey (Baldry et al., 2018).
These cuts leave a parent sample of 8412 dwarf galaxies. 3733 of the target galaxies have spectra from the SDSS surveys, while 5001 galaxies have spectra from GAMA (678 galaxies have spectra from both GAMA and SDSS). For galaxies with GAMA spectra, we adopt the stellar masses provided by the GAMA team (Taylor et al., 2011). These stellar masses are measured assuming a Chabrier initial mass function (Chabrier, 2003). For galaxies with SDSS spectra, we adopt stellar masses derived using the Conroy et al. (2009) flexible stellar population synthesis (FSPS) models assuming a Kroupa initial mass function (Kroupa, 2001). For galaxies in our sample that have spectroscopy from both GAMA and SDSS, we find that the FSPS stellar masses are higher than the equivalent measurement in the GAMA catalog by a median of 0.08 dex and a median absolute deviation of 0.35 dex. To reconcile this systematic shift, we reduce the masses derived from SDSS observations by 0.08 dex, but note that including or excluding this shift does not affect the results presented in this work.
Because we want to study the star formation properties of these dwarfs, we also use the H line measurements provided by the GAMA and SDSS spectroscopic databases.
2.3 Isolated dwarf sample
Finally, because we are interested only in interactions between two dwarf galaxies, we require that the target galaxies have a 3D physical separation of at least 1 Mpc from the nearest massive galaxy () in the NASA Sloan Atlas (Blanton et al., 2011), as measured from the comoving distances using the spectroscopic redshifts of the target catalog and the NASA-Sloan Atlas (hereafter NSA). In this work, we use NSA version 1.0.1, which was released with SDSS DR13 and reaches .
Though the NSA is nominally complete only to , we note that the fraction of galaxies that are flagged as satellites is independent of redshift. To confirm that we are not misclassifying satellite dwarfs, we compare the satellite fraction as function of redshift for the sample as constructed above and the satellite fraction of the dwarfs with GAMA spectroscopy when matched to the GAMA spectroscopic catalog, which is deeper than the NSA. We find no significant differences in the satellite fraction, and therefore conclude that we are not misclassifying a significant number of satellite galaxies as field dwarfs.
We also remove galaxies that are projected closer than 0.01 deg to a massive galaxy, regardless of physical association. This cut aims to remove those cases in which a dwarf galaxy overlaps significantly with high surface brightness light from a more massive projected neighbor.
The isolation criterion that we adopt here is somewhat different than isolation criteria adopted in the literature in that we make a cut in comoving distance rather than directly in velocity space (Geha et al., 2012; Paudel et al., 2018). Because the isolation of the galaxies in question is important to the interpretation of this work, we additionally verify that the choice of isolation criterion does not affect our results; we refer the reader to Appendix A for a discussion therein.
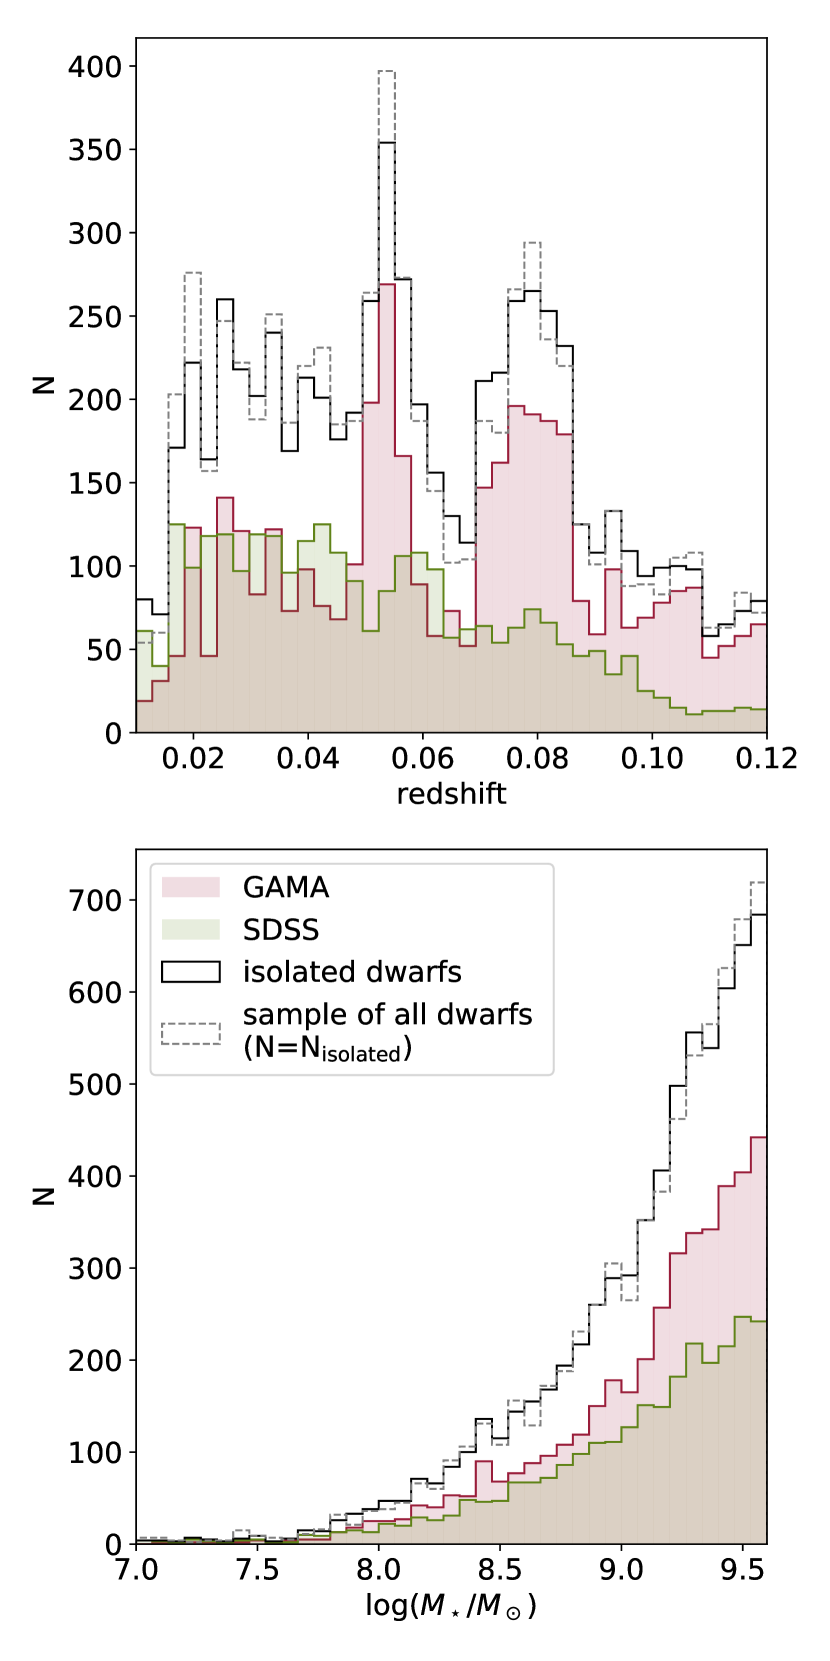
These distance cuts leave a final sample of 6875 galaxies; 3169 of these galaxies have spectra from SDSS, and 4034 have spectra from GAMA. Of these, 520 galaxies have spectra from both SDSS and GAMA. In Figure 1, we show the distribution of the GAMA and SDSS dwarfs as a function of redshift (top) and stellar mass (bottom). We also show the distribution of the isolated dwarf sample in black. To show that the isolation cut does not introduce a shift in the redshift or stellar mass of the parent sample, we also show a random subset of 6875 galaxies from the full dwarf sample as the dashed grey histogram.
Though the distribution of the SDSS and GAMA galaxy samples are markedly different in redshift and stellar mass, we will show that we reach the same conclusions when considering only the SDSS or only the GAMA sample. In cases where spectra from both SDSS and GAMA are available, we prioritize measurements from GAMA because the spectra are deeper. This will be discussed more fully in Section 3 and Appendix A.
3 Tidal Feature Detection
From previous work, the fraction of dwarf galaxies that host tidal features detectable in HSC-SSP is likely on the order of a few percent (Paudel et al., 2018); though it is possible to select tidal feature hosts via visual inspection, constructing an automatic detection algorithm is a significantly more scalable approach. Towards this end, we use an updated version of the tidal feature detection algorithm presented in Kado-Fong et al. (2018) to automatically identify tidal features around dwarf galaxies. These tidal feature hosts are selected from the sample of 6875 field dwarfs identified in Section 2.2.
3.1 Updates to the method of Kado-Fong et al. (2018)
The main purpose of the algorithm presented in Kado-Fong et al. (2018) is to detect tidal features against the smooth background of a host galaxy by leveraging the contrasting spatial scales of the tidal feature and the host halo. To do so in a way that is independent of the morphology of the host, we decompose the image into coefficients of increasing spatial scale. Tidal debris candidates are then identified as contiguous structures in the spatial decomposition.
Here, we summarize the updated detection algorithm. For the full details of the updates made to the method, see Appendix B.
In order to detect tidal features on a variety of spatial scales, we decompose the image of the target galaxy into wavelet coefficients of increasing characteristic length; specifically, we use the starlet transform of Starck et al. (2015). Low surface brightness features are detected in each coefficient independently and assigned to the most probable host galaxy (as determined by flux-weighted distance). Tidal features are detected independently in the gHSC, rHSC, and iHSC band images; tidal features must be detected in at least two bands in order to be accepted as part of the final detection map.
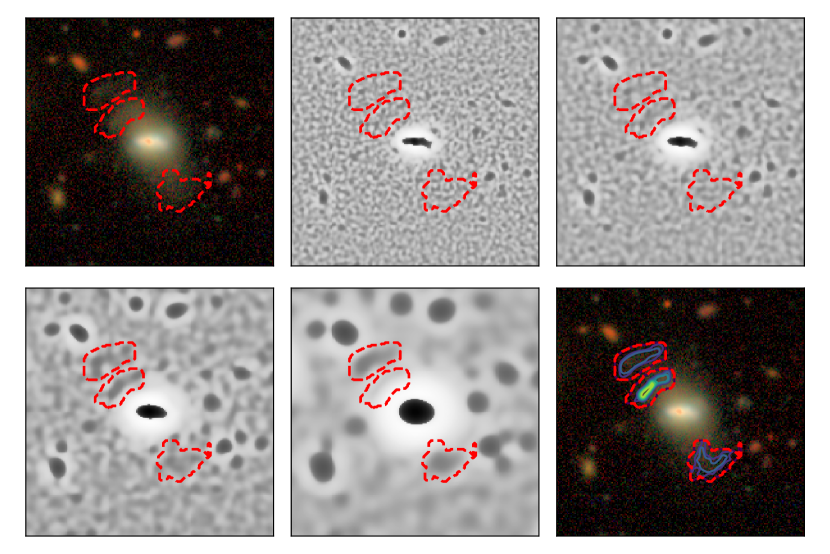
In Figure 2 we illustrate the detection method of a galaxy in our sample. The RGB images show the composite image of the galaxy, while the grey scale images show the wavelet coefficients (the first wavelet coefficient is not shown) of the band image. The full detection map is shown in the bottom right panel of the figure.
We apply this algorithm to the sample of 6875 field dwarfs, and identify 226 dwarfs with detectable low surface brightness debris.
3.2 Construction of the visual sample
The main purpose of the algorithm described above is to avoid the need to visually classify the full sample. However, because the morphology of many dwarf galaxies are irregular, there exist ambiguous cases in which the origin of a possible tidal feature is unclear. To ensure that the inclusion of such ambiguous cases does not bias our results, we visually inspect the automated sample and construct a “visual sample” subset that consists of only tidal feature systems that are unambiguously the result of a merger with another dwarf galaxy. We follow the benchmarks set forward in Paudel et al. (2018), and generally look for the morphology of the detected LSB feature to be inconsistent with extended irregular structure or flocculent spiral arms.
We find that 101 galaxies out of the 226 in the automated sample host unambiguous signs of a dwarf-dwarf merger, and are included in the visual sample. We find four general classes of rejected objects: tidal arms/stirring, amorphous and asymmetric LSB structure, false detections from overlapping sources, and false detections from imaging artifacts. Though the existence of extended tidal arms is a signpost of interaction, such features can be formed both from an interaction with an equal mass companion (Toomre & Toomre, 1972) and during an interaction with a more massive galaxy (see, e.g. Villalobos et al., 2012; Paudel & Ree, 2014; Hendel & Johnston, 2015). Because the dwarf galaxies are selected to be isolated, we expect that the majority of these cases are indeed due to dwarf-dwarf mergers, but there may be some exceptions. Tidal arms account for 50% of the ambiguous galaxies. The formation mechanism behind individual amorphous and asymmetric LSB structures is unclear, and may be due to secular mechanisms; such cases account for 39% of the ambiguous sample. Finally, false detections due to overlapping sources (e.g. overlapping tidal features, galactic cirrus) and false detections due to imaging artifacts account for 6% and 5% of the ambiguous sample, respectively. False detections thus account for 6% of the total automated sample. Because some of the ambiguous cases are consistent with being formed via an interaction with a more massive galaxy, here we re-emphasize that our choice of isolation criterion does not affect our results (see Appendix B).
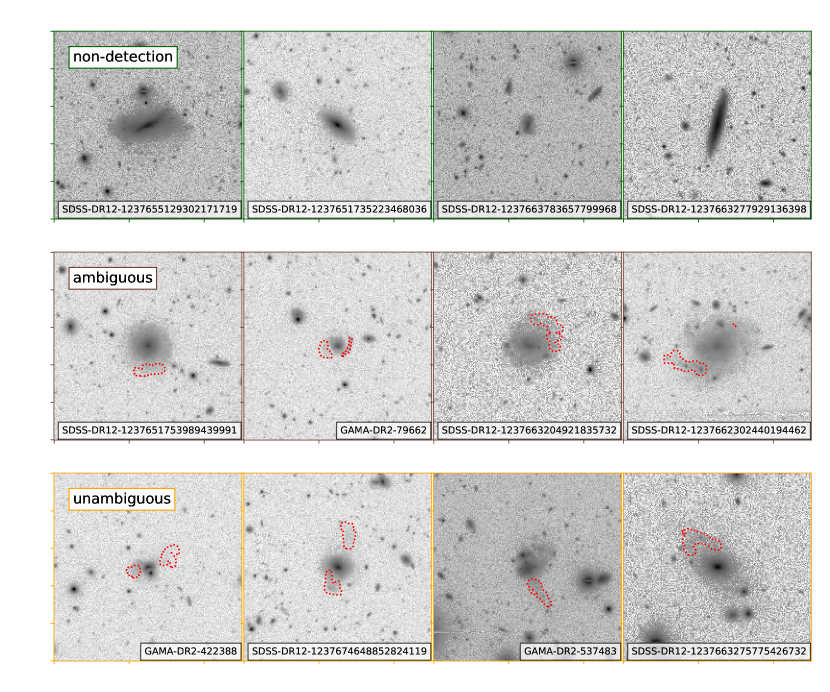
Figure 3 shows a selection of example galaxies with no tidal feature detection (top row, green outlines), with an ambiguous detection (middle row, brown outlines), and with an unambiguous detection (bottom row, orange outlines).
We will use this visual sample to demonstrate that when considering trends with respect to the presence of tidal features, our results are unchanged whether or not ambiguous cases are included. When considering an individual galaxy or when asking a question that requires tidal features that are photometric quality, we recommend using the visual sample to determine whether there are unambiguous signs of merging between dwarf galaxies. As we will show below, however, we find no statistical differences in the population properties of interest between the automated sample and visual sample. In Table 1 we provide a summary of the total, field, and interacting dwarf samples.
We publish our catalog of dwarf-dwarf mergers (and non-detections) in machine-readable format along with this work. For the reader’s convenience, we include stellar mass estimates, H flux and equivalent width measurements, and colors in the catalog. A sample of this table is given in Table 2.
| N | Ndetection | |
|---|---|---|
| all dwarfs | 8412 | 284 |
| field dwarfs | 6875 | 226 |
| visual sample | – | 101 |
4 Results
In total, our automated sample consists of 226 galaxies; 101 of these galaxies make up the visual sample (i.e. are visually confirmed to be unambiguous merger debris).
We therefore find a total tidal feature detection fraction of 3.29% in the automated sample and 1.5% in the visual sample. When considering only those host galaxies at , we find a tidal feature detection fraction of 6.1% in the automated sample and 2.6% in the visual sample. We consider a more detailed analysis of our completeness as a function of host stellar mass and redshift in Section 4.1.
4.1 Completeness of the automated and visual samples
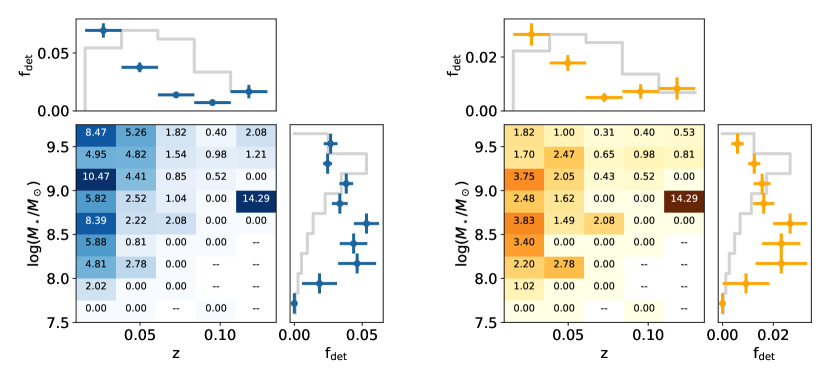
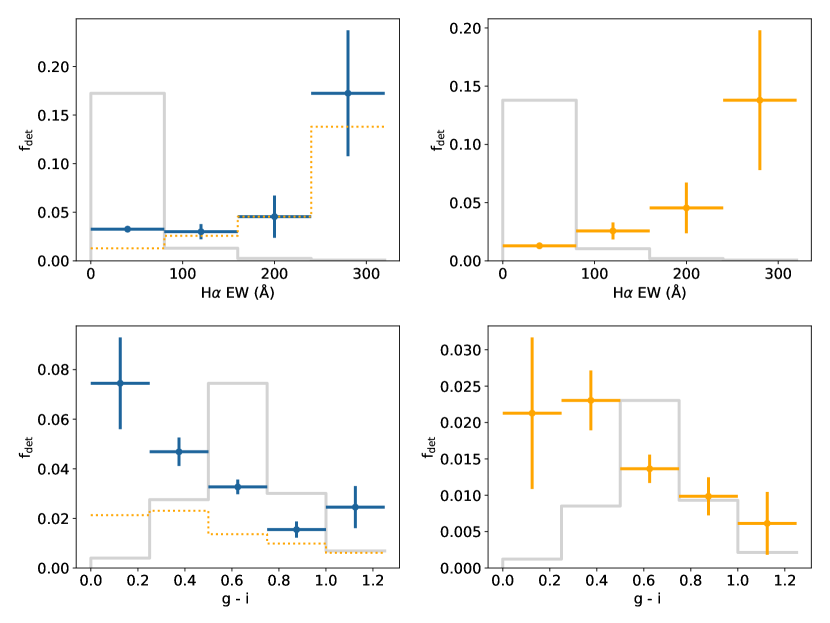
In Figure 4 and Figure 5 we show the statistical properties of the automated and visual sample in blue and orange, respectively. In particular, we note that although the absolute fraction of galaxies with tidal features is shifted down for the visual sample, there is no significant shift in the relative tidal feature detection fraction as a function of any of the host galaxy properties that we examine.
In particular, Figure 4 shows the detection fraction for the automated sample and visual sample as a function of host galaxy mass and redshift. The main panels show the tidal feature detection fraction at a given redshift and host stellar mass, while the framing panels show the detection fraction projected along stellar mass (right) and redshift (top).
Both when considering host stellar mass and host redshift, we see that the distribution of host galaxy properties does not change significantly between the automated sample and the visual sample. In particular, we find that the redshift of 50% relative completeness is approximately for both samples. Our absolute completeness is unknown, though our previous study at higher masses indicated that this algorithm is sensitive to tidal debris down to mag arcsec-2 and decreases in completeness for very bright ( mag arcsec-2) features (Kado-Fong et al., 2018). Nevertheless, we can measure our relative completeness by comparing to the tidal feature detection fraction at the low redshift end of our sample (6.1% and 2.6% at ) in our sample and making the assumption that there is no astrophysical change in true tidal feature occurrence fraction within the redshift range considered.
Similarly, we see that at the lowest redshift bin, where we are most complete, the tidal feature detection fraction decreases as host stellar mass decreases at stellar masses ). This can be understood by noting that as the host stellar mass decreases, the stellar surface density of tidal debris generated from a merger at a given mass ratio decreases.
Because the difference in the distribution of tidal feature detection fractions for the automated and visual sample is not statistically significant, we conclude that astrophysical contamination by features that are not related to recent accretion events does not significantly affect the outcome of our results. We furthermore conclude that some of the visually ambiguous features in the sample are indeed tidal in nature.
4.2 Detection fraction and star formation
In order to probe the effect of host star formation rate on the tidal feature incidence rate, we show the tidal feature detection fraction as a function of host H equivalent width and of host (g - i) color from SDSS in Figure 5. Here, we use host colors from SDSS because the centers of a subset of the brighter galaxies in our sample are saturated in HSC imaging. Again, we find no significant difference between the distribution of the automated and visual sample when considering tracers of star formation.
We find that the tidal feature detection fraction decreases monotonically as a function of host (g - i) color, with the detection fraction of the bluest host galaxies () a factor of higher than that of the reddest hosts () for both the automated and visual sample.
To show that star formation rate does indeed drive this color dependence, we also show the tidal feature detection fraction as a function of H equivalent width. At this mass range, almost the entirety () of galaxies accessible to the SDSS and GAMA spectroscopic surveys are star forming with . As can be seen in Figure 5, we find that the fraction of galaxies that host detectable tidal features increases as a function of H equivalent width.
Figure 5 shows the results when considering the galaxies observed in the GAMA and SDSS spectroscopic surveys together. To confirm that the dependence of tidal feature detection fraction on SFR is not a manifestation of the nature of the parent sample, in Appendix A we show that we find the same result when considering the GAMA and SDSS galaxies separately.
If we define the starbursting sample as those hosts with H equivalent widths greater than 100Å (Lee et al., 2009; Stierwalt et al., 2015), we find that 4.8% of the starbursts host detectable tidal features. In the highest H equivalent width bin (240EW320Å), the fraction of galaxies that host tidal features grows to 17%, albeit with large uncertainty as there are only 29 dwarfs in this bin, 5 of which show signs of a merger.
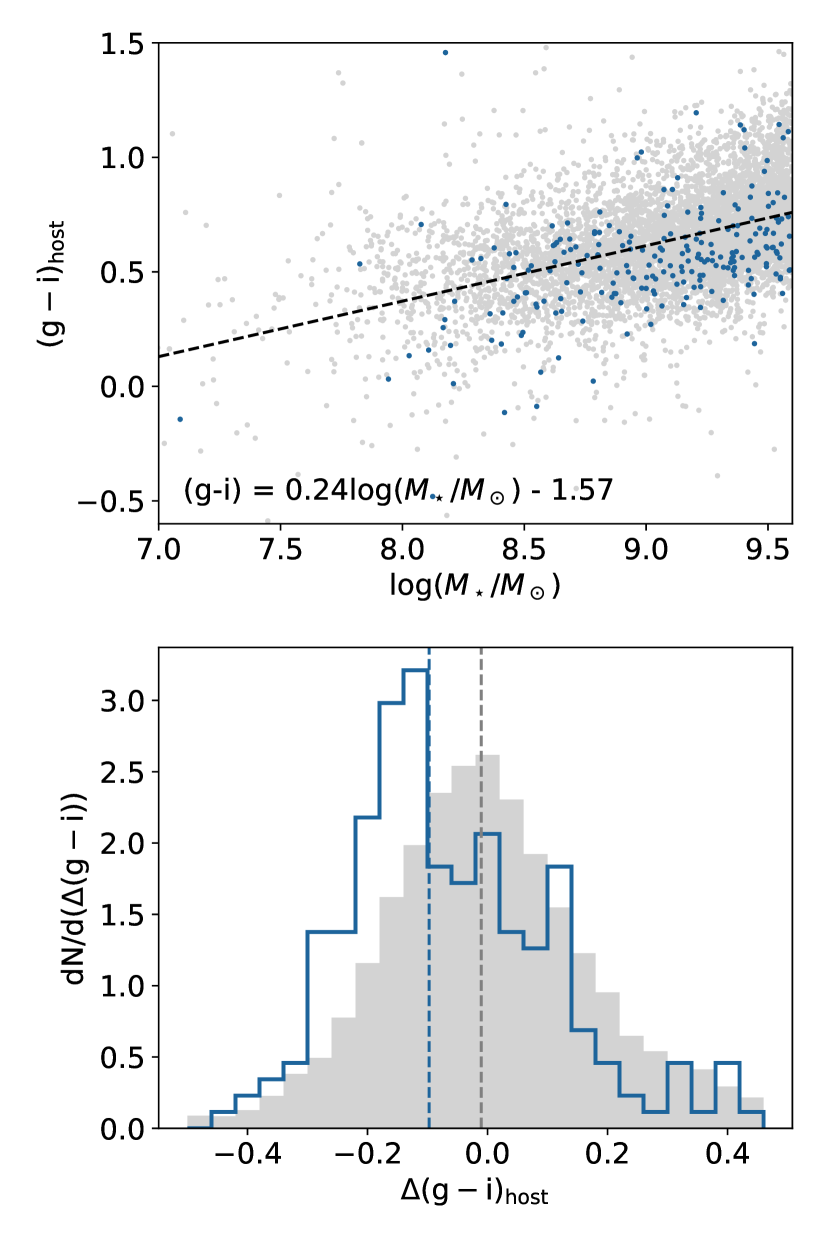
4.3 Host color vs. stellar mass
In the top panel of Figure 6, we show as a function of host galaxy mass for the tidal feature hosts in blue and the centers of apparently non-interacting field dwarfs (selected using the same nearest neighbor cut as for the tidal feature hosts) in grey. The top panel scatter points show values for individual systems, while the bottom panel shows the deviation of the central color from a fit to the colors of the non-interacting hosts.
This illustrates that for their stellar mass, the central SDSS color of the visual sample tidal features hosts are slightly bluer than the isolated dwarfs in which we detect no tidal features, with the median values differing by (where refers to the median).
Because this analysis is sensitive to host stellar mass, we verify that the results do not change under the following modifications: neglecting the shift in stellar mass applied to the SDSS-derived quantities in Section 2.2 (), using only masses from SDSS measurements (), and using only masses from GAMA measurements (). In all cases, the tidal feature hosts remain bluer than their non-interacting counterparts and the deviation from the fiducial value of is small (). We repeat this analysis using H derived star formation rates of the SDSS galaxies, and find a statistically significant shift () with a median increase in SFR of 0.07 dex for the tidal feature hosts. We do not correct for reddening, as the measured Balmer decrements of the sample imply a negligible correction.
4.4 Tidal Feature and Host Morphology
Although we do not visually classify the morphology in the full sample, we make a brief points on the tidal feature morphology present in the sample.
In particular, we note that there exists a significant population of dwarf galaxies that host stellar shells, similar to those observed in higher mass galaxies (Atkinson et al., 2013; Carlsten et al., 2017; Hood et al., 2018; Kado-Fong et al., 2018). Such shells have also been observed around early-type dwarf galaxies in the Virgo Cluster (Paudel et al., 2017).
In the literature, the formation of shells around galaxies is centered largely on the formation of shells around massive ellipticals. However, as observed in this sample, shells can also be formed around low-mass galaxies.
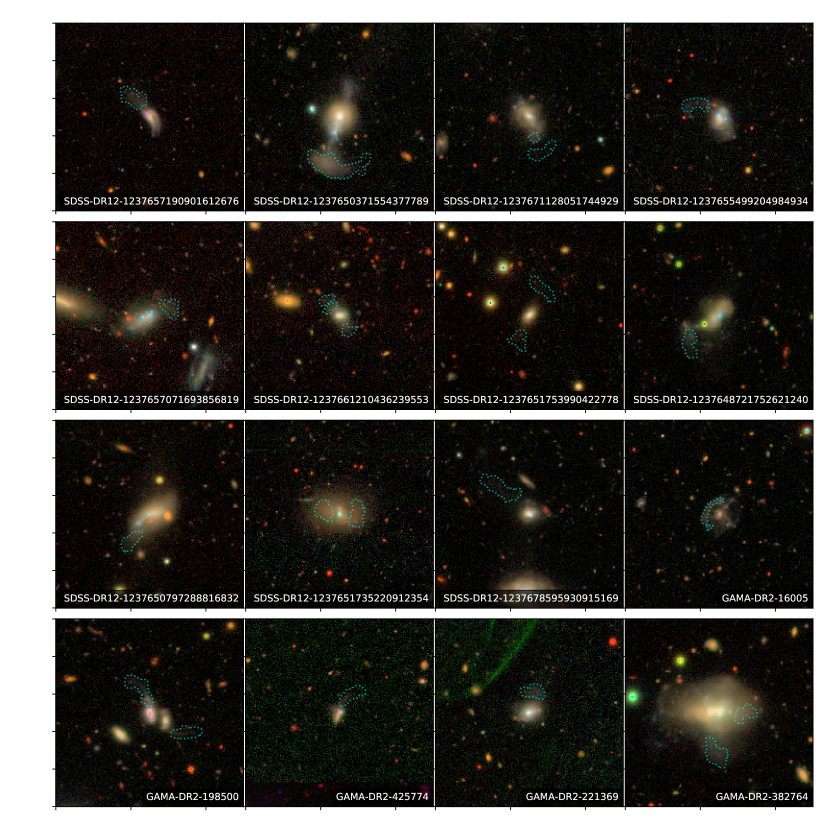
We also note that the starbursting galaxies in our sample that host tidal features have morphologies consistent with those of blue compact dwarfs (hereafter BCDs). Figure 7 shows gri composite images for the set of starbursting dwarfs with detected tidal features in the sample.
5 Discussion
5.1 The dwarf-dwarf merger sequence
The observed increase in the fraction of galaxies that host tidal features as a function of H equivalent width (see Figure 5) is consistent with the picture in which some fraction of starbursting dwarfs are undergoing a period of triggered star formation as the result of a merger with another dwarf galaxy.
We also find that dwarfs which host tidal features are systematically bluer than those that do not host detectable tidal features, as shown in Figure 6. This offset can be interpreted either as an increase in the star formation efficiency (here we define the star formation efficiency to be ) or the molecular gas fraction () in the post-merger galaxy (i.e. a movement down and to the right in - space), or as an increase in stellar mass while maintaining the same specific star formation rate (sSFR, such that sSFR=SFE) and central host color (i.e. a shift purely rightwards). We find that the median offset in host color can nominally be reproduced by assuming that all mergers are the result of an equal mass merger with no net change in the central host color. However, this interpretation cannot explain the increase in the tidal feature detection rate as a function of star formation activity. We therefore conclude that the shift in host central color is connected to star formation triggered during the merger, rather than stellar mass build-up alone.
This picture of a merger-driven starburst is in good agreement with the results of Stierwalt et al. (2015), who find that dwarf galaxy pairs with projected separations of kpc in the TiNy Titans sample have a significantly higher starburst fraction than unpaired dwarfs. Similarly, Lelli et al. (2014) find that of a sample of 18 BCDs have a projected companion within 200 kpc, though they caution that they are not able to verify that the galaxies will or have collided. We also extend the results of Pustilnik et al. (2001), Östlin et al. (2001), and Lelli et al. (2014), who find high dwarf pair and interaction fractions for samples of galaxies known to be BCDs, to a larger sample of dwarf galaxies that span a range of morphologies and star formation rates.
This result can be interpreted in analog to the triggered starbursts observed in mergers between more massive galaxies (see, e.g. Hopkins et al., 2008; Ellison et al., 2018). However, to our knowledge there has not yet been an observational sample of merging dwarf galaxies that span a range of star formation activity in the field.
Though it is widely expected from simulations that mergers will quench star formation in massive post-merger systems, the nature of the quenching mechanism is still unclear. Quenching has been proposed to operate via gas ejection by galaxy-scale winds (see, for example, Hopkins et al., 2008), gas reservoir exhaustion via triggered star formation (e.g. Bekki, 1998), or by a highly turbulent post-merger ISM (Ellison et al., 2018). Assuming that the average merger rate increases with redshift (see, e.g. Fakhouri et al., 2010), the observation of dwarf-dwarf galaxies at without the presence of a significant quiescent population in the field implies that a merger between two dwarfs is not sufficient for long-term quenching. This apparent failure to quench may help to constrain both the physical processes that govern star formation in interacting dwarfs, and the mechanism behind quenching in higher mass systems.
5.2 Evidence for a merger pathway for BCD formation
We furthermore note that the morphologies of the most vigorously starforming galaxies are consistent with that of blue compact dwarfs (BCDs). BCDs are characterized by the presence of a small number of vigorously star forming regions that have a spectrum similar to that of HII regions (Bekki, 2008). Figure 7 shows our sample of starbursting dwarfs that host tidal features – though the low surface brightness outskirts of the galaxies increase the size of the galaxy, in shallower imaging only the compact star forming core regions would be observable. For example, UM454 (top row, third from left in Figure 7) was classified as a “dwarf HII hotspot”/BCD as early as Salzer et al. (1989).
It has been proposed by Bekki (2008) that a possible avenue of BCD formation is the merger between two field dwarf galaxies – the increase in the detection fraction for starburst galaxies is in good agreement with this formation mechanism. This formation mechanism also predicts that older stellar populations will be distributed preferentially towards the outskirts of the galaxy, in agreement with our observations.
5.3 The origin of non-interacting dwarf starbursts
A remaining open question is that of the chronological link between triggered star formation and tidal feature observability. Though the tidal feature detection fraction is significantly higher for high H EW galaxies than for the full sample, we do not see signatures of interaction around all starbursting dwarfs. Even when including the results from Stierwalt et al. (2015), who find an increase in the starburst fraction for dwarfs in pairs, currently detectable dwarf-dwarf interactions cannot account for the observed fraction of dwarfs that are currently in a starburst phase.
We consider three possibilities to explain the apparently non-interacting starbursting dwarfs: that the timescale of tidal feature observability is less than the timescale of elevated star formation, that starbursts can be triggered by mergers more minor than we are able to probe in this study, and that some fraction of dwarf starbursts are instigated by secular processes.
The first possibility, that the timescale of tidal feature observability is short relative to the timescale of elevated star formation rate, appears to be unlikely due to the long dynamical times in the outskirts of dwarf galaxies. Though the surface brightness of a tidal stream is expected to decay quickly in the first 2 Gyr (Johnston et al., 2001), we expect the starburst phase to be short relative to this timescale (Bekki, 2008).
The second possibility, that some starbursts are triggered by mergers more minor than those to which we are currently privy, almost certainly accounts for some fraction of dwarf starbursts. Though the connection between accretion event and starburst trigger is not easily made for individual objects, we note that the nearby starbursting dwarf NGC 4449 hosts a disrupting satellite with a stellar mass ratio near 50:1 (Rich et al., 2012; Martinez-Delgado et al., 2012). We are likely only sensitive to recent major mergers, where both progenitor galaxies carry significant gas reservoirs; however, Starkenburg et al. (2016a) showed that significant triggered star formation can occur in a 5:1 mass ratio merger, even when the incoming satellite is a dark halo.
Finally, secular mechanisms have long been considered as an explanation for dwarf starbursts. Elmegreen et al. (2012) suggests that the inspiral of massive gas clumps (on the order of a few percent of the total galaxy mass) can power starbursts in dwarf galaxies. Similarly, Noguchi (2001) suggests an explanation for BCD formation using a viscosity-driven mass transport and density threshold for star formation to explain to compact starforming clumps that characterize BCDs.
Because we are only sensitive to relatively major mergers between dwarf galaxies, we are not yet able to distinguish between the picture of a fully merger driven or partially secular explanation for such starbursts. However, deeper imaging will be able to more strongly constrain the contribution of minor mergers to the population of starbursting dwarfs. In the absence of this, it may also be possible to detect merging activity with lower mass and/or dark satellites via kinematic signatures (Starkenburg et al., 2016b).
6 Conclusions and Future Direction
In this work, we have presented a sample of 226 isolated dwarf galaxies with automatically detected signatures of recent merger activity selected from 6875 spectroscopically confirmed dwarfs in the SDSS and GAMA spectroscopic surveys. The catalog is available as a machine-readable table released with this work.
We find that the fraction of galaxies that host detectable tidal features increases strongly as a function of star formation activity, reaching a tidal feature detection of fraction of 15-20% at the highest H EW considered (Å), and that galaxies that host tidal features are systematically bluer than apparently non-interacting field dwarfs at the same stellar mass.
Because the origin of irregular LSB structure around dwarf galaxies can be ambiguous, we construct a visual sample of 101 galaxies that host unambiguous merger debris (see the bottom row of Figure 3). We find no evidence for a difference in the distribution of tidal feature detection fraction between the automated sample and visual sample as a function of H equivalent width, host color, host stellar mass, or host redshift. This implies that the automated sample is dominated by mergers between dwarf galaxies and that contamination (from secular irregular morphology, spiral arms, etc.) does not change the results presented in this study.
The dependence of tidal feature detection fraction on star formation activity supports claims that mergers between dwarf galaxies are able to trigger starbursts and form blue compact dwarfs (Bekki, 2008). Observations of dwarf galaxies in pairs also show an elevated starburst fraction (Stierwalt et al., 2015). However, it is not yet clear whether merger-driven starbursts can explain the entirety of the starbursting dwarf population.
These findings extend observations of star formation in the dwarf-dwarf merger sequence and show for the first time in a large sample that merger-driven star formation continues after coalescence, building upon the evidence for interaction-driven star formation seen in dwarf pairs (Stierwalt et al., 2015; Besla et al., 2018) and spatially resolved measurements of star formation in individual post-merger dwarf systems (Paudel et al., 2018; Annibali et al., 2019).
In order to compare these observations of dwarf-dwarf mergers to
expectations of hierarchical structure formation in CDM and
to predictions of star formation activity in low-mass systems, it is now
necessary to compare observations and simulations of mergers between
isolated dwarfs in an equivalent manner. Such studies have already been
executed for minor mergers with dark halos
(Starkenburg & Helmi, 2015; Starkenburg et al., 2016a, b), but expanded
work concerning the expected population of observable tidal features
around dwarf galaxies will provide a valuable point of comparison to
simulations.
We thank Gurtina Besla, Tjitske Starkenburg, Sarah Pearson, and Kathryn Johnston for constructive conversations regarding this work. We also thank the anonymous referee for their helpful and constructive comments.
This research made use of Astropy, a community-developed core Python package for Astronomy (The Astropy Collaboration et al., 2018).
The Hyper Suprime-Cam (HSC) collaboration includes the astronomical communities of Japan and Taiwan, and Princeton University. The HSC instrumentation and software were developed by the National Astronomical Observatory of Japan (NAOJ), the Kavli Institute for the Physics and Mathematics of the Universe (Kavli IPMU), the University of Tokyo, the High Energy Accelerator Research Organization (KEK), the Academia Sinica Institute for Astronomy and Astrophysics in Taiwan (ASIAA), and Princeton University. Funding was contributed by the FIRST program from Japanese Cabinet Office, the Ministry of Education, Culture, Sports, Science and Technology (MEXT), the Japan Society for the Promotion of Science (JSPS), Japan Science and Technology Agency (JST), the Toray Science Foundation, NAOJ, Kavli IPMU, KEK, ASIAA, and Princeton University.
GAMA is a joint European-Australasian project based around a spectroscopic campaign using the Anglo-Australian Telescope. The GAMA input catalogue is based on data taken from the Sloan Digital Sky Survey and the UKIRT Infrared Deep Sky Survey. Complementary imaging of the GAMA regions is being obtained by a number of independent survey programmes including GALEX MIS, VST KiDS, VISTA VIKING, WISE, Herschel-ATLAS, GMRT and ASKAP providing UV to radio coverage. GAMA is funded by the STFC (UK), the ARC (Australia), the AAO, and the participating institutions. The GAMA website is http://www.gama-survey.org/ .
The Pan-STARRS1 Surveys (PS1) have been made possible through contributions of the Institute for Astronomy, the University of Hawaii, the Pan-STARRS Project Office, the Max-Planck Society and its participating institutes, the Max Planck Institute for Astronomy, Heidelberg and the Max Planck Institute for Extraterrestrial Physics, Garching, The Johns Hopkins University, Durham University, the University of Edinburgh, Queen’s University Belfast, the Harvard-Smithsonian Center for Astrophysics, the Las Cumbres Observatory Global Telescope Network Incorporated, the National Central University of Taiwan, the Space Telescope Science Institute, the National Aeronautics and Space Administration under Grant No. NNX08AR22G issued through the Planetary Science Division of the NASA Science Mission Directorate, the National Science Foundation under Grant No. AST-1238877, the University of Maryland, and Eotvos Lorand University (ELTE).
This paper makes use of software developed for the Large Synoptic Survey Telescope. We thank the LSST Project for making their code available as free software at http://dm.lsst.org.
Based in part on data collected at the Subaru Telescope and retrieved from the HSC data archive system, which is operated by the Subaru Telescope and Astronomy Data Center at National Astronomical Observatory of Japan.
Funding for SDSS-III has been provided by the Alfred P. Sloan Foundation, the Participating Institutions, the National Science Foundation, and the U.S. Department of Energy Office of Science. The SDSS-III web site is http://www.sdss3.org/.
SDSS-III is managed by the Astrophysical Research Consortium for the Participating Institutions of the SDSS-III Collaboration including the University of Arizona, the Brazilian Participation Group, Brookhaven National Laboratory, Carnegie Mellon University, University of Florida, the French Participation Group, the German Participation Group, Harvard University, the Instituto de Astrofisica de Canarias, the Michigan State/Notre Dame/JINA Participation Group, Johns Hopkins University, Lawrence Berkeley National Laboratory, Max Planck Institute for Astrophysics, Max Planck Institute for Extraterrestrial Physics, New Mexico State University, New York University, Ohio State University, Pennsylvania State University, University of Portsmouth, Princeton University, the Spanish Participation Group, University of Tokyo, University of Utah, Vanderbilt University, University of Virginia, University of Washington, and Yale University.
Appendix A Isolation and sample selection: robustness tests
A.1 Isolation Criteria
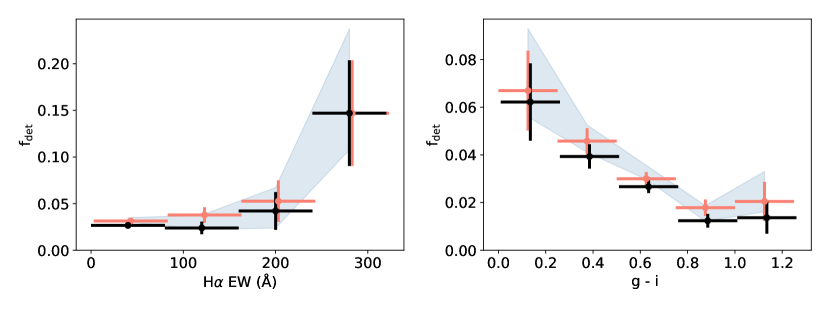
It is necessary for this work to create a sample of isolated dwarfs. However, there exist cases in which different isolation criteria disagree on whether a dwarf can be considered isolated. To ensure that our results are not influenced by these cases, we re-analyze our automated sample with an additional isolation criterion.
We adopt the isolation criterion of Paudel et al. (2018) because the scope of the work was to identify mergers between dwarf galaxies. Paudel et al. (2018) required that the dwarf be separated by at least 700 kpc in projection and 700 km s-1 from its nearest massive neighbor, where we adopt a mass cut of such that the median stellar mass of the massive neighbors coincides with that reported by Paudel et al. (2018). This method produces a sample of 231 isolated dwarfs, as compared to 226 in the original isolated sample. There are 191 dwarfs that are classified as isolated by both samples; there are 20 dwarfs that are classified as isolated by the original criterion and not by the secondary criterion, and 40 dwarfs that are classified as isolated by the secondary and not the original criterion.
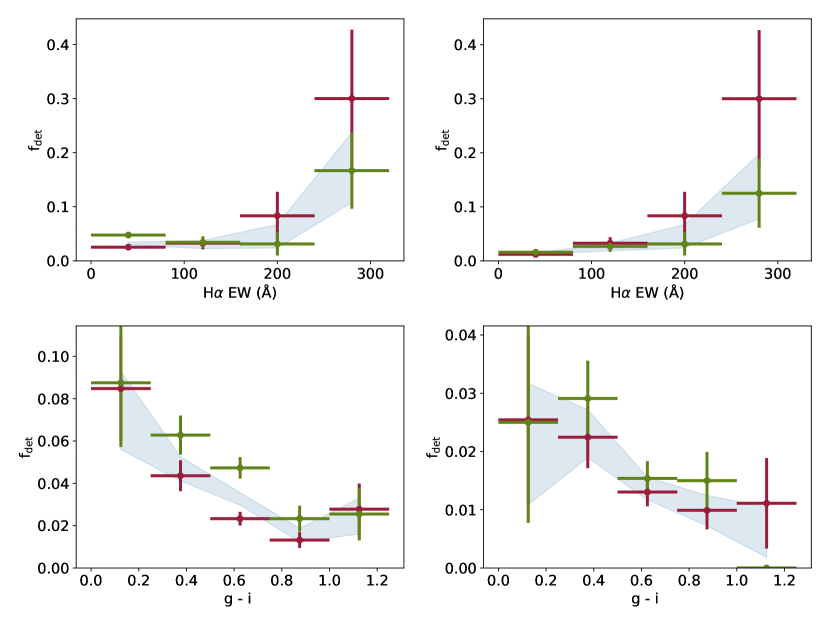
We compare this new isolated dwarf sample and the intersection of the two isolated samples to the original isolated dwarf sample in Figure 8. The left panel shows the detection fraction as a function of H equivalent width, while the right panel shows the same as a function of SDSS (g - i) color. The blue shaded regions show the results for the original sample, the pink errorbars for the new isolated dwarf sample, and the black errorbars for the intersection of the two samples. Each case produces statistically consistent results, from which we conclude that our results are not driven by contamination by non-isolated dwarf galaxies.
A.2 The GAMA and SDSS samples
Given the heterogeneous characteristics of a sample constructed by combining dwarf galaxies observed by the GAMA and SDSS campaigns, we would like to confirm that we retrieve the same results when considering the two samples separately.
Figure 9 is a variation of Figure 5, which presents the tidal feature detection fraction as a function of indications of star formation activity. In Figure 9, the results from the GAMA survey (red) and the SDSS survey (green) are shown separately, while the grey shaded region shows the results for the combined sample. The results obtained from the separated samples are in good agreement with each other and with the results of the combined sample. We thus conclude that the dependence on star formation activity that we observe is not driven by the effective selection function of the parent sample.
Appendix B Updates to the detection algorithm
The updated tidal feature detection algorithm that we employ in this work differs from the original method in several points. First, we now use the starlet wavelet transform (Starck et al., 2015) to decompose the input image into starlet coefficients that probe a specific spatial scale (previously, we used a modification of the starlet transform that did not probe as large a range of spatial scales). We also now perform multiscale image segmentation to create three dimensional (position-position-wavelet coefficient) maps of the LSB debris, remove neighbors and spiral arms in an automated manner, and use flux-weighted nearest neighbor clustering to identify the most probable host for detected LSB features.
We now use the Python package sep (Barbary, 2016), an implementation of the detection algorithm developed in Bertin & Arnouts (1996), to detect faint features in each difference image individually, and construct a final detection map from the features detected at each spatial scale. We detect features at greater than significance in the logarithmic image. This change makes it possible to detect more extended LSB features that overlap with a large number of foreground and/or background sources; because compact sources have power only at small spatial scales, detecting features at each starlet coefficient separately allows for “deblending” as a function of characteristic spatial extent. To ensure that this change does not characterize the halos of faint sources as tidal features around bright sources, we require that the flux-weighted center of each tidal feature be separated from the flux-weighted center of any source by at least 10 pix, set to be approximately twice the PSF FWHM of the worst seeing band ().
We wish to limit contamination from spiral arms and faint neighbors. To do so, we consider the asymmetry and clumpiness of the detected candidate tidal feature system. We follow the historical definition of asymmetry, using
| (B1) |
where and are the flux at position and the flux at position when the image is rotated by 180 degrees, respectively. We additionally define the clumpiness of the light in the detected LSB debris to be
| (B2) |
In a forthcoming work, we will optimize the values of and with respect to a visually labeled sample of massive galaxies (Kado-Fong et al. in prep.). For this work, however, we choose relatively liberal thresholds that may decrease the purity of our sample ( and ), and instead show that our results are unchanged whether we consider the automated detection sample or the systems that show unambiguous merger debris.
Finally, we consider that not all low surface brightness debris in the image cutout is necessarily associated with our target galaxy. We first remove from the detection all features less than 10 pixels from the edge of the cutout. Then, we perform a flux-weighted nearest neighbor clustering in which each contiguous low surface brightness feature is assigned to its most probable host. To do so, we detect the host galaxies via sep in the original image and assign a weight inversely proportional to the host flux .
Each contiguous region of the candidate tidal feature system is then assigned to its most probable host by minimizing the weighted distance between the center of light of the contiguous region and those of the potential host galaxies. That is to say, the most probable host minimizes .
The full detection process is performed independently for the , , and bands. Only detected regions that are present in at least two of bands are retained. This decision is in contrast to that of Kado-Fong et al. (2018), in which only the band with the best average seeing (the band) was considered. This change was made to remove artifacts via their non-astrophysical colors.
Appendix C The Dwarf-dwarf merger catalog
The galaxies presented in this sample are cataloged and made available via an associated machine-readable table. In Table 2, we give the positions and classifications of the sources, as well as the stellar mass, color, and H measurements collated from the GAMA and SDSS catalogs. We note that we have found three cases in which galaxies are duplicated in the parent sample, either when multiple spectroscopic observations of the same galaxy are marked as distinct objects, or when GAMA and SDSS spectra are assigned to separate objects in the HSC catalog cross-match. We have noted these duplications in the publicly released catalog. However, because we have not inspected every galaxy in the parent sample, and so that it is possible to reproduce the parent sample from the constituent datasets, we do not remove the galaxies from the released catalog. Because these duplications account for a small minority of cases, they do not have a significant impact on the conclusions of this work.
| HSC spec-z ID | Spec-z Name | RA | Dec | H EW | automated2 | visual3 | notes5 | ||||||
|---|---|---|---|---|---|---|---|---|---|---|---|---|---|
| arcsec | deg | deg | mag | Å | |||||||||
| 2895601 | –4 | 0.06 | 332.76773 | 0.95149 | 0.04 | 9.06 | 0.67 | 23.93 | 73.78 | 1.25 | False | False | |
| 4043445 | –4 | 0.54 | 18.5433 | -0.97198 | 0.03 | 8.82 | 0.57 | 30.67 | 80.58 | 2.01 | False | False | |
| 4089749 | –4 | 0.55 | 351.66805 | 0.59715 | 0.03 | 8.61 | 0.19 | 24.90 | 58.23 | 1.89 | False | False | |
| 4042347 | –4 | 0.37 | 333.50968 | -1.03902 | 0.06 | 9.29 | 0.36 | 73.27 | 267.76 | 3.80 | False | False | |
| 4056352 | –4 | 0.09 | 345.33271 | -0.654 | 0.08 | 9.49 | 0.75 | 55.90 | 344.49 | 3.74 | False | False | |
| 4056302 | –4 | 0.23 | 342.39448 | 0.1745 | 0.02 | 8.39 | 0.55 | 38.56 | 169.98 | 2.82 | False | False | |
| 4074108 | –4 | 0.19 | 357.97018 | 0.75497 | 0.04 | 9.19 | 0.41 | 77.19 | 504.49 | 4.75 | False | False | |
| 4042561 | –4 | 0.14 | 344.35628 | -0.55424 | 0.05 | 7.83 | 1.06 | 14.87 | 86.95 | 3.08 | False | False |
1 The distance between the center of the HSC photometric detection and its nearest spectroscopic counterpart.
2 This flag indicates whether the galaxy hosts automatically detected LSB debris.
3 This flag indicates whether the LSB debris around the host has been noted as a visually unambiguous product of a dwarf-dwarf merger.
4 The ID assigned to the galaxy by the survey from which the redshift is sourced. Due to formatting constraints, we have omitted this column from the text. This information is included in the full machine-readable table associated with this work.
5 Notes associated with the source. This is primarily used as a duplicate source flag.
References
- Aihara et al. (2018a) Aihara, H., Armstrong, R., Bickerton, S., et al. 2018a, PASJ, 70, S8
- Aihara et al. (2018b) Aihara, H., Arimoto, N., Armstrong, R., et al. 2018b, PASJ, 70, S4
- Aihara et al. (2019) Aihara, H., AlSayyad, Y., Ando, M., et al. 2019, arXiv e-prints, arXiv:1905.12221
- Aloisi et al. (2007) Aloisi, A., Clementini, G., Tosi, M., et al. 2007, ApJ, 667, L151
- Annibali et al. (2013) Annibali, F., Cignoni, M., Tosi, M., et al. 2013, AJ, 146, 144
- Annibali et al. (2016) Annibali, F., Nipoti, C., Ciotti, L., et al. 2016, The Astrophysical Journal Letters, 826, L27
- Annibali et al. (2019) Annibali, F., Bellazzini, M., Correnti, M., et al. 2019, arXiv e-prints, arXiv:1904.01986
- Atkinson et al. (2013) Atkinson, A. M., Abraham, R. G., & Ferguson, A. M. N. 2013, ApJ, 765, 28
- Baldry et al. (2018) Baldry, I. K., Liske, J., Brown, M. J. I., et al. 2018, MNRAS, 474, 3875
- Barbary (2016) Barbary, K. 2016, The Journal of Open Source Software, 1, 58
- Bekki (1998) Bekki, K. 1998, ApJ, 502, L133
- Bekki (2008) —. 2008, MNRAS, 388, L10
- Bertin & Arnouts (1996) Bertin, E., & Arnouts, S. 1996, A&AS, 117, 393
- Besla et al. (2018) Besla, G., Patton, D. R., Stierwalt, S., et al. 2018, MNRAS, 480, 3376
- Binggeli et al. (1988) Binggeli, B., Sandage, A., & Tammann, G. A. 1988, ARA&A, 26, 509
- Blanton et al. (2011) Blanton, M. R., Kazin, E., Muna, D., Weaver, B. A., & Price-Whelan, A. 2011, AJ, 142, 31
- Bosch et al. (2018a) Bosch, J., Armstrong, R., Bickerton, S., et al. 2018a, PASJ, 70, S5
- Bosch et al. (2018b) —. 2018b, PASJ, 70, S5
- Carlsten et al. (2017) Carlsten, S. G., Hau, G. K. T., & Zenteno, A. 2017, MNRAS, 472, 2889
- Chabrier (2003) Chabrier, G. 2003, ApJ, 586, L133
- Conroy et al. (2009) Conroy, C., Gunn, J. E., & White, M. 2009, ApJ, 699, 486
- Coupon et al. (2018) Coupon, J., Czakon, N., Bosch, J., et al. 2018, PASJ, 70, S7
- Dawson et al. (2013) Dawson, K. S., Schlegel, D. J., Ahn, C. P., et al. 2013, AJ, 145, 10
- Deason et al. (2014) Deason, A., Wetzel, A., & Garrison-Kimmel, S. 2014, ApJ, 794
- Ellison et al. (2018) Ellison, S. L., Catinella, B., & Cortese, L. 2018, MNRAS, 478, 3447
- Elmegreen et al. (2012) Elmegreen, B. G., Zhang, H.-X., & Hunter, D. A. 2012, ApJ, 747, 105
- Fakhouri et al. (2010) Fakhouri, O., Ma, C.-P., & Boylan-Kolchin, M. 2010, MNRAS, 406, 2267
- Furusawa et al. (2018) Furusawa, H., Koike, M., Takata, T., et al. 2018, PASJ, 70, S3
- Geha et al. (2012) Geha, M., Blanton, M. R., Yan, R., & Tinker, J. L. 2012, ApJ, 757, 85
- Greco et al. (2018) Greco, J. P., Greene, J. E., Strauss, M. A., et al. 2018, ApJ, 857, 104
- Hendel & Johnston (2015) Hendel, D., & Johnston, K. V. 2015, MNRAS, 454, 2472
- Hood et al. (2018) Hood, C. E., Kannappan, S. J., Stark, D. V., et al. 2018, ApJ, 857, 144
- Hopkins et al. (2008) Hopkins, P. F., Hernquist, L., Cox, T. J., & Kereš, D. 2008, ApJS, 175, 356
- Huang et al. (2018a) Huang, S., Leauthaud, A., Greene, J. E., et al. 2018a, MNRAS, 475, 3348
- Huang et al. (2018b) Huang, S., Leauthaud, A., Murata, R., et al. 2018b, PASJ, 70, S6
- Janowiecki & Salzer (2014) Janowiecki, S., & Salzer, J. J. 2014, ApJ, 793, 109
- Johnston et al. (2001) Johnston, K. V., Sackett, P. D., & Bullock, J. S. 2001, ApJ, 557, 137
- Kado-Fong et al. (2018) Kado-Fong, E., Greene, J. E., Hendel, D., et al. 2018, ApJ, 866, 103
- Kawanomoto et al. (2018) Kawanomoto, S., Uraguchi, F., Komiyama, Y., et al. 2018, PASJ, 70, 66
- Komiyama et al. (2018) Komiyama, Y., Obuchi, Y., Nakaya, H., et al. 2018, PASJ, 70, S2
- Kroupa (2001) Kroupa, P. 2001, MNRAS, 322, 231
- Lee et al. (2009) Lee, J. C., Kennicutt, Robert C., J., Funes, S. J. J. G., Sakai, S., & Akiyama, S. 2009, ApJ, 692, 1305
- Lelli et al. (2014) Lelli, F., Verheijen, M., & Fraternali, F. 2014, MNRAS, 445, 1694
- Martinez-Delgado et al. (2012) Martinez-Delgado, D., Romanowsky, A. J., Gabany, R. J., et al. 2012, The Astrophysical Journal Letters, 748, L24
- Miyazaki et al. (2018) Miyazaki, S., Komiyama, Y., Kawanomoto, S., et al. 2018, PASJ, 70, S1
- Noguchi (2001) Noguchi, M. 2001, ApJ, 555, 289
- Östlin et al. (2001) Östlin, G., Amram, P., Bergvall, N., et al. 2001, A&A, 374, 800
- Paudel & Ree (2014) Paudel, S., & Ree, C. H. 2014, ApJ, 796, L14
- Paudel et al. (2018) Paudel, S., Smith, R., Yoon, S. J., Calderón-Castillo, P., & Duc, P.-A. 2018, ApJS, 237, 36
- Paudel et al. (2017) Paudel, S., Smith, R., Duc, P.-A., et al. 2017, ApJ, 834, 66
- Privon et al. (2017) Privon, G. C., Stierwalt, S., Patton, D. R., et al. 2017, The Astrophysical Journal, 846, 74
- Pustilnik et al. (2001) Pustilnik, S. A., Kniazev, A. Y., Lipovetsky, V. A., & Ugryumov, A. V. 2001, A&A, 373, 24
- Reid et al. (2016) Reid, B., Ho, S., Padmanabhan, N., et al. 2016, MNRAS, 455, 1553
- Rich et al. (2012) Rich, R. M., Collins, M. L. M., Black, C. M., et al. 2012, Nature, 482, 192
- Sales et al. (2013) Sales, L. V., Wang, W., White, S. D. M., & Navarro, J. F. 2013, Monthly Notices of the Royal Astronomical Society, 428, 573
- Salzer et al. (1989) Salzer, J. J., MacAlpine, G. M., & Boroson, T. A. 1989, ApJS, 70, 479
- Starck et al. (2015) Starck, J.-L., Murtagh, F., & Bertero, M. 2015, Starlet Transform in Astronomical Data Processing, ed. O. Scherzer (New York, NY: Springer New York), 2053
- Starkenburg & Helmi (2015) Starkenburg, T. K., & Helmi, A. 2015, A&A, 575, A59
- Starkenburg et al. (2016a) Starkenburg, T. K., Helmi, A., & Sales, L. V. 2016a, A&A, 587, A24
- Starkenburg et al. (2016b) —. 2016b, A&A, 595, A56
- Stierwalt et al. (2015) Stierwalt, S., Besla, G., Patton, D., et al. 2015, The Astrophysical Journal, 805, 2
- Stierwalt et al. (2017) Stierwalt, S., Liss, S. E., Johnson, K. E., et al. 2017, Nature Astronomy, 1, 0025
- Strauss et al. (2002) Strauss, M. A., Weinberg, D. H., Lupton, R. H., et al. 2002, AJ, 124, 1810
- Taylor et al. (2011) Taylor, E. N., Hopkins, A. M., Baldry, I. K., et al. 2011, MNRAS, 418, 1587
- The Astropy Collaboration et al. (2018) The Astropy Collaboration, Price-Whelan, A. M., Sipócz, B. M., et al. 2018, ArXiv e-prints, arXiv:1801.02634
- Toomre & Toomre (1972) Toomre, A., & Toomre, J. 1972, ApJ, 178, 623
- Villalobos et al. (2012) Villalobos, Á., De Lucia, G., Borgani, S., & Murante, G. 2012, MNRAS, 424, 2401
- Wang et al. (2019) Wang, W., Han, J., Sonnenfeld, A., et al. 2019, MNRAS, 487, 1580