Coupled Magnetic and Superconducting Transitions in Sr2VO3FeAs Under Pressure
Abstract
We report muon spin rotation (SR) and magnetization measurements on superconducting Sr2VO3FeAs under pressure. At ambient pressure, Sr2VO3FeAs undergoes an antiferromagnetic transition of the V moments at and becomes superconducting at . As a function of pressure, initially decreases while increases. Surprisingly, once at 0.6 GPa, reverses its trend and increases together with suggesting that the static V magnetism is a prerequisite for superconductivity. We explain this cooperative coupling by a possible localization of the V 3d states below the magnetic transition which enables the nesting of the Fermi surface necessary for superconductivity.
Superconductivity and magnetism are normally considered to be antagonistic. Nonetheless, there are several examples of long range magnetic order coexisting with superconducting order. In cases with a large spatial separation of the localized orbitals of the atom responsible for the magnetism and the superconducting electron system, there is no or only a weak coupling between the two orders. Examples are the Chevrel phases (REMo6S8, RE = rare earth) Chevrel et al. (1971); Matthias et al. (1958), the borocarbides RENi2B2C Fertig et al. (1977); Lynn et al. (1997), the ruthenate RuSr2GdCu2O8 Bernhard et al. (1999); Lynn et al. (2000), and the iron based superconductor EuFe2As2 doped either with P or Ru Cao et al. (2011); Nandi et al. (2014). Sizable coupling has been observed for the ferromagnetic order below in UGe2 and URhGe Saxena et al. (2000); Huxley et al. (2001); Aoki et al. (2001). A coupling of antiferromagnetic (spin density wave, SDW) and superconducting order, can be observed at much higher temperatures, e.g., in iron based superconductors Luetkens et al. (2009); Park et al. (2009); Goko et al. (2009); Aczel et al. (2008); Ni et al. (2008); Chu et al. (2009); Lester et al. (2009); Bernhard et al. (2009); Wiesenmayer et al. (2011); Pratt et al. (2009); Christianson et al. (2009); Laplace et al. (2009). In the case of a microscopic coexistence, the coupling is normally found to be of a competitive nature Ni et al. (2008); Chu et al. (2009); Lester et al. (2009); Bernhard et al. (2009); Wiesenmayer et al. (2011); Pratt et al. (2009); Christianson et al. (2009); Laplace et al. (2009). In FeSe, the coupling changes from competitive at lower pressures to a cooperative behavior at higher pressures Bendele et al. (2010, 2012). Finding and understanding different forms of coexistence and coupling between magnetic and superconducting orders is not only relevant for the search for higher superconducting transition temperatures , but it might also be interesting for technical applications, if one order can be manipulated by controlling the other.
The iron based superconductor Sr2VO3FeAs exhibits superconductivity below at ambient pressure Zhu et al. (2009) and at Kotegawa et al. (2011). Sr2VO3FeAs is composed of alternating conducting FeAs and insulating Sr2VO3 buffer layers Zhu et al. (2009). Upon lowering the temperature, Sr2VO3FeAs undergoes an antiferromagnetic transition presumably of the V 3d moments before it becomes superconducting with the FeAs layer being non-magnetic Munevar et al. (2011); Hummel et al. (2013). Since the V 3d state is less localized than e.g. the Gd 4f state in RuSr2GdCu2O8 Bernhard et al. (1999); Lynn et al. (2000) and hybridizes with the Fe 3d state Shein and Ivanovskii (2009); Lee and Pickett (2010), Sr2VO3FeAs is expected to exhibit significant coupling between the superconducting and the magnetic order.
In this Letter we present a study of the coupling of superconducting and magnetic order in Sr2VO3FeAs under hydrostatic pressure up to by means of muon spin rotation and relaxation (SR) and dc-magnetization measurements. We find that the magnetic ordering temperature initially decreases with pressure, while the superconducting transition temperature increases. At a pressure of the two ordering temperatures become comparable. Surprisingly, at higher pressures, increases again together with , with the superconductivity setting in shortly below the magnetic order. We argue that the magnetic transition changes the electronic structure of the Sr2VO3 buffer layer and reduces the hybridization of the V 3d states with the Fe 3d states enabling the nesting features of the Fermi surface that are necessary for superconductivity. Therefore, in this system, the magnetic order of the V system is a prerequisite for the appearance of superconductivity in the FeAs layer.
Polycrystalline Sr2VO3FeAs was synthesized and characterized following Ref. Hummel et al. (2013). The sample contains Sr3V2O, orthorhombic Sr2VO4, and FeAs, but does not exhibit oxygen deficiency or V at the iron site. The superconducting transition temperature is and the diamagnetic shielding fraction is about . These values are comparably low, but similar values have been reported before Cao et al. (2010); Tegel et al. (2010). The superconducting volume fraction of our sample is undetermined since the relation to the diamagnetic shielding fraction is non-trivial for a polycrystalline sample with small grains. SR measurements were performed at the Swiss Muon Source SS using the GPS Amato et al. (2017) and GPD Khasanov et al. (2016) spectrometers. The data were analyzed with the free software package musrfit Suter and Wojek (2012). dc-magnetization measurements were performed using a commercial superconducting quantum interference device (SQUID) magnetometer. Hydrostatic pressure for the SR measurements was applied using a double-wall piston cell Khasanov et al. (2016). A CuBe anvil-type cell with diamond anvils was used for the dc-magnetization measurements. Pressures were determined by either In or Pb manometers Eiling and Schilling (1981) and Daphne 7373 oil was used as a pressure transmitting medium.
Figure 1(a) shows representative zero-field (ZF) muon spin polarization spectra . Down to , no sign of magnetism is observed, ruling out a magnetic transition claimed previously in the 150- temperature region Cao et al. (2010); Tatematsu et al. (2010). Below , the relaxation rate increases and spontaneous muon spin-precession with two distinct frequencies can be observed below , indicating the onset of static, long range magnetic order. The spectra were fitted by the sum of a paramagnetic [] and a magnetic [] contribution, assuming that the two distinct precession frequencies are due to two different muon stopping sites within the crystal lattice:
| (1) |
where
| (2) |
| (3) |
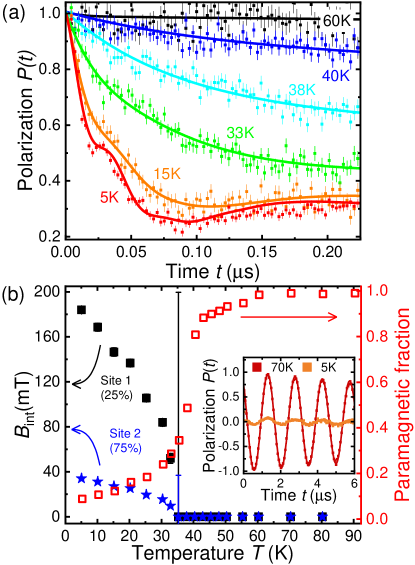
Here, is the magnetic volume fraction, is the fraction of muons stopping at site 1, is the muon’s gyromagnetic ratio, is the magnetic field at the respective muon site, and and are the so-called transverse and longitudinal relaxation rates for the respective muon site. The 2/3 (transverse) and 1/3 (longitudinal) components reflect the polycrystalline nature of the sample leading to a powder average of the internal fields with respect to the initial muon spin direction. The paramagnetic fraction is modelled by the product of a static Gauss-Kubo-Toyabe function Yaouanc and Dalmas De Réotier (2011) and an exponential relaxation with relaxation rate . To make the fit more stable and to reflect the fact that the muons at both stopping sites observe the same magnetic structure, just from different positions within the unit cell, the parameters and as well as and were coupled with a proportionality constant.
The analysis yields and . Figure 1(b) shows the temperature dependence of the internal fields at the muon stopping sites 1 () and 2 (). Also shown in Fig. 1(b) is the paramagnetic fraction () of the sample determined from the oscillation amplitude of the weak transverse-field (TF) SR spectra (c.f. inset of Fig. 1(b) for representative spectra). These data show that Sr2VO3FeAs exhibits static, long-range magnetic order with nearly full volume fraction that microscopically coexists with the superconducting volume of our sample. The internal field at site 2 is comparable to the single field reported in an earlier study on oxygen deficient Sr2VO3FeAs Munevar et al. (2011). The significantly larger internal field we detect at site 1 was not reported previously. Possibly, it was overlooked due to the small signal fraction () and the relatively strong damping. From the size of the internal field we can conclude that our results are in agreement with the estimate of per V from SR Munevar et al. (2011) and polarized neutron diffraction Hummel et al. (2013). It is worth noting that there is neither a reduction of (which is proportional to the ordered magnetic moment) nor a reduction of the magnetic volume fraction below . A reduction would be expected in case of competition between magnetic and superconducting order parameter or volume Bendele et al. (2010, 2012).
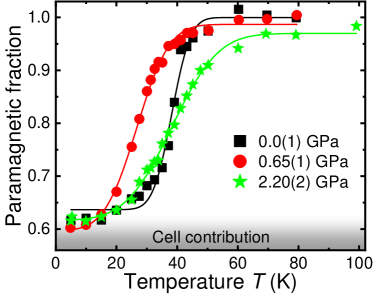
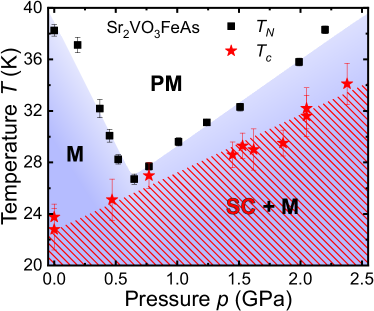
Motivated by the large and positive pressure effect on the superconducting transition temperature Kotegawa et al. (2009, 2011) we performed SR measurements under hydrostatic pressures up to . Figure 2 shows the paramagnetic fraction as a function of temperature determined by weak TF SR for representative pressures. Please note that of the muons stop in the pressure cell, meaning that for all pressures the magnetic fraction of the sample stays close to at low temperatures. Assuming a Gaussian distribution of magnetic transition temperatures , the temperature dependence of the paramagnetic fraction was modelled by a normal cumulative distribution function (solid lines in Fig. 2). Figure 3 shows the magnetic transition temperature determined from the midpoint of these curves. At ambient pressure, determined by this method coincides reasonably well with the onset of spontaneous muon spin precession observed by ZF SR.
In addition, we performed measurements of the superconducting transition temperature by means of SQUID magnetometry under pressure Sup . The obtained onset temperatures for superconductivity are depicted in Fig. 3. In agreement with the literature data, increases monotonically with pressure Kotegawa et al. (2009, 2011). The magnetic transition temperature however decreases with increasing pressure, until and become comparable at approximately . If the magnetic and superconducting order would not be coupled one would expect that continues to decrease. On the contrary, reverses the trend and starts to increase for higher pressures in concomitance with the increase of . The observation indicates that both orders are actually strongly coupled. This coupling seems to be non-competitive, given that the magnetic as well as the superconducting volume fraction do not change significantly under pressure.
A very similar result was obtained with our second, although less homogeneous, batch of Sr2VO3FeAs ( ) from a different source Sup . This shows that Fig. 3 exhibits in fact the intrinsic, reproducible phase diagram of Sr2VO3FeAs and that the apparent coupling of the magnetic and superconducting order is not a feature of a specific sample.
In the following we discuss a possible mechanism for the coupling of the magnetic and superconducting order based on the electronic properties of the FeAs and Sr2VO3 subsystems. Band structure calculations indicate that the hybridization of the V 3d state with the Fe 3d state are detrimental for the occurrence of superconductivity Shein and Ivanovskii (2009); Lee and Pickett (2010). 57Fe Moessbauer measurements in earlier studies as well as on our sample Munevar et al. (2011); Cao et al. (2010); Sup ; Kamusella and Klauss (2016); Häggström et al. (1989) show that the Fe moments do not participate in the static magnetic order and therefore imply V ordering. Reports on 51V and 75As nuclear magnetic resonance (NMR) are inconsistent since they either claim Fe magnetism Ueshima et al. (2014); Ok et al. (2017) or argue in favor of V magnetism Kotegawa et al. (2011); Tatematsu et al. (2010). NMR measurements on our sample Sup ; Suter et al. (1998) are in agreement with the literature data to a large extent, but cannot provide a conclusive answer as to which element carries the ordering moments. Also, it is not known whether the high magnetic fields required for NMR influence the magnetic properties in a significant way. Since 57Fe Moessbauer spectroscopy, like SR, is performed under (nearly) zero field conditions, we are confident that it is the V which magnetically orders in this case. In analogy to the Mott transition of V2O3 McWhan et al. (1973); Hansmann et al. (2013) it is likely that the magnetic transition in the Sr2VO3 buffer layer is accompanied by a substantial modification of its electronic structure and a localization of the V 3d states. With the therefore reduced hybridization of the V and Fe states, the Fermi surface would become dominated by the Fe 3d bands and exhibit the well-known nesting with a wave vector spanning the hole Fermi surfaces near and the electron Fermi surfaces near the M points Mazin (2010). A nested Fermi surface is believed to be the key feature promoting the electronic superconducting pairing via spin fluctuations in most Fe based superconductors Chubukov et al. (2008). The static magnetism in the vanadium oxide layer (and the likely reorganization of its electronic structure) is therefore a necessary prerequisite for the occurrence of superconductivity. The coupling is however mutual as can be seen from the joint increase of and above . Evidently, it is energetically favorable for the system to increase the magnetic transition temperature to gain superconducting condensation energy. The nature of the change in the electronic structure of the Sr2VO3 layer is not fully clear to date. Magnetic exchange splitting is too small to remove the V 3d bands from the Fermi level due to the relatively small ordered moment of Hummel et al. (2013). Photoemission spectroscopy Qian et al. (2011) and DFT calculations with a GGA+EECE (generalized gradient approximation + exact exchange of correlated electrons) functional Hummel et al. (2013) indicate that the V atoms are in a Mott state below the magnetic transition temperature. It is known that V2O3 exhibits a Mott-Hubbard transition from a paramagnetic metal to an antiferromagnetic insulator with decreasing temperature McWhan et al. (1973); Hansmann et al. (2013). However, a similar temperature induced transition of the electronic structure in Sr2VO3FeAs, if present, has not been confirmed so far.
In conclusion, we have shown that long range magnetic order is cooperatively coupled to the microscopically coexisting superconducting order in Sr2VO3FeAs. Initially, the application of hydrostatic pressure has opposite effects on the magnetic and superconducting transition temperatures, decreasing the former while increasing the latter until at . For higher pressures, both transition temperatures increase simultaneously and it appears that the magnetic order in the V system is a necessary condition for superconductivity. A possible coupling mechanism via the electronic properties of the FeAs and Sr2VO3 subsystems was proposed. Such a cooperative coupling, as observed in Sr2VO3FeAs, might be interesting for applications since getting control over one order would enable modifications of the other.
Acknowledgements.
This work is partially based on experiments performed at the Swiss Muon Source SS, Paul Scherrer Institute, Villigen, Switzerland. We gratefully acknowledge the financial support of S.H. by the Swiss National Science Foundation (SNF-Grant No. 200021-159736), of Z.S. by Horizon 2020 [INFRADEV Proposal No. 654000 World class Science and Innovation with Neutrons in Europe 2020(SINE2020)], and of H.O. by JSPS KAKENHI (Grant No. JP16H6439). S.H. thanks C. Wang for useful discussions.References
- Chevrel et al. (1971) R. Chevrel, M. Sergent, and J. Prigent, Journal of Solid State Chemistry 3, 515 (1971).
- Matthias et al. (1958) B. T. Matthias, H. Suhl, and E. Corenzwit, Physical Review Letters 1, 449 (1958).
- Fertig et al. (1977) W. A. Fertig, D. C. Johnston, L. E. DeLong, R. W. McCallum, M. B. Maple, and B. T. Matthias, Physical Review Letters 38, 987 (1977).
- Lynn et al. (1997) J. W. Lynn, S. Skanthakumar, Q. Huang, S. K. Sinha, Z. Hossain, L. C. Gupta, R. Nagarajan, and C. Godart, Physical Review B 55, 6584 (1997).
- Bernhard et al. (1999) C. Bernhard, J. L. Tallon, C. Niedermayer, T. Blasius, A. Golnik, E. Brücher, R. K. Kremer, D. R. Noakes, C. E. Stronach, and E. J. Ansaldo, Physical Review B 59, 14099 (1999).
- Lynn et al. (2000) J. W. Lynn, B. Keimer, C. Ulrich, C. Bernhard, and J. L. Tallon, Physical Review B 61, R14964 (2000).
- Cao et al. (2011) G. Cao, S. Xu, Z. Ren, S. Jiang, C. Feng, and Z. Xu, Journal of Physics: Condensed Matter 23, 464204 (2011).
- Nandi et al. (2014) S. Nandi, W. T. Jin, Y. Xiao, Y. Su, S. Price, D. K. Shukla, J. Strempfer, H. S. Jeevan, P. Gegenwart, and T. Brückel, Physical Review B 89, 014512 (2014).
- Saxena et al. (2000) S. S. Saxena, P. Agarwal, K. Ahilan, F. M. Grosche, R. K. W. Haselwimmer, M. J. Steiner, E. Pugh, I. R. Walker, S. R. Julian, P. Monthoux, G. G. Lonzarich, A. Huxley, I. Sheikin, D. Braithwaite, and J. Flouquet, Nature 406, 587 (2000).
- Huxley et al. (2001) A. Huxley, I. Sheikin, E. Ressouche, N. Kernavanois, D. Braithwaite, R. Calemczuk, and J. Flouquet, Physical Review B 63, 144519 (2001).
- Aoki et al. (2001) D. Aoki, A. Huxley, E. Ressouche, D. Braithwaite, J. Flouquet, J.-P. Brison, E. Lhotel, and C. Paulsen, Nature 413, 613 (2001).
- Luetkens et al. (2009) H. Luetkens, H.-H. Klauss, M. Kraken, F. J. Litterst, T. Dellmann, R. Klingeler, C. Hess, R. Khasanov, A. Amato, C. Baines, M. Kosmala, O. J. Schumann, M. Braden, J. Hamann-Borrero, N. Leps, A. Kondrat, G. Behr, J. Werner, and B. Büchner, Nature Materials 8, 305 (2009).
- Park et al. (2009) J. T. Park, D. S. Inosov, C. Niedermayer, G. L. Sun, D. Haug, N. B. Christensen, R. Dinnebier, A. V. Boris, A. J. Drew, L. Schulz, T. Shapoval, U. Wolff, V. Neu, X. Yang, C. T. Lin, B. Keimer, and V. Hinkov, Physical Review Letters 102, 117006 (2009).
- Goko et al. (2009) T. Goko, A. A. Aczel, E. Baggio-Saitovitch, S. L. Bud’ko, P. C. Canfield, J. P. Carlo, G. F. Chen, P. Dai, A. C. Hamann, W. Z. Hu, H. Kageyama, G. M. Luke, J. L. Luo, B. Nachumi, N. Ni, D. Reznik, D. R. Sanchez-Candela, A. T. Savici, K. J. Sikes, N. L. Wang, C. R. Wiebe, T. J. Williams, T. Yamamoto, W. Yu, and Y. J. Uemura, Physical Review B 80, 024508 (2009).
- Aczel et al. (2008) A. A. Aczel, E. Baggio-Saitovitch, S. L. Budko, P. C. Canfield, J. P. Carlo, G. F. Chen, P. Dai, T. Goko, W. Z. Hu, G. M. Luke, J. L. Luo, N. Ni, D. R. Sanchez-Candela, F. F. Tafti, N. L. Wang, T. J. Williams, W. Yu, and Y. J. Uemura, Physical Review B 78, 214503 (2008).
- Ni et al. (2008) N. Ni, M. E. Tillman, J.-Q. Yan, A. Kracher, S. T. Hannahs, S. L. Bud’ko, and P. C. Canfield, Physical Review B 78, 214515 (2008).
- Chu et al. (2009) J.-h. Chu, J. G. Analytis, C. Kucharczyk, and I. R. Fisher, Physical Review B 79, 014506 (2009).
- Lester et al. (2009) C. Lester, J.-h. Chu, J. G. Analytis, S. C. Capelli, A. S. Erickson, C. L. Condron, M. F. Toney, I. R. Fisher, and S. M. Hayden, Physical Review B 79, 144523 (2009).
- Bernhard et al. (2009) C. Bernhard, A. J. Drew, L. Schulz, V. K. Malik, M. Rössle, C. Niedermayer, T. Wolf, G. D. Varma, G. Mu, H.-H. Wen, H. Liu, G. Wu, and X. H. Chen, New Journal of Physics 11, 055050 (2009).
- Wiesenmayer et al. (2011) E. Wiesenmayer, H. Luetkens, G. Pascua, R. Khasanov, A. Amato, H. Potts, B. Banusch, H.-H. Klauss, and D. Johrendt, Physical Review Letters 107, 237001 (2011).
- Pratt et al. (2009) D. K. Pratt, W. Tian, A. Kreyssig, J. L. Zarestky, S. Nandi, N. Ni, S. L. Bud’ko, P. C. Canfield, A. I. Goldman, and R. J. McQueeney, Physical Review Letters 103, 087001 (2009).
- Christianson et al. (2009) A. D. Christianson, M. D. Lumsden, S. E. Nagler, G. J. MacDougall, M. A. McGuire, A. S. Sefat, R. Jin, B. C. Sales, and D. Mandrus, Physical Review Letters 103, 087002 (2009).
- Laplace et al. (2009) Y. Laplace, J. Bobroff, F. Rullier-Albenque, D. Colson, and A. Forget, Physical Review B 80, 140501(R) (2009).
- Bendele et al. (2010) M. Bendele, A. Amato, K. Conder, M. Elender, H. Keller, H.-H. Klauss, H. Luetkens, E. Pomjakushina, A. Raselli, and R. Khasanov, Physical Review Letters 104, 087003 (2010).
- Bendele et al. (2012) M. Bendele, A. Ichsanow, Y. Pashkevich, L. Keller, T. Strässle, A. Gusev, E. Pomjakushina, K. Conder, R. Khasanov, and H. Keller, Physical Review B 85, 064517 (2012).
- Zhu et al. (2009) X. Zhu, F. Han, G. Mu, P. Cheng, B. Shen, B. Zeng, and H.-H. Wen, Physical Review B 79, 220512(R) (2009).
- Kotegawa et al. (2011) H. Kotegawa, Y. Tao, H. Tou, H. Ogino, S. Horii, K. Kishio, and J.-i. Shimoyama, Journal of the Physical Society of Japan 80, 014712 (2011).
- Munevar et al. (2011) J. Munevar, D. R. Sánchez, M. Alzamora, E. Baggio-Saitovitch, J. P. Carlo, T. Goko, A. A. Aczel, T. J. Williams, G. M. Luke, H.-H. Wen, X. Zhu, F. Han, and Y. J. Uemura, Physical Review B 84, 024527 (2011).
- Hummel et al. (2013) F. Hummel, Y. Su, A. Senyshyn, and D. Johrendt, Physical Review B 88, 144517 (2013).
- Shein and Ivanovskii (2009) I. R. Shein and a. L. Ivanovskii, Journal of Superconductivity and Novel Magnetism 22, 613 (2009).
- Lee and Pickett (2010) K.-W. Lee and W. E. Pickett, EPL (Europhysics Letters) 89, 57008 (2010).
- Cao et al. (2010) G.-H. Cao, Z. Ma, C. Wang, Y. Sun, J. Bao, S. Jiang, Y. Luo, C. Feng, Y. Zhou, Z. Xie, F. Hu, S. Wei, I. Nowik, I. Felner, L. Zhang, Z. Xu, and F.-C. Zhang, Physical Review B 82, 104518 (2010).
- Tegel et al. (2010) M. Tegel, T. Schmid, T. Stürzer, M. Egawa, Y. Su, A. Senyshyn, and D. Johrendt, Physical Review B 82, 140507(R) (2010).
- Amato et al. (2017) A. Amato, H. Luetkens, K. Sedlak, A. Stoykov, R. Scheuermann, M. Elender, A. Raselli, and D. Graf, Review of Scientific Instruments 88, 093301 (2017).
- Khasanov et al. (2016) R. Khasanov, Z. Guguchia, A. Maisuradze, D. Andreica, M. Elender, A. Raselli, Z. Shermadini, T. Goko, F. Knecht, E. Morenzoni, and A. Amato, High Pressure Research 36, 140 (2016).
- Suter and Wojek (2012) A. Suter and B. Wojek, Physics Procedia 30, 69 (2012).
- Eiling and Schilling (1981) A. Eiling and J. S. Schilling, Journal of Physics F: Metal Physics 11, 623 (1981).
- Tatematsu et al. (2010) S. Tatematsu, E. Satomi, Y. Kobayashi, and M. Sato, Journal of the Physical Society of Japan 79, 123712 (2010).
- Yaouanc and Dalmas De Réotier (2011) A. Yaouanc and P. Dalmas De Réotier, Muon Spin Rotation, Relaxation, and Resonance - Applications to Condensed Matter (Oxford University Press, Oxford, 2011).
- Kotegawa et al. (2009) H. Kotegawa, T. Kawazoe, H. Tou, K. Murata, H. Ogino, K. Kishio, and J.-i. Shimoyama, Journal of the Physical Society of Japan 78, 123707 (2009).
- (41) See Supplemental Material at [URL will be inserted by publisher] for details about dc-magnetization measurements, 57Fe Moessbauer spectroscopy, 51V and 75As NMR, and a comparison with a second Sr2VO3FeAs sample.
- Kamusella and Klauss (2016) S. Kamusella and H.-H. Klauss, Hyperfine Interactions 237, 82 (2016).
- Häggström et al. (1989) L. Häggström, A. Gustavsson-Seidel, and H. Fjellvåg, Europhysics Letters (EPL) 9, 87 (1989).
- Ueshima et al. (2014) K. Ueshima, F. Han, X. Zhu, H.-H. Wen, S. Kawasaki, and G.-q. Zheng, Physical Review B 89, 184506 (2014).
- Ok et al. (2017) J. M. Ok, S.-H. Baek, C. Hoch, R. K. Kremer, S. Y. Park, S. Ji, B. Büchner, J.-H. Park, S. I. Hyun, J. H. Shim, Y. Bang, E. G. Moon, I. I. Mazin, and J. S. Kim, Nature Communications 8, 2167 (2017).
- Suter et al. (1998) A. Suter, M. Mali, J. Roos, and D. Brinkmann, Journal of Physics Condensed Matter 10, 5977 (1998).
- McWhan et al. (1973) D. B. McWhan, A. Menth, J. P. Remeika, W. F. Brinkman, and T. M. Rice, Physical Review B 7, 1920 (1973).
- Hansmann et al. (2013) P. Hansmann, A. Toschi, G. Sangiovanni, T. Saha-Dasgupta, S. Lupi, M. Marsi, and K. Held, Physica Status Solidi (B) 250, 1251 (2013).
- Mazin (2010) I. I. Mazin, Physical Review B 81, 020507(R) (2010).
- Chubukov et al. (2008) A. V. Chubukov, D. V. Efremov, and I. Eremin, Physical Review B 78, 134512 (2008).
- Qian et al. (2011) T. Qian, N. Xu, Y.-B. Shi, K. Nakayama, P. Richard, T. Kawahara, T. Sato, T. Takahashi, M. Neupane, Y.-M. Xu, X.-P. Wang, G. Xu, X. Dai, Z. Fang, P. Cheng, H.-H. Wen, and H. Ding, Physical Review B 83, 140513(R) (2011).
Supplemental Material - Coupled Magnetic and Superconducting Transitions in Sr2VO3FeAs Under Pressure
I dc-magnetization measurements
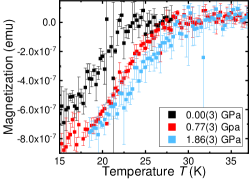
The pressure dependence of the superconducting transition temperature was determined by dc-magnetization measurements using a commercial superconducting quantum interference device (SQUID) magnetometer. A CuBe anvil-type cell with CuBe gaskets and diamond anvils was used for pressure application in combination with Daphne 7373 oil as a pressure transmitting medium. Pressure was determined by a Pb manometer Eiling and Schilling (1981). Figure S1 shows representative magnetization data for different pressures. The cell contribution was subtracted and the data were shifted to overlap above for better comparability. was determined by the intersection of two linear approximations of the data above and below the transition. Measurements of the superconducting volume fraction are relatively unprecise due to the small sample signal (resulting from the small sample volume). Nonetheless, from the data it is clear that the superconducting volume fraction does not change dramatically with pressure.
II Moessbauer spectroscopy
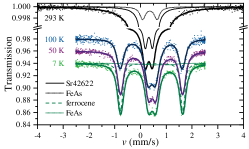
57Fe Moessbauer measurements were carried out in an Oxford He flow cryostat in underpressure mode. The Moessbauer spectrometer consisted mainly of standard WissEl parts. We used a Rh/Co-Source with initial activity of and a Si-PIN-detector from KeTek. A high statistics spectrum was taken at room temperature with a larger velocity range. An additional ferrocene absorber was mounted to provide the experimental line width at low temperatures. All spectra were analysed in a simultaneous fit using Moessfit Kamusella and Klauss (2016).
The room temperature Moessbauer spectrum consists of a slightly asymmetric Sr2VO3FeAs-doublet. The asymmetry can be associated with the FeAs impurity phase, which was included in the fit using the FeAs-model as provided in Moessfit Kamusella and Klauss (2016); Häggström et al. (1989). All four Moessbauer spectra () were fitted simultaneously sharing the same quadrupole splitting of , which corresponds to . There is no additional broadening of the doublet or increased hyperfine splitting comparing and data. It can be concluded, that there is neither static magnetism at the iron atom nor significant transferred hyperfine fields of iron impurity.
The isomer shift with respect to room temperature iron is . This value is slightly enhanced compared to which is typically measured in Eu122, (Ca,Na)122 and (Na,La)122 compounds. This can be interpreted as a reduced covalency of the FeAs-bond, or in other words: an increased localization of the d-electrons.
III Nuclear magnetic resonance
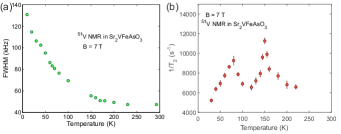
51V and 75As nuclear magnetic resonance (NMR) measurements on Sr2VO3FeAs were performed in an applied field of and a temperature range from to . The NMR line shapes, spin-lattice- , and spin-spin relaxation times were determined by means of standard spin-echo sequences, with a typical pulse length of 5 s and recycling delays ranging from 0.1 to 30 s. The lineshapes were obtained via fast Fourier transform (FFT) of the echo signal, whereas the spin-lattice relaxation times were measured via the inversion-recovery method. Considering the selective nature of the applied RF pulses, only the central peak of the spin-7/2 51V nuclei and of spin-3/2 75As nuclei was excited. The relevant fit formulas for each case are reported in Ref. Suter et al. (1998). The rather asymmetric positions of the probe nuclei (V close to the base of an oxygen pyramid and As at the vertex of an iron pyramid — see, e.g., Ref. Nakamura and Machida (2010)), shift and broaden the satellite lines too much to be detectable. In fact, in the 75As case, the quadrupole interaction is so strong, that its central NMR line shows second-order broadening effects.
1/ data for 75As [Fig. S3(a)] exhibit peaks around and , as reported in Refs. Tatematsu et al. (2010); Ok et al. (2017). A measurement of the 75As line in coarse steps (not shown) shows a shift with temperature below and a broadening below , both in agreement with data from literature Kotegawa et al. (2011); Ok et al. (2017). 1/ data for 51V [Fig. S3(b)] exhibit a broad peak around and a drop below , followed by an upturn below . The drop below is relevant, since it coincides with a peak in the 1/ dataset for 51V [Fig. S4(b)] appearing at the same temperature. In contrast to the results reported in Ref. Ueshima et al. (2014), of 51V exhibits a second peak around . The 51V line barely shifts with temperature, yet it broadens significantly at low [Fig. S4(a)], in agreement with data reported in Refs. Ueshima et al. (2014); Ok et al. (2017). However, no sharp temperature onset is observed for such line broadening.
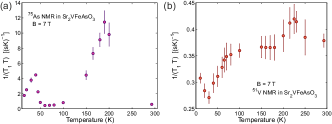
The shift of the 75As line around is believed to stem from a charge- or orbital-type order, with no static magnetism or broken symmetry Ok et al. (2017). From the absence of significant shifts in the 51V line, it was concluded that the V spins remain disordered down to low temperature, while the peak around in the 75As-1/ data was attributed to an ordering of the Fe magnetic moments Ok et al. (2017). Here, however, we argue that the absence of a significant 51V line shift could also be due to a small hyperfine coupling. Consequently, NMR data cannot exclude an ordering of the vanadium spins. Also, it is not known whether the high magnetic fields required for NMR influence the magnetic properties in a significant way. Indeed, 57Fe Moessbauer-measurement results reported in literature Munevar et al. (2011); Cao et al. (2010) (which, like SR results, are obtained under (nearly) zero-field conditions), as well as our own data, both indicate that the Fe moments do not participate in the static magnetic order. We, therefore, attribute the static magnetic order to the ordering of the V magnetic moments.
IV Comparison with second sample
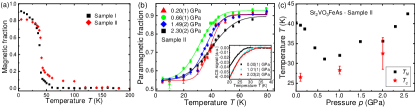
The pressure dependence of the magnetic and superconducting transition temperatures was determined by means of muon spin rotation and relaxation (SR) and ac-susceptibility (ACS) measurements for a second sample (denoted sample II) that was synthesized by a different group within our collaboration Kotegawa et al. (2009). Sample II has a lower magnetic volume fraction at low temperatures and about of the sample exhibit a transition already at 100- [Fig. S5(a)]. This high temperature transition could be intrinsic or stem from impurities (e.g. FeAs). All in all, sample I shows a more homogeneous magnetic response with only one magnetic transition with a nearly volume fraction. Therefore, sample I was chosen to be presented in the main text of this publication. However, the volume sensitive SR measurements on sample II show that the majority of this sample (about of the volume) presents the same features as sample I, as it becomes evident below.
transverse-field (TF) SR shows that hydrostatic pressure changes the transition temperature of the main magnetic transition, but not the low temperature magnetic volume fraction [Fig. S5(b)], similar to sample I. ACS measurements under pressure were performed with the excitation and pick-up coils wound around the outside of a SR pressure cell Khasanov et al. (2016). The ACS signal as a function of temperature is shown in the inset of Fig. S5(b) for different pressures. The superconducting onset transition temperature was determined via the intersection of two linear approximations of the data above and below the transition, in analogy to the dc-magnetization measurements. increases with pressure, but for the highest pressure point the transition is broader and not so well defined.
Figure S5(c) shows the temperature-pressure phase diagram of sample II. was determined as the midpoint of a normal cumulative distribution function fit [c.f. Fig. S5(b)]. Both, and , are in general higher than in sample I. The phase diagrams of the two samples are qualitatively very similar though. initially decreases with pressure until . For higher pressures, and eventually increase simultaneously. The observed coupling of the magnetic and superconducting order is therefore not just a feature of a specific batch, but intrinsic to the Sr2VO3FeAs compound.
References
- Eiling and Schilling (1981) A. Eiling and J. S. Schilling, Journal of Physics F: Metal Physics 11, 623 (1981).
- Kamusella and Klauss (2016) S. Kamusella and H.-H. Klauss, Hyperfine Interactions 237, 82 (2016).
- Häggström et al. (1989) L. Häggström, A. Gustavsson-Seidel, and H. Fjellvåg, Europhysics Letters (EPL) 9, 87 (1989).
- Suter et al. (1998) A. Suter, M. Mali, J. Roos, and D. Brinkmann, Journal of Physics Condensed Matter 10, 5977 (1998).
- Nakamura and Machida (2010) H. Nakamura and M. Machida, Physical Review B 82, 094503 (2010).
- Tatematsu et al. (2010) S. Tatematsu, E. Satomi, Y. Kobayashi, and M. Sato, Journal of the Physical Society of Japan 79, 123712 (2010).
- Ok et al. (2017) J. M. Ok, S.-H. Baek, C. Hoch, R. K. Kremer, S. Y. Park, S. Ji, B. Büchner, J.-H. Park, S. I. Hyun, J. H. Shim, Y. Bang, E. G. Moon, I. I. Mazin, and J. S. Kim, Nature Communications 8, 2167 (2017).
- Kotegawa et al. (2011) H. Kotegawa, Y. Tao, H. Tou, H. Ogino, S. Horii, K. Kishio, and J.-i. Shimoyama, Journal of the Physical Society of Japan 80, 014712 (2011).
- Ueshima et al. (2014) K. Ueshima, F. Han, X. Zhu, H.-H. Wen, S. Kawasaki, and G.-q. Zheng, Physical Review B 89, 184506 (2014).
- Munevar et al. (2011) J. Munevar, D. R. Sánchez, M. Alzamora, E. Baggio-Saitovitch, J. P. Carlo, T. Goko, A. A. Aczel, T. J. Williams, G. M. Luke, H.-H. Wen, X. Zhu, F. Han, and Y. J. Uemura, Physical Review B 84, 024527 (2011).
- Cao et al. (2010) G.-H. Cao, Z. Ma, C. Wang, Y. Sun, J. Bao, S. Jiang, Y. Luo, C. Feng, Y. Zhou, Z. Xie, F. Hu, S. Wei, I. Nowik, I. Felner, L. Zhang, Z. Xu, and F.-C. Zhang, Physical Review B 82, 104518 (2010).
- Kotegawa et al. (2009) H. Kotegawa, T. Kawazoe, H. Tou, K. Murata, H. Ogino, K. Kishio, and J.-i. Shimoyama, Journal of the Physical Society of Japan 78, 123707 (2009).
- Khasanov et al. (2016) R. Khasanov, Z. Guguchia, A. Maisuradze, D. Andreica, M. Elender, A. Raselli, Z. Shermadini, T. Goko, F. Knecht, E. Morenzoni, and A. Amato, High Pressure Research 36, 140 (2016).