The drifting subpulses of PSR B003107 and its synchronously modulated radio polarization
Abstract
We establish that for PSR B003107 the orthogonal polarization modes switch at a single pulse level synchronously with the periodic drifting subpulses seen in total intensity. There are only four other pulsars known for which this phenomenon is observed. PSR B003107 is unique as it is the only source in this group which has multiple stable drift modes. For both drift modes visible at our observing frequency centered at 1369 MHz, the modulation of polarization modes is synchronous with the drifting subpulses. In one of the drift modes, a discontinuity in the modulation pattern of polarization properties occurs halfway through the pulse, coinciding with a slight change in the slope of the intensity drift band. In contrast to what has been suggested for this pulsar in the past, this, plus other differences in the polarization of the modulated emission observed for the two drift modes, suggests that a drift mode change is more than a change in the underlying carousel radius and that magnetospheric propagation effects play an important role. The ellipticity evolves asymmetrically in time during the modulation cycle, which in the framework of a carousel model implies that the polarized sub-beams are asymmetric with respect to the sense of circulation, something which is not observed for other pulsars. Birefringence in the magnetosphere, resulting in the orthogonal polarization modes to spatially separate, is not enough to explain these results. It is argued that more complex magnetospheric processes, which possibly allow conversion between orthogonal polarization modes, play a role.
keywords:
pulsars: general, polarization, pulsars:individual: PSR B0031071 Introduction
Significant progress has been made in understanding the mechanism responsible for the observed coherent radio emission of pulsars since their discovery more than 50 years ago (Hewish et al., 1968). Nevertheless, due to the complexity of the observed emission of pulsars, there is not yet a theoretical model which is able to account for all the diverse phenomenology. The work presented in this paper aims to examine the connection between the organised intensity variability seen in single pulses and the synchronous periodic switching of the polarization properties, in particular the position angle (PA), between two orthogonal polarization states. Implications for the radio emission mechanism are discussed.
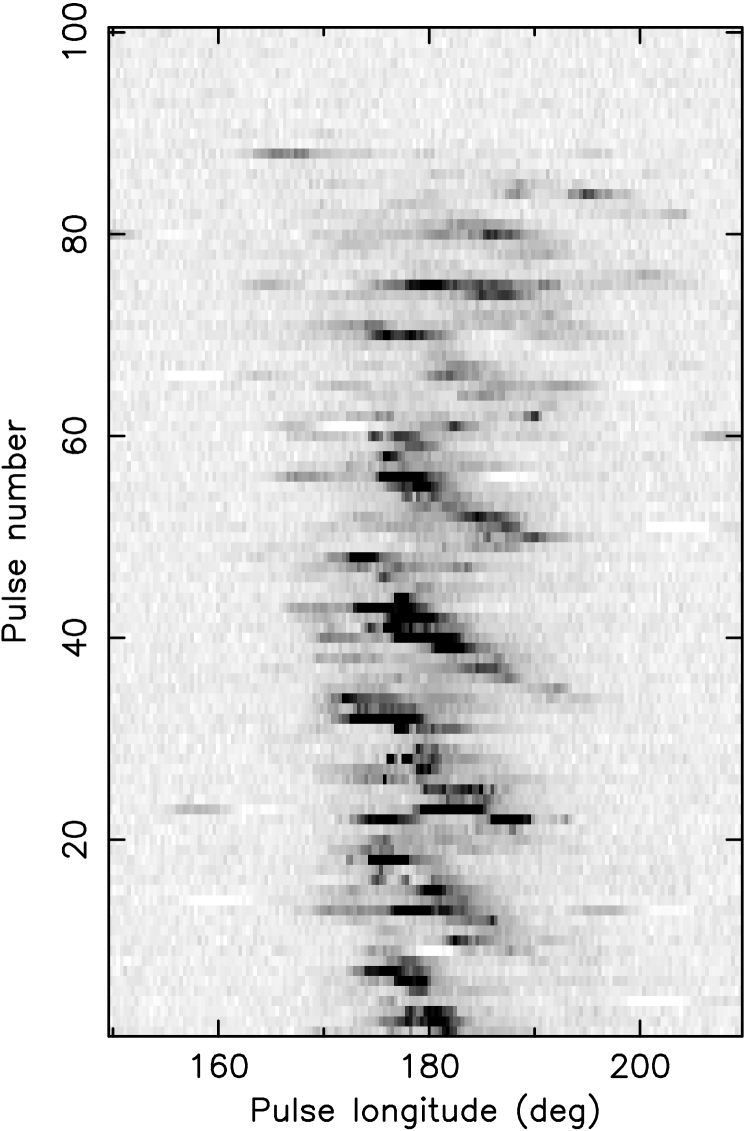
Although the individual pulses of pulsars are known to show chaotic changes in shape, many show systematic variations such that the emission is observed to shift in rotational phase in an organised manner, producing structures in the form of oblique intensity bands in the pulse-stack. This is illustrated in Fig. 1 for PSR B003107 (J00340721). This phenomenon is referred to as drifting subpulses and was first seen in pulsars by Drake & Craft (1968). The pattern can be defined with two periodicities: , the spacing between two consecutive subpulses in rotational phase (or pulse longitude) and , the separation between the diagonal drift bands in pulse number (or pulse periods ). Several authors (Weltevrede et al., 2006, 2007; Basu et al., 2016, 2019) have investigated the organised variability of single pulses and concluded that subpulse drifting is common in pulsars, being detectable in about half the pulsars investigated. Hence, the phenomenon is thought to be an essential component of the radio emission mechanism.
The most well established model to explain drifting subpulses is known as the carousel model (Ruderman & Sutherland, 1975). In this model, the emission beam consists of smaller sub-beams which rotate around the magnetic axis due to an drift force. Individual subpulses correspond to these sub-beams and because of the motion of the carousel, each sub-beam progressively moves across the line of sight of an observer, resulting in the systematic shift as a function of pulse longitude. Since Ruderman & Sutherland (1975), many authors have either refined the carousel model (e.g. Deshpande & Rankin 1999; Gil & Sendyk 2003; Wright 2003; van Leeuwen & Timokhin 2012; Hassall et al. 2013) or suggested alternative models which could explain drifting subpulses (e.g. Clemens & Rosen 2004; Gogoberidze et al. 2005; Fung et al. 2006).
The PA of some pulsars trace an S-shaped swing during a stellar rotation. This is explained by the Rotating Vector Model (RVM) (Radhakrishnan & Cooke, 1969; Komesaroff, 1970) as the change in projection of the dipolar magnetic field lines on the plane of the sky. In a number of pulsars, the gradual S-shape is interrupted by discontinuities in the shape of jumps in the PA. These are explained with the co-existence of two Orthogonally Polarized Modes (OPMs) of radiation (Manchester et al., 1975; Backer et al., 1976). The origin of these OPMs, and the reason why different OPMs can dominate in different parts of a pulse profile, are still uncertain. Some authors (e.g. Gangadhara 1997) suggested that the production of OPMs is intrinsic to the radio emission mechanism. Other authors (e.g. Melrose 1979; Allen & Melrose 1982; Arons & Barnard 1986) suggested that the two OPMs are the two natural modes of propagation in the highly-relativistic magnetized plasma inside the pulsar magnetosphere. These two propagation modes are the Ordinary mode (O mode) and the eXtraordinary mode (X mode), which are predicted to be linearly polarized and orthogonal to each other.
For four pulsars it is observed that the dominant OPM periodically switches, and that this occurs synchronous with the drifting subpulses as observed in total intensity. Ramachandran et al. (2002) observed sharp OPM transitions in the subpulses of PSR B0809+74, which explained the periodic deviations from the RVM which were reported by Taylor et al. (1971) for that pulsar. Ramachandran et al. (2002) showed that the flips between the dominant OPMs occur synchronous with the drifting subpulses. This finding was soon followed by the discovery of similar behaviour in PSR B1237+25 (Rankin & Ramachandran, 2003), and in PSRs B0320+39 and B081813 (Edwards, 2004). For PSR B1237+25 the strict synchrony of the OPM flips and the drifting subpulses is not established, since no technique such as -folding (see Sect. 3.4) was used,
In order to explain the fact that, for some pulsars, the switches between OPMs are modulated by the periodicity of drifting subpulses, the carousel model needed some revision. Rankin & Ramachandran (2003) suggested that a single circulating carousel system (i.e. the pattern of discharges in the polar gap) produces two “images” of emission, each correspond to one of the observed OPMs. An azimuthal offset between the two images (with respect to the magnetic axis) would result in the observed periodic flips in the dominant PA. The two images are believed to arise due to birefringence in the pulsar magnetosphere (Rankin et al., 2006). This is expected since the X mode is not affected by refraction, thus it propagates in a straight path from the emitting region, while the O mode experiences refraction and therefore propagates on a curved path before escaping the pulsar magnetosphere (e.g. Petrova & Lyubarskii 2000; Petrova 2001; Lyubarsky 2002; Weltevrede et al. 2003). Hence, two images of the carousel will be produced; each image has mutually orthogonal polarization and could be magnified differently.
In this work, we show that modulation of OPMs synchronous with the drifting subpulses exists for PSR B003107. This is a particularly interesting and widely studied pulsar, as it displays drifting subpulses with three different stable drift modes. These are modes A (), B () and C () (Huguenin et al., 1970), where is found to be variable within a given mode as well (McSweeney et al., 2017). The detectability of these modes depends on the observing frequency (e.g. Smits et al., 2005; Smits et al., 2007). For example, at 1.4 GHz only modes A and B have been observed (Smits et al., 2007). Manchester (1975) investigated the polarization properties of this pulsar and reported the presence of two OPMs. Our investigation builds on an initial analysis presented in a Masters thesis by Chen (2015) and preliminary results were published in Ilie & Weltevrede (2018). However, detailed analysis was hindered by instrumental variations on timescales comparable with the pulsar period . In this analysis, we describe the observed behaviour in more detail using new data and discuss potential interpretations.
The structure of this paper is as follows. Sect. 2 describes the observations of PSR B003107. In Sect. 3.1, it is explained how the data is separated in multiple drift modes and fluctuation analysis is used (Sect. 3.2) to confirm that this is done successfully. The polarization properties of this pulsar are discussed in depth in Sect. 3.3 before in Sect. 3.4 it is established that the observed OPMs switch synchronously with the drifting subpulses. The results are discussed in Sect. 4 and the conclusions are presented in Sect. 5.
2 Observations
Two observations of PSR B003107 are described in this paper, which were performed using the H-OH receiver of the Parkes telescope with a bandwidth of 256 MHz, split into 512 frequency channels, centred at 1369 MHz. The data was recorded with the backend system known as the Parkes Digital FilterBank PDFB4. The first observation was made on 2016 April 9 and the second on 2016 August 29. In the two observations 13,622 and 7,951 individual pulses were recorded respectively.
Data was de-dispersed, de-Faraday rotated and folded off-line using dspsr (van Straten & Bailes, 2011) which allows the data to be re-organised in the form of a pulse-stack. After folding, the time resolution was 1024 pulse longitude bins per stellar rotation. The individual frequency channels were averaged, excluding those affected strongest by radio frequency interference (RFI). Some broad-band RFI was present in the data, including periodic bursts of RFI believed to be associated with a pump. Given the large number of pulses recorded, the effect on the analysis was found to be minimal. At the start of each observing session, a pulsed calibration signal was recorded for two minutes, while the telescope was pointed offset from the pulsar. This allows correction for differential gain and phase, which was applied to the data using the psrchive111http://psrchive.sourceforge.net/ software package.
The two observations were combined to improve the sensitivity. The rotational-phase alignment was achieved using a rotational ephemeris which was optimised for the rotation period and its time derivative based on observations from the 76 m Lovell radio telescope in Jodrell Bank. Although the analysis presented in this paper is based on the combined observation, it was checked that the results are consistent with those obtained from the two individual observations.

3 Analysis
All analysis in this section was performed with psrsalsa222https://github.com/weltevrede/psrsalsa (Weltevrede, 2016).
3.1 Drift mode identification
A small interval of the pulse-stack of PSR B003107 containing 100 consecutive pulses is displayed in Fig. 1, showing several mode A drift bands up to pulse number 60. After this, shallower mode B drift bands can be seen followed by a null state, during which the radio emission mechanism appears to be inactive. As noted by for example Smits et al. (2005), the pattern of drifting subpulses is clearer at lower observing frequencies. Nevertheless, the choice was made to observe at this frequency because of the excellent performance of the Parkes telescope in producing polarization calibrated pulsar data (see e.g. Weltevrede & Johnston 2008; Johnston & Kerr 2018).
As we are interested in the modulation of the OPMs, the analysis which follows requires the data to be separated in the different drift modes, since each drift mode has different polarization and modulation properties. The adopted methodology of mode separation is as follows. The pulse-stack was visually inspected. One occurrence of mode C was seen in the pulse-stack (the length of the whole observation is hours), as several drift bands following an occurrence of mode B. However, due to the rarity of mode C, we did not attempt to include this mode in any further analysis. Each individual pulse was assigned one of the following categories: mode A, mode B, mode C, null state, or the emission was too weak to be classified. The last category was included in order to avoid possible mis-labeling weak emission. There were no individual pulses where RFI affected the mode identification.
Out of a total of 21,573 individual pulses, the pulsar was in a null state for 8,606 pulses (39.9) and the pulsar was on (in one of the three drift states) for 43.1 of the time (9,294 pulses). For the rest of the pulses, emission was observed, but too weak to be classified reliably (17.0). During the time the pulsar was on and classifiable, 30.5 of the time it was in mode A (2,838 pulses), 69.2 of the time it was in mode B (6,430 pulses) and 0.3 of the time it was in mode C (26 pulses). At 328 MHz, Smits et al. (2005) reported that PSR B003107 was on (in one of the three drift modes) 61.8 of the time (of which 17.8 mode A, 80.1 mode B and 2.1 mode C). This confirms that mode A is more common at higher radio frequencies (Smits et al., 2005; Smits et al., 2007). The null fraction as reported by Smits et al. (2005) is very similar.
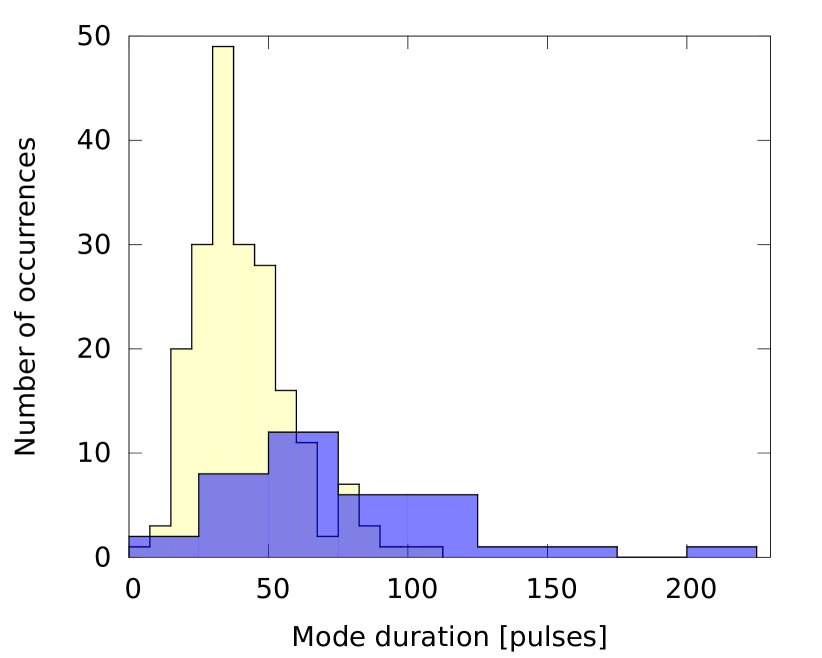
Distributions of the duration of individual stretches of mode A and B data are shown in Fig. 2. From these plots, it can be seen that bursts of mode A emission tends to last longer compared to mode B emission. The mode A bursts last between 25 and 200 pulses (between 2 and 15 consecutive drift bands). Mode B bursts range from a few pulses up to 100 pulses (between 1 and 15 consecutive drift bands).
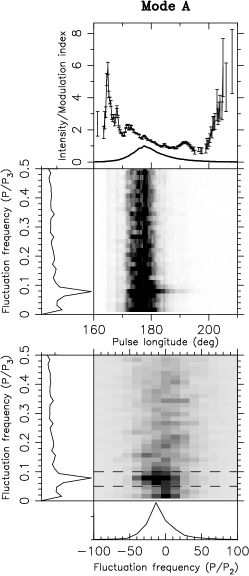
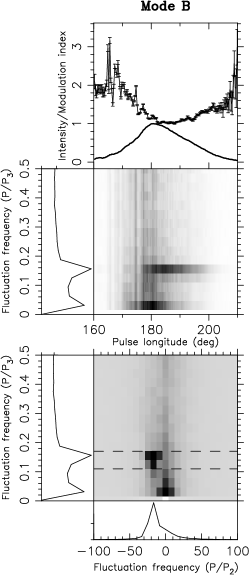
Mode separation is somewhat subjective because of variability in the emission unrelated to drifting subpulses. Nevertheless, a fluctuation analysis on the mode-separated data confirms that the mode separation was successful. The results of the fluctuation analysis on the total intensity both before and after mode separation are shown in Fig. 3. A detailed description of this figure is provided in the following subsections.
3.2 Fluctuation analysis
All fluctuation analysis described in this subsection was done in the spectral domain. See Weltevrede et al. 2006, 2007 for details about the methodology.
The modulation index quantifies how much the intensity varies from pulse to pulse for a certain pulse longitude and is equal to the standard deviation of the intensity divided by its average. The modulation index, along with the pulse profile, is shown in the top panels of Fig. 3. This reveals an asymmetry such that the leading part of the profile is more strongly modulated, and that the two drift modes have different modulation properties. To quantify the periodicities in the data, and their difference for the two modes, fluctuation spectra are calculated.
The computation of the Longitude Resolved Fluctuation Spectrum (LRFS; Backer 1970) allows the investigation of the repetition frequency of the drifting subpulse pattern . The LRFS is obtained by averaging the power spectra obtained from blocks of pulses. For the not-mode-separated data large blocks of 512 pulses were used, which gives a high spectral resolution. For the mode-separated data, the choice of block size was made based on the typical mode length as inferred from Fig. 2. Since the pulses in each block must be continuous, a large block size implies limited data can be analysed. The mode A and B separated data was organised into sequences of 64 and 32 consecutive pulses respectively. Care was taken to only consider blocks in which all pulses were classified to be in the same mode and incomplete blocks were discarded from the analysis.
The LRFS for modes A and B and the non-mode-separated data are shown below the pulse profiles in Fig. 3. The left-most LRFS in Fig. 3, which is based on the not-mode-separated data, reveals three main features. The first is centred at zero fluctuation frequency, pointing towards fluctuations with long timescales, and is likely to be associated to nulling and drift mode changes. There is a strong feature at a fluctuation frequency cycles per period (cpp), indicating which corresponds to drift mode A. The fact that the feature is resolved in fluctuation frequency indicates that is variable. A weaker feature corresponding to mode B, which is more pronounced in the trailing half of the profile, can be seen at cpp or at .
As a confirmation for the successful mode separation, in analysis of the mode-separated data (middle and right column in Fig. 3), only the periodicity of the drift mode of interest remains. This is most pronounced in the side panels, which show the horizontally integrated power.
To measure , or demonstrate the existence of drifting subpulses, the 2-Dimensional Fluctuation Spectrum (2DFS, Edwards & Stappers 2002) can be used. In the 2DFS (bottom row of panels in Fig. 3) there is power at the same frequencies as observed in the LRFS. The fact that the power is offset horizontally from zero, resulting in a negative , means that, as expected, the subpulses drift to the leading side of the profile (see Fig. 1 as well). and were measured for the mode-separated data by calculating the centroid of power the in the 2DFS (taking care to account for systematic uncertainties, see Weltevrede et al. 2006). For mode A, this results in and . For mode B, and . These values are consistent with Fig. 1 and measurements by Smits et al. (2007) at 1167 MHz, as well as measurements by Huguenin et al. (1970) and Smits et al. (2005). The measurements are consistent with being identical for the different drift modes, as was noted by Huguenin et al. (1970).
3.3 Polarization properties
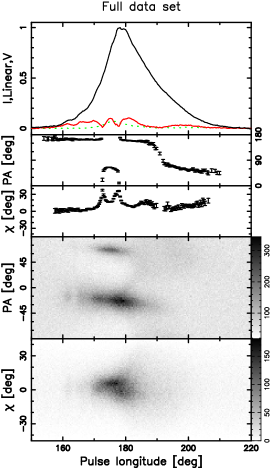
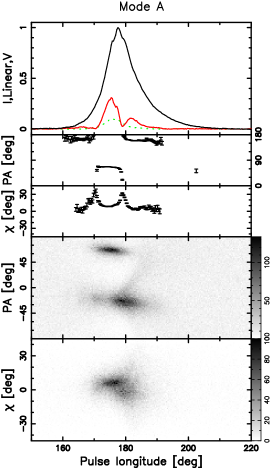
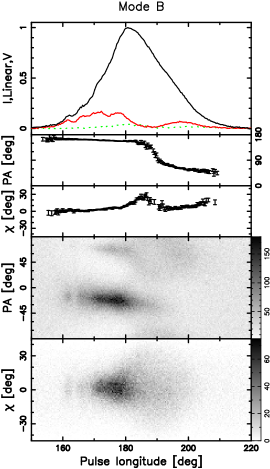
Looking at the top panels of Fig. 4, it is clear that modes A and B have significantly different intensity profiles and average polarization properties. The intensity profile of mode B peaks later in pulse longitude and the widths are also different. The measured 10-widths of mode A and B are and respectively with a nominal error of . This shift in peak location of the pulse profile, and the variation in width, have been observed at other frequencies as well (e.g. Vivekanand & Joshi 1997; Wright & Fowler 1981; Vivekanand & Joshi 1997; Smits et al. 2007).
The average linear polarization and circular polarization of the not-mode-separated data are low (where , and are Stokes parameters), as seen in the top panels of Fig. 4. In comparison, in the mode-separated data is stronger, which suggests that different OPMs dominate for different drift modes, thereby causing depolarization when summed. The PA swings of the two drift modes are indeed different (see second row panels of Fig. 4). The two OPM jumps observed in the PA swing of the more strongly polarized mode A do not occur for mode B. The occurrence of OPM jumps in PSR B0031–07 is known to be frequency dependent (Smits et al., 2007). The ellipticity angle , defined via , appears to peak where the two OPM transitions occur for mode A (see third row of panels of Fig. 4). For mode B, the ellipticity angle is small, except around longitude and towards the trailing edge of the profile.
To further investigate the existence of OPMs, the PA distribution of individual pulses was determined. The obtained distributions (see fourth row of panels in Fig. 4) reveal that at most pulse longitudes there is a mixture of OPMs observed for both modes A and B. We define the OPM observed at PA as OPMA, and the OPM at PA as OPMB. For drift mode B, OPMB dominates up to pulse longitude . Compared to drift mode B, OPMA dominates much more frequently in the individual pulses of drift mode A. This is especially true between pulse longitudes and , thereby explaining the jumps in the integrated PA swing. Since there is a mixture of OPMs, depolarization of the integrated profile can be expected, as is observed.
In the PA distribution of drift mode A (fourth panel in the middle column of Fig. 4), a structure can be seen flaring off upwards from OPMB, starting at pulse longitude and connecting with the other OPM at longitude . Clearly the polarization state of the radiation is more complex than an incoherent summation of two OPMs. This structure is only visible in the drift mode A data.
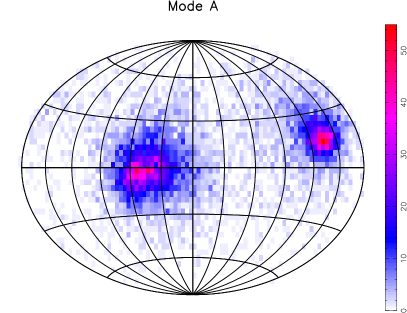
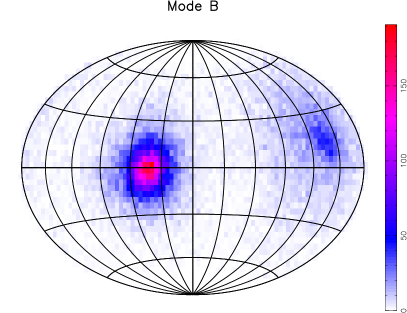
Unlike the drift mode B data, the mode A data has an ellipticity angle distribution (bottom row of panels in Fig. 4) which does appear to be bi-modal, with one component being significantly more linear than the other. The origin of the bi-modality is revealed by exploring the distribution of polarization orientations which can be visualised in the form of a Poincaré sphere (Fig. 5). The data was first re-binned into 64 pulse longitude bins, in order to increase the significance of each sample. Since the peaks in the PA distributions in Fig. 4 shift only slightly in PA as function of pulse longitude, especially where the polarized emission is strongest, the introduced depolarization because of rebinning is minimal. Nevertheless, to compensate for this effect, the Stokes and parameters for each sample were rotated before rebinning such that the time-averaged PA-swing was removed from the data. This was done for each drift-mode separated dataset separately. After rebinning, the time-averaged PA-swing as measured from the re-binned data was re-introduced before producing the Poincaré spheres as shown in Fig. 5. The two OPMs manifest themselves as two islands offset by in longitude in the Poincaré sphere. OPMA is clearly elliptical (appearing at the right hand side), while OPMB is almost entirely linearly polarized.
The shown Poincaré spheres demonstrate that the two OPMs have polarization properties which are essentially independent on drift mode. OPMA is clearly elliptical with , while OPMB is practically linear. This means that the two polarization modes are not situated on antipodal points on the Poincaré sphere. According to most theories, OPMs are expected to be orthogonal in both PA and ellipticity (e.g. Melrose et al. 2006), however deviations from orthogonality have been previously observed for other pulsars too (e.g. Edwards et al. 2003; Edwards 2004).
3.4 Periodic polarization variability
As is also explained in Ilie & Weltevrede (2018), -folding can reveal the relation between the two OPMs and the periodicity of drifting subpulses. -folding is the process where data is averaged over the modulation cycle which results in the average shape and properties of a drift band. Since is not fixed, but varies, as demonstrated in Sect. 3.2, these variations need to be take into account when averaging successive drift bands over large stretches of data (e.g. Deshpande & Rankin 2001; van Leeuwen et al. 2002). Here the variability was compensated for using a tool from the psrsalsa software package, a tool which was first used by Hassall et al. (2013).
The folding algorithm works as follows. For both drift modes, the cycle is resolved in bins. This oversampling by a factor of two implies that subsequent bins are dependent, but this gives a smoother visual result. The effective resolution was made to match the intrinsic resolution by smoothing the data using a Gaussian smoothing kernel during the folding process. Before being folded, the mode-separated data was split in blocks of 3 pulses. Care was taken to only use blocks containing continuous stretches of pulses in a given mode, similar to what was done for the fluctuation analysis described in Sect. 3.2. Each block was first folded at a fixed value of , taken to be the average value for the given drift mode as determined from the fluctuation analysis described in Sect. 3.1. A larger block size will increase the signal-to-noise ratio per block, allowing the variability in to be better determined via the cross-correlation explained below. However, at the same time, a larger block size would cause smearing since the fixed period folding within the block might no longer be accurate enough. The variations in were taken into account by cross-correlating the folded data for each block, resulting in phase offsets, which are applied to align the average drift bands obtained for the separate blocks. This is done in an iterative manner. In the first iteration, the first block of individual pulses is used as the template in the process of cross-correlation when aligning the other blocks. In the next iteration, the over the full data set averaged modulation cycle from the previous iteration is used as the template, thus giving a better alignment. The number of iterations was chosen such that further iterations do not lead to significant improvement in the final result.
The calculated offsets from the cross-correlation can be strongly influenced by the presence of randomly occurring bright pulses weakening the correlation of the underlying drifting subpulses pattern. For example, Karuppusamy et al. (2011) showed that for PSR B003107 the emission is a combination of drifting subpulses, nulls and sporadic bright pulses. In order to minimise the mis-alignment because of sporadic bright non-periodic emission, all samples above a certain selected threshold of intensity were clipped before folding. This means that their intensity was set to the threshold intensity when exceeding the threshold, thereby maximising the power in the drifting subpulses. This process is similar to that applied to Fig. 1 to highlight the drifting subpulses better. The offsets determined from the clipped data were used to fold the original not clipped pulse-stack. The data corresponding to the four Stokes parameters were folded identically using the offsets determined from the Stokes pulse-stack, in which the drifting subpulses are clearest. After folding, parameters such as , PA and can be determined as usual.
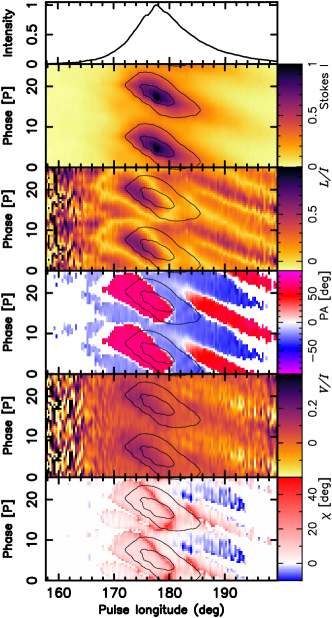
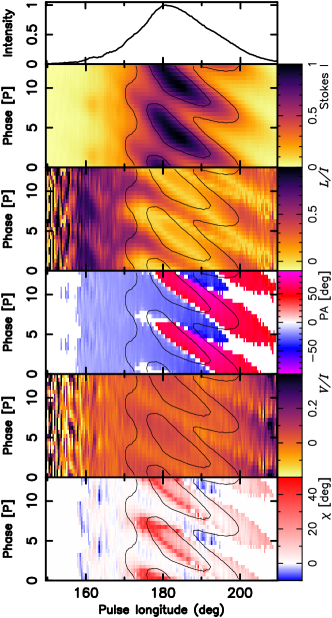
The -folds in Stokes , , PA, and for both drift modes are shown in Fig. 6. The average drift bands are shown twice, above each other, in the individual panels for the purpose of continuity. Looking at the Stokes -folds, shown in the top row of -folds in Fig. 6, clear diagonal drift bands can be seen, once more indicating that the mode separation was done correctly. The mode A drift bands (left) appear to be mostly straight diagonal bands with an intensity which is more concentrated to the central region of the profile compared to the mode B drift bands (right).
In the PA -folds (fourth row of panels from the top in Fig. 6) OPMA (red in the online version) and OPMB (blue in the online version) appear at different phases of the modulation cycle. This implies that throughout the modulation cycle, for both drift modes, the dominance of the two OPMs switches periodically. For drift mode A (left) it can be seen that between pulse longitudes and , OPMA roughly coincides with the location of the total intensity drift band (represented by the contours), and OPMB occurs mostly in between the total intensity drift bands. After pulse longitude , an inversion occurs in the polarization such that the total intensity drift band is dominated by OPMB, while OPMA occurs in between the total intensity drift bands. At all pulse longitudes where in the PA distribution (Fig. 4) the dominance of OPMs alternates, the transitions are part of the modulation cycle. Also the drift mode B data (right hand side of Fig. 6) show periodic switches between the two OPMs after pulse longitude , although here the total intensity drift bands are dominated by OPMA rather than OPMB. At earlier longitudes, OPMB dominates at all times (see also the PA distribution in Fig. 4), hence no vertical structure is seen in the -fold.
In the -fold of for drift mode A, shown below the Stokes -fold in Fig. 6, it can be seen that the fractional linear polarization drops where the PA switching occurs (compare with the second but last left panel). Depolarization is expected to occur where OPMs mix. A similar behaviour can be seen in the -fold of drift mode B for that part of the profile where OPM switching is observed.
In the -folds in , displayed in the second to last row of panels in Fig. 6, it can be seen that the circular polarization is weakly modulated by the periodicity of drifting subpulses. Given that OPMA is elliptical, we expect Stokes to be modulated as well. Indeed we see that for mode A (left hand side), between pulse longitudes and , periodic switches occur between a significant circular polarization component (coinciding with OPMA) and almost no circular polarization (coinciding with OPMB). A similar trend can be seen for mode B after pulse longitude .
In the bottom left panel, where the -fold of of drift mode A is shown, one can see that OPMA has significant ellipticity, while OPMB is almost not elliptical. Particularly interesting is an asymmetry in time (pulse number) in the ellipticity for especially drift mode A. For that mode, between pulse longitude and , the drift band corresponding to OPMA starts with a lower ellipticity and it becomes highly elliptical when the OPM flips and the fractional linear polarization drops, as indicated by the (in the online version) red edge corresponding to the upper side of OPMA in the bottom-left panel of Fig. 6. For the same drift mode, between pulse longitudes and , OPMA starts highly elliptical and becomes more linear during the modulation cycle. An asymmetry is also present for drift mode B (bottom right panel), however the effect is less pronounced as for mode A. Up to pulse longitude , the ellipticity of the OPMA drift band is symmetrical in pulse number, and is maximum when the OPMs flip (bright red edge in the online version), however after this longitude only the start of the OPMA band has a hint of ellipticity. For both drift modes, asymmetries in pulse number are only apparent in ellipticity.
4 Discussion
We have discovered that for PSR B003107 the switches between the two OPMs are modulated synchronously with the drifting subpulses for both the A and B drift modes. This phenomenon has only been seen for four other pulsars so far, and none of those pulsars have multiple stable drift modes.
Rankin & Ramachandran (2003) suggested that this behaviour can be accommodated in the carousel model. In this model, drifting subpulses reflect a pattern of sub-beams circulating around the magnetic pole and the origin of this pattern is “sparking” (pair production) near the surface of the star. To explain the observed behaviour two patterns, or “images” are required, each corresponding to one of the OPMs. These two images are thought to naturally arise because of birefringence in the pulsar magnetosphere. Although at the emission height, the height where the two OPMs are produced, the ray paths corresponding to the two OPMs are identical, birefringence will cause the rays to escape the magnetosphere in different directions. As a consequence, the observed beam patterns corresponding to the OPMs differ, and provide separate distorted views (“images”) of the same underlying pattern of sparks. To explain their observations, Rankin & Ramachandran (2003) found that these images should be shifted both radially and azimuthally with respect to each other. Thus for PSR B0031, this “double imaging” should happen for (at least) both the A and B modes of drifting, although we will point out that this picture must be more complicated for this pulsar.
Smits et al. (2005); Smits et al. (2007) constructed a geometrical model in order to explain the drifting subpulses (as observed in total intensity) of PSR B0031. The authors suggested that the emission of this pulsar comes from a carousel configuration which expands or contract depending on the drift mode. The widest carousel configuration would correspond to drift mode A. This model can explain the fact that the intensity and occurrence of mode B drift bands decreases with increasing observing frequency, while the occurrence of mode A increases with observing frequency. This model relies on radius-to-frequency mapping (RFM; Cordes 1978), which is the effect where higher frequency emission originates from closer to the stellar surface, from magnetic field lines which are further away from the magnetic axis.
The Smits et al. (2005); Smits et al. (2007) model was not designed to explain the polarization properties of this pulsar. In the context of a symmetrical circular carousel, such as was applicable to PSR B0809+74 at 328 MHz (Rankin et al., 2006), one would expect to observe a symmetry of the drift bands with respect to the centre of the profile. We do not see such symmetry in the -folds of PSR B003107, as an inversion occurs in the PA of drift mode A (see Sect. 3.4) such that the drift band as seen in total intensity is dominated by OPMA in one half of the profile, and OPMB in the other half. For mode B, in the earlier part of the pulse there is only OPMB, while in the trailing half of the profile we see switches of the OPM synchronised with the drifting subpulses. This asymmetry prevents the methodology of Rankin & Ramachandran (2003) to be applied to construct a polarized beam map for PSR B003107. However, it is clear that two offset images of the same carousel are not enough to explain our observations, and additional effects must play a role. These could potentially be asymmetric propagation effects in the pulsar magnetosphere. The same conclusion would apply for PSR B081813, which has complicated, and asymmetric, structures in its polarization, which are synchronously modulated with the drifting subpulses. Although Edwards (2004) does not discuss the asymmetry of the drift bands specifically, it was concluded that for PSR B081813, which has two non-orthogonal highly elliptical OPMs, a model with two offset OPM images of the same carousel is not enough to explain the observed polarization behaviour.
The fact that the -folds significantly differ for the two drift modes as observed in polarization suggests that more is happening as a simple expansion or contracting of a single carousel. Again, this could point to propagation effects to play a role, since for a changing carousel configuration the emission would propagate through different parts of the magnetosphere giving rise to different propagation effects for the different drift modes.
In the case of PSRs B0320+39 and B081813 (Edwards, 2004), and also PSR B0809+74 at both 328 MHz and 1380 MHz (Edwards, 2004; Rankin et al., 2006), the total intensity drift bands are dominated by one OPM, while the other OPM dominates in between drift bands. PSR B003107 is different, since the total intensity drift band in drift mode A is dominated by different OPMs in the leading and trailing half of the profile. Looking at the -fold of drift mode A in PA (fourth row of panels from the top in Fig. 6), the pattern traced by a given OPM appears to be split in the middle of the profile with a vertical offset appearing. This at least visually resembles a subpulse phase jump as seen, for example, in the total intensity drift bands of PSR B0320+39 (Edwards et al., 2003). For PSR B003107 the total intensity folds are more continuous, although coincident with the discontinuity as seen in the PA -fold of drift mode A, a small change in the slope of the intensity drift band can be seen, such that the drift band becomes shallower after the discontinuity. Edwards et al. (2003) suggested that a subpulse phase jump is another type of phenomenon which might require superposed images of the same carousel system. Here each image should have drifting subpulses which are out of phase because of an azimuthal offset. To explain the subpulse phase jump, each image should dominate in different halves of the profile. At the longitude where the phase modulation jump occurs, in the middle of the profile, the two images destructively interfere. Edwards (2004) pointed out that if the two superposed out of phase images correspond to the two OPMs, both the subpulse phase step as seen in total intensity and the synchronous switching of the dominant OPM can be explained. Edwards & Stappers (2003) observed the intensity phase modulation of PSR B0320+39 at 328 and 1380 MHz and noted that the change in the phase jump with frequency could be explained if the centre of the carousel systems are offset from each other. So there would be a precedent to explore if a model which is more complicated than just a shrinking or expanding carousel would apply to PSR B0031–07 as well.
Other authors (e.g. Clemens & Rosen 2004, 2008; Rosen & Demorest 2011) suggested that non-radial oscillations of the surface of the neutron star could explain drifting subpulses as well as the subpulse phase steps observed in total intensity drift bands. However, it is unclear in this model how the polarization is expected to be affected, and why for PSR B003107 no subpulse phase step would be observed in total intensity, while there is a discontinuity in the PA of the drift bands in the middle of the profile.
It is intriguing that the ellipticity evolves asymmetrically throughout the modulation cycle (in pulse number), such that in drift mode A in the leading half of the profile, the emission becomes elliptical just before the emission flips from OPMA (which as found in Sect. 3.3 is significantly more elliptical on average) to OPMB, but not when OPMB flips to OPMA. Hence, the ellipticity of the OPMs are not fixed during the modulation cycle. In the carousel model, the pattern of circulating sub-beams is in general taken to be symmetric with respect to the sense of circulation, in the sense that the structure of the sub-beam is similar in its leading and trailing half. Here, some form of symmetry breaking is required by physics which is affected by the sense of the circulation. Similar symmetry breaking has not been seen for the other four pulsars which show OPM switches synchronous with drifting subpulses. The origin of this asymmetry is unclear, but coherent interference by the two OPMs could play a role.
From theory (e.g. Arons & Barnard 1986) one could expect the OPMs to be purely linearly polarized. However, this is not the case for PSR B003107. Also PSR B0329+54 has two OPMs with different degrees of ellipticity (Edwards & Stappers, 2004). The authors explained this in term of Generalised Faraday Rotation (GFR, Kennett & Melrose 1998) and coherent addition of the radiation of the two OPMs, which allows partial conversion of linear into circular polarization. GFR would contribute to frequency dependend polarization effects as well (see Ilie et al. (2019) and references therein). Melrose et al. (2006) offered an alternative explanation for the observed variable polarization properties of individual pulses of PSR B0329+54, by assuming incoherent addition of the radiation of the two OPMs. In general it is hard to distinguish whether the observed polarized radiation is the incoherent or coherent sum of OPMs. For PSR B003107, when the rate of occurrence of both OPMs is comparable in the PA distribution of the not drift-mode separated dataset, the linear polarization is generally low, while when the rate of occurrence of one OPM is higher, as seen for the drift mode A separated dataset, is also higher. This is compatible with a scenario where the observed radiation is an incoherent sum of OPMs. On the other hand, as pointed out for example by Dyks (2017), a good indicator for the natural polarization modes being coherently combined would be the presence of a peak of circular polarization near an OPM transition, while decreases and the total polarization is not affected. Fig. 4 shows that the ellipticity angle peaks where the OPM transitions occur for drift more A (longitudes and ), however the average total polarization does significantly drop. So it seems likely there is a combination of coherent and incoherent OPM summation (partial coherent addition) occurring in PSR B0031–07.
5 Summary and Conclusions
We established, using the -folding technique, that for PSR B003107 the orthogonal polarization modes switch synchronously with the drifting subpulses seen in total intensity. This is observed for both drift modes (out of a total of three) which are present at our observing frequency (Smits et al., 2005; Smits et al., 2007). A similar connection between the periodicity seen in polarization and total intensity has only been reported for four other pulsars (Ramachandran et al., 2002; Rankin & Ramachandran, 2003; Edwards, 2004). PSR B003107 is the only pulsar in this group of pulsars which shows drift mode changes, making it a unique source to test emission models.
PSR B003107 is also different from the other four pulsars, as it was found that the ellipticity evolves asymmetrically with time during the modulation cycle, such that the ellipticity is high just before the emission flips from one OPM to the other, but not when it flips back. The asymmetry is different for the two drift modes. In the carousel model, some form of symmetry breaking would be required by physics which is affected by the sense of the circulation, which is likely related to coherent mode addition effects.
For all other four pulsars which show modulated OPM switches synchronous with drifting subpulses, the drift bands observed in total intensity are generally dominated by one OPM, while the other one dominates in between the drift bands. However, during drift mode A of PSR B003107, the drift bands as observed in total intensity are dominated by different OPMs in different halves of the profile. This is accompanied by a slight change of the slope of the intensity drift band in the middle of the profile. This could be related to what is known as subpulse phase steps (Edwards et al., 2003) and could hint towards two superposed out of phase images of the carousel. The production of two images is also a requirement to explain the observed periodic changes in polarization.
It will be challenging to construct a geometric model for the polarized properties of the drifting subpulses of PSR B003107. A symmetrical carousel which contracts or expands when switching between drift modes, as was suggested by Smits et al. (2005); Smits et al. (2007) for PSR B003107, can only explain the behaviour as seen in total intensity. Additional effects would be required in order to explain the here presented polarization observations which show large asymmetries between the leading and trailing halves of the profile. This is likely to be because of propagation effects in the pulsar magnetosphere, including birefringence which can cause the emission produced by the carousel to be spatially split in two distinct images corresponding to two OPMs. In addition, it is suggested that a combination of coherent and incoherent mode addition plays a role in forming the observed polarization state of the radiation. To explain the large asymmetries as seen in the leading and trailing half of the profile, especially the -fold as observed in PA, we speculate that more complex propagation effects play a role, such as the coupling between the two OPMs during the propagation through the magnetosphere. If this coupling is asymmetric as function of pulse longitude, one could expect asymmetries to be observed, while maintaining the picture of a symmetric underlying carousel configuration.
Acknowledgements
The authors would like to thank Ben Shaw for providing the ephemeris used in the folding process. In addition we would like to thank Crispin Agar and Geoff Wright for the many useful discussions related to the interpretation of the results in this manuscript. The Parkes radio telescope is part of the Australia Telescope which is funded by the Commonwealth of Australia for operation as a National Facility managed by CSIRO. Pulsar research at Jodrell Bank Centre for Astrophysics and Jodrell Bank Observatory is supported by a consolidated grant from the UK Science and Technology Facilities Council (STFC).
References
- Allen & Melrose (1982) Allen M. C., Melrose D. B., 1982, Proceedings of the Astronomical Society of Australia, 4, 365
- Arons & Barnard (1986) Arons J., Barnard J. J., 1986, ApJ, 302, 120
- Backer (1970) Backer D. C., 1970, Nature, 227, 692
- Backer et al. (1976) Backer D. C., Rankin J. M., Campbell D. B., 1976, Nature, 263, 202
- Basu et al. (2016) Basu R., Mitra D., Melikidze G. I., Maciesiak K., Skrzypczak A., Szary A., 2016, ApJ, 833, 29
- Basu et al. (2019) Basu R., Mitra D., Melikidze G. I., Skrzypczak A., 2019, MNRAS, 482, 3757
- Chen (2015) Chen T., 2015, Master’s thesis, The University of Manchester
- Clemens & Rosen (2004) Clemens J. C., Rosen R., 2004, ApJ, 609, 340
- Clemens & Rosen (2008) Clemens J. C., Rosen R., 2008, ApJ, 680, 664
- Cordes (1978) Cordes J. M., 1978, ApJ, 222, 1006
- Deshpande & Rankin (1999) Deshpande A. A., Rankin J. M., 1999, ApJ, 524, 1008
- Deshpande & Rankin (2001) Deshpande A. A., Rankin J. M., 2001, MNRAS, 322, 438
- Drake & Craft (1968) Drake F. D., Craft H. D., 1968, Nature, 220, 231
- Dyks (2017) Dyks J., 2017, MNRAS, 472, 4598
- Edwards (2004) Edwards R. T., 2004, A&A, 426, 677
- Edwards & Stappers (2002) Edwards R. T., Stappers B. W., 2002, A&A, 393, 733
- Edwards & Stappers (2003) Edwards R. T., Stappers B. W., 2003, A&A, 410, 961
- Edwards & Stappers (2004) Edwards R. T., Stappers B. W., 2004, A&A, 421, 681
- Edwards et al. (2003) Edwards R. T., Stappers B. W., van Leeuwen A. G. J., 2003, A&A, 402, 321
- Fung et al. (2006) Fung P. K., Khechinashvili D., Kuijpers J., 2006, A&A, 445, 779
- Gangadhara (1997) Gangadhara R. T., 1997, A&A, 327, 155
- Gil & Sendyk (2003) Gil J. A., Sendyk M., 2003, ApJ, 585, 453
- Gogoberidze et al. (2005) Gogoberidze G., Machabeli G. Z., Melrose D. B., Luo Q., 2005, MNRAS, 360, 669
- Hassall et al. (2013) Hassall T. E., et al., 2013, A&A, 552, A61
- Hewish et al. (1968) Hewish A., Bell S. J., Pilkington J. D. H., Scott P. F., Collins R. A., 1968, Nature, 217, 709
- Huguenin et al. (1970) Huguenin G. R., Taylor J. H., Troland T. H., 1970, ApJ, 162, 727
- Ilie & Weltevrede (2018) Ilie C.-D., Weltevrede P., 2018, in Weltevrede P., Perera B. B. P., Preston L. L., Sanidas S., eds, IAU Symposium Vol. 337, Pulsar Astrophysics the Next Fifty Years. pp 79–82, doi:10.1017/S1743921317009991
- Ilie et al. (2019) Ilie C. D., Johnston S., Weltevrede P., 2019, MNRAS, 483, 2778
- Johnston & Kerr (2018) Johnston S., Kerr M., 2018, MNRAS, 474, 4629
- Karuppusamy et al. (2011) Karuppusamy R., Stappers B. W., Serylak M., 2011, A&A, 525, A55
- Kennett & Melrose (1998) Kennett M., Melrose D., 1998, Publ. Astron. Soc. Australia, 15, 211
- Komesaroff (1970) Komesaroff M. M., 1970, Nature, 225, 612
- Lyubarsky (2002) Lyubarsky Y. E., 2002, in Becker W., Lesch H., Trümper J., eds, Neutron Stars, Pulsars, and Supernova Remnants. p. 230 (arXiv:astro-ph/0208566)
- Manchester (1975) Manchester R. N., 1975, Proceedings of the Astronomical Society of Australia, 2, 334
- Manchester et al. (1975) Manchester R. N., Taylor J. H., Huguenin G. R., 1975, ApJ, 196, 83
- McSweeney et al. (2017) McSweeney S. J., Bhat N. D. R., Tremblay S. E., Deshpande A. A., Ord S. M., 2017, ApJ, 836, 224
- Melrose (1979) Melrose D. B., 1979, Australian Journal of Physics, 32, 61
- Melrose et al. (2006) Melrose D., Miller A., Karastergiou A., Luo Q., 2006, MNRAS, 365, 638
- Petrova (2001) Petrova S. A., 2001, A&A, 378, 883
- Petrova & Lyubarskii (2000) Petrova S. A., Lyubarskii Y. E., 2000, A&A, 355, 1168
- Radhakrishnan & Cooke (1969) Radhakrishnan V., Cooke D. J., 1969, Astrophys. Lett., 3, 225
- Ramachandran et al. (2002) Ramachandran R., Rankin J. M., Stappers B. W., Kouwenhoven M. L. A., van Leeuwen A. G. J., 2002, A&A, 381, 993
- Rankin & Ramachandran (2003) Rankin J. M., Ramachandran R., 2003, ApJ, 590, 411
- Rankin et al. (2006) Rankin J. M., Ramachandran R., van Leeuwen J., Suleymanova S. A., 2006, A&A, 455, 215
- Rosen & Demorest (2011) Rosen R., Demorest P., 2011, ApJ, 728, 156
- Ruderman & Sutherland (1975) Ruderman M. A., Sutherland P. G., 1975, ApJ, 196, 51
- Smits et al. (2005) Smits J. M., Mitra D., Kuijpers J., 2005, A&A, 440, 683
- Smits et al. (2007) Smits J. M., Mitra D., Stappers B. W., Kuijpers J., Weltevrede P., Jessner A., Gupta Y., 2007, A&A, 465, 575
- Taylor et al. (1971) Taylor J. H., Huguenin G. R., Hirsch R. M., Manchester R. N., 1971, Astrophys. Lett., 9, 205
- Vivekanand & Joshi (1997) Vivekanand M., Joshi B. C., 1997, ApJ, 477, 431
- Weltevrede (2016) Weltevrede P., 2016, A&A, 590, A109
- Weltevrede & Johnston (2008) Weltevrede P., Johnston S., 2008, MNRAS, 391, 1210
- Weltevrede et al. (2003) Weltevrede P., Stappers B. W., van den Horn L. J., Edwards R. T., 2003, A&A, 412, 473
- Weltevrede et al. (2006) Weltevrede P., Edwards R. T., Stappers B. W., 2006, A&A, 445, 243
- Weltevrede et al. (2007) Weltevrede P., Stappers B. W., Edwards R. T., 2007, A&A, 469, 607
- Wright (2003) Wright G. A. E., 2003, MNRAS, 344, 1041
- Wright & Fowler (1981) Wright G. A. E., Fowler L. A., 1981, in Sieber W., Wielebinski R., eds, IAU Symposium Vol. 95, Pulsars: 13 Years of Research on Neutron Stars. p. 211
- van Leeuwen & Timokhin (2012) van Leeuwen J., Timokhin A. N., 2012, ApJ, 752, 155
- van Leeuwen et al. (2002) van Leeuwen A. G. J., Kouwenhoven M. L. A., Ramachandran R., Rankin J. M., Stappers B. W., 2002, A&A, 387, 169
- van Straten & Bailes (2011) van Straten W., Bailes M., 2011, Publ. Astron. Soc. Australia, 28, 1