Does hospital cooperation increase the quality of healthcare?
Abstract
Motivated by reasons such as altruism, managers from different hospitals may engage in cooperative behaviours, which shape the networked healthcare economy. In this paper we study the determinants of hospital cooperation and its association with the quality delivered by hospitals, using Italian administrative data. We explore the impact on patient transfers between hospitals (cooperation/network) of a set of demand-supply factors, as well as distance-based centrality measures. We then use this framework to assess how such cooperation is related to the overall quality for the hospital of origin and of destination of the patient transfer. The over-dispersed Poisson mixed model that we propose, inspired by the literature on social relations models, is suitably defined to handle network data, which are rarely used in health economics. The results show that distance plays an important role in hospital cooperation, though there are other factors that matter such as geographical centrality. Another empirical finding is the existence of a positive relationship between hospital cooperation and the overall quality of the connected hospitals. The absence of a source of information on the quality of hospitals accessible to all providers, such as in the form of star ratings, may prevent some hospitals to engage and cooperate with other hospitals of potentially higher quality. This may result in a lower degree of cooperation among hospitals and a reduction in quality overall.
Keywords: hospital cooperation, patient flows, social relation model, healthcare quality
1 Introduction
In recent years, several central and local governments in Western countries such as the UK and Italy, have implemented pro-competition reforms in their healthcare sectors with the view that, as predicted by the economic theory, more competition among hospitals, when prices are regulated, would lead to improvements in the quality of healthcare services, ultimately having a positive impact on the health outcomes of the population. While there has been a wide and alive debate among health economists on the effects of competition on hospital quality (Berta et al., 2016; Choné, 2017; Colla et al., 2016; Mascia et al., 2017; Mukamel et al., 2002; Gaynor, 2006; Gaynor et al., 2017; Propper et al., 2004), little is known on cooperative behaviours among healthcare providers, and their effects on health outcomes. The question whether cooperation exists is important. If it does, we first need to understand the mechanisms underlying cooperation and then whether it has a positive, a null or even a negative effect on hospital quality.
Why should economic agents cooperate? Economists have addressed this question with game theory, starting with the example of the prisoner dilemma to more complex dynamic games that find their applications in different areas of applied economics such as trade. Similarly, in the healthcare sector doctors, economic actors such as nurses, or managers may decide under certain rules, strategies, and payoffs, to cooperate rather than to act independently. Managers from different hospitals, who are motivated by reasons such as convenience or altruism, may decide to cooperate, with the aim of improving efficiency and health outcomes of their respective organizations (Gittell and Weiss, 2004; Mascia et al., 2012). Such cooperation can take various forms, ranging from merging facilities to clinical network information sharing, joint treatment or joint diagnostic centres, new shared assets and joint construction of new facilities. Informal cooperation between healthcare providers may also take place. This occurs for example when we observe the existence of a network between professionals, healthcare providers or the management boards of different hospitals (Westra et al., 2017). For example, physicians from any two hospitals may collaborate when treating a patient, thus creating correlations in health indicators across hospitals (Westra et al., 2016). However, these networks tend to predominate within rather than between hospitals (Barnett et al., 2011; Landon et al., 2012; Pollack et al., 2012).
In this paper, we study the informal network that is generated among healthcare providers when a patient is transferred across hospitals. Under the assumption that hospital managers are altruistic agents, hospitals decide to transfer patients to other hospitals when the benefits of transfer outweigh the risks. While the decision to transfer a patient is usually driven by the availability of specialized care in the hospital of origin and destination, the choice of the destination hospital may be driven, among other things, by its geographical proximity, demand-supply factors of the hospital of origin and destination, as well as the relative quality of the hospital of origin with respect the hospital of destination. However, hospital managers in some countries may not know the distribution of quality across the other hospitals in the healthcare sector, thus their choice will be driven by a measure of perceived relative quality. This source of asymmetric information may produce different effects: if the relative perceived quality is reflecting the relative “true quality”, we should expect that cooperation will improve overall health outcomes of both hospital of origin and destination. However, if the relative perceived quality is negatively associated with the relative “true quality”, cooperation may even harm patients in both hospitals. Policy makers may have a strong interest in understanding the drivers underlying these cooperation networks in order to be able to design effective policy interventions, as well as identifying healthcare provider links that actually improve the health outcome of the transferred patient.
In this paper we study the determinants of hospital cooperation and its association with the quality delivered by the networking hospitals. We first explore the impact on patient transfers between hospitals (cooperation network) of a set of demand-supply factors, as well as centrality measures from the network of geographical distances, including factors related to hospital quality. The decision of including quality in the manager’s hospital transfer choice is coherent with our context whereby policy makers know the distribution of adjusted quality across the territory, and this information is partially revealed to the hospital managers, as explained further in Section 3. On the other hand, in order to study the effects of cooperation (patient transfer) on overall quality for the hospital of origin and of destination, the first stage will be estimated after excluding hospital quality and all the variables possibly correlated with it, since real patient transfer flows can be influenced by hospital quality if the decision of the referring hospital is based, among other things, on the relative quality of the destination hospital. Such endogeneity may bias results when regressing the transfers on health outcomes.
Following the literature on social relations models (Warner et al., 1979; Hoff, 2005), we adopt an over-dispersed Poisson mixed model that is suitable to handle network data. These statistical models are rarely used in health economics and health research in general. We use data on hospital discharges for over 900,000 patients admitted to 145 hospitals in the Lombardy region (Italy) in 2014. Among these patients, around 15,500 (1.7%) were transferred to other hospitals after admission. Our results show that geographical distance plays an important role in hospital cooperation, although there are also other factors that matter, such as the geographical centrality of a hospital. Another empirical finding is the existence of a positive relationship between hospital cooperation and the overall clinical quality for the hospital of origin and of destination.
The remainder of the paper is organized as follows. Section 2 reviews the literature on the determinants of patient flows and the impact of cooperation on hospital quality. Section 3 describes the data, introducing the Italian NHS and the Lombardy healthcare system, which is the focus of our empirical investigation. Section 4 undertakes an exploratory data analysis of networks of transfers. Section 5 estimates patient flows via an over-dispersed Poisson mixed models. Section 6 estimates the impact of cooperation on the hospital quality. Section 7 makes some concluding remarks and plans for future work.
2 Literature background
The basis for modelling patient flows across geographical locations is the gravity model (Silva and Tenreyro, 2006), which involves a “mass” term for both the origin and destination units, and incorporates the impact of geographical distance. There exists a strand of literature in health economics that uses the gravity model to investigate the determinants of patient flows at regional, Local Health Authority (LHA) or hospital/ward level (Levaggi and Zanola, 2004; Shinjo and Aramaki, 2012; Congdon, 2001; Balia et al., 2018; Cantarero, 2006; Fabbri and Robone, 2010; Mascia et al., 2012). For example, Balia et al. (2018) adopt a gravity model to investigate the determinants of patient mobility among Italian regions for the period 2001-2010 using data on hospital discharges. The authors find that income, hospital capacity and the regional technological level are the key drivers of patient regional flows. Congdon (2001), using data on emergency units in 127 electoral wards in North East London and Essex, finds patient age and the travel distance to be the main drivers to patient flows. In general, regardless of the level of aggregation of the data used, these studies find that the most important variables explaining patient transfers are: geographical distance between healthcare providers, patient characteristics, the capacity of hospitals, the availability of medical technologies, and the quality of health services.
There is an emerging interest in studying the determinants of patient hospital transfers by adopting a network analysis approach. Some authors have summarised the network in the form of centrality measures, some others have modelled directly the presence of an edge between two hospitals, i.e. a cooperation between two hospitals. In particular, Lomi and Pallotti (2012) and Caimo et al. (2017) use exponential random graph models to link the tendency of hospitals to cooperate with hospital characteristics and a set of network summary statistics, such as the density of the network, the presence of mutual edges, or reciprocity, and of triads. Using administrative data for 91 hospitals located in the Lazio region (Italy), the authors find that hospitals’ proximity and sharing an administrative membership facilitate cooperation. Furthermore, they find the presence of local networks, with the tendency to reciprocity among hospitals.
Differently from the works cited above, Mascia et al. (2015) studies the effect of patient transfers, and particularly of the topological properties of the network of flows, on hospital quality. The authors adopt a multilevel model approach to describe the impact of measures of centrality and ego-network density of the network of transfers on readmissions within 45-days after the discharge. Using administrative data for 31 hospitals in the region of Abruzzo (Italy), they find that greater network centrality, in the form of hospitals with many flows with other hospitals who are also central, is negatively associated with readmissions, whereas greater ego-network density, represented by a high sharing of patients among hospitals that are connected to a central hospital, increases the likelihood of readmissions, thus reducing the quality provided.
The works reviewed above have contributed to identifying the determinants of cooperation between hospitals, and will be used in Section 5 as a guidance to specify our empirical model. In particular, we will model cooperation between hospitals by including demand-supply variables, hospital quality, geographical distance as well as distance-based centrality measures that account for spatial correlation in the data. Further, similarly to Mascia et al. (2015), we will consider mortality rate as well as readmissions as health outcomes, but we perform the analysis on a different Italian region (Lombardy) and across a larger number of hospitals (145). In contrast to Mascia et al. (2015), however, we also consider the fact that quality may be a contributing factor in the decision of a hospital to transfer a patient to a different hospital, and we therefore opt for a two-stage approach.
3 Data
The Italian National Healthcare System (NHS) follows the Beveridge model (Beveridge et al., 1942), providing universal healthcare coverage throughout the country as a single payer. It entitles all citizens, regardless of their social status, to equal access to essential healthcare services. In 1992, a system reform transferred administrative and organizational responsibilities and tasks from the central government to the administrations of the 21 regions in Italy. These regions now have significant autonomy on the revenue side and in organizing services designed to meet the needs of their respective populations.
The Lombardy healthcare system was reformed in 1997 becoming a quasi-market system made up of both public and private providers which are reimbursed by a prospective payment system based on Diagnosis Related Groups (DRGs) (Brenna, 2011; Berta et al., 2010, 2013). The reimbursement provided to the hospitals for each discharge is defined according to specific DRG tariffs, revised every year by the regional government on the basis of increasing costs due to the introduction of new medical technologies and also taking into account the introduction of new policies. These public regional reimbursements represent the majority of revenues for acute discharges in all hospitals located in Lombardy. The Lombardy healthcare system yearly provides the results on hospital quality on a web portal in which hospitals can access and see their performance rankings with respect to other hospitals within the region. The regional health authority provides a hospital classification into three groups depending on whether the quality is significantly above, not different, or significantly below the regional average performance. Along this information, managers may hold informal information on the quality of hospitals; this is the reason of why in Section 5 we will control for hospital quality when studying the impact on patient transfers between hospitals (cooperation/network).
In this paper, we analyse data gathered from the administrative regional healthcare information system, which includes information on patients discharged from 145 hospitals accredited with the regional healthcare system in the Lombardy region (Italy) in the year 2014. The dataset contains 1,541,996 hospitalizations, of which 84% were ordinary and 16% were in day hospital or day surgery. Furthermore, hospitalizations of patients living outside the Lombardy region accounted for 10% of all admissions. The hospital discharge data contains demographic information such as age and gender, information on hospitalization (length of stay, special-care unit use, transfers within the same hospital or through other facilities, and within-hospital mortality), and a total of 6 diagnosis codes and surgical procedures defined according to the International Classification of Diseases, Ninth Revision, Clinical Modification (ICD-9-CM). Only ordinary hospitalizations for patients aged more than 2 years were retained in the sample. We define a transfer between hospitals by a patient discharged from a hospital and then admitted in another hospital on the same day or the next one (Iwashyna et al., 2009). In order to exclude any patient involvement in this process, we exclude voluntary discharges. Finally, we define mortality by the death of the patient in hospital, or within 30 days after the discharge, and we define readmission by a patient readmission within 45-days after the discharge and for the same major diagnostic class.
| Private Hospitals | Public Hospitals | Overall | ||||
| mean | sd | mean | sd | mean | sd | |
| Outcomes | ||||||
| Mortality rate | 0.04 | 0.04 | 0.07 | 0.04 | 0.07 | 0.04 |
| Readmission rate | 0.08 | 0.03 | 0.11 | 0.05 | 0.10 | 0.04 |
| Patient Characteristics | ||||||
| Female (F) | 0.51 | 0.08 | 0.56 | 0.10 | 0.54 | 0.10 |
| Age (A) | 64.38 | 7.00 | 61.03 | 7.41 | 62.37 | 7.41 |
| DRG Weight (DW) | 1.24 | 0.27 | 1.10 | 0.21 | 1.16 | 0.24 |
| Hospitals Characteristics | ||||||
| Beds Saturation (BS) | 61.12 | 20.55 | 79.24 | 10.30 | 71.99 | 17.60 |
| Beds Turnover (BT) | 40.10 | 11.43 | 40.98 | 8.25 | 40.63 | 9.62 |
| Distance in minutes (D) | 59.60 | 15.89 | 66.83 | 21.43 | 63.94 | 19.67 |
| # Hospitals | 58 | 87 | 145 | |||
| # Transfers | 3,024 | 12,492 | 15,516 | |||
| # Hospital Discharges (HD) | 256,909 | 643,242 | 900,151 | |||
Table 1 provides a set of descriptive statistics on health outcomes and patient and hospital characteristics, split by hospital ownership (private and public). Around 45% of the hospitals are private, although they only cover 28% of the hospitalizations. It is interesting to observe that, while patient demographic characteristics (age and gender) are similar for private and public hospitals, their case-mix is quite different, with private hospitals having a higher DRG weight. In terms of health outcomes, we observe that gross rates are higher in public hospitals compared to the private, with a small difference for readmissions and a bigger gap for mortality. This is not directly related with the quality provided by the two types of providers, but it is more related with the different case-mix of patients admitted in public and private hospitals. In terms of hospital characteristics, the table reports the beds saturation index, or occupancy rate, which is measured by the average number of days when a hospital bed is occupied as a percentage of the available 365 days, and the beds turnover index, which is a measure of the extent of beds’ utilization and is measured by the number of changes in bed occupancy during the year. The statistics show that, while public hospitals are on average bigger than private ones and with a higher saturation index, the turnover index is similar between private and public hospitals. Finally, looking at the distance between hospitals, which is measured by the travel time between any two hospitals, the table shows how public hospitals tend to be on average slightly more distant (approximately 7 minutes more) than private ones. These variables will be used in the models presented in the next sections.
4 Exploratory analysis of the network of transfers
As discussed in the introduction, we measure hospital cooperation using the network of patient transfers. In this network each hospital in Lombardy is a node and the edges are the connections between two hospitals with a weight defined by the number of patient transfers between the two hospitals. Table 1 reports the total number of transfers, split by hospital ownership. In Table 2 we further describe the network of transfers using various measures of network centrality from the network modelling literature (Kolaczyk and Csárdi, 2014), but also considered in the literature of patient flows (Fernández-Gracia et al., 2017).
| Overall | Private Hospitals | Public Hospitals | |
|---|---|---|---|
| In-Centrality | 5.0633 | 2.4328 | 6.3969 |
| In-Closeness | 0.0976 | 0.0299 | 0.2061 |
| In-Strength | 0.4454 | 0.3771 | 0.4053 |
| Betweenness | 0.1390 | 0.1499 | 0.1385 |
| Out-Centrality | 2.9730 | 1.6258 | 3.3388 |
| Out-Closeness | 0.0249 | 0.0170 | 0.2033 |
| Out-Strength | 0.3273 | 0.2017 | 0.4053 |
| # Hospitals | 58 | 87 | 145 |
In particular we consider the in-centrality of the network, which is based on the in-degrees of all nodes in the network, i.e. the number of hospitals from which a given hospital receives transferred patients. Similarly, the out-centrality measures the number of hospitals to which patients are transferred from a given hospital, across all nodes. The in- and out-strength indices further consider the weights associated to each edge, i.e. the number of patients received/transferred by a hospital. In addition, we calculate the closeness of the network, indicating the proximity of each node with the other nodes in terms of the number of steps needed to go from a hospital to the transferring/receiving hospital. Similarly, betweenness quantifies the number of times a hospital is a bridge for the other hospitals in the network. Each measure is calculated using the centr_degree function in the igraph R package (Csárdi and Nepusz, 2006), from which normalized scores are automatically calculated which are comparable across graphs of different sizes. The results are presented in Table 2 for the overall network, as well as for the two sub-networks of private-only and public-only hospitals. Overall, the results appear to show how the network is rather centralized and how there is a higher tendency for nodes to have a large in-degree (i.e. receiving from many other hospitals) than out-degree. In addition, it appears that the network of public hospitals has more central nodes/hubs than the network of private hospitals.
Aside from centrality measures and with a view to finding determinants of patient flows, we next consider approaches to identify possible structures in the network, for example in the form of partitions of the network where nodes belonging to the same partition are strongly connected among them and sparsely connected with the nodes belonging to different partitions. To this aim, the network of transfers has been analyzed using a community detection method. In particular we consider the method by Blondel et al. (2008), which is highlighted by Yang et al. (2016) in their comparative study and where partitions are searched based on improvements of the modularity score. Figure 1 shows the optimal partition for the network of transfers, obtained using the multilevel.community function in the igraph R package (Csárdi and Nepusz, 2006). The figure shows a strong relationship between the modularity-detected communities and their geographical location.
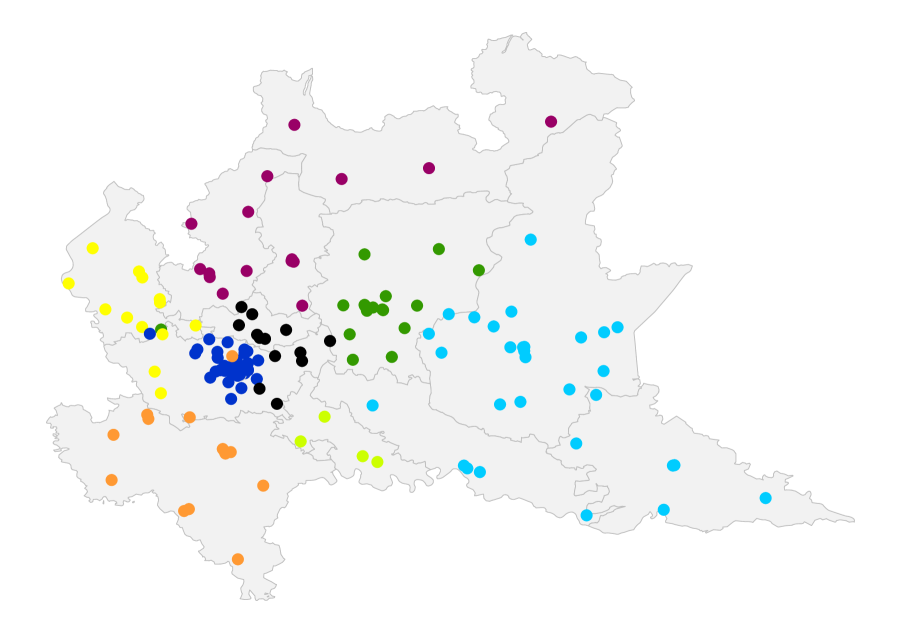
Nine communities are detected and most of them correspond to specific municipalities in Lombardy (e.g. Pavia, Lodi and Bergamo correspond to the orange, red and green communities, respectively ). The metropolitan area of Milan, where the most part of the hospitals are located, is characterized by three different communities: the eastern part of Milan shares the community with the municipality of Monza-Brianza (black dots), the western part shares the hospitals with the community of Varese (yellow dots), whereas the central part identifies one single community (blue dots). Finally two more communities are identified: one that is characterized by the presence of the mountains in the north and include the municipalities of Sondrio, Como and Lecco (purple dots) and the second one which is characterized by the eastern part of the region and is shared by the municipality of Cremona, Mantua and Brescia (azure dots). The community detection approach has shown how both the distance between hospitals and the belonging to the same Local Health Authorities (LHS), are substantial factors in defining the network of hospital transfers. This finding is consistent with the literature (Lomi and Pallotti, 2012; Mascia et al., 2012; Caimo et al., 2017). On the basis of this explorative analysis, we will include both distance and co-memberships to LHAs as determinants of patient transfers in the next analysis. For that purpose, it is also important to emphasize that these determinants are exogenous to the quality of hospitals.
5 Modelling patient flows via an over-dispersed Poisson mixed model
In order to predict the network of patient transfers from a number of exogenous determinants, we resort to the literature on social relations models (Warner et al., 1979), where the statistical dependencies inherent in dyadic data are carefully considered and accounted for. This results in a general class of mixed effect models, where random effects are included in order to control for node effects, which are typical of network data where multiple observations relate to the same node/edge. These models, not considered in the healthcare literature before, but known in the network modelling literature (Hoff, 2005), have been implemented in the amen R package using a Bayesian inferential approach (Hoff et al., 2017). Since the dependent variable in our study is discrete, we will extend the existing implementations to the case of an over-dispersed Poisson mixed model.
Going to the details of the model, let be the number of transfers between hospital and . Since the data is in the form of a network, statistical dependencies are to be expected, for example the fact that data associated to the same hospital of origin (i.e. a row of the matrix of transfers) or to the same destination hospital (i.e. a column of the matrix of transfers) may be more similar to each other than to the rest of the observations. We model these dependencies using the mixed model
| (1) |
where the errors have the following dependency structure
with and , , the random effects for the sender and receiver hospitals, respectively, and the errors. This model induces a covariance among the given by:
That is, represents the correlation of observations having a common hospital sender, whereas defines the dependence of observations having a common hospital receiver. Since the network is asymmetric, measures the “reciprocity” between sender and receiver hospitals, that is the dyadic correlation between the number of transfers from to and those from to . In addition, accounts for over-dispersion: when is zero, the model is a simple Poisson mixed model, whereas when increases, the conditional variance of becomes larger than the mean.
Several covariates are included in the model in Equation (1), both at the node and at the dyadic level. In line with the literature (Mascia et al., 2012, 2015) we include in the model the dyadic covariates of geographical distance between two hospitals () and their co-membership (CM), an indicator variable identifying if the two hospitals belong to the same LHA. We also control for the degree centrality () of both origin () and destination () hospital. This is measured based on a geographical network where two hospitals are linked if they are less than 30 minutes of effective time travel apart. This variable allows to adjust the predictions for the hospitals’ concentration in a pre-defined space, the hypothesis being that a higher value of this index for the origin hospital indicates a wider choice set for the hospital that needs to decide where to transfer a patient, and similarly for the destination hospital. We also include in the model the betweenness index (), calculated for each node of the geographical network and rescaled to a minimum of zero and a maximum of one. In terms of hospital or node-based characteristics, we control for the number of discharges of both the sender and receiver hospitals () as well as for the severity of patients treated in a hospital. For the latter, we include both the variable DRG Weight (), taken also as a measure of resources that the hospital employs to treat patients (Berta et al., 2013), and the patient age (), measured as an average at the hospital level. Similarly, we control for the patient hospital mix in terms of gender composition by including in the model the percentage of female patients in a hospital (). Furthermore, we include specific hospital characteristics for both sender and receiver hospitals which identify if the hospital is a teaching hospital or not (), if it is a monospecialized or a general hospital () and if the hospital is highly equipped or not in terms of technology (). Finally, we include hospital beds saturation and hospital beds turnover indices, in order to measure the beds capacity of a hospital and the efficiency in using beds (Lomi et al., 2014; Mascia et al., 2017), and two variables measuring the hospital quality: adjusted mortality () and adjusted 45-days readmissions ().
We estimate the model in Equation 1 via a Bayesian MCMC algorithm, adapting the implementation in the ame function of the amen R-package (Hoff et al., 2017) to the case of a Poisson distributed dependent variable. We use a burn-in window of 1000 iterations, followed by 10000 iterations, where we save the estimated parameters every 25th iteration. Table 3 shows the posterior mean estimates of the parameters.
The variable geographical distance shows that the shorter the distance between two hospitals the higher the number of transfers. This was to be expected from our earlier exploratory analysis (Figure 1), despite the high density of hospitals in Lombardy. Similarly, as expected, the co-membership of the hospitals to the same LHA increases the patient flows between hospitals. These associations are reported also by other studies (Caimo et al., 2017; Landon et al., 2012; Mascia et al., 2012) and explained by the fact that low distance in the transfer of a patient is typically prefered by hospitals in order to reduce the costs for travelling and the risks for the patient associated to the transfers. The positive and significant relationship between the degree centrality and the transfers indicates that when the set of opportunities for transferring/receiving patients increases, the hospitals tend to transfer/receive more patients. In order to check the robustness of this result, we have repeated the analysis using degree centrality indices based on several thresholds of the distances (between 20 and 40 minutes). We have observed a correlation of over 0.90 among the predicted values across these different thresholds, suggesting a robustness of this finding. Further, adjusting for hospital discharges proves to be important when explaining variation in patient flows.
With regards to patient characteristics, the analysis suggests that the demographic characteristics of the average patient in a hospital, such as age and gender, do not have a significant impact on the number of patient transfers, whereas the severity of their conditions and the ability of the hospitals in managing beds have a significant impact on the number of patient transfers. In terms of other hospital characteristics, we find that being a destination teaching hospital increases the transfers, and, similarly, being a technological hospital is positively related with the transfers for both origin and destination hospitals. This might suggest that hospitals with a low level of technology move complicated patients to the technological hospital in order to provide for example a cardiosurgical intervention, but when the patients overcome the critical post-surgical phase, they are likely to be moved back to the previous hospital. In this way, the patient receives necessary assistance, releasing the bed in the technological hospital for a new hospitalization. Finally, the variables attached to hospital quality do not seem to play a role in explaining patient flows, most likely due to the fact that hospital managers in the Lombardy Region do not fully know the distribution of quality across the healthcare system.
The inference also provides a quantification of the level of dependencies in the data: in particular, the relatively large value of the parameter suggests a high correlation of the two observations associated to an edge in the network and thus a high level of reciprocity between connected hospitals. The same can be said for and , whose large values suggest the presence of row and column effects. These findings support the need for the use of more advanced mixed effect models in our study.
| Estimate | Std. Error | ||
| (Intercept) | -12.931 | *** | 3.147 |
| Distance | -0.070 | *** | 0.002 |
| Co-membership | 1.787 | *** | 0.081 |
| Origin | |||
| Hospital Discharges | 0.075 | *** | 0.016 |
| DRG Weight | -0.012 | 0.442 | |
| Age | 0.026 | 0.019 | |
| Female | -0.804 | 1.053 | |
| Degree Centrality | 0.059 | *** | 0.004 |
| Betweenness | -0.678 | 0.567 | |
| Teaching Hospital | 0.075 | 0.222 | |
| Monospecialized Hospital | -0.373 | 0.290 | |
| Technological Hospital | 0.887 | *** | 0.203 |
| Public vs Private | 0.681 | ** | 0.209 |
| Risk-Adj. Mortality | -0.035 | 0.025 | |
| Risk-Adj. 45-days Readmissions | 0.033 | 0.028 | |
| Beds Saturation | 0.023 | *** | 0.006 |
| Beds Turnover | 0.009 | 0.011 | |
| Destination | |||
| Hospital Discharges | 0.088 | *** | 0.017 |
| DRG Weight | 1.199 | ** | 0.474 |
| Age | -0.035 | * | 0.019 |
| Female | -1.831 | * | 1.106 |
| Degree Centrality | 0.046 | *** | 0.004 |
| Betweenness | 0.449 | 0.580 | |
| Teaching Hospital | 0.536 | ** | 0.230 |
| Monospecialized Hospital | 0.328 | 0.312 | |
| Technological Hospital | 0.918 | *** | 0.205 |
| Public vs Private | 0.288 | 0.213 | |
| Risk-Adj. Mortality | 0.034 | 0.027 | |
| Risk-Adj. 45-days Readmissions | 0.026 | 0.028 | |
| Beds Saturation | 0.026 | *** | 0.007 |
| Beds Turnover | -0.003 | 0.011 | |
| 0.544 | 0.102 | ||
| 0.362 | 0.086 | ||
| 0.616 | 0.114 | ||
| 1.961 | 0.097 | ||
| 0.886 | 0.016 |
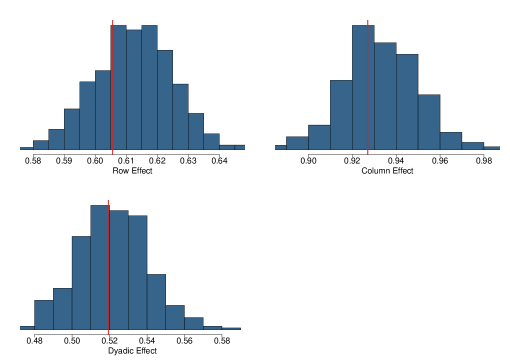
A number of checks were further conducted to measure the goodness of fit of the model. To this aim, we compared some suitably defined summary statistics of the observed network with the same statistics calculated from the predicted network generated at each iteration of the MCMC algorithm. In particular, we consider three network statistics from a given network: (1) the standard deviation of the row means; (2) the standard deviation of the column means; (3) the within-dyad correlation. The blue histograms in Figure 2 represent the posterior predictive distribution from the MCMC inference, which are to be compared with the vertical red lines representing the values of the statistics on the observed network. The figure shows a good fit of the model, with the observed statistics lying at the centre of the corresponding posterior distributions from the model.
6 The impact of the cooperation on the hospital quality
As explained in the introduction we assume that cooperation between hospitals may have a positive, negative or null effect on overall quality in a healthcare system. In our study, quality is measured in terms of both mortality and readmission, which are the most adopted outcomes in the healthcare literature in order to evaluate the hospital effectiveness. Mortality is defined by a variable assuming value 1 if the patient dies in hospital or within 30 days after the discharge, and 0 otherwise, whereas readmission is measured by a binary variable equal to 1 if the patient is readmitted to the same hospital or to another hospital within 45 days from a discharge and for the same clinical condition.
Using the model described in the previous section (Equation (1)) we obtain the predicted transfers, , which, are now predicted from a set of covariates not related to the hospital quality. In addition, in order to avoid further problems of endogeneity, is calculated excluding the hospital random effects because these can be related with characteristics such as the teaching status or the hospital specialisation (cardiological hospital, neurological hospital, etc), which can affect hospital quality. We then relate these predicted transfers with the overall quality for the hospitals and , which we measure by
| (2) |
when and represent the mortality/readmission of the pair of hospitals and , respectively. We decided to adopt a measure of overall quality instead of a measure of mortality or readmissions split by both sender and receiver hospitals because we are interested in estimating the impact of cooperation on the overall quality of the healthcare system. In fact, if a hospital sends a patient with a very high risk of mortality or readmission to another hospital and the patient dies or is thereafter readmitted, this increases the mortality and the readmission rate of the receiver but does not impact on the quality of the pair, since the patient would have most likely died or been readmitted in the hospital from which he/she was transferred. Considering the overall mortality and readmissions allows us to take into account the effect of the cooperation between hospitals on the overall quality of both the sender and receiver hospitals, which is at its lowest when both outcomes are being reduced.
Since the dependent variable defined in Equation (2) is also in the form of counts, we model via an over-dispersed Poisson mixed effect model similar to that used in the previous section:
| (3) |
where , is the hospital random effect which is now drawn from the same distribution for the origin and destination hospitals, since is symmetric, and . As expressed for the model in Equation (1), the parameter captures a potential over-dispersion in the conditional distribution of the dependent variable.
The coefficient in Equation (3) is of interest in order to assess the impact of cooperation on hospital quality. The model is also scaled by the overall discharges of the hospitals’ pair (), now taken as the average of the discharges between the two corresponding hospitals since the dependent variable is symmetric, as well as by a number of other variables typically used in healthcare evaluations (Berta et al., 2016; Peluso et al., 2016; Berta et al., 2013; Mascia et al., 2015). In particular, we consider the patient age (), the DRG weight () and gender (), all calculated as averages of the two connected hospitals. Moreover, we consider the hospital ownership (), which is defined as a dyadic variable taking values public-public, private-private, public-private, respectively. Similarly, we also include dyadic covariates to control for the teaching status of the hospital pair (), their status as monospecialized or general hospitals (), and their status as technological hospitals (). As with ownership, these variables are defined as categorical variables, taking three possible values.
Table 4 shows the results of the model described in Equation (3) using the same MCMC settings as those used for Model (1). These results form the core of the paper, where we analyze the effect of cooperation between hospitals on the quality of the healthcare system. The analysis shows a negative and significant effect for the predicted transfers on the health outcomes, for both mortality and readmissions. This means that the higher is the cooperation between a pair of hospitals the higher is the quality for the two associated hospitals, thus suggesting a positive impact of inter-organizational cooperation to the healthcare system. In particular, the parameters for the predicted transfers indicate that an increase of one patient transfer produces a reduction of 1.9% in the average mortality and of 2.2% in readmissions.
| Mortality | Readmission | ||||||
| Estimate | Std. Err. | Estimate | Std. Err. | ||||
| (Intercept) | 1.689 | 1.039 | 5.830 | *** | 0.913 | ||
| Hospital Discharges (HD) | 0.084 | *** | 0.006 | 0.089 | *** | 0.007 | |
| DRG Weight (DW) | 0.521 | ** | 0.173 | 0.666 | *** | 0.183 | |
| Age (A) | 0.017 | *** | 0.005 | -0.010 | ** | 0.005 | |
| Female (F) | 0.512 | 0.402 | -0.041 | 0.358 | |||
| -0.012 | *** | 0.003 | -0.013 | *** | 0.003 | ||
| Private and Private | -0.772 | *** | 0.155 | -0.460 | * | 0.267 | |
| Public and Private | -0.293 | *** | 0.078 | -0.174 | 0.134 | ||
| Technological and Technological | -0.293 | *** | 0.078 | -0.174 | 0.134 | ||
| Technological and Not Technological | -0.564 | *** | 0.011 | -0.613 | *** | 0.009 | |
| Teaching and Teaching | 0.003 | 0.004 | 0.003 | 0.004 | |||
| Teaching and Not Teaching | -0.010 | 0.020 | -0.111 | *** | 0.015 | ||
| Monospecialized and Monospecialized | -0.001 | 0.005 | 0.000 | 0.004 | |||
| Monospecialized and General | -0.341 | *** | 0.043 | 0.004 | 0.032 | ||
| 0.116 | 0.013 | 0.065 | 0.008 | ||||
| 0.074 | 0.004 | 0.055 | 0.002 | ||||
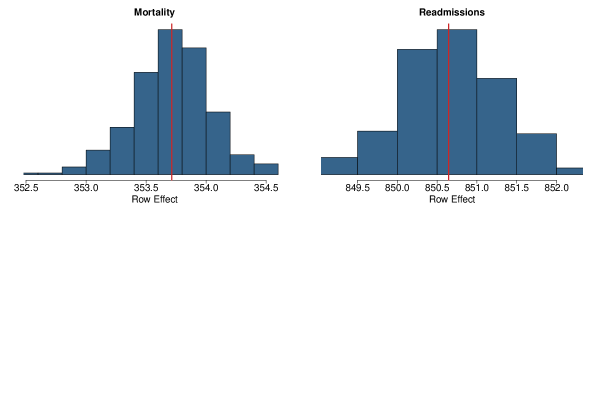
Finally, Figure 3 shows a good fit of the models, both for the case of mortality and readmission, with a good match between observed and predicted summary statistics.
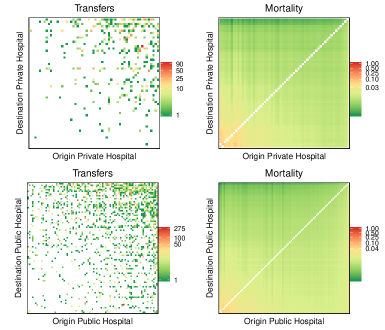
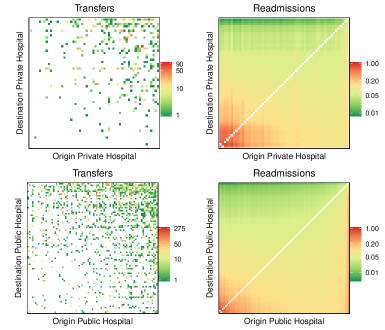
As a final step in the analysis, and considering some differences that were previously observed between private and public hospitals, we investigate whether the impact of cooperation on quality is different according to hospital ownership. To this aim, we add to Equation (3) an interaction term between predicted transfers and the hospital ownerships. The results of this analysis are presented visually in Figure 4 and Figure 5, for mortality and readmissions respectively. In both figures, the heatmaps on the left represent the observed transfers between hospitals’ pairs sharing the same ownership (private vs private on top and public vs public at the bottom), whereas the heatmaps on the right show the expected mortality predicted from the model in Equation (3), scaled by the number of discharges of the hospitals’ pairs. We observe from both analyses how public hospitals are more engaged in cooperation than private ones, and how, in both cases, cooperation is effective in improving quality, i.e. in reducing mortality and readmission.
7 Discussion
Managers from different hospitals may decide to cooperate when treating a patient. Although we recognise that there exist different channels of cooperation, in this paper we focus on the transfers of patients between hospitals. We explore the impact on patient transfers between hospitals (cooperation/network) of a set of demand-supply factors, distance-based centrality measures that account for spatial correlation in the data, as well as measures of quality. Our results confirm existing findings that geographical distance plays an important role in explaining cooperation between managers: ceteris paribus the shorter the distance between hospitals, the higher is the number of transfers. This result was confirmed by the identification of communities in the network of transfers that have a clear geographical nature. In addition, we find that geographical centrality helps in explaining the flows of transfers: holding all the other variables constant, the higher the number of opportunities where to send/receive patients, the higher is the number of patients transferred to/received by a specific hospital. Finally, we find that the intensity of cooperation between hospitals does not depend on hospital quality. This results proves that in a healthcare system where information on the distribution of hospital quality is not provided, managers may exploit insight information, or have a perception of quality, in order to engage in cooperative behaviors with other hospitals.
We then used this framework to assess, in the second stage, how such cooperation is related to the overall clinical quality for the hospital of origin and of destination of the patient transfer. One main challenge, when studying this relation, is the potential endogeneity between transfers and quality, since as we have shown in the first analysis, the decision of transferring a patient to a specific hospital is informed, among other things, by variables possibly correlated to the destination and origin hospital quality. For this reason, we have also derived an exogenous measure of transfers (cooperation) to then being able to quantify its effect on the quality of the healthcare system. When taking care of the endogeneity of cooperation, we find a positive relationship between hospital cooperation and the overall quality of the connected hospitals. This is the case both for private and public hospitals, though it is found to be more pronounced for public hospitals.
The absence of a source of information on the quality of hospitals accessible to all providers, such as in the form of star ratings, may prevent some hospitals to engage with others, with some missing the opportunity to cooperate with higher quality hospitals. This may result in a lower degree of cooperation among hospitals and a loss of overall quality. However, this asymmetric information may also prevent patients to choose high quality providers (Berta et al., 2016). In other words, we would have expected a reduction in the transfers between hospitals, had the patients known where to be hospitalized in the first instance. Thus, the transfers of patients can be seen as an informal mechanism in the market to adjust ex-post for such distortion. However, even in the absence of asymmetric information of the distribution of hospital quality, given that some patients will not be able to choose the hospital where to be admitted to (e.g. the urgent cases), effective cooperation between hospitals may prove crucial in increasing the likelihood of survival for patients. In this case, policy makers (the Lombardy Region) could design a dataset for matching between providers in order to make cooperation more prompt and effective.
Future work is needed in order to better assess the impact of hospital cooperation on quality. For instance, within the category of private hospitals there are for-profit and not for-profit organizations, with the latter being closer to the mission of the public sector. For this reason, future work should investigate whether this result will still hold when considering for-profit hospitals Moreover, future work should also explore different ways to measure the degree of cooperation between healthcare providers. For example, it could be of interest to measure cooperation by the scientific collaboration among professionals in different hospitals, which can be derived by the scientific works published jointly by physicians operating in different hospitals.
Acknowledgement
The project was partially supported by the “European Cooperation in Science & Technology” (COST) funding: action number CA15109.
References
- Balia et al. (2018) Balia, S., R. Brau, and E. Marrocu (2018). Interregional patient mobility in a decentralized healthcare system. Regional Studies 52(3), 388–402.
- Barnett et al. (2011) Barnett, M. L., B. E. Landon, A. J. O’malley, N. L. Keating, and N. A. Christakis (2011). Mapping physician networks with self-reported and administrative data. Health Services Research 46(5), 1592–1609.
- Berta et al. (2010) Berta, P., G. Callea, G. Martini, and G. Vittadini (2010). The effetcs of upcoding, cream skimming and readmissions on the Italian hospitals efficiency modelling: a populaiton-based investigation. Economic Modelling 27(4), 789–890.
- Berta et al. (2016) Berta, P., G. Martini, F. Moscone, and G. Vittadini (2016). The association between asymmetric information, hospital competition and quality of healthcare: evidence from Italy. Journal of the Royal Statistical Society: Series A (Statistics in Society) 179(4), 907–926.
- Berta et al. (2013) Berta, P., C. Seghieri, and G. Vittadini (2013). Comparing health outcomes among hospitals: the experience of the Lombardy Region. Health care management science 16(3), 245–257.
- Beveridge et al. (1942) Beveridge, W. H. et al. (1942). Social insurance and allied services. HM Stationery Office, London.
- Blondel et al. (2008) Blondel, V. D., J.-L. Guillaume, R. Lambiotte, and E. Lefebvre (2008). Fast unfolding of communities in large networks. Journal of Statistical Mechanics: Theory and Experiment 2008(10), P10008.
- Brenna (2011) Brenna, E. (2011). Quasi-market and cost-containment in Beveridge systems: the Lombardy model of Italy. Health Policy 103(2), 209–218.
- Caimo et al. (2017) Caimo, A., F. Pallotti, and A. Lomi (2017). Bayesian exponential random graph modelling of interhospital patient referral networks. Statistics in Medicine 36(18), 2902–2920.
- Cantarero (2006) Cantarero, D. (2006). Health care and patients’ migration across Spanish regions. The European Journal of Health Economics 7(2), 114–116.
- Choné (2017) Choné, P. (2017). Competition policy for health care provision in France. Health Policy 121(2), 111–118.
- Colla et al. (2016) Colla, C., J. Bynum, A. Austin, and J. Skinner (2016). Hospital competition, quality, and expenditures in the US Medicare population. Technical report, National Bureau of Economic Research.
- Congdon (2001) Congdon, P. (2001). The development of gravity models for hospital patient flows under system change: A bayesian modelling approach. Health Care Management Science 4(4), 289–304.
- Csárdi and Nepusz (2006) Csárdi, G. and T. Nepusz (2006). The igraph software package for complex network research. InterJournal Complex Systems 1695, 1–9.
- Fabbri and Robone (2010) Fabbri, D. and S. Robone (2010). The geography of hospital admission in a national health service with patient choice. Health Economics 19(9), 1029–1047.
- Fernández-Gracia et al. (2017) Fernández-Gracia, J., J. Onnela, M. Barnett, V. Eguíluz, and N. Christakis (2017). Influence of a patient transfer network of US inpatient facilities on the incidence of nosocomial infections. Scientific Reports 7, 2930.
- Gaynor (2006) Gaynor, M. (2006). What do we know about competition and quality in health care markets? Working Paper 12301, National Bureau of Economic Research.
- Gaynor et al. (2017) Gaynor, M., F. Mostashari, and P. B. Ginsburg (2017). Making health care markets work: competition policy for health care. Jama 317(13), 1313–1314.
- Gittell and Weiss (2004) Gittell, J. H. and L. Weiss (2004). Coordination networks within and across organizations: A multi-level framework. Journal of Management Studies 41(1), 127–153.
- Hoff et al. (2017) Hoff, P., B. Fosdick, A. Volfovsky, and Y. He (2017). AMEN: Additive and Multiplicative Effects Models for Networks and Relational Data. R package version 1.3.
- Hoff (2005) Hoff, P. D. (2005). Bilinear mixed-effects models for dyadic data. Journal of the American Statistical Association 100(469), 286–295.
- Iwashyna et al. (2009) Iwashyna, T., J. Christie, J. Moody, J. Kahn, and D. Asch (2009). The structure of critical care transfer networks. Medical care 47(7), 787–793.
- Kolaczyk and Csárdi (2014) Kolaczyk, E. and G. Csárdi (2014). Statistical Analysis of Network Data with R. Springer.
- Landon et al. (2012) Landon, B. E., N. L. Keating, M. L. Barnett, J.-P. Onnela, S. Paul, A. J. O’Malley, T. Keegan, and N. A. Christakis (2012). Variation in patient-sharing networks of physicians across the United States. Jama 308(3), 265–273.
- Levaggi and Zanola (2004) Levaggi, R. and R. Zanola (2004). Patients’ migration across regions: the case of Italy. Applied Economics 36(16), 1751–1757.
- Lomi et al. (2014) Lomi, A., D. Mascia, D. Q. Vu, F. Pallotti, G. Conaldi, and T. J. Iwashyna (2014). Quality of care and interhospital collaboration: a study of patient transfers in Italy. Medical Care 52(5), 407.
- Lomi and Pallotti (2012) Lomi, A. and F. Pallotti (2012). Relational collaboration among spatial multipoint competitors. Social Networks 34(1), 101–111.
- Mascia et al. (2015) Mascia, D., F. Angeli, and F. Di Vincenzo (2015). Effect of hospital referral networks on patient readmissions. Social Science & Medicine 132, 113–121.
- Mascia et al. (2012) Mascia, D., F. Di Vincenzo, and A. Cicchetti (2012). Dynamic analysis of interhospital collaboration and competition: empirical evidence from an Italian regional health system. Health Policy 105(2), 273–281.
- Mascia et al. (2017) Mascia, D., F. Pallotti, and F. Angeli (2017). Don’t stand so close to me: competitive pressures, proximity and inter-organizational collaboration. Regional Studies 51(9), 1348–1361.
- Mukamel et al. (2002) Mukamel, D. B., J. Zwanziger, and A. Bamezai (2002). Hospital competition, resource allocation and quality of care. BMC Health Services Research 2(1), 10.
- Peluso et al. (2016) Peluso, A., P. Berta, and V. Vinciotti (2016). Do pay-for-performance incentives lead to a better health outcome? Empirical Economics 56, 2167–2184.
- Pollack et al. (2012) Pollack, C. E., G. Weissman, J. Bekelman, K. Liao, and K. Armstrong (2012). Physician social networks and variation in prostate cancer treatment in three cities. Health Services Research 47(1pt2), 380–403.
- Propper et al. (2004) Propper, C., S. Burgess, and K. Green (2004). Does competition between hospitals improve the quality of care?: Hospital death rates and the NHS internal market. Journal of Public Economics 88(7), 1247–1272.
- Shinjo and Aramaki (2012) Shinjo, D. and T. Aramaki (2012). Geographic distribution of healthcare resources, healthcare service provision, and patient flow in Japan: a cross sectional study. Social Science & Medicine 75(11), 1954–1963.
- Silva and Tenreyro (2006) Silva, J. S. and S. Tenreyro (2006). The log of gravity. The Review of Economics and Statistics 88(4), 641–658.
- Warner et al. (1979) Warner, R. M., D. A. Kenny, and M. Stoto (1979). A new round robin analysis of variance for social interaction data. Journal of Personality and Social Psychology 37(10), 1742.
- Westra et al. (2017) Westra, D., F. Angeli, M. Carree, and D. Ruwaard (2017). Understanding competition between healthcare providers: Introducing an intermediary inter-organizational perspective. Health Policy 121(2), 149–157.
- Westra et al. (2016) Westra, D., F. Angeli, E. Jatautaitė, M. Carree, and D. Ruwaard (2016). Understanding specialist sharing: A mixed-method exploration in an increasingly price-competitive hospital market. Social Science and Medicine 162, 133–142.
- Yang et al. (2016) Yang, Z., R. Algesheimer, and C. J. Tessone (2016). A comparative analysis of community detection algorithms on artificial networks. Scientific Reports 6, 30750.