Multiple minimum energy paths and scenarios of unwinding transitions in chiral nematic liquid crystals
Abstract
We apply the minimum energy paths (MEPs) approach to study the helix unwinding transition in chiral nematic liquid crystals. A mechanism of the transition is determined by a MEP passing through a first order saddle point on the free energy surface. The energy difference between the saddle point and the initial state gives the energy barrier of the transition. Two starting approximations for the paths are used to find the MEPs representing different transition scenarios: (a) the director slippage approximation with in-plane helical structures; and (b) the anchoring breaking approximation that involves the structures with profound out-of-plane director deviations. It is shown that, at sufficiently low voltages, the unwinding transition is solely governed by the director slippage mechanism with the planar saddle point structures. When the applied voltage exceeds its critical value below the threshold of the Fréedericksz transition, the additional scenario through the anchoring breaking transitions is found to come into play. For these transitions, the saddle point structure is characterized by out-of-plane deformations localized near the bounding surface. The energy barriers for different paths of transitions are computed as a function of the voltage and the anchoring energy strengths.
I Introduction
Helical superstructures naturally arise in certain liquids with long-range orientational order characterizing the liquid crystalline (mesomorphic) state that occurs in a temperature range between the liquid and the solid (crystalline) phases. In these orientationally ordered liquids known as the liquid crystals (LCs) the molecules tend to align along a preferred direction typically described in terms of the LC director which is a unit vector representing the locally averaged direction of the LC molecules at a point in the liquid crystalline material de Gennes and Prost (1993); Oswald and Pieranski (2005). It is the presence of the LC orientational order that leads to an optical and electromagnetic anisotropy which has been extensively exploited in the nowadays widespread liquid crystal technology Yang and Wu (2006); Obayya et al. (2016).
Helical twisting patterns where the director rotates in a helical fashion about a uniform twist (helical) axis spontaneously form in unbounded chiral liquid crystals and are caused by the presence of anisotropic molecules with no mirror plane — the so-called chiral molecules. These patterns thus represent self-organized soft helical superstructures.
The supramolecular helical architectures are at the heart of a unique combination of photonic properties of chiral nematic liquid crystals, otherwise referred to as the cholesteric liquid crystals (CLCs).
LCs are known to be responsive materials that are highly sensitive to external stimuli such as electromagnetic fields and boundary (anchoring) conditions. This responsiveness underpins tunability of the helical structures underlying most of the fascinating device applications of CLCs and controllable manipulation of the CLC helical superstructures presents a challenging problem which is of vital importance for both fundamental and technological reasons Bisoyi et al. (2018); Zola and Li (2018); Ryabchun and Bobrovsky (2018); Balamurugan and Liu (2016).
An ideal CLC helix is specified by orientation of the twisting axis, , and the helix pitch, that also govern its optical properties. In planar confining geometry of typical CLC cells, where CLC is sandwiched between two parallel bounding surfaces (substrates), the planar Grandjean structure (texture) which is the uniform standing helix state with the helical axis normal to the substrates
| (1) |
where is the helix wave number which is positive (negative) for the right (left)-handed helix, exemplifies the special case of anisotropic one dimensional (1D) photonic crystals. It is characterized by a chirally sensitive photonic bandgap. Circularly polarized light with helicity identical to the handedness of the helix cannot propagate, and selective reflection takes place.
The well-established continuum theory describing the phenomenology of CLCs is formulated in terms of the Frank-Oseen free energy functional and the elastic free energy density Frank (1958); Oseen (1933)
| (2) |
where , , and are the splay, twist, bend and saddle-splay Frank elastic constants. As a manifestation of the chirality caused by the broken mirror symmetry the expression for the bulk free energy (I) contains a chiral term proportional to the equilibrium value of the CLC twist wave number, .
The parameter known as the free twist wave number or the free twisting number, gives the pitch of equilibrium helical structures in unbounded CLCs. The pitch depends on the molecular chirality of CLC constituent mesogens and ranges from hundreds of nanometers to many microns or more, depending on the system.
An efficient method widely used to prepare CLCs is doping nematic LC mixtures with chiral additives that induce a helical structure Oswald and Pieranski (2005); Balamurugan and Liu (2016). For photosensitive chiral dopants (photoswitches), their helical twisting power and thus the CLC equilibrium helix pitch can be controlled by light through photoinduced changes in chiral molecular switch conformation that influence the LC’s helical twisting power Vinogradov et al. (1990); Delden et al. (2004); Eelkema (2011); Katsonis et al. (2012); Orlova et al. (2014); Zheng et al. (2016); Bisoyi and Li (2016); Huang et al. (2018). Phototunability of the helix pitch leads to a variety of technologically promising effects such as the phototunable selective reflection, i.e. a light-induced change in the spectral position of the bandgap Kurihara et al. (1998); White et al. (2010); Kosa et al. (2012); Vernon et al. (2013).
An important point is that, director configurations in the planar CLC cells are strongly affected by the anchoring conditions at the substrates. These conditions break the translational symmetry along the twisting axis and, in general, the helical form of the director field will be distorted. Nevertheless, when the anchoring conditions are planar and out-of-plane deviations of the director are suppressed, it might be expected that the configurations still have the form of the ideal helical structure (1). But, by contrast with the case of unbounded CLCs, the helix twist wave number will now differ from .
A mismatch between the twist imposed by the boundary conditions and the equilibrium pitch may produce two metastable twist states that are degenerate in energy and can be switched either way by applying an electric field Berreman and Heffner (1981). More generally metastable twist states in CLC cells appear as a result of competing influences of the bulk and the surface contributions to the free energy leading to frustration Kamien and Selinger (2000); Oswald and Pieranski (2005) and giving rise to multiple local minima of the energy Mottram and Hogan (1997). Properties of the metastable helical structures are determined by the free twisting number and the anchoring energy. Variations in will affect the twisting wave number, , and may result in sharp transitions — the so-called pitch transitions – between different branches of metastable states.
In particular, these transitions manifest themselves in a jump-like temperature dependence of selective light transmission spectra Zink and Belyakov (1997); Gandhi et al. (1998); Zink and Belyakov (1999); Yoon et al. (2006). Different mechanisms behind the temperature variations of the pitch in CLC cells and hysteresis phenomena were discussed in Refs. Belyakov and Kats (2000); Belyakov et al. (2003); Palto (2002). A comprehensive stability analysis of the planar helical structures in CLC cells with symmetric and asymmetric boundary conditions was performed in Ref. Kiselev and Sluckin (2005). The effects of bistable surface anchoring and mechanical strain on the pitch transitions have been studied theoretically in the recent papers McKay (2012) and Lelidis et al. (2013); Barbero et al. (2018), respectively.
Another standard and widely exploited technique to manipulate the helical structures uses their sensitivity to external (magnetic or electric) fields applied to CLC cells. An external field will generally distort the free energy landscape. These distortions lead to a variety of field-induced orientational effects such as the Fréedericksz and unwinding transitions that have been attracted considerable attention in the context of electro-optics of LC display devices.
In the technologically important geometry where the electric field is applied across the CLC cell, these effects crucially depend on a number of factors such as the cell thickness , the pitch , the applied voltage , the anchoring conditions, elastic and dielectric properties of the CLC material Meyer (1968); Berreman and Heffner (1981); Becker et al. (1985); Schiller (1990); Hirning et al. (1991); Smalyukh et al. (2005); Choi et al. (2009); Val’kov et al. (2013). In this geometry, the CLC cell with planar (homogeneous) anchoring conditions is subjected to the field applied along the twisting axis of the planar helical structure (1). This is the case of our primary concern.
A systematic theoretical analysis of electrically induced instabilities of the CLC helix underlying the Fréedericksz transition performed in Ref. Val’kov et al. (2013) have shown that the transition can be either continuous (second order) or discontinuous (first order) depending on the elastic constants, the pitch, the anchoring energy strengths and the cell gap. It is also known that destabilization of the helical structure may alternatively occur through the Helfrich-Hurault mechanism Helfrich (1970, 1971); Hurault (1973); Nemati et al. (2012) giving rise to undulated patterns with in-plane electrically dependent periodicity. These patterns also known as striped textures or Helfrich distortions have aroused considerable interest as switchable CLC diffraction gratings Subacius et al. (1997a, b); Senyuk et al. (2005); Gvozdovskyy (2018); Shtykov et al. (2018); Zola et al. (2019).
The purpose of this paper is to explore global properties of the free energy landscape related to transitions between CLC states which are local minima (minimizers) of the free energy. The free energy pathways connecting pairs of metastable helical states appear as basic elements of a natural mathematical language dealing with the relevant geometry of the landscape viewed as a multidimensional free energy surface Kusumaatmaja and Majumdar (2015); Bessarab et al. (2015); Ivanov et al. (2016).
The key elements associated with the transitions are the minimum energy paths (MEPs) between the initial and final states on the free energy surface. Every point on such a pathway is a free energy minimum in all but a certain direction in the configuration space of CLC director structures. Maximum along the MEP determines the transition state which is a saddle point on the free energy surface. The MEP itself represents a path with the maximal statistical weight and defines a scenario of the most probable transition between the states. The energy barrier separating the states can be found as the difference between the saddle point energy and the energy of the initial state. When the transition goes through several metastable states, MEP gives a sequence of the barriers to be passed in the course of the transition.
Information about such energy barriers is required to asses the effect of thermally activated transitions within the framework of the rate theory Hänggi et al. (1990); Coffey et al. (2007). Similarly, in Refs. Goldbart and Ao (1990, 1991), the barrier heights and the Arrhenius formula were employed to estimate the rate of transitions between metastable twist states and the effective intrinsic torsional viscosity of LC cells with strong anchoring conditions.
In this paper we restrict our analysis to the case where stability of the CLC helix is determined by the threshold voltages of the Fréedericksz transition and apply the geodesic nudged elastic band (GNEB) method Bessarab et al. (2015) to calculate MEPs of the helix unwinding transition between a metastable CLC twist state and the untwisted ground state. From the computed MEPs we identify two different scenarios for unwinding of the CLC helix to occur. These are: (a) the transitions dominated by in-plane director slippage; and (b) the transitions involving localized anchoring breaking. We shall study how these transitions and their free energy barriers depend on the electric field and the anchoring conditions.
The layout of the paper is as follows. General relations that determine the characteristics of the helical structures in CLC cells are given in Sec. II. Then in Sec. III we outline the numerical procedure that we employ to compute MEPs and describe the results obtained using the director slippage and anchoring breaking approximations as starting approximations for the MEPs. Finally, in Sec. IV we discuss our results and make some concluding remarks.
II Free energy
We consider a CLC cell of thickness sandwiched between two parallel plates that are normal to the -axis: (lower substrate) and (upper substrate). Anchoring conditions at both substrates are planar (homogeneous) with the preferred orientation of CLC molecules at the lower and upper plates defined by the two vectors of easy orientation: and , where a hat will indicate unit vectors. These vectors are given by
| (3) |
Then , is the twist angle imposed by the boundary conditions.
We shall also write the CLC free energy functional as a sum of the bulk and surface contributions:
| (4) |
where is the electric field, and assume that both the polar and the azimuthal contributions to the anchoring energy can be taken in the form of Rapini-Papoular potential Rapini and Papoular (1969):
| (5) |
where () and () are the azimuthal and the polar anchoring strengths at the upper (lower) substrate.
Then we express the CLC director in terms of the polar and the azimuthal angles, and , as follows
| (6) |
where the angles are functions of , and , provided invariance with respect to in-plane translations is unbroken. After substituting the director parametrization (6) into Eq. (5), we have the surface potential in the following form:
| (7) |
where is the area of the substrates; and .
The bulk part of the free energy functional (4)
| (8) |
is a sum of the Frank-Oseen elastic energy given by Eq. (I) and the electrostatic energy of interaction between the electric field and CLC molecules, . For the CLC director (6), the elastic energy (I) takes the following form:
| (9) | ||||
| (10) |
where prime stands for derivative with respect to .
In our case, the electric field is normal to the substrates with , where is the electrostatic potential. It meets the Maxwell equation: for the electric displacement linearly related to through the uniaxially anisotropic dielectric tensor with the components
| (11) |
where is the Kronecker symbol and ; and are the dielectric constants giving the principal values of . So, the normal component of , is independent of and we obtain the relation linking the voltage applied across the CLC and
| (12) |
where . When the applied voltage is fixed, the electrostatic part of the energy
| (13) |
assumes the form of nonlocal functional:
| (14) |
In our subsequent calculations, we shall use the Frank elastic constants typical for 5CB Bogi and Faetti (2001): pN, pN, pN and consider the case of the weakly twisted symmetric CLC cell of the thickness m with , mJ/m2 and . These parameters are used to obtain the estimates we briefly discuss below.
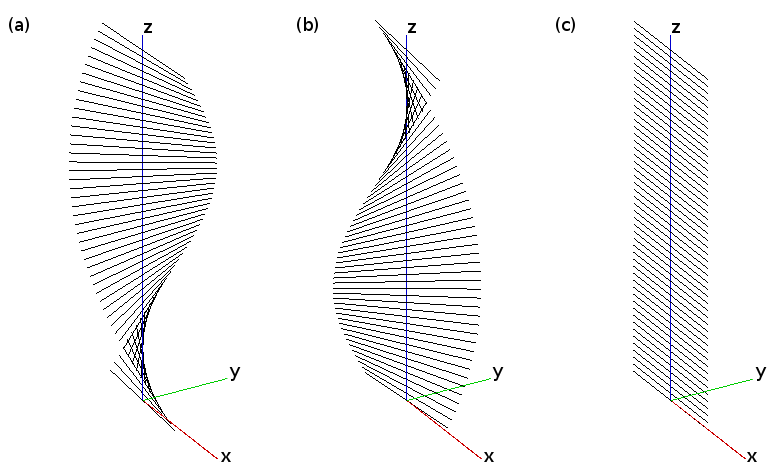
In the absence of electric field, the field free planar CLC helical structures (1) can be analyzed using the results of Ref. Kiselev and Sluckin (2005). According to this analysis, the transitions of our primary concern involve three (meta)stable structures shown in Fig. 1: (a) the left-handed twisted structure with ; and (b) the right-handed twisted structure with and (c) nearly untwisted (nematic) structure with ; Since the free twist parameter is small, the twisted structures are nearly degenerate in energy. The nematic structure is the stable state with the lowest energy (the energy difference per unit area can be estimated at about J/m2).
The threshold voltage of the Fréedericksz transition can be estimated using the analytical relations derived in Ref. Val’kov et al. (2013): V. These relations also predict that, in our case, the transition leading to instability of the ground state will be continuous.
III Results
In this section, we will focus on the unwinding transition from the metastable left-handed helix state to the stable nematic (equilibrium) state (see Fig. 1). Such a situation may occur in the light-induced pitch transitions in CLCs doped with photosensitive chiral dopants Orlova et al. (2014) when under the action of irradiation the free twisting number changes from the initial value close to to the value close to zero.
The states differ in the parity of half-turns Kiselev and Sluckin (2005) and are thus topologically distinct. The latter implies that, in the strong anchoring limit, the helical state cannot be smoothly deformed into the untwisted state without destroying the local degree of molecular ordering. By contrast, in the weak anchoring regime where the anchoring strength is not infinitely large, these states are local minima of the multidimensional free energy surface separated by the finite energy barriers. We shall apply the minimum energy path approach to study how these barriers are affected by the applied electric voltage and the anchoring strength ratio , where . After brief discussion of our method, we present the results for two classes of the pathways representing the two different scenarios of the unwinding transition: the director slippage transitions where the out-of-plane deviations of the director are suppressed () and the anchoring breaking transitions that involve the states characterized by profound variations in the polar angle .
III.1 Minimum energy paths
In our calculations, the cell is divided into equidistant layers and the director orientation is assumed be constant inside each layer. Since the director in each layer has two degrees of freedom (the azimuthal and the polar angles), the dimension of the free energy surface equals twice the number of the layers. This surface can be regarded as a -dimensional Riemannian manifold defined as a direct product of two-dimensional spheres.
As in Ref. Ivanov et al. (2016), we have used the geodesic nudged elastic band (GNEB) method to find MEPs between local minima on the curved manifolds Bessarab et al. (2015). This approach involves taking an initial guess of a path between the two minima and systematically bringing that to the nearest MEP. A path is represented by a discrete chain of states, or “images”, of the system, where the first and the last image are placed at the local energy minima corresponding to the initial and final metastable configurations. In order to distribute the images evenly along the path, springs are introduced between adjacent images. At each image, a local tangent to the path needs to be estimated, and the force guiding the images towards the nearest MEP is defined as the sum of the transverse component of the energy antigradient plus the component of the spring force along the tangent to the path. The position of intermediate images is then adjusted so as to zero the GNEB forces.
An important point is that the MEP connecting the metastable structures generally depends on the starting approximation for the path. Variations in the initial approximations may produce different MEPs. Such paths represent distinct scenarios of the transition. Therefore, we have used different initial paths in order to study the two scenarios of the unwinding transition.
To find the director distributions for the initial and final states we have started from the initial approximation for the director structure and then minimized the energy using the velocity projection algorithm Jónsson et al. (1998). The position of the maximum (saddle point) along the MEP was found using Climbing Image algorithm Bessarab et al. (2015).
III.2 Director slippage transitions
According to Ref. Kiselev and Sluckin (2005), under certain conditions the pitch transitions being solely governed by in-plane director fluctuations do not involve tilted configurations and the transition mechanism can be described as director slippage through the energy barriers formed by the surface potentials. In what follows, such transitions will be referred to as the director slippage transitions.

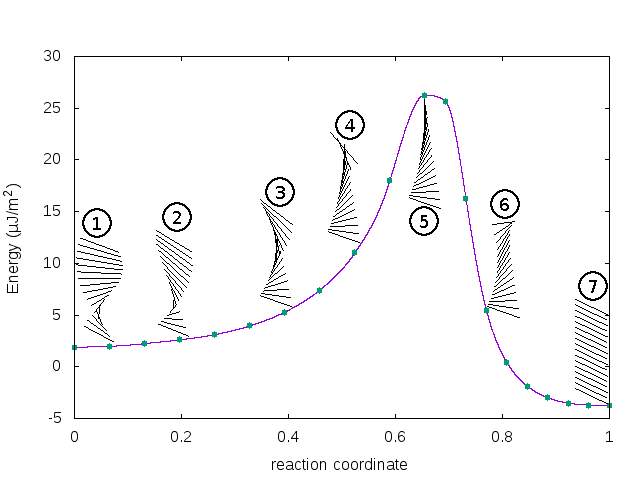
In our calculations, the left-handed helix (see Fig. 1a) and the nematic equilibrium structure (see Fig. 1c) are used as the initial and final states, respectively. The starting approximation for the path involves the in-plane helical structures with assuming that the azimuthal angle, , at the top substrate uniformly varies along the path approaching the untwisted state value equal to the twist angle at the bottom substrate . In what follows such an initial approximation of the MEPs will be called the director slippage approximation.
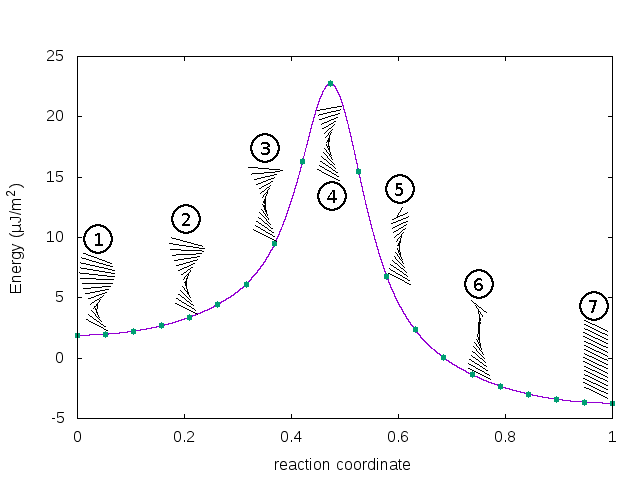
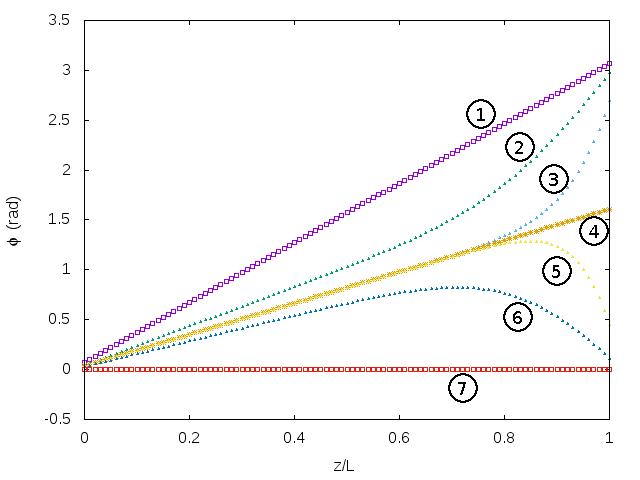
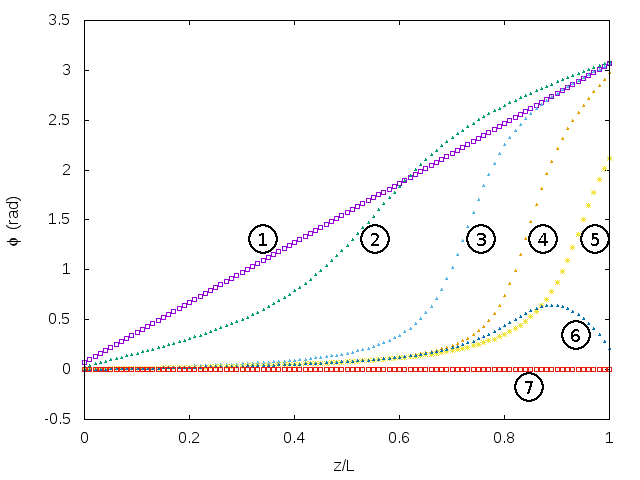
In Fig. 2, we present the energies of director configurations along the MEP computed at V and . In addition, figure 2 shows the director structures for a set of the selected images (the total number of the computed images is 18) along the path. The first image is the metastable helical structure, whereas the last image is the stable nematic state. The fourth numbered image is the transition (saddle-point) state giving the energy that determines the energy barrier (activation energy) of the transition. The profiles of the azimuthal angle for CLC structures shown in Fig. 2 are plotted in Fig. 3. Clearly, similar to the initial and final states, the profile for the transition state appears to be linear with the director at the top substrate oriented along the normal to the easy axis. By contrast, it turns out that the profiles of other states along the MEP demonstrate nonlinear behavior of the azimuthal angle evaluated as a function of . Such profiles significantly differ from the Grandjean texture (1).
The director slippage scenario implies that, below the threshold voltage, tilted structures have no effect on unwinding of the helix and the corresponding MEPs. For the planar structures with , the orientation dependent part of the energy (4) is independent of both the polar anchoring strength and the applied voltage . In particular, for the ideal helical structures (1), this energy is
| (15) |
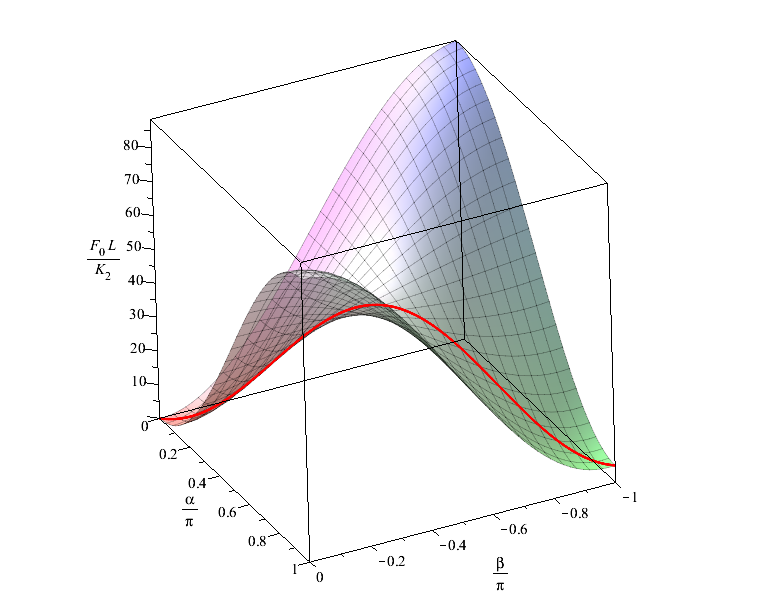
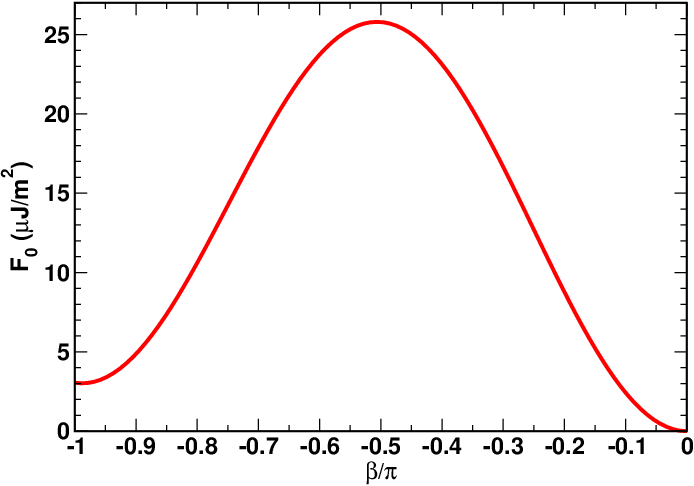
where and , gives the two-dimensional (2D) free energy surface. Part of this surface with the two minima representing the twisted () and unwound () structures under consideration is depicted in Fig. 4a.
The energy along the path connecting the minima and passing through the saddle point (this path is shown as the red line in Fig. 4a) is plotted versus the twisting parameter in Fig. 4b. It can be readily found that the saddle-point state is the structure with and the energy barrier can be estimated at about J/m2. This estimate is close to .
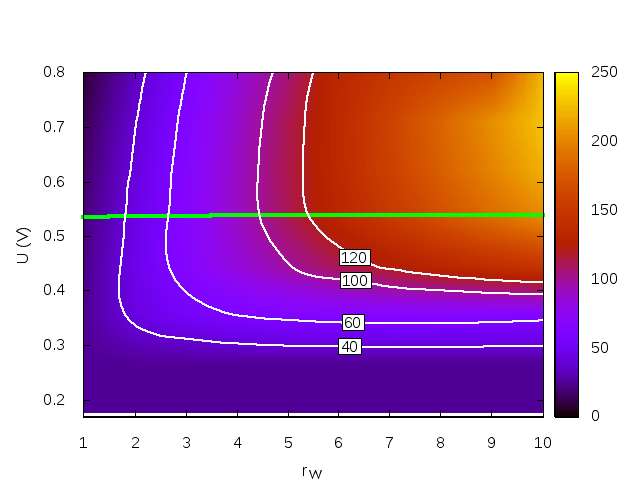
When using the minimum energy paths method, a MEP evaluated at certain values of the anchoring ratio and the applied voltage gives the energy barrier computed as the difference between the energies of the transition (saddle point) state and of the initial twisted state. The energy barrier map in the plane computed for the director slippage transitions is presented in Fig. 5. In agreement with the above discussion, below the critical voltage , the director structure of the transition state is uniformly twisted and the energy barrier is independent of both the anchoring ratio and the voltage (for illustrative purposes, the low voltage part of the map shown in Fig. 5 is truncated). In this low-voltage regime, the above analysis of the ideal helical structures and the MEP method give the identical results for the value of the energy barrier.
As is seen from Fig. 5, above the threshold voltage of the Fréedericksz transition, the energy barrier increases with the anchoring ratio and, in general, is a nonmonotonic function of the applied voltage . In this region, the planar states are unstable and all the structures involved in the transitions are deformed by the applied field. These are the tilted structures characterized by profound out-of-plane director deviations. The MEPs above the critical voltage will be discussed later on in Sec. III.4.
III.3 Anchoring breaking transitions
In order to study an alternative scenario of the unwinding transition, we have used another starting approximation for the MEPs that involves the CLC structures where the uniform twist from to is superimposed by the out-of-plane director deformation with the polar angle varying from to . In this approximation, similar to the case of the director slippage transitions, the twist angle along the path monotonically unwinds changing from to zero. By contrast, for the polar angle at the top substrate, the initial decrease from to the value close to zero that occurs in the first half of the path, is followed by the increase in that restores its initial value at the final state in the second half of the path. So, the initial guess for the MEP assumes that, for the transition state, the CLC director at the top substrate is nearly normal to the bounding surface. Such a starting guess will be referred to as the anchoring breaking approximation.
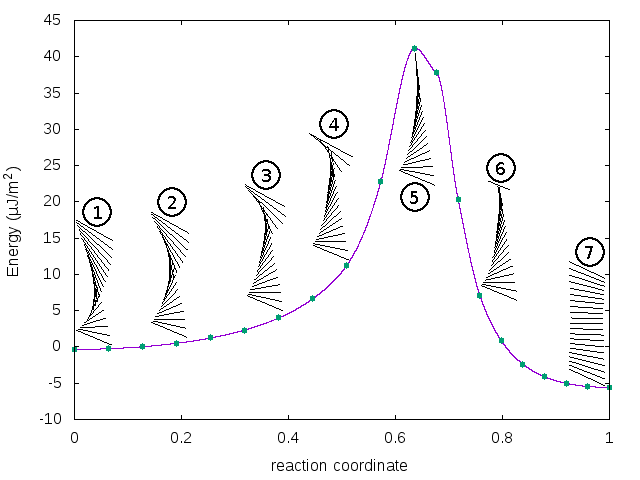
Figure 6 presents the results for the energies of the CLC structures along the MEP computed at V and using the initial anchoring breaking approximation. Similar to Fig. 2, the first image is the metastable left-handed helical structure and the last image represents the stable untwisted state. The energy barrier is determined by the energy of the transition state corresponding to the fifth numbered image.
As is illustrated in Fig. 6, in the first half of the path, the region of pronounced out-of-plane deviation approaches the top boundary surface reaching the transition (saddle-point) structure with the director orientation close to the normal to the substrate (). Such structure implies that the twisted structure unwinds via anchoring breaking that occurs at the upper substrate and such unwinding transition will be referred to as the anchoring breaking transition.
Note that, in contrast to the director slippage transition (see Fig. 2), there is a flatten region in the close vicinity of the maximum of the energy curve shown in Fig. 6. The reason is that, at , variations in the azimuthal angle have negligible effect on the energy. From the other hand, these variations produce noticeable changes in the reaction coordinate which is the normalized sum of the angles, and , along the path.
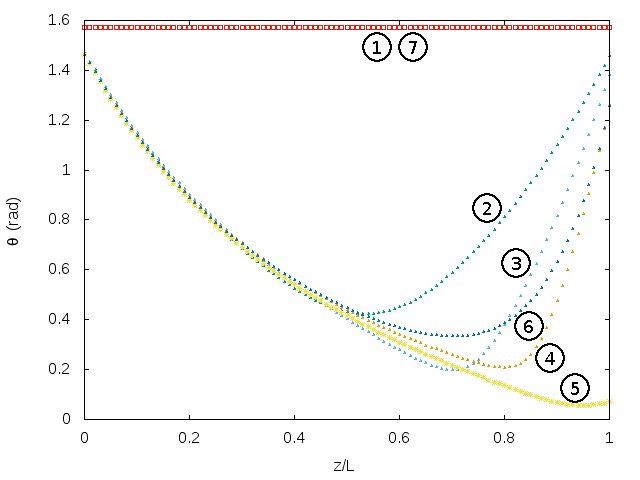
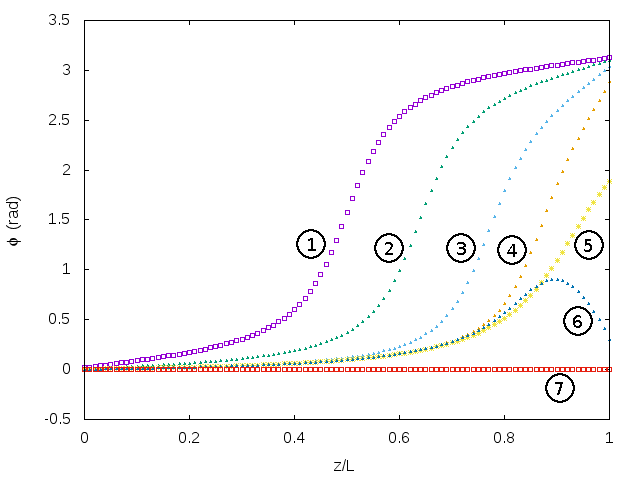
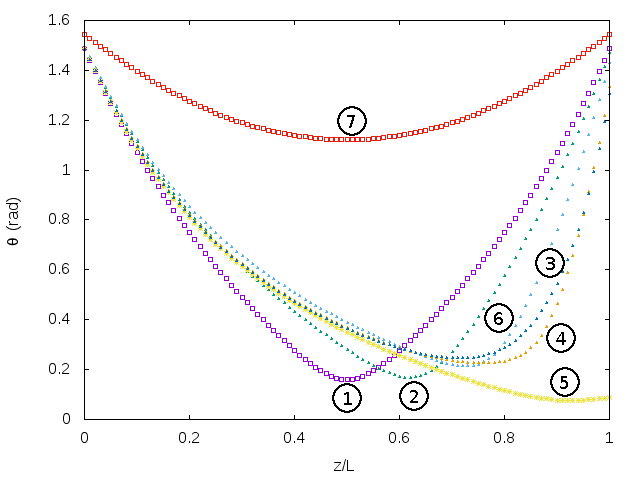
The profiles of the azimuthal and the polar angles computed for the images of the anchoring breaking transition shown in Fig. 6 are presented in Figs. 7a and 7b, respectively. It can be seen that, except for the initial and final states, all the profiles are nonlinear. The fifth curve for the polar angle of the transition state clearly shows homeotropic orientation of the director at the upper substrate with .
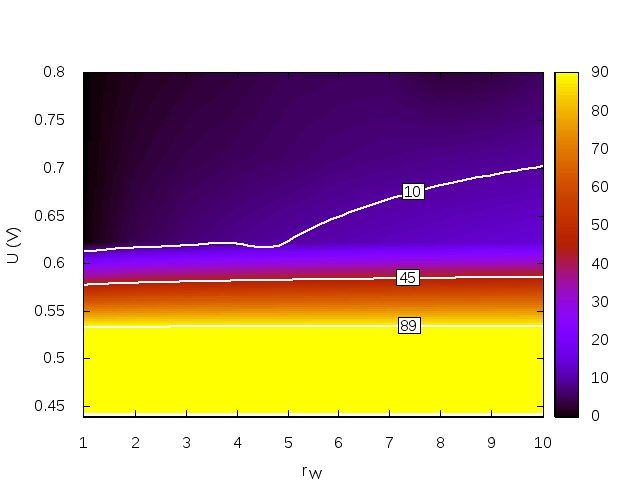
In Fig. 8, we show the results for the energy barrier computed as a function of the anchoring ratio and the voltage . From the energy barrier map presented in Fig. 8, it can be inferred that the energy barrier is independent of and until the voltage exceeds its critical value V. So, at , the anchoring breaking approximation produces the results identical to the director slippage transitions. For the voltages above , the tilted CLC structures come into play and the anchoring strength will affect the values of the energy barrier.
III.4 Comparison between two scenarios
Below the threshold voltage , dependence of the energy barrier on originates from the tilted saddle-point structure representing the transition state. The corresponding out-of-plane deviations of the director can be quantitatively described by the minimum polar angle
| (16) |
evaluated for the transition state of a MEP. The smaller the value of is the more tilted the saddle point state is.
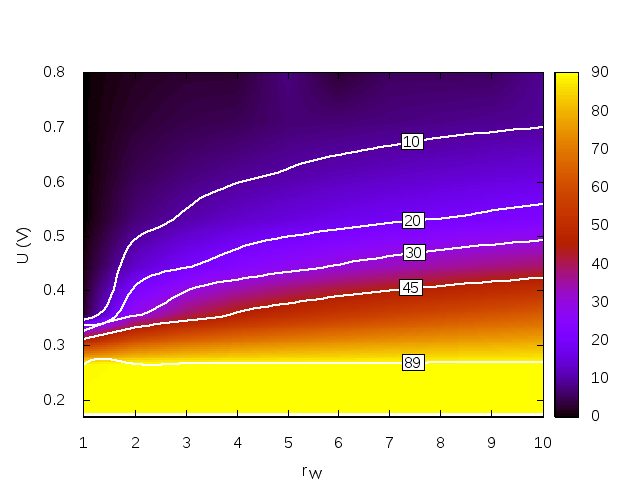
The maps of the angle in the plane calculated using the director slippage and the anchoring breaking initial approximations are shown in Figs. 9a and 9b, respectively. Referring to Fig. 9, it can be seen that, for the anchoring breaking transitions, a noticeable decrease in takes place when the voltage exceeds , whereas, for the director slippage transitions, this happens in the close vicinity of the threshold voltage . So, we arrive at the conclusion that the two mechanisms become essentially distinct at voltages higher than .
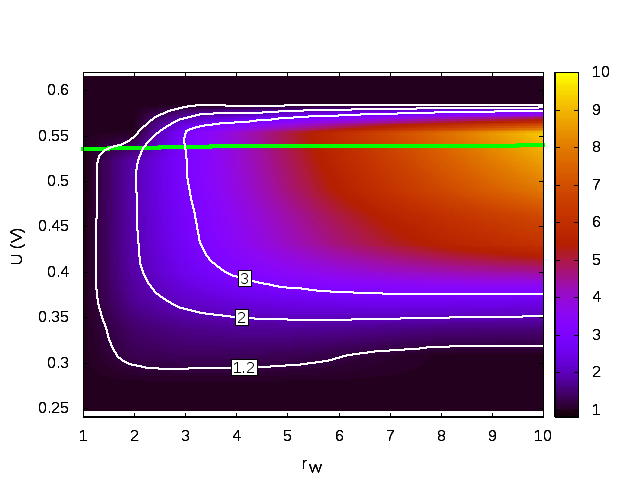
In order to further emphasize the difference between the two scenarios, figure 10 presents the distribution of the ratio of the energy barriers in the plane. It can be seen that, at , this ratio is an increasing function of and, when the difference between the azimuthal and polar anchoring strengths is small with , the barriers are nearly equal.
It is turned out that, even after the Fréedericksz transition takes place, the barriers of the MEPs may significantly differ. The maximum value of the barrier ratio is reached at large values of anchoring strength ratio in the voltage interval lying just above the threshold voltage. This is the interval where, according to Figs. 5 and 9, the effect of the saddle point tilt for the director slippage scenario is much less pronounced as compared to the MEPs evaluated using the anchoring breaking initial approximation.
When the voltage further increases, the transition state director structures will be dominated by the field induced deformations. As is clearly demonstrated in Fig. 10, the result is that the two scenarios eventually merge into the one and become indistinguishable at sufficiently voltages above the Fréedericksz threshold.
We have used the initial anchoring breaking approximation to compute the MEP in this high-voltage region ( V) at the anchoring strength ratio . The results for the energies along the MEP and for the profiles of the azimuthal and polar angles are shown in Figs. 11 and 12, respectively. Interestingly, the transition state (the fifth numbered image and its profiles) of this MEP bears close resemblance to the one for the anchoring breaking transition (see Figs. 6 and 7). By contrast to the latter, the initial twisted and the final untwisted states (the first and the seventh images, respectively) of this transition reveal significant out-of-plane deformations induced by the electric field.
IV Conclusion
In this paper, we have studied the minimum energy paths for the unwinding transition in the chiral nematic liquid crystal cell. Such pathways connect the metastable CLC states which are local minima of the multidimensional free energy surface, and the energy of the saddle-point (transition state) of the paths gives the energy barrier separating the metastable states. Therefore, the MEP and its saddle points characterize the mechanism (scenario) of the transition.
We have employed the geodesic nudged elastic band (GNEB) method as a computational procedure to evaluate the MEPs. This method requires an initial guess for the path and various starting approximations can generally produce different MEPs. In our approach, this dependence of the MEPs on the starting approximation is exploited to examine two scenarios of the unwinding transition from the metastable left-handed CLC helix to the ground untwisted state. For this purpose, we have used the director slippage (see Sec. III.2) and the anchoring breaking (see Sec. III.3) approximations as the starting paths for the MEPs.
These MEPs and the energy barriers are calculated at various values of the voltage applied across the CLC cell and the anchoring strength ratio . For the director slippage scenario, orientational configuration of the transition state is found to remain planar until the voltage reaches the Fréedericksz threshold . By contrast, in the saddle-point state of the MEPs representing the anchoring breaking scenario of the transition, out-of-plane deformations of the director structure are localized near the bounding surface chosen by the initial approximation. This scenario come into play only when the voltage exceeds its critical value .
At voltages above the Fréedericksz threshold , both the initial metastable twisted state and the final untwisted state are deformed by the applied electric field. In this case, electrically induced deformations also affect the saddle-point state of the MEPs computed using the director slippage approximation. The result is that the difference between the two scenarios becomes negligible at sufficiently high voltages. Note that, in the low-voltage region where , the director structure of the transition state is a planar Grandjean texture (1) and the MEPs, similar to the high-voltage regime, are indistinguishable.
We conclude with the remark that the saddle-point states can also be found without knowledge of the final state using the minimum mode following method recently suggested in Ref. Müller et al. (2018). This promising method being more complicated than the GNEB method allows discovering unexpected final states and the transition mechanisms.
Acknowledgements.
This work was supported by Russian Foundation of Basic Research under the grant 18-02-00267 and by the Foundation for Advancement of Theoretical Physics and Mathematics “BASIS” under the grant 19-1-1-12-1.References
- de Gennes and Prost (1993) P. G. de Gennes and J. Prost, The Physics of Liquid Crystals (Clarendon Press, Oxford, 1993) p. 596.
- Oswald and Pieranski (2005) Patrick Oswald and Pawel Pieranski, Nematic and Cholesteric Liquid Crystals: Concepts and Physical Properies Illustrated by Experiments, The Liquid Crystals Book Series (Taylor & Francis Group, London, 2005) p. 618.
- Yang and Wu (2006) D.-K. Yang and S.-T. Wu, Fundamentals of Liquid Crystal Devices, Series in Display Technology (Wiley, Chichester, 2006) p. 378.
- Obayya et al. (2016) Salah Obayya, Mohamed Farhat O. Hameed, and Nihal F.F. Areed, Computational Liquid Crystal Photonics: Fundamentals, Modelling and Applications (Wiley, Chichester, 2016) p. 264.
- Bisoyi et al. (2018) Hari Krishna Bisoyi, Timothy J. Bunning, and Quan Li, “Stimuli-driven control of the helical axis of self-organized soft helical superstructures,” Advanced Materials 30, 1706512 (2018).
- Zola and Li (2018) Rafael S. Zola and Quan Li, “Stimuli-directed helical axis switching in chiral liquid crystal nanostructures,” in Functional Organic and Hybrid Nanostructured Materials (John Wiley & Sons, Ltd, 2018) Chap. 8, pp. 307–357.
- Ryabchun and Bobrovsky (2018) Alexander Ryabchun and Alexey Bobrovsky, “Cholesteric liquid crystal materials for tunable diffractive optics,” Advanced Optical Materials 6, 1800335 (2018).
- Balamurugan and Liu (2016) Rathinam Balamurugan and Jui-Hsiang Liu, “A review of the fabrication of photonic band gap materials based on cholesteric liquid crystals,” Reactive and Functional Polymers 105, 9–34 (2016).
- Frank (1958) F. C. Frank, “On the theory of liquid crystals,” Discuss. Faraday Soc. 25, 19–28 (1958).
- Oseen (1933) C. W. Oseen, “The theory of liquid crystals,” Trans. Faraday Soc. 29, 883–899 (1933).
- Vinogradov et al. (1990) V. Vinogradov, A. Khizhnyak, L. Kutulya, Y. Reznikov, and V. Reshetnyak, “Photoinduced change of cholesteric LC-pitch,” Mol. Cryst. Liq. Cryst. 192, 273–278 (1990).
- Delden et al. (2004) Richard A. van Delden, Tommaso Mecca, Carlo Rosini, and Ben L. Feringa, “A chiroptical molecular switch with distinct chiral and photochromic entities and its application in optical switching of a cholesteric liquid crystal,” Chemistry – A European Journal 10, 61–70 (2004).
- Eelkema (2011) R. Eelkema, “Photo-responsive doped cholesteric liquid crystals,” Liq. Cryst. 38, 1641–1652 (2011).
- Katsonis et al. (2012) Nathalie Katsonis, Emmanuelle Lacaze, and Alberta Ferrarini, “Controlling chirality with helix inversion in cholesteric liquid crystals,” J. Mater. Chem. 22, 7088–7097 (2012).
- Orlova et al. (2014) Tetiana N. Orlova, Roman I. Iegorov, and Alexei D. Kiselev, “Light-induced pitch transitions in photosensitive cholesteric liquid crystals: Effects of anchoring energy,” Phys. Rev. E 89, 012503 (2014).
- Zheng et al. (2016) Zhi-gang Zheng, Li Yannian, Hari Krishna Bisoyi, Ling Wang, Timothy J. Bunning, and Quan Li, “Three-dimensional control of the helical axis of a chiral nematic liquid crystal by light,” Nature 531, 352–356 (2016).
- Bisoyi and Li (2016) Hari Krishna Bisoyi and Quan Li, “Light-directed dynamic chirality inversion in functional self-organized helical superstructures,” Angewandte Chemie International Edition 55, 2994–3010 (2016).
- Huang et al. (2018) He Huang, Tetiana Orlova, Benjamin Matt, and Nathalie Katsonis, “Long-lived supramolecular helices promoted by fluorinated photoswitches,” Macromolecular Rapid Communications 39, 1700387 (2018).
- Kurihara et al. (1998) S. Kurihara, T. Kanda, T. Nagase, and T. Nonaka, “Photochemical color switching behavior of induced cholesteric liquid crystals for polarizer free liquid crystalline devices,” Appl. Phys. Lett. 73, 2081–2083 (1998).
- White et al. (2010) Timothy J. White, Alexander S. Freer, Nelson V. Tabiryan, and Timothy J. Bunning, “Photoinduced broadening of cholesteric liquid crystal reflectors,” J. Appl. Phys. 107, 073110 (2010).
- Kosa et al. (2012) T. Kosa, L. Sukhomlinova, L. Su, B. Taheri, T. J. White, and T. J. Bunning, “Light-induced liquid crystallinity,” Nature 485, 347–349 (2012).
- Vernon et al. (2013) Jonathan P. Vernon, Aaron D. Zhao, Rafael Vergara, Hyunmin Song, Vincent P. Tondiglia, Timothy J. White, Nelson V. Tabiryan, and Timothy J. Bunning, “Photostimulated control of laser transmission through photoresponsive cholesteric liquid crystals,” Opt. Express 21, 1645–1655 (2013).
- Berreman and Heffner (1981) D. W. Berreman and W. R. Heffner, “New bistable liquid-crystal twist cell,” J. Appl. Phys. 52, 3032–3039 (1981).
- Kamien and Selinger (2000) Randall D. Kamien and Jonathan V. Selinger, “Order and frustration in chiral liquid crystals,” Journal of Physics: Condensed Matter 13, R1–R22 (2000).
- Mottram and Hogan (1997) N. J. Mottram and S. J. Hogan, “Multiple solutions in twisted nematic liquid crystal layers,” Continuum Mech. Thermodyn. 9, 213–228 (1997).
- Zink and Belyakov (1997) H. Zink and V. A. Belyakov, “Temperature hysteresis of the change in the cholesteric pitch and surface anchoring in thin planar layers,” JETP 85, 285–291 (1997).
- Gandhi et al. (1998) J. V. Gandhi, X.-D. Mi, and D.-K. Yang, “Effect of surface alignment layers on the configurational transitions in cholesteric liquid crystals,” Phys. Rev. E 57, 6761–6766 (1998).
- Zink and Belyakov (1999) H. Zink and V. A. Belyakov, “Studies of the temperature pitch variations in planar cholesteric layer and surface anchoring,” Mol. Cryst. Liq. Cryst. 329, 1069–1076 (1999).
- Yoon et al. (2006) H. G. Yoon, N. W. Roberts, and H. F. Gleeson, “An experimental investigation of discrete changes in pitch in a thin, planar chiral nematic device,” Liq. Cryst. 33, 503–510 (2006).
- Belyakov and Kats (2000) V. A. Belyakov and E. I. Kats, “Surface coupling and temperature variations of pitch in thin cholesteric layers,” JETP 91, 488–496 (2000).
- Belyakov et al. (2003) V. A. Belyakov, P. Oswald, and E. I. Kats, “Temperature pitch variations in planar cholesteric layers: The role of fluctuations and surface anchoring,” JETP 96, 915–922 (2003).
- Palto (2002) S. P. Palto, “On mechanisms of spiral pitch variations in thin cholestric layers confined between two surfaces,” JETP 121, 308–319 (2002), (in Russian).
- Kiselev and Sluckin (2005) A. D. Kiselev and T. J. Sluckin, “Twist of cholesteric liquid crystals cells: Stability of helical structures and anchoring energy effects,” Phys. Rev. E 71, 031704 (2005).
- McKay (2012) G. McKay, “Bistable surface anchoring and hysteresis of pitch jumps in a planar cholesteric liquid crystal,” Eur. Phys. J. E 35, 74 (2012).
- Lelidis et al. (2013) I. Lelidis, G. Barbero, and A. L. Alexe-Ionescu, “Cholesteric pitch transitions induced by mechanical strain,” Phys. Rev. E 87, 022503 (2013).
- Barbero et al. (2018) Giovanni Barbero, Weichao Zheng, and Bruno Zappone, “Twist transitions and force generation in cholesteric liquid crystal films,” Journal of Molecular Liquids 267, 242–248 (2018), special Issue Dedicated to the Memory of Professor Y. Reznikov.
- Meyer (1968) Robert B. Meyer, “Effects of electric and magnetic fields on the structure of cholesteric liquid crystals,” Applied Physics Letters 12, 281–282 (1968).
- Becker et al. (1985) M. E. Becker, J. Nehring, and T. J. Scheffer, “Theory of twisted nematic layers with weak boundary coupling,” Journal of Applied Physics 57, 4539–4542 (1985).
- Schiller (1990) P. Schiller, “Equilibrium structures of planar nematic and cholesteric films in electric fields,” Phase Transitions 29, 59–83 (1990).
- Hirning et al. (1991) H. Hirning, W. Funk, H.-R. Trebin, M. Schmidt, and H. Schmiedel, “Threshold behavior and electro-optical properties of twisted nematics layers with weak anchoring in the tilt and twist angle,” J. Appl. Phys. 70, 4211–4216 (1991).
- Smalyukh et al. (2005) I. I. Smalyukh, B. I. Senyuk, P. Palffy-Muhoray, O. D. Lavrentovich, H. Huang, E. C. Gartland, V. H. Bodnar, T. Kosa, and B. Taheri, “Electric-field-induced nematic-cholesteric transition and three-dimensional director structures in homeotropic cells,” Phys. Rev. E 72, 061707 (2005).
- Choi et al. (2009) Su Seok Choi, Stephen M. Morris, Wilhelm T. S. Huck, and Harry J. Coles, “Electrically tuneable liquid crystal photonic bandgaps,” Advanced Materials 21, 3915–3918 (2009).
- Val’kov et al. (2013) A. Yu. Val’kov, E. V. Aksenova, and V. P. Romanov, “First-order and continuous Fréedericksz transitions in cholesteric liquid crystals,” Phys. Rev. E 87, 022508 (2013).
- Helfrich (1970) W. Helfrich, “Deformation of cholesteric liquid crystals with low threshold voltage,” Applied Physics Letters 17, 531–532 (1970).
- Helfrich (1971) W. Helfrich, “Electrohydrodynamic and dielectric instabilities of cholesteric liquid crystals,” The Journal of Chemical Physics 55, 839–842 (1971).
- Hurault (1973) J. P. Hurault, “Static distortions of a cholesteric planar structure induced by magnetic or ac electric fields,” The Journal of Chemical Physics 59, 2068–2075 (1973).
- Nemati et al. (2012) H. Nemati, D.-K. Yang, K.-L. Cheng, C.-C. Liang, J.-W. Shiu, C.-C. Tsai, and R. S. Zola, “Effect of surface alignment layer and polymer network on the Helfrich deformation in cholesteric liquid crystals,” Journal of Applied Physics 112, 124513 (2012).
- Subacius et al. (1997a) D. Subacius, P. J. Bos, and O. D. Lavrentovich, “Switchable diffractive cholesteric gratings,” Applied Physics Letters 71, 1350–1352 (1997a).
- Subacius et al. (1997b) D. Subacius, S. V. Shiyanovskii, Ph. Bos, and O. D. Lavrentovich, “Cholesteric gratings with field-controlled period,” Applied Physics Letters 71, 3323–3325 (1997b).
- Senyuk et al. (2005) B. I. Senyuk, I. I. Smalyukh, and O. D. Lavrentovich, “Switchable two-dimensional gratings based on field-induced layer undulations in cholesteric liquid crystals,” Opt. Lett. 30, 349–351 (2005).
- Gvozdovskyy (2018) Igor Gvozdovskyy, “Electro- and photoswitching of undulation structures in planar cholesteric layers aligned by a polyimide film possessing various values of the anchoring energy,” Liquid Crystals 45, 536–552 (2018).
- Shtykov et al. (2018) N. M. Shtykov, S. P. Palto, B. A. Umanskii, D. O. Rybakov, and I. V. Simdyankin, “Director distribution in field-induced undulated structures of cholesteric liquid crystals,” Liquid Crystals 45, 1408–1414 (2018).
- Zola et al. (2019) Rafael S. Zola, Hari Krishna Bisoyi, Hao Wang, Augustine M. Urbas, Timothy J. Bunning, and Quan Li, “Dynamic control of light direction enabled by stimuli-responsive liquid crystal gratings,” Advanced Materials 31, 1806172 (2019).
- Kusumaatmaja and Majumdar (2015) Halim Kusumaatmaja and Apala Majumdar, “Free energy pathways of a multistable liquid crystal device,” Soft Matter 11, 4809–4817 (2015).
- Bessarab et al. (2015) Pavel F. Bessarab, Valery M. Uzdin, and Hannes Jónsson, “Method for finding mechanism and activation energy of magnetic transitions, applied to skyrmion and antivortex annihilation,” Computer Physics Communications 196, 335–347 (2015).
- Ivanov et al. (2016) A. V. Ivanov, P. F. Bessarab, E. V. Aksenova, V. P. Romanov, and V. M. Uzdin, “Energy surface and minimum energy paths for Fréedericksz transitions in bistable cholesteric liquid crystals,” Phys. Rev. E 93, 042708 (2016).
- Hänggi et al. (1990) Peter Hänggi, Peter Talkner, and Michal Borkovec, “Reaction-rate theory: fifty years after Kramers,” Rev. Mod. Phys. 62, 251–341 (1990).
- Coffey et al. (2007) W. T. Coffey, D. A. Garanin, and D. J. Mccarthy, “Crossover formulas in the Kramers theory of thermally activated escape rates — Application to spin systems,” in Advances in Chemical Physics (John Wiley & Sons, Ltd, 2007) Chap. 5, pp. 483–765.
- Goldbart and Ao (1990) Paul Goldbart and Ping Ao, “Intrinsic torsional viscosity of nematic liquid crystals,” Phys. Rev. Lett. 64, 910–913 (1990).
- Goldbart and Ao (1991) P. M. Goldbart and P. Ao, “Intrinsic torsional viscosity in a narrow tube of nematic liquid crystal,” Molecular Crystals and Liquid Crystals 198, 455–463 (1991).
- Rapini and Papoular (1969) A. Rapini and M. Papoular, “Distortion d’une lamelle nematique sous champ magnetique. Conditions d’ancrage aux parois,” J. Phys. (Paris) Colloq. C4 30, 54–56 (1969).
- Bogi and Faetti (2001) A. Bogi and S. Faetti, “Elastic, dielectric and optical constants of 4’-pentyl-4-cyanobiphenyl,” Liquid Crystals 28, 729–739 (2001).
- Jónsson et al. (1998) H. Jónsson, G. Mills, and K.W. Jacobsen, “Nudged elastic band method for finding minimum energy paths of transitions,” in Classical and Quantum Dynamics in Condensed Phase Simulations, edited by B.J. Berne, G. Ciccotti, and D.F. Coker (World Scientific, 1998).
- Müller et al. (2018) G. P. Müller, P. F. Bessarab, S. M. Vlasov, F. Liz, N. S. Kiselev, S. Blügel, V. M. Uzdin, and H. Jónsson, “Duplication, collapse, and escape of magnetic skyrmions revealed using a systematic saddle point search method,” Phys. Rev. Lett. 121, 197202 (2018).