Metal-Insulator and Magnetic Phase Diagram of Ca2RuO4
from Auxiliary Field Quantum Monte Carlo
and Dynamical Mean Field Theory
Abstract
Layered perovskite ruthenium oxides exhibit a striking series of metal-insulator and magnetic-nonmagnetic phase transitions easily tuned by temperature, pressure, epitaxy, and nonlinear drive. In this work, we combine results from two complementary state of the art many-body methods, Auxiliary Field Quantum Monte Carlo and Dynamical Mean Field Theory, to determine the low temperature phase diagram of Ca2RuO4. Both methods predict a low temperature, pressure-driven metal-insulator transition accompanied by a ferromagnetic-antiferromagnetic transition. The properties of the ferromagnetic state vary non-monotonically with pressure and are dominated by the ruthenium orbital, while the properties of the antiferromagnetic state are dominated by the and orbitals. Differences of detail in the predictions of the two methods are analyzed. This work is theoretically important as it presents the first application of the Auxiliary Field Quantum Monte Carlo method to an orbitally-degenerate system with both Mott and Hunds physics, and provides an important comparison of the Dynamical Mean Field and Auxiliary Field Quantum Monte Carlo methods.
The quantum many-body problem is one of the grand challenge scientific problems of our time Tsymbal and Dowben (2013). Recent work LeBlanc et al. (2015); Zheng et al. (2017); Motta et al. (2017) suggests that an important route towards a solution is to attack important problems via complementary methods. In this paper, we use the Auxiliary Field Quantum Monte Carlo (AFQMC) and Dynamical Mean Field Theory (DMFT) methods to study the low temperature phase diagram and physical properties of Ca2RuO4. In the form used in this article, AFQMC is a zero temperature, finite system method that employs an imaginary time projection that samples the space of non-orthogonal Slater determinants to estimate the ground state wave function Zhang et al. (1997); Zhang (2013). In contrast, DMFT uses a self energy locality assumption to approximate Green’s functions at non-zero temperature Georges et al. (1996). The completely different natures of the approximations made and computational challenges faced by the two methods means that a comparison of results yields important insights into both the actual physics of the systems studied and the validity of the different approximations.
The material chosen for study, Ca2RuO4, is a member of a fascinating and extensively studied family of ruthenium-based compounds with chemical formulae Srn+1RunO3n+1 and Can+1RunO3n+1. This family of materials has been of intense interest for their remarkable properties, including unconventional superconductivity Maeno et al. (1994), variety of magnetic phases Nakatsuji et al. (1997); Cao et al. (1997), nematicity, metal-insulator transitions (MIT) Nakamura et al. (2002); Steffens et al. (2005), and unusual nonequilibrium properties Sow et al. (2017), all of which are believed to be due to strong Hubbard and Hunds electron-electron interactions among the electrons in the Ru-derived orbitals Georges et al. (2013).
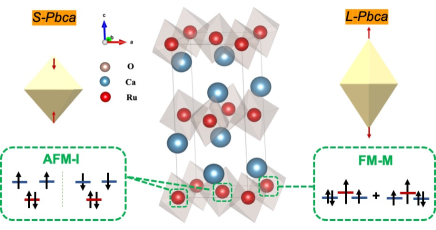
Ca2RuO4 forms a Pbca symmetry structure derived from the Ruddlesden-Popper structure by rotations and tilts of the RuO6 octahedra. The unit cell contains Ru ions, equivalent up to a translation and rotation of the RuO6 octahedron. At ambient pressure, the material undergoes a metal-insulator transition as temperature is decreased below 350 K and becomes antiferromagnetic below 110 K Nakatsuji et al. (1997); Braden et al. (1998); Alexander et al. (1999); Friedt et al. (2001). Increasing pressure decreases the metal-insulator transition temperature Nakamura et al. (2002); Steffens et al. (2005), with the system remaining metallic at room temperature for pressures above 0.5 GPa Nakamura et al. (2002); Steffens et al. (2005) and down to very low temperatures for GPa Nakamura (2007). Low-T ferromagnetism is reported for pressures of several GPa, with varying from - K Nakamura (2007). The material may exist in two closely related forms: S-Pbca (for short) and L-Pbca, distinguished by whether the apical Ru-O bond length and c-axis lattice parameter are relatively longer (L) or shorter (S). The SPbca structure is associated with insulating and antiferromagnetic (AFM) behavior and the LPbca structure with metallic and ferromagnetic (FM) behavior. Capturing the interplay between structural and electronic properties is an important challenge for theory.
Previous publications have studied Ca2RuO4 using Density Functional Theory (DFT) and its “+U” Anisimov, V. I. et al. (2002); Jung et al. (2003) and plus Dynamical Mean Field Theory (DFT+DMFT) Liebsch and Ishida (2007); Gorelov et al. (2010); Zhang and Pavarini (2017); Han and Millis (2018) extensions. However, these works primarily focused on ambient pressure phases and have each presented results from only one theoretical method. Further, methods treat the many body physics via a Hartree-type approximation, while DMFT, which transcends static mean field theory, makes a strong self-energy locality assumption that may be questioned for electronically two-dimensional materials such as the ruthenates. For this reason, cross-comparison with another many body method, such as the AFQMC considered here, is invaluable.
We downfold the full electronic structure of Ca2RuO4 to a material-based, three-band Hamiltonian representing the correlated frontier orbitals for several different crystal structures by first using the non-spin-polarized Generalized Gradient Approximation (GGA) Kresse and Hafner (1993); Kresse and Furthmüller (1996a, b); Kresse and Joubert (1999) to obtain an electronic band structure. We then extract frontier orbitals near the Fermi-surface states from the GGA calculations via a maximally Localized Wannier Function construction as implemented in Wannier90 Marzari and Vanderbilt (1997); Souza et al. (2001). The GGA calculations are performed using experimentally-determined atom positions obtained from ambient-pressure studies performed at room temperature and K Braden et al. (1998); Friedt et al. (2001), as well as room temperature studies performed at pressures of - GPa Steffens et al. (2005). Local Coulomb “” and “” interaction terms are then added with eV and eV, parameters previously found to produce reliable representations of the properties and phase diagrams of perovskites including CaRuO3, SrRuO3, and BaRuO3 Dang and Millis (2013); Dang et al. (2015); Han et al. (2016), as well as Sr2RuO4 Mravlje et al. (2011) (see also Ref. Sutter et al. (2017a) for a direct determination of the Hund’s coupling from photoemission measurements on Ca2RuO4). The resulting low energy theory is a three-band Hubbard-Kanamori Hamiltonian Hao et al. (2019); Kanamori (1963)
| (1) |
In the above, creates an electron with spin in Wannier state at lattice site and denotes the corresponding number operator. The index labels states derived from the Ru symmetry -orbitals (with the appropriate admixture of oxygen wave functions). The first term of the Hamiltonian describes the near Fermi surface band structure, the second describes the intraorbital Coulomb repulsion, the third describes the interorbital Coulomb repulsion, and the last contains electron pair-hopping and exchange contributions. The ab initio parameters are obtained from the Wannier analysis. The on-site term is a matrix parametrizing the energy splitting between the different symmetry orbitals. In a basis aligned with the local RuO6 octahedron, is diagonal with two degenerate eigenvalues giving the onsite energy of the orbitals and a third eigenvalue giving the energy of the orbital. The crystal-field level splitting, , is generally larger in the S-Pbca structure than in L-Pbca structures. For example, eV for the ambient pressure-K SPbca structure, while eV for the ambient pressure-K LPbca structure. As pressure is applied, the crystal-field splitting decreases to eV for the L-GPa structure and even a negative value of eV for the L-GPa structure. It is important to emphasize that is a “bare” parameter, which is small compared to the bandwidths, but whose effects may be strongly enhanced by correlations.
We treat the interactions using the AFQMC and DMFT methods. Extending the AFQMC methodology, which has heretofore mainly been applied to variants of the single-orbital Hubbard model, to the multiband, Hunds metal case has been an important challenge. Here, we employ the methods introduced in Ref. Hao et al. (2019) to overcome this challenge. In AFQMC, one typically studies three-dimensional supercells. We have found that correlations along are typically very weak and therefore set for most of the calculations. A unit cell contains Ru ions; the largest cell we study is , containing Ru ions. The AFQMC method uses imaginary time propagation of a trial wave function to converge to a ground state. Our calculations use different types of trial wave functions including free-electron, as well as antiferromagnetic and ferromagnetic Hartree-Fock states. The self-consistent procedure of Ref. Qin et al. (2016) is applied to find the best single-determinant trial wave function.
We solve the three-band model employing the single shot (no charge self-consistency) DMFT Gorelov et al. (2010); Dang and Millis (2013); Dang et al. (2015); Han et al. (2016); Han and Millis (2018) approximation which treats the experimental crystal structure and use the hybridization expansion variant of the continuous-time quantum Monte Carlo (CT-HYB) solver as implemented in the Toolbox for Research on Interacting Quantum Systems (TRIQS) library Parcollet et al. (2015); Seth et al. (2016). Within our DMFT calculations, the single-site approximation is made and the orbital basis on each of the crystallographically inequivalent Ru sites is aligned with the local octahedral axes to minimize the sign problem.
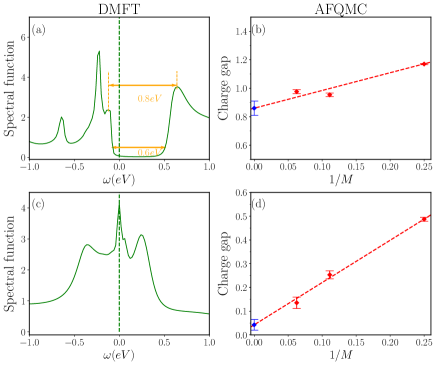
We now present our results, beginning with the ambient-pressure, low-T S-Pbca structure. In this structure, Ca2RuO4 is an antiferromagnetic insulator(AFM-I) with an essentially fully occupied orbital and half-filled orbitals Gorelov et al. (2010); Sutter et al. (2017a). The half-filled orbitals are in a high spin configuration and the Ru sites are antiferromagnetically ordered below a Néel temperature of approximately K. Our calculations reproduce the observed insulating, antiferromagnetic ground state. Our AFQMC simulations are for finite-sized systems and have no spontaneous symmetry breaking, but calculations of the spin-spin correlation function reveal that the spatial extent of the correlations is at least the size of the computational system. Our DMFT calculations were conducted at K and recover a fully polarized antiferromagnetic state and a very small imaginary self-energy. The upper panels of Fig. 2 present the gap to charge excitations computed in both methods. The left panel shows the many-body density of states computed within DMFT for the ambient pressure, K structure using maximum entropy analytical continuation of imaginary time quantum Monte Carlo measurements of the Green’s function. The right panel shows the AFQMC charge gap computed from the difference of ground state energies having different particle numbers: . The charge gap was calculated for , , and supercells, and linear extrapolation was performed with respect to the inverse of the total number of unit cells in the computational system, revealing a charge gap that is 0.8 eV. This is larger than the eV DMFT charge gap, but consistent with the energy separation between DOS maxima seen in the DMFT calculations. Within the DMFT calculations, the physics of the insulating state is evident: from the orbitally-resolved density of states, one sees a fully occupied band and half-occupied states with a clear upper and lower Hubbard band structure. The near quantitatve agreement between the two calculations is strong evidence that both methods correctly represent the insulating antiferromagnetic state. The reported experimental optical gap on the antiferromagnetic phase is of the order of eV Jung et al. (2003).
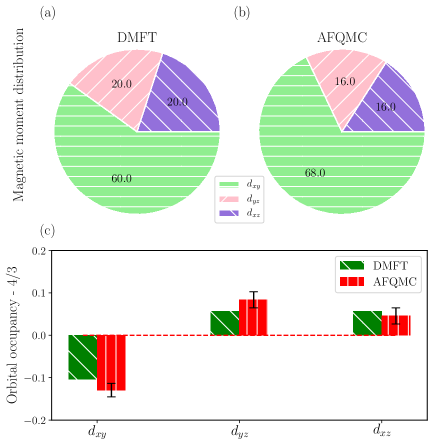
We next turn to the 5GPa L-Pbca structure, experimentally known to host a metallic state with a ferromagnetic transition at temperatures below K Nakamura (2007). For this structure, both our DMFT and AFQMC calculations uncover a ferromagnetic metal (FM-M). The DMFT Néel temperature of roughly K is determined by applying a magnetic field , computing the resulting magnetization, and plotting the data according to the Arrott relation, . Note that, because DMFT neglects spatial fluctuations, it is expected to overestimate the ordering temperature. In order to determine the ground state magnetic order in AFQMC, we break the spin symmetry of the AFQMC trial wave function and compare the QMC energies of the different symmetry sectors. The DMFT density of states is shown in the lower left panel of Fig. 2 and is clearly metallic. The extrapolated gap based on the AFQMC calculations is shown in the lower right panel, and is again consistent with a metallic state. We rationalize the appearance of the metallic state by noting that the increased pressure decreases the crystal field splitting, thereby promoting the transfer of electrons from the to the orbitals. The lower panels of Fig. 3 show the deviations of orbital occupancy from the equal occupancy value of for different structures; the two methods agree very well. The relatively small changes in crystal field splitting are enhanced by interaction effects, leading to almost equally occupied orbitals on the L-Pbca structure and fully occupied orbital on the S-Pbcs structure.
To further characterize the metallic, magnetic state, we present in the upper panels of Fig. 3 the orbital content of the magnetic moments determined from DMFT and AFQMC calculations of the L-Pbca ferromagnetic state. The two methods agree that, despite the nearly equal occupancies of the three orbitals, the dominant contribution to the ferromagnetism comes from the orbital. The enhanced contribution of the orbital to the magnetic moment may arise from the strong van-Hove singularity occurring near the Fermi surface in the density of states.
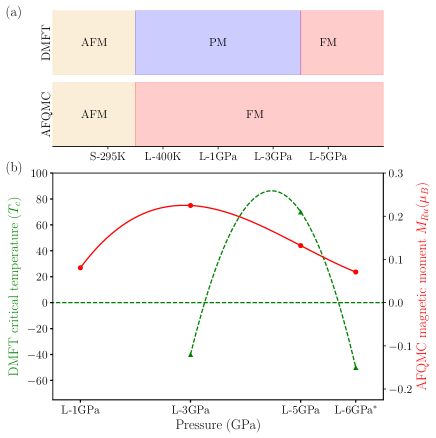
The ground state phase diagram of Ca2RuO4 at various pressures is depicted in Figure 4. Both AFQMC and DMFT find the S-Pbca, S-K structure to be an AFM-I, consistent with experimental findings Braden et al. (1998); Friedt et al. (2001). Both methods also find all of the L-Pbca structures studied, including the L-K, L-GPa, L-GPa, and L-GPa structures, to possess a metallic ground state and the L-GPa structure to be in the FM-M state. However, AFQMC and DMFT predict different magnetic properties for many of the L-Pbca structures. For the L-K, L-GPa, and L-GPa structures, AFQMC finds a FM-M state, while DMFT finds a PM-M state. Note, however, that this conclusion relies on an extrapolation from the lowest temperature that we could study ( K). It will be interesting in the future to reconsider this issue as improved DMFT solvers able to reach much lower temperatures become available. Interestingly, Ca2RuO4 was found to be in a mixed AFM-FM state at pressures less than GPa Lebre Alireza et al. (2007). For pressures above GPa, experiments find FM order, but the critical temperature exhibits a non-monotonic behavior with pressure and peaks between 3-5 GPa in experiment Nakamura (2007). We plot the critical temperature from DMFT (obtained as described from Arrott plots) as a function of pressure in Figure 4(b). A dome-shaped curve of critical temperature vs. pressure is observed, with a peak around 5 GPa. We depict the critical temperature as being negative when DMFT does not recover a ferromagnetic state. While the AFQMC ground state is always ferromagnetic, magnetic moments also exhibit a non-monotonic behavior, which indicates that FM order is favored at intermediate pressures. The maximum critical temperature indicated by the magnetic moment is shifted to lower pressures in AFQMC, with AFQMC’s peak instead occurring around GPa.
In summary, we have employed two state-of-the-art electronic structure methods, a new implementation of AFQMC suitable for multiorbital and Hunds-coupled models, and DMFT, to study Ca2RuO4’s phase diagram and physical properties as a function of pressure. Our calculations are based on a model Hamiltonian with bare electronic parameters taken from Wannier fits to density functional calculations for different experimentally reported structures. We find that the two theoretical methods yield substantially similar results for the nature of the electronic state (metal vs. insulating) and basic electronic properties including gaps and the orbital content of magnetic moments. As noted in previous work, Liebsch and Ishida (2007); Gorelov et al. (2010); Zhang and Pavarini (2017); Han and Millis (2018); Sutter et al. (2017b) the key to the physics is the enhancement, by interactions, of structurally-induced differences in the on-site splitting between the different electronic states which, although small in comparison to the overall bandwidths, drive substantial differences in the occupancies of its orbitals.
The agreement between methods, occurring despite their very different approximations and sources of errors, adds confidence both to the methods and to the emerging physical picture. The most significant discrepancy between the methods is a different magnetic phase diagram for the high pressure phases of Ca2RuO4’s magnetic ordering between 1 and 5 GPa. The two methods agree on the qualitative features including the presence of a dome of magnetization, with the strongest magnetic state occurring at an intermediate pressure, but disagree on the exact range of pressures where magnetism is observed and on the pressure that maximizes the tendency toward magnetism. The difference may be due to intersite effects requiring a cluster dynamical mean field treatment in this quasi-two dimensional system, limitations in extrapolating DMFT results down to very low temperatures (calling for the development of improved solvers), or bias in AFQMC from the choice of initial wave function or the constrained path approximation.
Our work suggests several interesting extensions. The methodology employed here is directly applicable to Ca2-xSrxRuO4 materials, strontium-doped versions of Ca2RuO4 that interpolate between the AF-I Ca2RuO4 studied here and metallic and superconducting Sr2RuO4 Maeno et al. (1994). Past works have shown that increasing is analogous to increasing temperature or pressure in this work, leading to the evolution of a metal for large values of Nakatsuji and Maeno (2000); Friedt et al. (2001). Nevertheless, Ca2-xSrxRuO4 exhibits a number of yet-to-be-explained exotic phases, including a metamagnetic phase that emerges for Nakatsuji and Maeno (2000). Beyond these specific applications, the methodologies employed here are ripe for application to the many 4- and 5-transition metal oxides whose complex interplay of spin-orbit coupling, exchange, and crystal-field effects have and continue to reveal unexpected physics. Most importantly, despite their algorithmic limitations, our new multiband AFQMC methodology and DMFT predict similar insulating and magnetic orders over wide swaths of Ca2RuO4’s phase diagram, only differing in their predictions of Ca2RuO4’s magnetic ordering for L-Pbca structures at moderate pressures.
Acknowledgements: B.M.R. and H.H. acknowledge support for this work from NSF grant DMR-1726213, DOE grant DE-SC0019441, and the Alfred P. Sloan Foundation. A.J.M. (partly) and Q.H. (fully) were supported by the Basic Energy Sciences Program of the US Department of Energy under grant DOE-SC-0012375. A.G. acknowledges partial support by the European Research Council (ERC-319286-QMAC). We are grateful to H. T. Dang for his contribution to some of the DMFT codes used in this work. This work was conducted using computational resources and services at the Brown University Center for Computation and Visualization, XSEDE, the Yeti HPC cluster at Columbia University, and the Flatiron Institute. The Flatiron Institute is a division of the Simons Foundation.
References
- Tsymbal and Dowben (2013) E. Tsymbal and P. Dowben, Front. Phys. 1, 32 (2013).
- LeBlanc et al. (2015) J. P. F. LeBlanc, A. E. Antipov, F. Becca, I. W. Bulik, G. K.-L. Chan, C.-M. Chung, Y. Deng, M. Ferrero, T. M. Henderson, C. A. Jiménez-Hoyos, E. Kozik, X.-W. Liu, A. J. Millis, N. V. Prokof’ev, M. Qin, G. E. Scuseria, H. Shi, B. V. Svistunov, L. F. Tocchio, I. S. Tupitsyn, S. R. White, S. Zhang, B.-X. Zheng, Z. Zhu, and E. Gull (Simons Collaboration on the Many-Electron Problem), Phys. Rev. X 5, 041041 (2015).
- Zheng et al. (2017) B.-X. Zheng, C.-M. Chung, P. Corboz, G. Ehlers, M.-P. Qin, R. M. Noack, H. Shi, S. R. White, S. Zhang, and G. K.-L. Chan, Science 358, 1155 (2017).
- Motta et al. (2017) M. Motta, D. M. Ceperley, G. K.-L. Chan, J. A. Gomez, E. Gull, S. Guo, C. A. Jiménez-Hoyos, T. N. Lan, J. Li, F. Ma, A. J. Millis, N. V. Prokof’ev, U. Ray, G. E. Scuseria, S. Sorella, E. M. Stoudenmire, Q. Sun, I. S. Tupitsyn, S. R. White, D. Zgid, and S. Zhang (Simons Collaboration on the Many-Electron Problem), Phys. Rev. X 7, 031059 (2017).
- Zhang et al. (1997) S. Zhang, J. Carlson, and J. E. Gubernatis, Phys. Rev. B 55, 7464 (1997).
- Zhang (2013) S. Zhang, “Auxiliary-field quantum monte carlo for correlated electron systems,” (Verlag, 2013) Chap. Emergent Phenomena in Correlated Matter: Modeling and Simulation.
- Georges et al. (1996) A. Georges, G. Kotliar, W. Krauth, and M. J. Rozenberg, Rev. Mod. Phys. 68, 13 (1996).
- Maeno et al. (1994) Y. Maeno, H. Hashimoto, K. Yoshida, S. Nishizaki, T. Fujita, J. Bednorz, and F. Lichtenberg, Nature 372, 532 (1994).
- Nakatsuji et al. (1997) S. Nakatsuji, S.-i. Ikeda, and Y. Maeno, J. Phys. Soc. Jpn. 66, 1868 (1997).
- Cao et al. (1997) G. Cao, S. McCall, J. Crow, and R. Guertin, Phys. Rev. Lett. 78, 1751 (1997).
- Nakamura et al. (2002) F. Nakamura, T. Goko, M. Ito, T. Fujita, S. Nakatsuji, H. Fukazawa, Y. Maeno, P. Alireza, D. Forsythe, and S. R. Julian, Phys. Rev. B 65, 220402 (2002).
- Steffens et al. (2005) P. Steffens, O. Friedt, P. Alireza, W. G. Marshall, W. Schmidt, F. Nakamura, S. Nakatsuji, Y. Maeno, R. Lengsdorf, M. M. Abd-Elmeguid, and M. Braden, Phys. Rev. B 72, 094104 (2005).
- Sow et al. (2017) C. Sow, S. Yonezawa, S. Kitamura, T. Oka, K. Kuroki, F. Nakamura, and Y. Maeno, Science 358, 1084 (2017).
- Georges et al. (2013) A. Georges, L. d. Medici, and J. Mravlje, Annu. Rev. Condens. Matter Phys. 4, 137 (2013).
- Braden et al. (1998) M. Braden, G. André, S. Nakatsuji, and Y. Maeno, Phys. Rev. B 58, 847 (1998).
- Alexander et al. (1999) C. S. Alexander, G. Cao, V. Dobrosavljevic, S. McCall, J. E. Crow, E. Lochner, and R. P. Guertin, Phys. Rev. B 60, R8422 (1999).
- Friedt et al. (2001) O. Friedt, M. Braden, G. André, P. Adelmann, S. Nakatsuji, and Y. Maeno, Phys. Rev. B 63, 174432 (2001).
- Nakamura (2007) F. Nakamura, J. Phys. Soc. Jpn. 76, 96 (2007).
- Anisimov, V. I. et al. (2002) Anisimov, V. I., Nekrasov, I. A., Kondakov, D. E., Rice, T. M., and Sigrist, M., Eur. Phys. J. B 25, 191 (2002).
- Jung et al. (2003) J. H. Jung, Z. Fang, J. P. He, Y. Kaneko, Y. Okimoto, and Y. Tokura, Phys. Rev. Lett. 91, 056403 (2003).
- Liebsch and Ishida (2007) A. Liebsch and H. Ishida, Phys. Rev. Lett. 98, 216403 (2007).
- Gorelov et al. (2010) E. Gorelov, M. Karolak, T. O. Wehling, F. Lechermann, A. I. Lichtenstein, and E. Pavarini, Phys. Rev. Lett. 104, 226401 (2010).
- Zhang and Pavarini (2017) G. Zhang and E. Pavarini, Phys. Rev. B 95, 075145 (2017).
- Han and Millis (2018) Q. Han and A. Millis, Phys. Rev. Lett. 121, 067601 (2018).
- Kresse and Hafner (1993) G. Kresse and J. Hafner, Phys. Rev. B 47, 558 (1993).
- Kresse and Furthmüller (1996a) G. Kresse and J. Furthmüller, Comput. Mat. Sci. 6, 15 (1996a).
- Kresse and Furthmüller (1996b) G. Kresse and J. Furthmüller, Phys. Rev. B 54, 11169 (1996b).
- Kresse and Joubert (1999) G. Kresse and D. Joubert, Phys. Rev. B 59, 1758 (1999).
- Marzari and Vanderbilt (1997) N. Marzari and D. Vanderbilt, Phys. Rev. B 56, 12847 (1997).
- Souza et al. (2001) I. Souza, N. Marzari, and D. Vanderbilt, Phys. Rev. B 65, 035109 (2001).
- Dang and Millis (2013) H. T. Dang and A. J. Millis, Phys. Rev. B 87, 155127 (2013).
- Dang et al. (2015) H. T. Dang, J. Mravlje, A. Georges, and A. J. Millis, Phys. Rev. B 91, 195149 (2015).
- Han et al. (2016) Q. Han, H. T. Dang, and A. J. Millis, Phys. Rev. B 93, 155103 (2016).
- Mravlje et al. (2011) J. Mravlje, M. Aichhorn, T. Miyake, K. Haule, G. Kotliar, and A. Georges, Phys. Rev. Lett. 106, 096401 (2011).
- Sutter et al. (2017a) D. Sutter, C. G. Fatuzzo, S. Moser, M. Kim, R. Fittipaldi, A. Vecchione, V. Granata, Y. Sassa, F. Cossalter, G. Gatti, M. Grioni, H. M. Ronnow, N. C. Plumb, C. E. Matt, M. Shi, M. Hoesch, T. K. Kim, T.-R. Chang, H.-T. Jeng, C. Jozwiak, A. Bostwick, E. Rotenberg, A. Georges, T. Neupert, and J. Chang, Nature communications 8, 15176 (2017a).
- Hao et al. (2019) H. Hao, B. M. Rubenstein, and H. Shi, Phys. Rev. B 99, 235142 (2019).
- Kanamori (1963) J. Kanamori, Prog. Theor. Phys. 30, 275 (1963).
- Qin et al. (2016) M. Qin, H. Shi, and S. Zhang, Phys. Rev. B 94, 235119 (2016).
- Parcollet et al. (2015) O. Parcollet, M. Ferrero, T. Ayral, H. Hafermann, I. Krivenko, L. Messio, and P. Seth, Comput. Phys. Commun. 196, 398 (2015).
- Seth et al. (2016) P. Seth, I. Krivenko, M. Ferrero, and O. Parcollet, Comput. Phys. Commun. 200, 274 (2016).
- Lebre Alireza et al. (2007) P. Lebre Alireza, S. Barakat, A.-M. Cumberlidge, G. Lonzarich, F. Nakamura, and Y. Maeno, J. Phys. Soc. Jpn. 76, 216 (2007).
- Sutter et al. (2017b) D. Sutter, C. G. Fatuzzo, S. Moser, M. Kim, R. Fittipaldi, A. Vecchione, V. Granata, Y. Sassa, F. Cossalter, G. Gatti, M. Grioni, H. M. Røznnow, N. C. Plumb, C. E. Matt, M. Shi, M. Hoesch, T. K. Kim, T.-R. Chang, H.-T. Jeng, C. Jozwiak, A. Bostwick, E. Rotenberg, A. Georges, T. Neupert, and J. Chang, Nat. Commun. 8, 15176 (2017b).
- Nakatsuji and Maeno (2000) S. Nakatsuji and Y. Maeno, Phys. Rev. Lett. 84, 2666 (2000).