Dyson-Schwinger approach to baryon number fluctuations
Abstract
We summarize our results on baryon number fluctuations at nonzero temperature and chemical potential. They are obtained from solutions of a coupled set of Dyson-Schwinger equations for the quark and gluon propagators of QCD in Landau gauge with quark flavors. In comparison with preliminary STAR data, our results are compatible with a critical endpoint at large chemical potential and a freeze-out line that bends below it.
1 Introduction
Proving the very existence and possibly locating the theoretically conjectured critical endpoint (CEP) in the phase diagram of QCD is one of the main quests of contemporary heavy-ion collision experiments. Assuming that the freeze-out happens close to the chiral crossover line, fluctuations of conserved charges (baryon number, strangeness, and electric charge) are expected to be promising quantities to provide signals of the CEP in experiments. Ratios of cumulants of these conserved quantities can be obtained in event-by-event analyses and compared to ratios obtained in theoretical calculations. See, e.g., Refs. [1, 2, 3] for review articles.
In the following we summarize our recent results [4] on baryon number fluctuations at nonzero temperature and baryon chemical potential as well as our updated result for the QCD phase diagram with physical quark flavors using the nonperturbative framework of Dyson-Schwinger equations (DSEs).
2 Fluctuations
Fluctuations of the conserved quantities baryon number (B), strangeness (S), and electric charge (Q) in heavy-ion collisions are given by derivatives of QCD’s grand-canonical potential with respect to the corresponding chemical potentials, viz.
| (1) |
with . The connection to experiment is established, for example, by the ratios
| (2) |
of baryon number fluctuations with , , and denoting the skewness, variance, and kurtosis of the net-baryon distribution, respectively. Analogous expressions hold for strangeness and electric charge. Results from the Beam Energy Scan program at the Relativistic Heavy Ion Collider at Brookhaven National Laboratory for fluctuations of the net-proton number obtained by the STAR collaboration [5, 6] can be used as a proxy for fluctuations of the net-baryon number and therefore serve for comparisons.
We use the nonperturbative framework of DSEs to provide results for fluctuations of the baryon number in ()-flavor QCD at nonvanishing and . They are determined via the quark number densities
| (3) |
where , denotes the number of colors, is the quark wave function renormalization constant, and with Matsubara frequencies ; . The quark chemical potentials are related to the ones for baryon number, strangeness and electric charge via , , and . Using these relations, one expresses the derivatives appearing in Eq. (1) in terms of Eq. (3) and derivatives thereof. More details can be found in Ref. [4]. The quantity denotes the dressed (i.e., nonperturbative) quark propagator at nonzero temperature and chemical potential and will be detailed in the next section.
3 Dyson-Schwinger equations

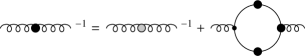
The dressed quark propagator at nonzero temperature and chemical potential is needed to compute the quark number densities, Eq. (3). It is obtained by solving a coupled set of truncated DSEs where the backcoupling of quarks onto the gluon is taken explicitly into account. This allows for a consistent mass and flavor dependence of the gluon beyond simple models. Furthermore, the gluon becomes sensitive to the chiral dynamics of the quark. The dressed quark and gluon propagators each satisfy a DSE shown diagrammatically in Fig. 1. They are coupled to higher-order correlation functions, e.g., the dressed quark-gluon vertex, which obey their own DSEs. Thus, truncations are necessary to obtain a closed system of equations. We replace all pure Yang-Mills self-energies in the gluon DSE, i.e., all diagrams with no explicit quark content, with quenched temperature-dependent lattice data [8, 9] and add the quark loop explicitly. For the dressed quark-gluon vertex we use the following ansatz: The leading tensor structure of the Ball-Chiu vertex construction [10], which solves the Abelian Ward-Takahashi identity for the vertex, is supplemented with a phenomenological infrared-enhanced function.
For the sake of brevity, we do not show explicit expressions here and refer the reader to Ref. [4] for more details. This setup, which gives us access to the dressed quark and unquenched gluon propagators at arbitrary temperature and chemical potential, has been successfully used in a series of previous works. See Ref. [11] and references therein for a comprehensive overview.
4 Results and discussion
4.1 Phase diagram
The order parameter for chiral symmetry breaking is the quark condensate
| (4) |
where is the mass renormalization constant. The quark condensate is divergent for nonzero current-quark masses and needs to be regularized. This is done by considering the so-called subtracted condensate . We use the inflection point of with temperature to define the pseudocritical chiral transition temperature . The infrared strength of our vertex ansatz is chosen such that obtained in this way coincides with lattice results. Again, more details can be found in Ref. [4].
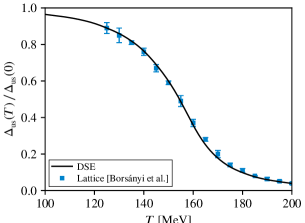
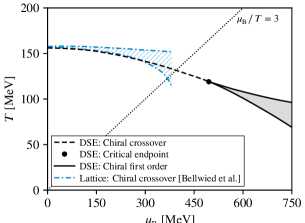
In the left diagram of Fig. 2 we show our result for the subtracted condensate (solid black) at vanishing chemical potential compared to continuum-extrapolated lattice results from Ref. [12] (blue squares). As described above, our result of agrees by construction with the result from lattice QCD. A nontrivial result is, however, the almost perfect match of the steepness. The right diagram of Fig. 2 shows our result for the QCD phase diagram with quark flavors at the physical point. The crossover line (dashed black) becomes steeper with increasing chemical potential and finally terminates in a second-order CEP at followed by the coexistence region of a first-order transition (shaded gray) bound by spinodal lines (solid black). The CEP occurs at large chemical potential with a corresponding ratio of . We also show results for the chiral crossover from lattice QCD [13] (blue band) obtained by analytic continuation from imaginary to real chemical potential and find good agreement with our crossover line.
4.2 Baryon number fluctuations
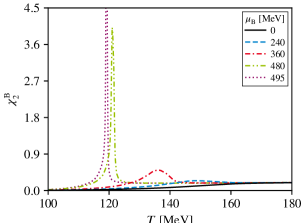
In the left diagram of Fig. 3 we show the second-order baryon number fluctuation approaching the CEP. At vanishing chemical potential (solid black) we find a monotonous increase with the maxium of the slope located near . At nonzero chemical potential, a bulge begins to form around the pseudocritical chiral transition temperature and grows with increasing chemical potential (dashed blue and dash-dotted red). In the vicinity of the CEP, the bulge becomes a sharp peak with a significant rise in magnitude (dash-dot-dotted green) and finally diverges at the CEP (dotted purple). This is indeed expected since at the CEP the correlation length of the system diverges (at least for infinite volume), , and with .
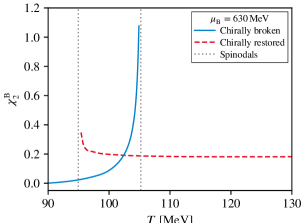
The behavior of beyond the CEP in the first-order transition region of the phase diagram is displayed in the right diagram of Fig. 3. The second-order baryon number fluctuation splits into two branches corresponding to two different solutions of the DSE for the dressed quark propagator: the chirally broken solution (solid blue) and the partially chirally restored solution (dashed red). The region where both solutions are found defines the coexistence region of the first-order transition bounded by spinodals (vertical dotted gray lines). Outside this coexistence region, is only a slowly varying function with temperature.
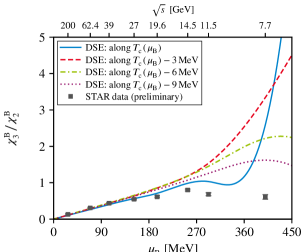
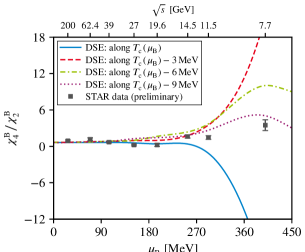
Even though one has to be cautious when comparing theoretical results for fluctuations with experimental data, there is considerable interest to do so.111The caveats involved are related to the experimental situation in heavy-ion collisions. For example finite-volume effects, the finite temporal extent of the fireball, and whether/when the system is in thermal equilibrium. See Refs. [2, 3] and references therein. In Fig. 4 we present results for the skewness and kurtosis ratios (left) and (right), respectively, along our chiral crossover line (solid blue). At small chemical potential (respectively large ) we find good agreement with data from the STAR collaboration. From on the agreement becomes worse and disappears for since the fluctuations start to react strongly to the presence of our CEP. We also evaluated these ratios along lines with a constant difference in temperature of 3, 6, and below the crossover line. The reason is that it is not clear if the freeze-out and crossover lines have the same curvature. It may be the case that the freeze-out line bends stronger than the crossover line with increasing chemical potential. This notion is at least qualitatively supported by our results. At small chemical potential, the variation in both ratios with increasing temperature distance from the crossover line can only hardly discriminated by the data. However, the data points at and support a freeze-out line located very close to the crossover line. We conclude that this is generally the case for . On the other hand, results for the kurtosis ratio at and indicate that the freeze-out and crossover lines are separated by at least in this region of the phase diagram. The skewness ratio follows the same trend, although on a less quantitative level than the kurtosis ratio.
Finally, we would like to mention that our results are accompanied with limitations. There may be a substantial error associated with the precise location of the CEP. It stems entirely from the truncation of the quark-gluon vertex and may be reduced in the future by more extensive DSE studies [15, 16] and/or systematic comparisons with similar calculations within the framework of the functional renormalization group [17, 18]. Furthermore, at the current level of truncation, the critical exponents of our CEP are mean field. We aim to include explicit pion and sigma-meson effects in future work which are expected to put our CEP in the correct universality class.
This work has been supported by HGS-HIRe for FAIR, the GSI Helmholtzzentrum für Schwerionenforschung, HIC for FAIR within the LOEWE program of the State of Hesse, the BMBF under contract 05P18RGFCA, and the Deutsche Forschungsgemeinschaft (DFG, German Research Foundation) – project number 315477589 – TRR 211.
References
- [1] Asakawa M and Kitazawa M 2016 Prog. Part. Nucl. Phys. 90 299
- [2] Luo X and Xu N 2017 Nucl. Sci. Tech. 28 112
- [3] Bzdak A et al. 2019 arXiv:1906.00936 [nucl-th]
- [4] Isserstedt P, Buballa M, Fischer C S and Gunkel P J 2019 Phys. Rev. D 100 074011
- [5] Luo X 2015 Proc. Sci. PoS(CPOD2014)019
- [6] Luo X 2016 Nucl. Phys. A 956 75
- [7] Binosi D, Collins J, Kaufhold C and Theussl L 2009 Comput. Phys. Commun. 180 1709
- [8] Fischer C S, Maas A and Muller J A 2010 Eur. Phys. J. C 68 165
- [9] Maas A, Pawlowski J M, von Smekal L and Spielmann D 2012 Phys. Rev. D 85 034037
- [10] Ball J S and Chiu T W 1980 Phys. Rev. D 22 2542
- [11] Fischer C S 2019 Prog. Part. Nucl. Phys. 105 1
- [12] Borsányi S et al. 2010 J. High Energy Phys. JHEP09(2010)073
- [13] Bellwied R et al. 2015 Phys. Lett. B 751 559
- [14] Adamczyk L et al. 2017 Phys. Rev. C 96 044904
- [15] Eichmann G, Fischer C S and Welzbacher C A 2016 Phys. Rev. D 93 034013
- [16] Contant R, Huber M Q, Fischer C S, Welzbacher C A and Williams R 2018 Acta Phys. Pol. B Supp. 11 483
- [17] Braun J, Haas L M, Marhauser F and Pawlowski J M 2011 Phys. Rev. Lett. 106 022002
- [18] Fu W j, Pawlowski J M and Rennecke F 2019 arXiv:1909.02991 [hep-ph]