First-principles prediction of incipient order in arbitrary high-entropy alloys: exemplified in Ti0.25CrFeNiAlx
Abstract
Multi-principal-element alloys, including high-entropy alloys, experience segregation or partially-ordering as they are cooled to lower temperatures. For Ti0.25CrFeNiAlx, experiments suggest a partially-ordered B2 phase, whereas CALculation of PHAse Diagrams (CALPHAD) predicts a region of L21+B2 coexistence. We employ first-principles density-functional theory (DFT) based electronic-structure approach to assess stability of phases of alloys with arbitrary compositions and Bravais lattices (A1/A2/A3). In addition, DFT-based linear-response theory has been utilized to predict Warren-Cowley short-range order (SRO) in these alloys, which reveals potentially competing long-range ordered phases. The resulting SRO is uniquely analyzed using concentration-waves analysis for occupation probabilities in partially-ordered states, which is then be assessed for phase stability by direct DFT calculations. Our results are in good agreement with experiments and CALPHAD in Al-poor regions () and with CALPHAD in Al-rich region (), and they suggest more careful experiments in Al-rich region are needed. Our DFT-based electronic-structure and SRO predictions supported by concentration-wave analysis are shown to be a powerful method for fast assessment of competing phases and their stability in multi-principal-element alloys.
keywords:
Density-functional theory , high-entropy alloy , short-range order , concentration-waves1 Introduction
Multi-principal-element alloys or complex solid-solution alloys, of which high-entropy alloys (HEAs) are a subset, have established a new paradigm in alloy design [1], but there are many fundamental science questions unanswered. These HEAs offer a huge unexplored composition space that has lead to the discovery of novel alloys with unusual properties [1, 2, 3, 4, 5, 6, 7, 8, 9, 10, 11, 12]. Short-range order (SRO) is one such key property that remains less explored in HEAs [13, 14, 15, 16, 17, 18, 19]. SRO in disorder phase is indicative of the expected partially or fully-ordered state from an order-disorder transition, where two distant atoms are connected by non-zero correlations as described by long-range order (LRO) parameters [20, 21, 22, 23, 24, 25, 26]. The site-pairwise correlation between atoms in an alloy is given by the Warren-Cowley SRO parameters [18]. In terms of diffraction, the SRO is usually defined with respect to the underlying (average) crystal lattice in the high-temperature phase, i.e., FCC, BCC, or HCP, and competes within the alloy as temperature is decreased. By controlling SRO and LRO, the processing and properties of advanced materials can be manipulated [27]. Thus, predicting SRO in HEAs and assessing its electronic origins (e.g., band-filling, Fermi-surface, atomic-size [i.e., band-width], or charge-transfer) is of great importance.
The SRO, in principle, can be determined experimentally from diffuse-scattering intensities measured in reciprocal space using x-ray, neutron, or electron diffraction [28, 29, 30], which depends on the differences of atomic scattering factors. However, similar structure factors of some alloying elements in a HEA makes the SRO measurements difficult. Even after these complex measurements, it is not possible to pinpoint the underlying origin of SRO. Hence, the calculation of diffuse intensities in HEAs based on electronic density-functional theory (DFT) and the subsequent connection of those intensities directly to its origin(s) can provide a fundamental understanding of the experimental data and phase instabilities [17].
Generally, the SRO assessed in high-temperature phases (BCC, FCC, and HCP) is not biased by a priori choice of LRO phases, which may be a problem with more traditional total-energy methods [31, 32]. Singh et. al. [18, 33, 34, 35] presented a DFT based thermodynamic linear-response theory that predicts all SRO pairs simultaneously (as done for displacement modes, i.e. phonons) and details the ordering behavior in HEAs [18]. The SRO theory can predict the eigenvectors (chemical modes) at the order-disorder transition with respect to the formation of short-wavelength concentration waves [23, 24]. These eigenvectors can be used to characterize the potential ordered structures, e.g., B2 phase in BCC alloys, with site-probabilities modulated in a wave-like periodicity [23, 24, 25, 26], all determined from the underlying electronic structure of each specific HEA composition.
In this paper, we explore the phase stability over full Al-composition range in Ti0.25CrFeNiAlx HEA with focus on few special compositions, e.g., x=0.25, 0.50, 0.75 and 1.0, allowing one-on-one comparison with available experiments. The formation enthalpy (Eform) shows that Al stabilizes BCC phase up to three Al mole-fractions and FCC phase at higher Al compositions. For Al-composition range, our SRO assisted CW predictions of ordering phases compare well with the CALPHAD and experiments of Liu et.al. [36]. Interestingly, for Al-composition range , experiments do not find any secondary ordering, whereas CALPHAD indicates competing B2 and L21 phases. Our CW analysis when combined with direct DFT calculations shows thermodynamically stable B2 and L21 phases. The DFT-based SRO theory combined with CW approach allows a quick assessment of ordering behavior in HEAs (based on the composition and associated electronic-structure of the specific alloy), similar to the Hume-Rothery empirical relationships of phase formation in traditional alloys.
2 Computational method
Here, we use the first-principles DFT in combination with linear-response theory and analytically formulated concentration-wave (CW) analysis [24] to study phase-stability, electronic-structure, and ordering behavior of HEAs, as well as identifying the electronic origins.
DFT Calculation: KKR-CPA is a DFT based Green’s function electronic-structure approach that permits charge self-consistency and configurational averaging to be done simultaneously (averaged Green’s functions are related directly to observables [37]). The coherent potential approximation (CPA) is used to handle chemical disorder and its configurational averaging, and associated Friedel screening [38, 39, 40]. We used generalized gradient approximation (PBE) as the exchange-correlation functional [41]. The core electrons and semi-core/valence electrons are treated relativistically and scalar-relativistically, respectively. A variational potential zero is used to yield kinetic energies and dispersions nearing those of full-potential methods [42]. For self-consistent densities, a 20 (complex) energy point Gauss-Legendre semi-circular contour integration is used to integrate the Green’s function [43], and =3 in spherical-harmonic basis. Brillouin zone (BZ) is sampled using Monkhorst-Pack method [44] with for FCC, BCC (HCP) meshes. We used 300 -points along symmetry lines to visualize electronic dispersion, i.e., “band” structure.
Chemical SRO: Formally, the Warren-Cowley SRO parameters (pair correlations), i.e., in Laue units for atom pairs ,, are defined relative to average x-ray scattering lattice, as atomic displacements sum to zero on average (by symmetry, for each spatial direction). For linear-response, the second-order variation of DFT free-energy with respect to elemental concentrations at sites , is performed [45, 16, 17, 18], and the Warren-Cowley SRO are analytically found for any N-component HEA with concentrations at temperature (T) to be given by an matrix
| (1) | |||
where with is the Boltzmann constant and is a constant matrix element [18]. The arbitrary Nth atom is used as “host” due to conservation of atoms ( independent concentrations, i.e., ). The pairwise-interchange energy S in linear-response is the chemical stability matrix referenced to the homogeneous HEA [17], which reflects the free-energy cost for all pair fluctuations with [18, 33, 34, 35]. Here, S is the energy cost to exchange specific atomic pairs, with effects included to all orders in the electronic structure. S also reveals the unstable ordering modes, its origin as well as the “fingerprint” for the ordering behavior in an arbitrary HEA [15, 18, 16, 17, 46, 47, 48, 45].
For completeness, we note that Eq. 1 is exact [17, 49], if the configurational average of the functional and its variation are handled exactly. However, the CPA is a mean-field (single-site) approximation to the average, and, although it is often adequate, it is not exact. Nonetheless, while it can be made increasingly accurate via a cluster generalization of the CPA [50], a simple Onsager correction to the single-site CPA is sufficient to remove most of the error [17]. Moreover, this correction eliminates the incorrect topology of mean-field phase diagrams and dramatically improves the transition temperatures [51]. In short, the mean-field S is corrected by requiring that the SRO intensity (Eq. 1) properly conserves the sum rule, i.e., [17]. The outcome in N-component alloy is that are normalized correctly and the unmeasured correlations (diagonal pairs, i.e., ) are correctly determined. For more details see [17] and [51]. Minimally, a site-diagonal (-independent) self-energy () is required, i.e.,
| (2) | |||||
where the SRO is implicitly dependent on , and must be corrected at each , the spinodal temperature (see below). At large temperatures, and this coupled set of equations can be solved iteratively by Newton-Raphson [45, 16, 18].
Spinodal Decomposition & Transition Temperatures: The most unstable SRO mode is where has the largest peak at for a specific - pair [18]. An absolute instability to the mode occurs below the spinodal temperature Tsp defined at . The normal modes are eigenvectors of S driving divergence in SRO. These modes are obtained for any arbitrary HEA from S using a special oblique coordinate transform in a given Gibbs space [18].
Concentration-Wave Analysis of SRO: The idea of concentration-wave (CW) for multi-component alloys is adopted from Khachaturian et al. [24], which was found useful in characterizing ordering phases of stoichiometric binary compositions. Since, the present day multi-component alloys are neither stoichiometric nor binary, it increased the complexity of the problem. With normal modes of eigenvectors from the SRO Eq. 1, a vector n of probabilities for each element to occupy specific sites in a crystal structure for partially-LRO cell or superlattice, i.e., the generalized concentration-waves, can be written as
| (3) |
. Here, is an -component vector in site occupation probabilities in the Bravais lattice of the N-component homogeneous HEA reference. Whereas, depends on the type of order and real-space site coordinates, dictated by the LRO parameters . The sum runs over the “stars” (inequivalent that define the order), (equivalent in the -star), and (eigenvector branch of the free-energy quadric). The other quantities are LRO parameter for the branch and star; is -component vector of the eigenmode of stability matrix for the branch; and the symmetry coefficient determined by normalization condition and geometry.
Previously, the term in Eq. 3 was either assumed or ignored for simplicity in stoichiometric binary cases [23, 24]. Our DFT+SRO theory directly provides these eigenvectors of the normal concentration modes required to assess ordering behavior of multi-principle element alloys or HEAs at spinodal decomposition temperature. A detailed discussion on model binary alloy is provided in the supplement Section S1.
The Eq. 3 represents the possible competing types of ordered superlattices (symmetry-broken order) that are incipient in the chemical SRO for a fixed Bravais lattice. “Incipient ordering” indicates the possible low-temperature ordered structure in the presence of specific short-range order at higher-temperatures. For example, SRO results in broad, diffuse x-ray scattering in the regions where super-structure peaks would appear with LRO at lower temperatures. Each of the anticipated partially- or fully-ordered cells can be then assessed using DFT calculated relative to – a direct calculation for state of order rather than estimated using the SRO only. We showcase this in the next section using the SRO and its eigenvectors to estimate the competing phases, and, then, we do direct DFT calculation for the given partially LRO to confirm (and get proper relative energies). As an aside, the CW analysis for small-cell-type ordering shows that only up to an 8-component HEA can order if at very specific compositions.
3 Results and Discussion
Liu et.al. [36] recently reported experimental observations on quinary Ti0.25CrFeNiAlx alloys and found BCC as the stable phase throughout the Al composition range of mole fraction (or at.%). Our DFT calculated phase stability plot versus Al content, Fig. 1, shows BCC as the most stable phase for . Over the full Al compositions, FCC is the stable phase from 3.25 mole fraction and beyond. The initial increase in Al% further stabilizes the BCC phase (until 40%Al), i.e., Al plays the role of BCC-phase stabilizer, in agreement with the experiments and CALPHAD [36]. To make a further connection, we also show in Fig. 1 the formation energy (relative to energies of elemental solids in their ground state phases). As is clear, FCC is stable over BCC by 65%Al, where the alloy then is in a small two-phase region until 100%Al.
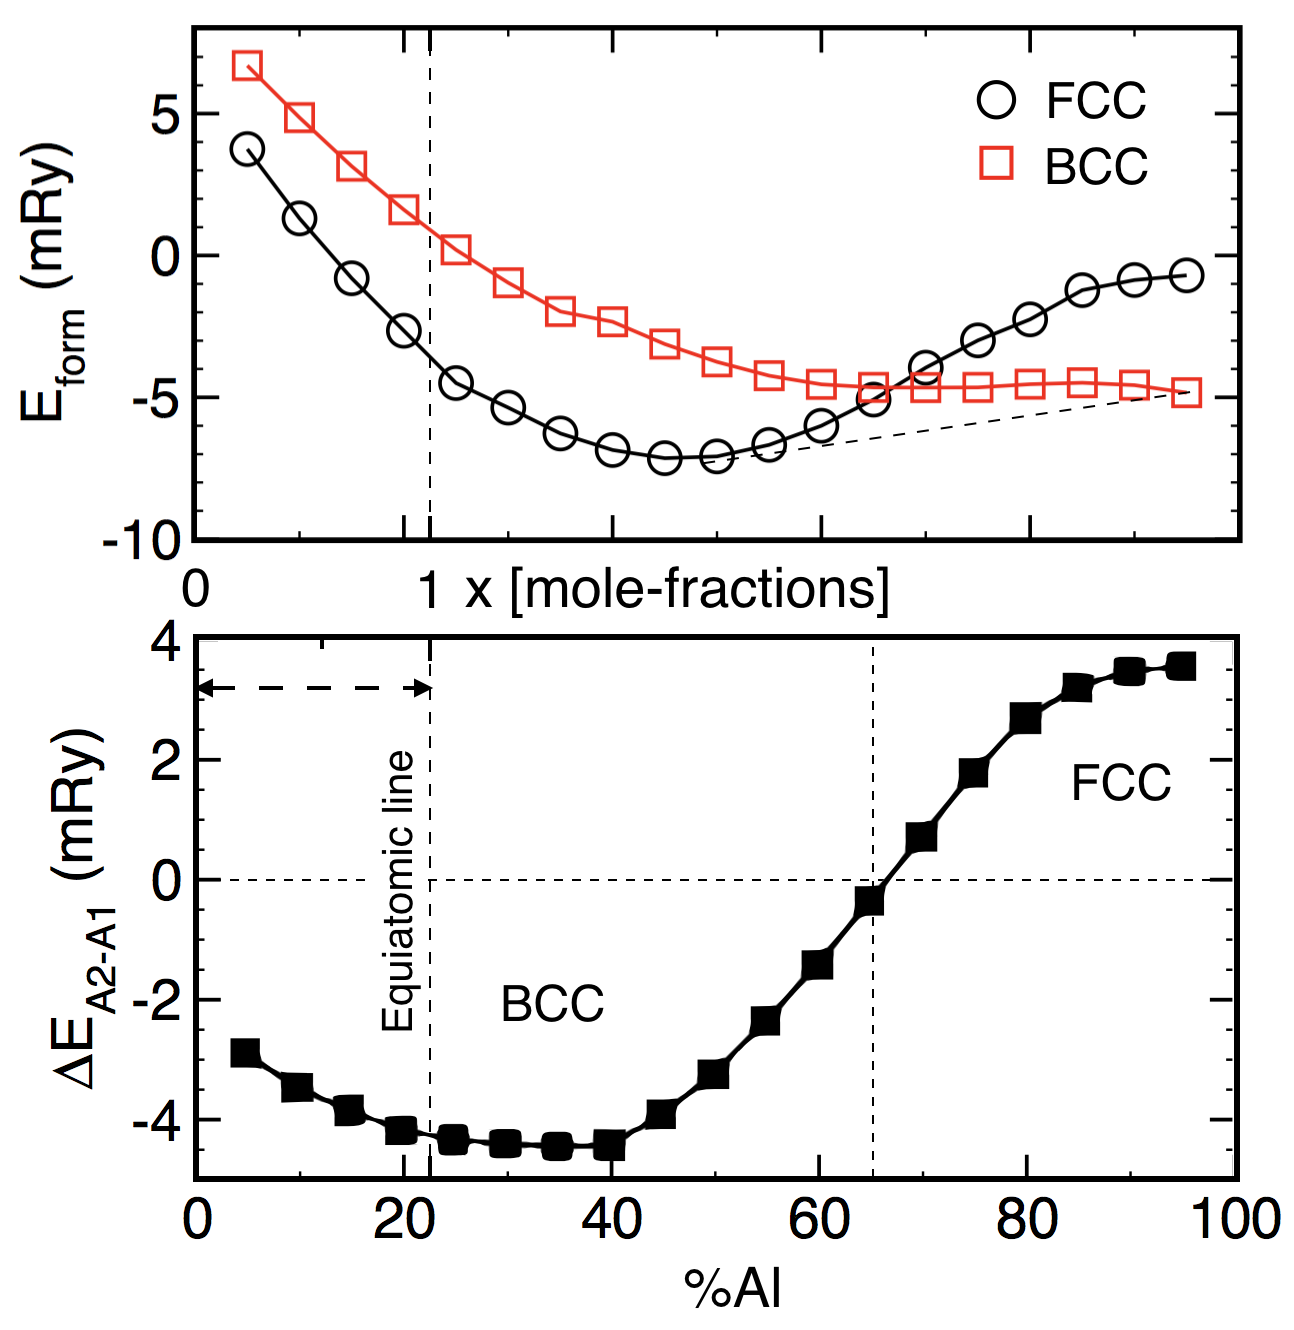
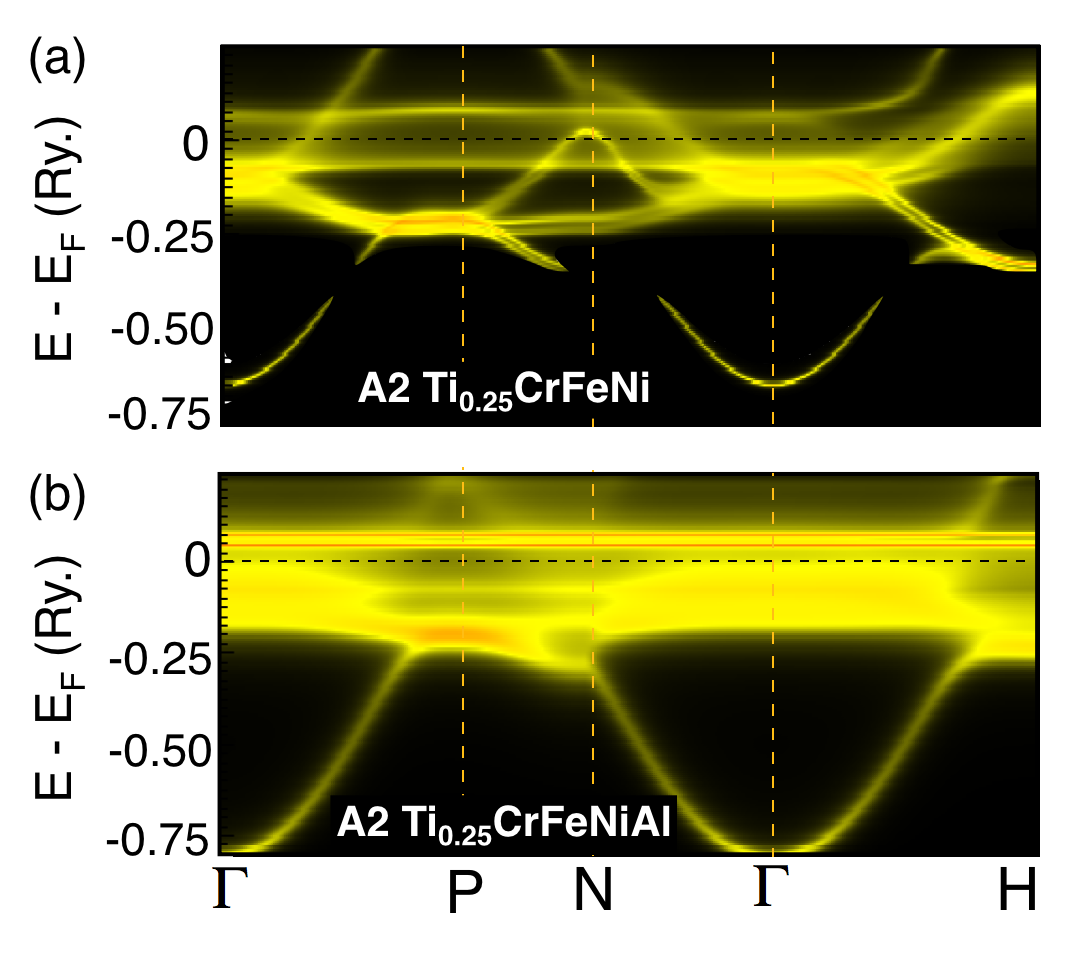
To understand the effects of chemical disorder by Al-doping, we calculate Bloch-spectral function (BSF) of BCC Ti0.25CrFeNiAlix using DFT based electronic-structure method for x=0,1 cases, see Fig. 2. The BSF is a generalization of order band structure when disorder is present [52, 53]. On adding Al to Ti0.25CrFeNi, the BSF is smeared out near the Fermi energy (EF) due to increased disorder effect. The BSF broadening can directly be related to the inverse of the electron mean free path [35]. Increased k-space smearing at EF indicates a decrease in electron mean-free path for Fig. 2(b) compared to Fig. 2(a) – the shift in dispersion is clearly visible at energies below EF. The Al doping enhances disorder and lowers bonding states [18], stabilizing the BCC phase, as also shown in Fig. 1. For near equiatomic HEA ( Al mole-fraction), the negative formation energy indicates the favorability for the mixing of alloying elements.
The starting point in our calculations is the high-temperature disorder phase, where entropy contribution mainly arises from the point entropies and disorder local moments (if any). The SRO contribution in completely random state (disorder phase) goes to zero as the configurational entropy is mainly dominated by Smix and Smag. The point entropy can be estimated by (, where with ) is a key factor for the formation of single-phase HEAs. Point entropy increases with increasing number of alloying components, which suppresses the formation of intermetallic phases [1, 4, 54], unless enthalpically dominated by favorable chemical interactions amongst pairs of atoms, which grows as . So, as gets larger, enthalpy () can win over entropy (). Empirically, literature suggests a threshold of for an operational definition of high-entropy alloy [55]. Here, the gas constant is and , where Avogadro’s number. For magnetic entropy, we use phenomenological approximation as previously used for paramagnetic Fe-based alloys [56, 57, 58] with non-integer magnetic moments.
| xAl | Entropy | ||||||||||
|---|---|---|---|---|---|---|---|---|---|---|---|
| Smix | Smag | STotal | |||||||||
| 0.25 | 1.40 | 0.22 | 1.62 | ||||||||
| 0.50 | 1.48 | 0.19 | 1.67 | ||||||||
| 0.75 | 1.51 | 0.17 | 1.68 | ||||||||
| 1.00 | 1.52 | 0.15 | 1.67 | ||||||||
While in BCC Ti0.25CrFeNiAlx is large, but the magnetic character of alloying elements (Cr/Ni/Fe) also suggests the possible contribution from magnetic entropy. For BCC Ti0.25CrFeNiAlx, we estimate the chemical entropy by and the magnetic entropy by in units of gas constant (R) [setting kB=1], here is the magnetic moment of element. The chemical, magnetic and total entropy contribution are tabulated in Table 1. Increasing Al content increases the chemical entropy, which saturates at equiatomic Al, whereas we notice slight decrease in the magnetic entropy as Fe losses its magnetic character with increases Al content.
To reveal the ordering in Ti0.25CrFeNiAlx and find out the plausible reasons for disagreement between experiments and CALPHAD, we chose four sets of alloys, i.e., , permitting a one-to-one comparison to experimental composition range of Liu et.al. [36]. As SRO is dictated mostly by the electronic-structure of the alloy, the origins of the observed ordering tendencies in Ti0.25CrFeNiAlx can be determined, i.e., all the competing effects (e.g., band-filling, Fermi-surface nesting, atomic size, and charge transfer) can be assessed [18, 33].
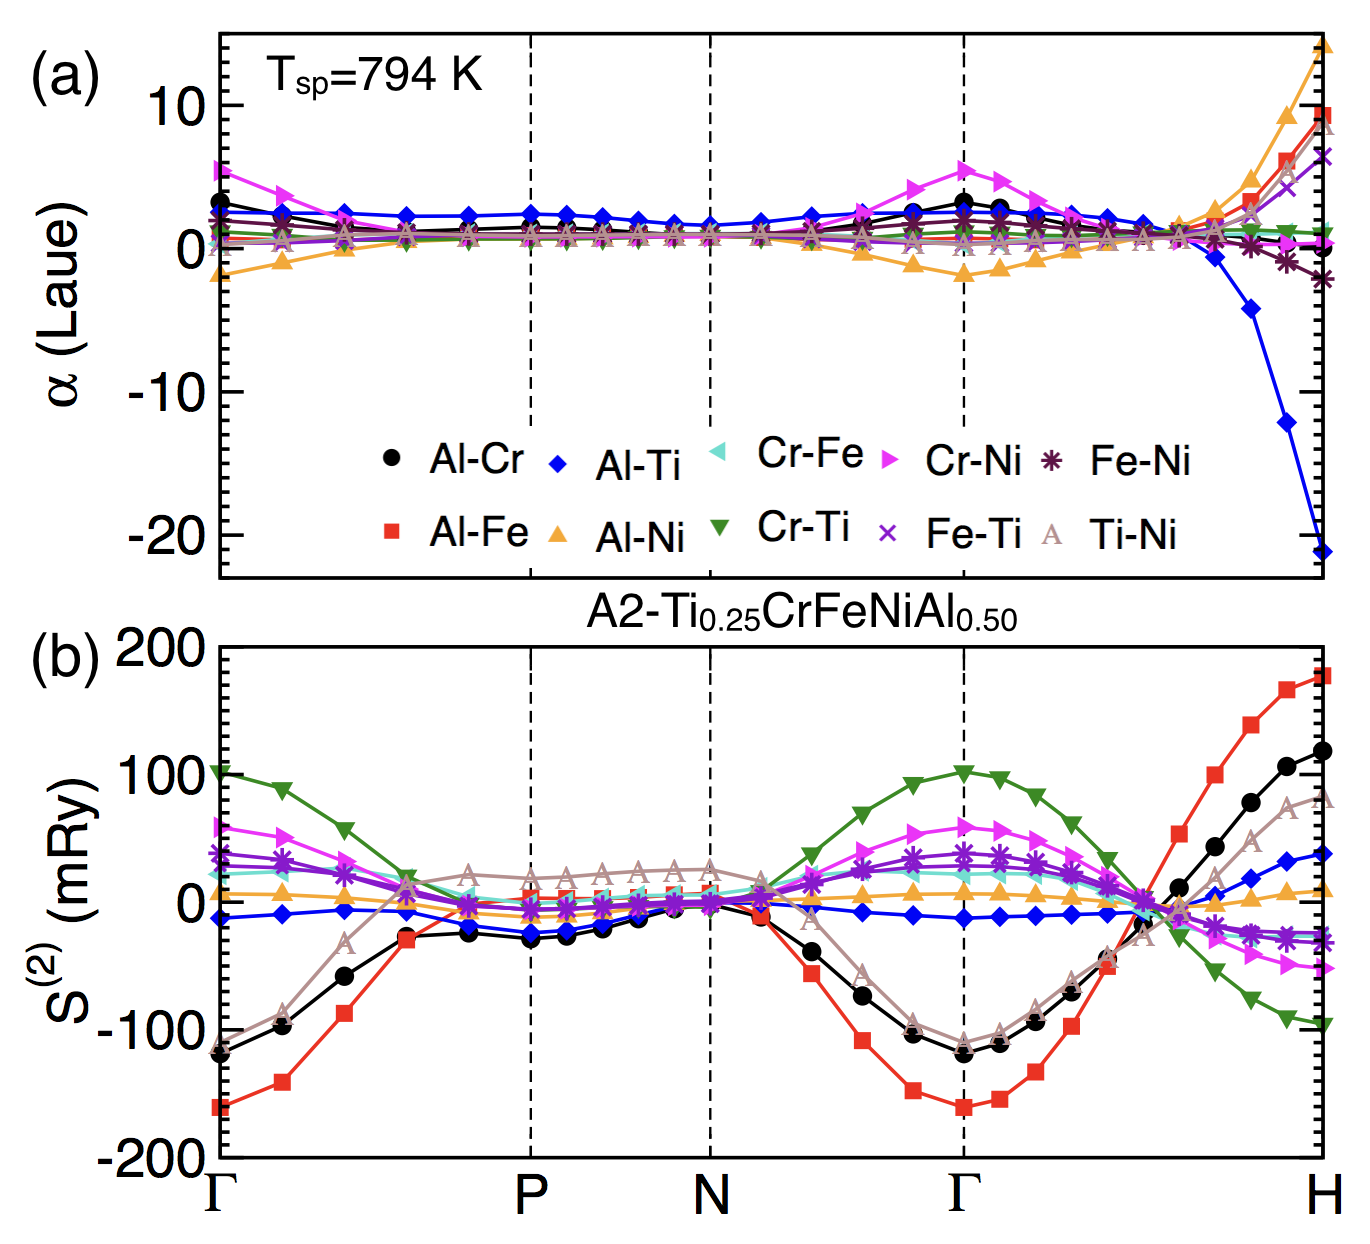
We exemplify SRO predictions and concentration-wave analysis on Ti0.25CrFeNiAl0.5. In Fig. 3, we plot the SRO and interchange energies S at 1.15 (794 K calculated). As vanishes at , i.e., the SRO diverges at , which indicates the B2-type (CsCl) ordering instability. At , has a dominant SRO peak for Al-Ni pair (followed by Al-Fe and Ti-Ni) in Fig. 3(a), whereas the instability in S(2) is driven by Al-Fe pairs (followed by Al-Cr) in Fig. 3(b). This odd (but correct) result occurs due the probability sum rule of , and its inverse-relation with S [16, 17, 18, 33, 35]. The instability at H in BCC-Ti0.25CrFeNiAl0.50 occurs when (at least) one of the eigenvalues of the correlation matrix is maximum, i.e., inverse of the corresponding pair-correlation component of the correlation matrix vanishes. The relative polarization of concentration waves is represented by the eigenvector corresponding to the vanishing eigenvalue of aforementioned correlation matrix in the Gibbs space [18, 48, 26, 59]. We extract the eigenvector corresponding to H and P for Ti0.25CrFeNiAl0.50 at to analyze the B2 and L21 type ordering. The eigenvectors at Tsp helps estimate the LRO parameters to solve the Eq. 3 for occupation probabilities [18].
Using disordered state information of elemental composition, structure factor, instability vector and eigenvector (at ), the concentration-wave (probability ) for BCC-Ti0.25CrFeNiAl0.50 can be written as (using Ni as the ‘host’ arbitrarily):
| (4) |
where is the LRO parameter for B2-order, which is used for occupation probability determination for B2 sublattices at , i.e., = or =. With sum rules (), is obtained.
Upon ordering the A2 (BCC) lattice splits into two simple-cubic sublattices with ordering vector. Here, the maximum possible LRO corresponds to Al at sublattice , i.e., occupation probability of Al vanishes (), and Eq. 4 (right side for Al) simplifies to . As the alloy cannot have negative probabilities, the maximum LRO parameter is and corresponds to symmetry-breaking of at . The occupation probabilities at sub-lattices and calculated using the maximum allowable LRO are (0.26600, 0.27208, 0.20962, 0.08089, 0.17141) and (0.26592, 0.32838, 0.01911, 0.38659), respectively. The calculated occupations probabilities from first-principles SRO theory shows that in symmetry-breaking process, i.e., on ordering Al breaks the symmetry of BCC lattice and preferentially occupies the cube corner. The Al probability vanishes at one of sublattice, i.e., at . This way Al0.50CrFeNiTi0.25 partially orders into B2 superstructure, where partially-ordered B2 phase has lower energy than A2 phase, where the energy gain from partial ordering to this state is given by the energy difference of BCC and partially-ordered B2 (site probabilities given by Eq. 4), i.e., mRy. The partially-ordered energetics is very sensitive to order parameter and sublattice occupations. Thus, care must be taken in calculating occupation probabilities such that sum rules are obeyed. The B2 phase is stabilized with respect to A2 phase using similar calculations for and , yielding of -2.98 mRy and -8.33 mRy, respectively.
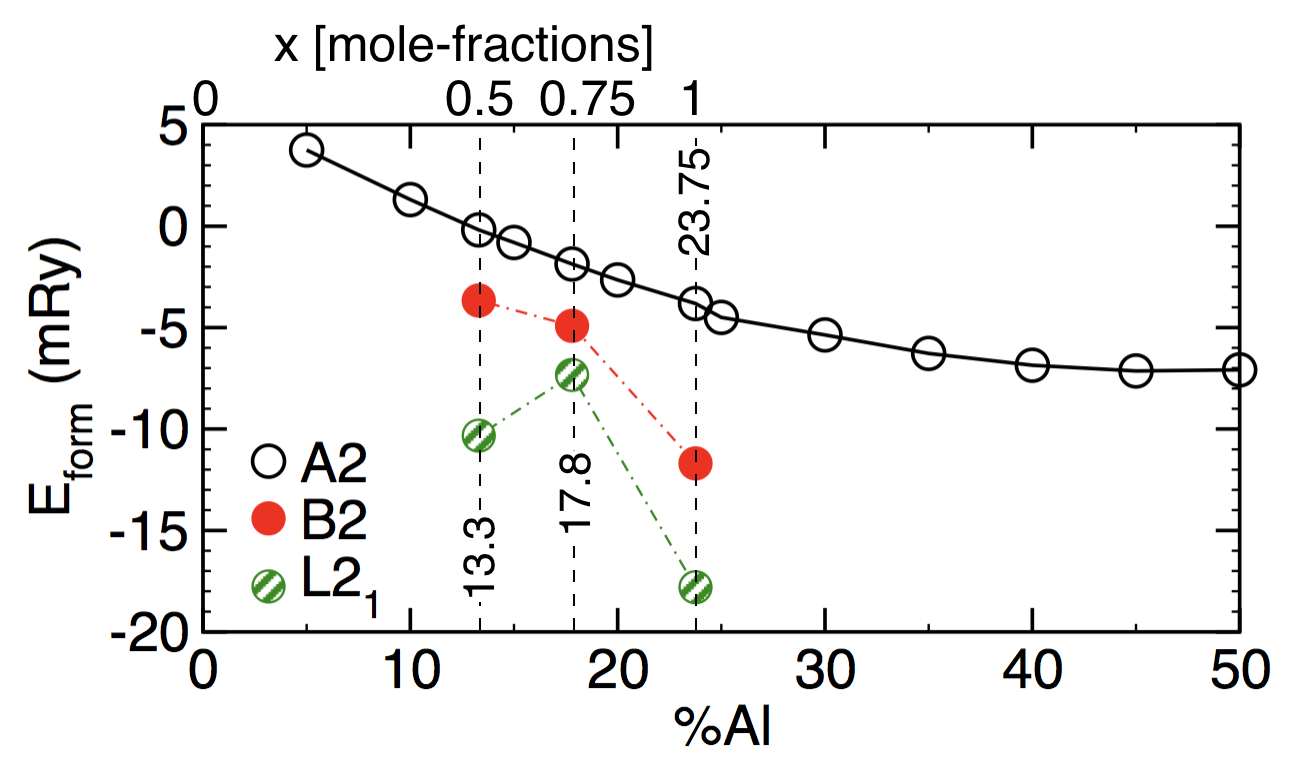
As already discussed, the A2 phase can order into different lower-symmetry structures in going from high-temperature (disorder) phase to lower-temperature (partially-ordered) phases. At first, on lowering temperature, the A2 lattice shows regions of B2 superstructure by lowering symmetry along . Upon further lowering the temperature, symmetry can break via (secondary ordering) and may order into L superstructure depending on the material characteristics. Relative to A2, we show Eform for partially-ordered B2 and L phases in Fig. 4, where site occupations for the partially-ordered phase are obtained from the SRO+CW approach, as discussed in Eq. 4& 5 (also see Section S1 of supplement). As can be seen in Fig. 4, there is significant gain in energy from A2B2 at (23.75%Al), where B2 has still has significant (temperature-dependent) point entropy given by the occupation variables of the partially-ordered B2 state.
The A2-to-B2 (2nd-order) transition is defined by one LRO parameter, while L21 requires two: and . Our linear-response predicts SRO, which yields correct second-order transition, which often dictates expected first-order phase-transitions. However, first-order transitions have a discontinuous versus T that requires ab-inito thermodynamic simulation to predict it directly. As the L21 phase occurs due to secondary-ordering, a qualitative prediction can be made if we deliberately break the symmetry of Ti0.25CrFeniAl0.50 by ordering formed by wavevectors (B2 ordering) and (Heusler or L21 ordering) using the eigenvectors estimated from the primary transition, i.e., in A2-B2 at . is then represented by a concentration-wave with vector site probabilities
| (5) |
The last term in Eq. 5 reflects the additional term over B2 in Eq. 4, which is an enriching minority components along for L21 ordering.
It is convenient to describe A2 lattice with L21 ordering with the help of the four interpenetrating A1 sublattices: , , and , with twice the A2 cubic lattice parameter. The maximum LRO and correspond to the sublattice and for which ‘Al’ site probability vanishes first, i.e., and and at . The resulting LRO parameters are and for sub-lattices and , respectively, at (structural files for A1/A2/B2/L21 used for total energy calculations along with computed occupation probabilities (Table S1) and lattice-constants (Table S2) are provided in the supplement Section S2).
For non-stoichiometric cases of Ti0.25CrFeNiAlx, SRO predicts partially-ordered B2 and L21 state (see compositions inTable S1). The negative energy gain at x=0.50 of partially ordered B2 and L21 phases with respect to A2 phase is mRy and mRy, respectively. Similar to x=0.50, Ti0.25CrFeNiAlx show thermodynamically stable B2 and L21 phases with respect to A2 at x =0.75 and x= 1.0. The ordering energy difference for B2 and L21 phases with respect to disorder phase at x=0.75 and x=1.0 is ( mRy and mRy for ) and ( mRy and mRy), respectively. The estimated spinodal temperature for Ti0.25CrFeNiAlx is K at .
The instability in alloy occur at the spinodal temperature above which mixture remains homogeneous. For homogeneous fluctuations from linear-response approach, we can write the change of free-energy in terms of concentration fluctuations and pair-correlation function evaluated at the point of instability. The estimated change in energy, , can be written as [17, 18]
| (6) |
where X is superlattice order with instability in and associated concentration changes, . This ‘back-of-the-envelope’ calculation uses the pair-interchange energies to estimate directly the energy gain for particular ordering without additional calculations. In Table 2, the B2 energy gain estimated from SRO, () for , shows the same trend as the direct DFT calculations. Importantly, SRO estimate gives robust trends without additional calculations. The direct evaluation of the formation energies, , of the partially LRO state relative to the disordered state establish order-disorder transition temperatures, for example, in ordering systems [60, 61] and slightly more complicated in segregating systems [62].
| (mRy) | |||||||||
|---|---|---|---|---|---|---|---|---|---|
| 0.50 | -5.03 | -3.48 | -3.26 | ||||||
| 0.75 | -4.23 | -2.98 | -2.70 | ||||||
| 1.00 | -9.43 | -8.33 | -7.88 | ||||||
The difference between direct DFT calculations and that from the SRO is easily understood. Upon breaking symmetry with a LRO parameter into B2, the site charges and dispersion change directly responding to the new symmetry and changes in electronic charge density, whereas using the SRO from linear-response, the dispersion is fixed to the random alloy – hence, it is computational less expensive and provide fast estimate – albeit a good one, especially for trends. One may consider using this for fast evaluation of HEA before spending time on more accurate calculations. The SRO can be viewed in Gibbs’ composition space (a Barycentric coordinate system) and the SRO can be expanded like in finite-element codes, permitting scans of composition space with but a few compositions initially tested.
Our calculations of Ti0.25CrFeNiAlx predict stable B2 (Al-poor region) and B2+L21 (Al-rich region), whereas experiments did not find any signature of L21 ordering. In contrast, the CALPHAD phase diagram suggests A2+B2+L21 phases, i.e., a mixed ordering transformation during slow cooling process [36]. In some cases, these LRO can happen at much lower temperatures as the kinetics (diffusion) is limited and alloy does not transform due to larger energy barrier, unless assisted some way, such as by shear. This has been observed in FCC to HCP transitions at very low temperature for CrMnFeCo [63]. It could also happen that SRO is simply frozen (quenched disorder), where experiments from high-T samples are characterized at room temperature [64].
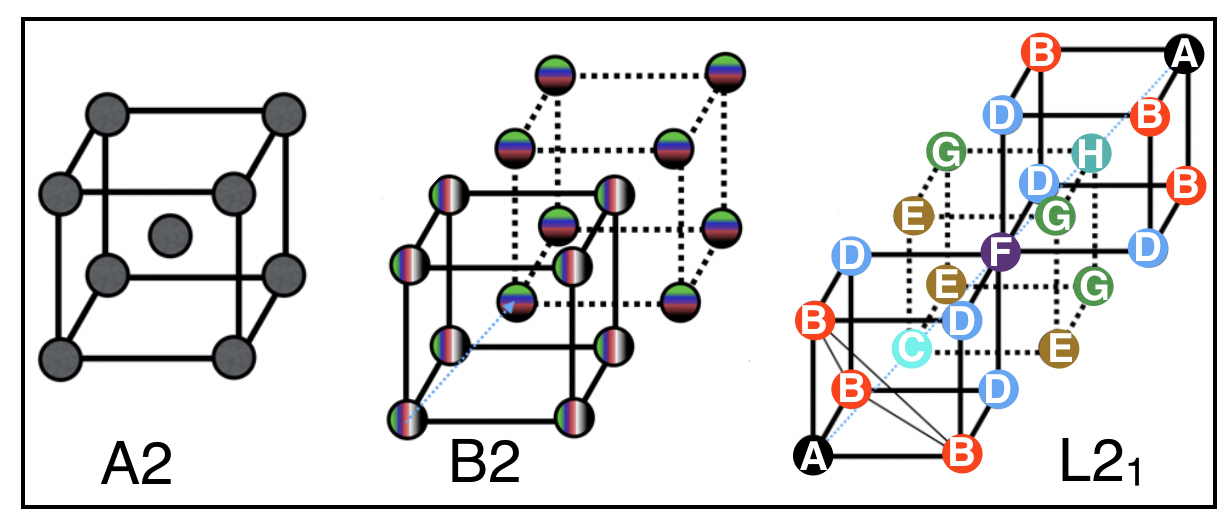
In Fig. 5, we show that there are 8 possible distinct sites in L21 superstructure that can be populated without destroying cubic symmetry, i.e., 2/3 rotation along , and mirror symmetry along . An HEA with more than 8-components, even with stoichiometric compositions, cannot be populated with small-cell cubic order. Thus, we can infer from Fig. 5 that L21 order in quinary systems can exist. So, HEAs often exhibit a series of ordering transitions with one or more partially-ordered phases, and it ultimately reaches to fully-ordered states (if stoichiometric). In general, upon cooling, A2 goes to B2-type order by lowering its symmetry along , e.g., in a binary A2 to B2 with corner (center) sites are perfectly ordered. In a HEA, as temperature is lowered, the B2 phase can only be partially-ordered, then B2 phase breaks symmetry along to a Heusler-type superstructures, e.g., DO3 (AB3) or L21 (ABC2), typically partially-ordered.
For clarity, we note that linear-response can simultaneously find all ordering wavevectors (k) associated with specific underlying Bravais lattice (e.g., A1/A2/A3), i.e., there is no restriction on SRO or LRO modes. All possible arbitrary length correlations, which is impossible in real-space methods, indeed can provide full real-space details when inverse Fourier transformed [33]. Notably, not all the “incipient LRO” leads to LRO states, e.g., a superstructure usually forms at certain stoichiometric compositions. Therefore, the degree of LRO decreases as the compositions deviates from stoichiometry. This deviation from the stoichiometry makes the transformation kinetics slower, which may need thousands of hours of aging time [64], but SRO in the high-T disordered phase always can occur. Considering our work is based on full electronic structure (chemical and magnetic), we are also able to capture the effects of hybridization, Fermi-surface, band-filling, Kohn anomalies, etc., on the SRO and directly “fingerprint” the origin for ordering [18, 33, 34, 35].
4 Conclusion
For arbitrary HEAs, we presented a concentration-wave (CW) analysis of results from electronic-structure-based thermodynamic linear-response theory (SRO) for a fast assessment of all possible low-temperature competing partially-ordered states. The SRO, arising from the electronic-structure (dispersion and energetics) of the disordered solid-solution at specific concentrations, gives detailed information on the unstable ordering modes inherent in the HEA, as well as their electronic origins. A CW analysis directly identifies partially- or fully-ordered unit cells for competing states as well as their sub-lattice occupations. We can then use these identified partially-ordered unit cells in a direct DFT calculation to obtain quantitative results for energy difference between all competing states (or relative to the fully-disordered solid-solution with a given underlying Bravais lattice. The estimate of energy gain for each structure with the relevant competing states, identified from SRO, can also be done from the SRO parameters using a ‘back-of-the-envelope’ estimate, which provides a good qualitative trend.
The DFT+SRO assures the necessary symmetry condition for the thermodynamic stability of the ordered superstructure, and SRO+CW predicts the atomic arrangement of the partially ordered or ordered superstructure. The proposed analysis method also rejects any a priori assumptions on the crystal structure of ordered phases. We exemplified the stability, electronic-dispersion, and the Warren-Cowley SRO parameter for the case of the HEA Ti0.25CrFeNiAlx. Our direct DFT calculations of total-energy shows that increasing Al stabilizes BCC phase, and FCC phase becomes stable above above %65-Al. The DFT-based SRO calculations with a concentration-wave analysis predicts competing B2 and L21 phases in the Al-rich region, which is in good agreement with CALPHAD study of Liu et.al. [36] that has competing B2 and L21 phases in the Al rich-region (0.75 to 1 mole fraction). The uniqueness of our approach lies in the fact that it provides fast, electronic-structure-based assessment of thermodynamic stability and ordering in multi-principal-element alloys, in particular without need for large unit-cell to model disorder, which will accelerate the design of new systems.
5 Acknowledgements
The work was supported by the U.S. Department of Energy (DOE), Office of Science, Basic Energy Sciences, Materials Science and Engineering Division. The research was performed at Iowa State University and the Ames Laboratory, which is operated for the U.S. DOE by Iowa State University under contract No. DE-AC02-07CH11358. AA acknowledges funding from the National Center for Photovoltaic Research and Education (NCPRE) funded by Ministry of New Renewable Energy (MNRE), Government of India and IIT Bombay.
References
- Yeh et al. [2004] J.-W. Yeh, S.-K. Chen, S.-J. Lin, J.-Y. Gan, T.-S. Chin, T.-T. Shun, C.-H. Tsau and S.-Y. Chang, Advanced Engineering Materials, 2004, 6, 299–303.
- Miracle and Senkov [2017] D. Miracle and O. Senkov, Acta Materialia, 2017, 122, 448 – 511.
- K. H. Huang [1996] J. W. Y. K. H. Huang, MSc thesis, Hsinchu National Tsing Hua University, 1996.
- Yeh [2006] J. W. Yeh, Annales de Chimie Science des Materiaux, 2006, 31, 633–648.
- Ogata et al. [2008] S. Ogata, Y. Umeno and M. Kohyama, Modelling and Simulation in Materials Science and Engineering, 2008, 17, 013001.
- Otto et al. [2013] F. Otto, A. DlouhÃœ, C. Somsen, H. Bei, G. Eggeler and E. George, Acta Materialia, 2013, 61, 5743 – 5755.
- D.B.Miracle [2019] D.B.Miracle, Nature Communications, 2019, 10, 1805.
- George et al. [2019] E. P. George, D. Raabe and R. O. Ritchie, Nature Reviews Materials, 2019, 4, 515–534.
- Ikeda et al. [2019] Y. Ikeda, B. Grabowski and F. K̦rmann, Materials Characterization, 2019, 147, 464 Р511.
- B.S. Murty [2014] S. R. B.S. Murty, J.-W. Yeh, High-entropy Alloys, Elsevier, 2014.
- Gao et al. [2016] M. Gao, J.-W. Yeh, P. Liaw and Y. Zhang, High-entropy Alloys: Fundamentals and Applications, Springer Publishing, 2016.
- Gao [2015] M. C. Gao, JOM, 2015, 67, 2251–2253.
- Gyorffy and Stocks [1983] B. L. Gyorffy and G. M. Stocks, Phys. Rev. Lett., 1983, 50, 374–377.
- Gyorffy et al. [1989] B. Gyorffy, D. D. Johnson, F. J. Pinski, D. M. Nicholson and G. M. Stocks, Alloy Phase Stability, Springer, Netherlands, 1989, ch. 27, pp. 421–468.
- Staunton et al. [1990] J. B. Staunton, D. D. Johnson and F. J. Pinski, Phys. Rev. Lett., 1990, 65, 1259–1262.
- Althoff et al. [1995] J. D. Althoff, D. D. Johnson and F. J. Pinski, Phys. Rev. Lett., 1995, 74, 138–141.
- Johnson [2012] D. D. Johnson, Characterization of Materials, Wiley, New York, 2012, ch. 13, pp. 1–31.
- Singh et al. [2015] P. Singh, A. V. Smirnov and D. D. Johnson, Phys. Rev. B, 2015, 91, 224204.
- Khan et al. [2016] S. N. Khan, J. B. Staunton and G. M. Stocks, Phys. Rev. B, 2016, 93, 054206.
- Krivoglaz [1969] M. Krivoglaz, Theory of X-ray and Thermal-Neutron Scattering by Real Crystals, Plenum Press, 1969.
- Clapp and Moss [1966] P. C. Clapp and S. C. Moss, Phys. Rev., 1966, 142, 418–427.
- Ducastelle [1991] F. Ducastelle, Order and phase stability in alloys, North Holland, 1991.
- Khachaturyan [1972] A. Khachaturyan, Soviet Phys. JETP, 1972, 36, 753–760.
- Khachaturian [1983] A. G. Khachaturian, Theory of Structural Transformation in Solids, Wiley, 1983.
- Fontaine [1975] D. D. Fontaine, Acta Metallurgica, 1975, 23, 553 – 571.
- Fontaine [1994] D. D. Fontaine, D. D. Fontaine, Academic Press, 1994, vol. 47, pp. 33 – 176.
- Q.-J. Li [2019] E. M. Q.-J. Li, H. Sheng, Phys. Rev. B, 2019, 10, 3563.
- Sato and Toth [1962] H. Sato and R. S. Toth, Phys. Rev., 1962, 127, 469–484.
- Moss [1969] S. C. Moss, Phys. Rev. Lett., 1969, 22, 1108–1111.
- Reinhard et al. [1990] L. Reinhard, B. Schönfeld, G. Kostorz and W. Bührer, Phys. Rev. B, 1990, 41, 1727–1734.
- Johnson et al. [2000] D. D. Johnson, A. V. Smirnov, J. B. Staunton, F. J. Pinski and W. A. Shelton, Phys. Rev. B, 2000, 62, R11917–R11920.
- Zarkevich and Johnson [2004] N. A. Zarkevich and D. D. Johnson, Phys. Rev. Lett., 2004, 92, 255702.
- Singh et al. [2018] P. Singh, A. V. Smirnov and D. D. Johnson, Phys. Rev. Materials, 2018, 2, 055004.
- Singh et al. [2018] P. Singh, A. Sharma, A. Smirnov, M. Diallo, P. K. Ray, G. Balasubramanian and D. D. Johnson, npj Computational Materials, 2018, 4, 16.
- Singh et al. [2019] P. Singh, A. Marshal, A. V. Smirnov, A. Sharma, G. Balasubramanian, K. G. Pradeep and D. D. Johnson, Phys. Rev. Materials, 2019, 3, 075002.
- Liu et al. [2015] S. Liu, M. Gao, P. Liaw and Y. Zhang, Journal of Alloys and Compounds, 2015, 619, 610 – 615.
- Martin [1968] P. C. Martin, Measurements and Correlation Functions, Gordon and Breach, 1968.
- Johnson et al. [1986] D. D. Johnson, D. M. Nicholson, F. J. Pinski, B. L. Gyorffy and G. M. Stocks, Phys. Rev. Lett., 1986, 56, 2088–2091.
- Johnson and Pinski [1993] D. D. Johnson and F. J. Pinski, Phys. Rev. B, 1993, 48, 11553–11560.
- [40] S. N. K. D. D. Johnson, A.V. Smirnov, MECCA: Multiple-scattering Electronic-structure Calculations for Complex Alloys).
- Lehtola et al. [2018] S. Lehtola, C. Steigemann, M. J. Oliveira and M. A. Marques, SoftwareX, 2018, 7, 1 – 5.
- Alam and Johnson [2012] A. Alam and D. D. Johnson, Phys. Rev. B, 2012, 85, 144202.
- Johnson et al. [1985] D. D. Johnson, F. J. Pinski and G. M. Stocks, Journal of Applied Physics, 1985, 57, 3018–3020.
- Monkhorst and Pack [1976] H. J. Monkhorst and J. D. Pack, Phys. Rev. B, 1976, 13, 5188–5192.
- Staunton et al. [1994] J. B. Staunton, D. D. Johnson and F. J. Pinski, Phys. Rev. B, 1994, 50, 1450–1472.
- Sharma et al. [2016] A. Sharma, P. Singh, D. D. Johnson, P. K. Liaw and G. Balasubramanian, Scientific Reports, 2016, 6, 31028.
- Pinski et al. [1991] F. J. Pinski, B. Ginatempo, D. D. Johnson, J. B. Staunton, G. M. Stocks and B. L. Gyorffy, Phys. Rev. Lett., 1991, 66, 766–769.
- Althoff et al. [1996] J. D. Althoff, D. D. Johnson, F. J. Pinski and J. B. Staunton, Phys. Rev. B, 1996, 53, 10610–10625.
- Evans [1979] R. Evans, Advances in Physics, 1979, 28, 143–200.
- Hettler et al. [1998] M. H. Hettler, A. N. Tahvildar-Zadeh, M. Jarrell, T. Pruschke and H. R. Krishnamurthy, Phys. Rev. B, 1998, 58, R7475–R7479.
- Tan and Johnson [2011] T. L. Tan and D. D. Johnson, Phys. Rev. B, 2011, 83, 144427.
- Faulkner and Stocks [1980] J. S. Faulkner and G. M. Stocks, Phys. Rev. B, 1980, 21, 3222–3244.
- Faulkner [1982] J. Faulkner, Progress in Materials Science, 1982, 27, 1 – 187.
- Guo et al. [2011] S. Guo, C. Ng, J. Lu and C. T. Liu, Journal of Applied Physics, 2011, 109, 103505.
- Miracle et al. [2014] D. Miracle, J. Miller, O. Senkov, C. Woodward, M. Uchic and J. Tiley, Entropy, 2014, 16, 494 – 525.
- Tian et al. [2013] F. Tian, L. Delczeg, N. Chen, L. K. Varga, J. Shen and L. Vitos, Phys. Rev. B, 2013, 88, 085128.
- Vitos et al. [2006] L. Vitos, P. A. Korzhavyi and B. Johansson, Phys. Rev. Lett., 2006, 96, 117210.
- Vitos et al. [2006] L. Vitos, J.-O. Nilsson and B. Johansson, Acta Materialia, 2006, 54, 3821 – 3826.
- D. Badalyan [1969] A. K. D. Badalyan, A.G. Khachaturyan, Soy. Phys. Crystallogr., 1969, 14, 333.
- Alam et al. [2010] A. Alam, B. Kraczek and D. D. Johnson, Phys. Rev. B, 2010, 82, 024435.
- Zarkevich and Johnson [2019] N. A. Zarkevich and D. D. Johnson, Journal of Alloys and Compounds, 2019, 802, 712 – 722.
- Zarkevich et al. [2007] N. A. Zarkevich, T. L. Tan and D. D. Johnson, Phys. Rev. B, 2007, 75, 104203.
- He et al. [2019] Z. He, N. Jia, D. Ma, H. Yan, Z. Li and D. Raabe, Materials Science and Engineering: A, 2019, 759, 437 – 447.
- Marucco [1994] A. Marucco, Materials Science and Engineering: A, 1994, 189, 267 – 276.